Archives
BUA 100 Quiz
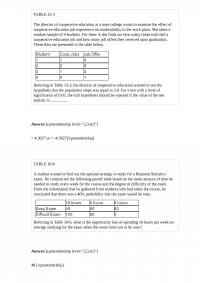
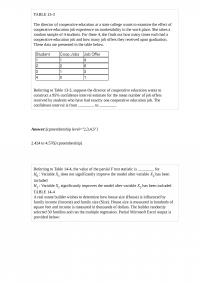
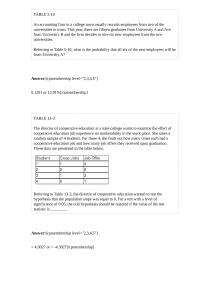
TABLE 13-3 The director of cooperative education at a state college wants to examine the effect of cooperative education job experience on marketability in the work place. She takes a random sample of 4 students. For these 4, she finds […]
BUA 110
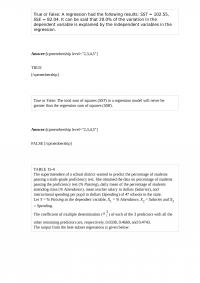
True or False: A regression had the following results: SST = 102.55, SSE = 82.04. It can be said that 20.0% of the variation in the dependent variable is explained by the independent variables in the regression. True or False: […]
BUA 132
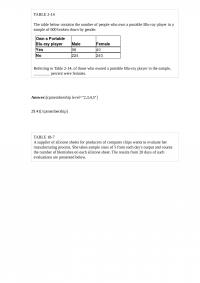
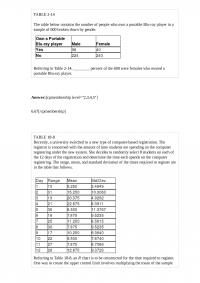
TABLE 2-14 The table below contains the number of people who own a portable Blu-ray player in a sample of 600 broken down by gender. Referring to Table 2-14, of those who owned a portable Blu-ray player in the sample, […]
BUA 150
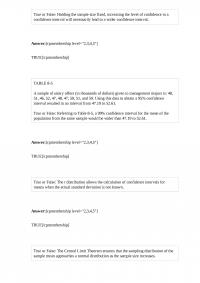
True or False: Holding the sample size fixed, increasing the level of confidence in a confidence interval will necessarily lead to a wider confidence interval. TABLE 8-5 A sample of salary offers (in thousands of dollars) given to management majors […]
BUA 179
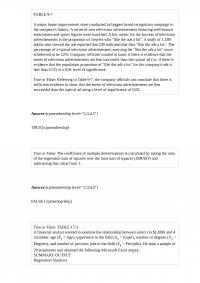
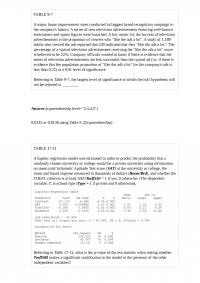
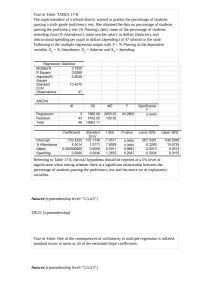
TABLE 9-7 A major home improvement store conducted its biggest brand recognition campaign in the company’s history. A series of new television advertisements featuring well-known entertainers and sports figures were launched. A key metric for the success of television advertisements […]
BUA 189 Midterm 2
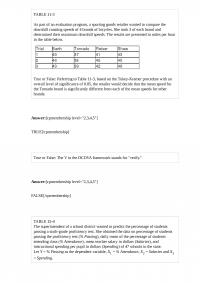
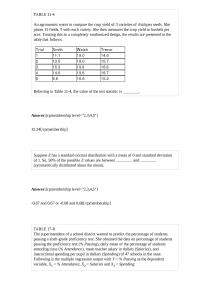
TABLE 11-3 As part of an evaluation program, a sporting goods retailer wanted to compare the downhill coasting speeds of 4 brands of bicycles. She took 3 of each brand and determined their maximum downhill speeds. The results are presented […]
BUA 209 Quiz 3
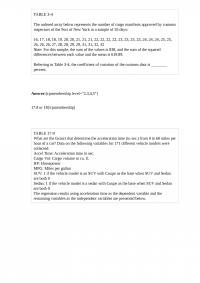
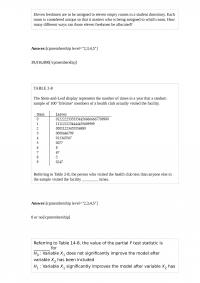
TABLE 3-4 The ordered array below represents the number of cargo manifests approved by customs inspectors of the Port of New York in a sample of 35 days: 16, 17, 18, 18, 19, 20, 20, 21, 21, 21, 22, 22, […]
BUA 240 Midterm 2 The
The Commissioner of Health in New York State wanted to study malpractice litigation in New York. A sample of 31 thousand medical records was drawn from a population of 2.7 million patients who were discharged during 2010. The proportion of […]
BUA 268 Test 2
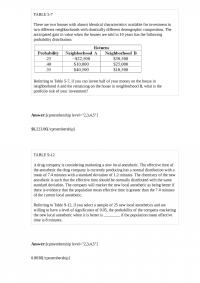
TABLE 5-7 There are two houses with almost identical characteristics available for investment in two different neighborhoods with drastically different demographic composition. The anticipated gain in value when the houses are sold in 10 years has the following probability distribution: […]
BUA 290
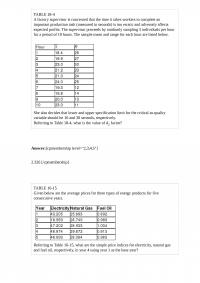
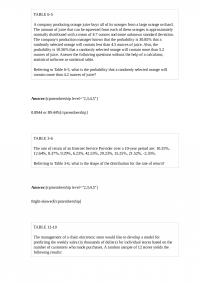
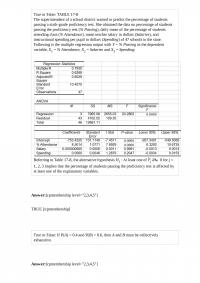
TABLE 8-9 A university wanted to find out the percentage of students who felt comfortable reporting cheating by their fellow students. A survey of 2,800 students was conducted and the students were asked if they felt comfortable reporting cheating by […]
BUA 345 Quiz
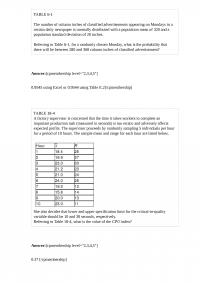
TABLE 18-4 A factory supervisor is concerned that the time it takes workers to complete an important production task (measured in seconds) is too erratic and adversely affects expected profits. The supervisor proceeds by randomly sampling 5 individuals per hour […]

BUA 439 Quiz 3
TABLE 16-13 Given below is the monthly time-series data for U.S. retail sales of building materials over a specific year. The results of the linear trend, quadratic trend, exponential trend, first-order autoregressive, second-order autoregressive and third-order autoregressive model are presented […]
BUA 522 Test 2 TABLE 32The data
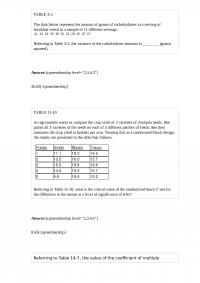
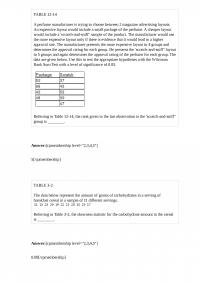
TABLE 3-2 The data below represent the amount of grams of carbohydrates in a serving of breakfast cereal in a sample of 11 different servings. Referring to Table 3-2, the variance of the carbohydrate amounts is ________ (grams squared). TABLE […]
BUA 548 Quiz 1
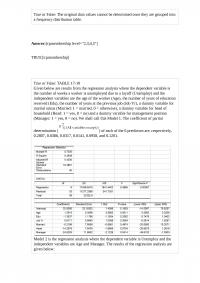
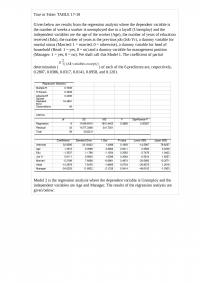
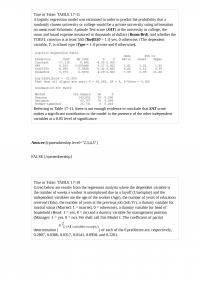
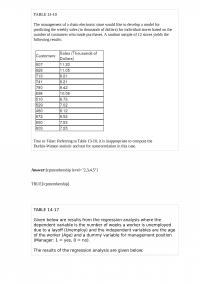
True or False: The original data values cannot be determined once they are grouped into a frequency distribution table. True or False: TABLE 17-10 Given below are results from the regression analysis where the dependent variable is the number of […]
BUA 551
TABLE 9-7 A major home improvement store conducted its biggest brand recognition campaign in the company’s history. A series of new television advertisements featuring well-known entertainers and sports figures were launched. A key metric for the success of television advertisements […]
BUA 554
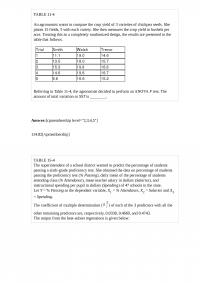
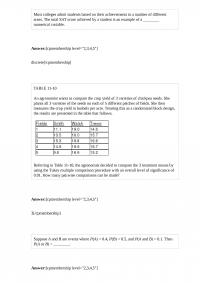
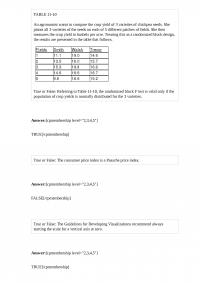
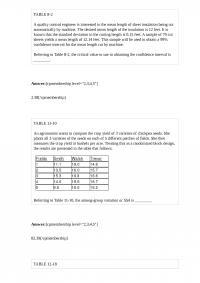
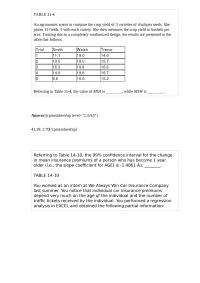
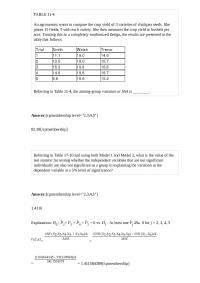
TABLE 11-4 An agronomist wants to compare the crop yield of 3 varieties of chickpea seeds. She plants 15 fields, 5 with each variety. She then measures the crop yield in bushels per acre. Treating this as a completely randomized […]
BUA 581 Test 1
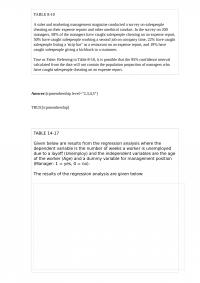
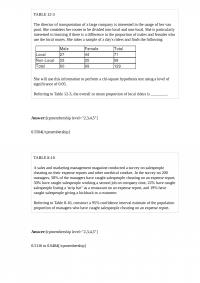
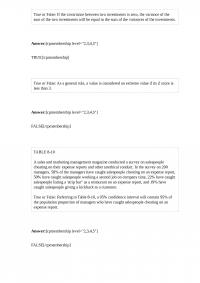
TABLE 8-10 A sales and marketing management magazine conducted a survey on salespeople cheating on their expense reports and other unethical conduct. In the survey on 200 managers, 58% of the managers have caught salespeople cheating on an expense report, […]
BUA 665 Quiz 3
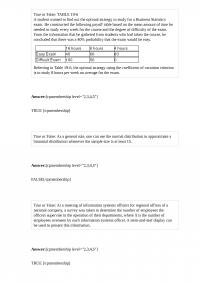
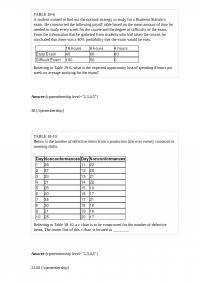
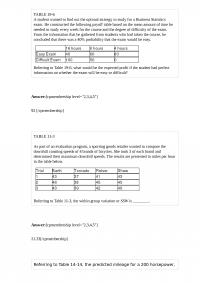
True or False: TABLE 19-6 A student wanted to find out the optimal strategy to study for a Business Statistics exam. He constructed the following payoff table based on the mean amount of time he needed to study every week […]
BUA 697 Midterm 1
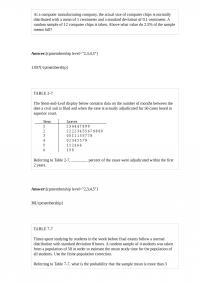
At a computer manufacturing company, the actual size of computer chips is normally distributed with a mean of 1 centimeter and a standard deviation of 0.1 centimeter. A random sample of 12 computer chips is taken. What is the probability […]
BUA 706 Homework
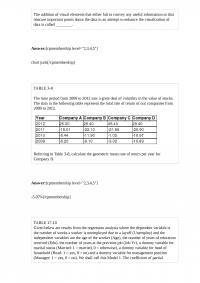
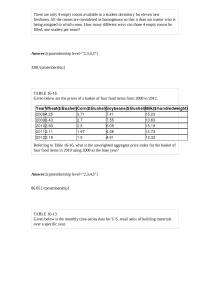
The addition of visual elements that either fail to convey any useful information or that obscure important points about the data in an attempt to enhance the visualization of data is called ________. TABLE 3-8 The time period from 2009 […]
BUA 752 Quiz 3
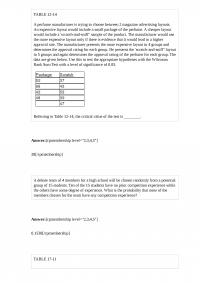
TABLE 12-14 A perfume manufacturer is trying to choose between 2 magazine advertising layouts. An expensive layout would include a small package of the perfume. A cheaper layout would include a ‘scratch-and-sniff” sample of the product. The manufacturer would use […]
BUA 781 Homework
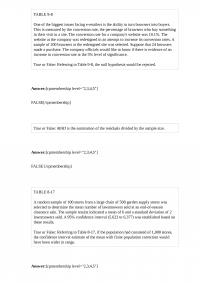
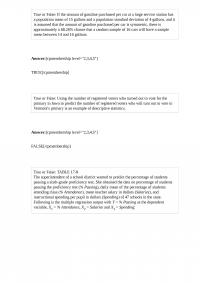
True or False: Percentage polygons are plotted at the boundaries of the class groupings. True or False: When participants are allowed to self-select into the sample, you have a nonprobability sample. Answer: TRUE True or False: In trying to construct […]
BUA 805
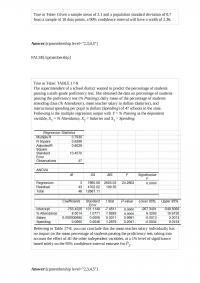
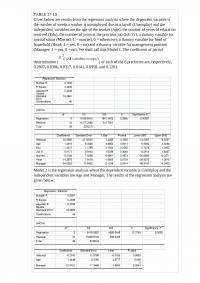
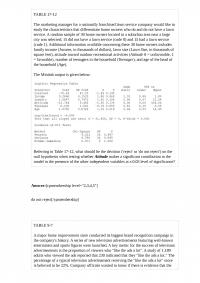
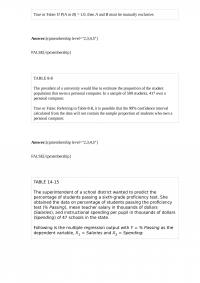
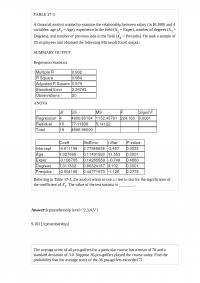
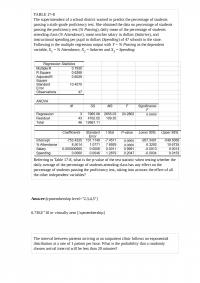
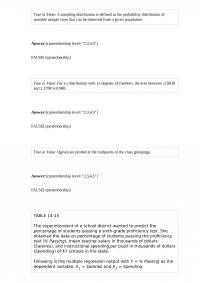
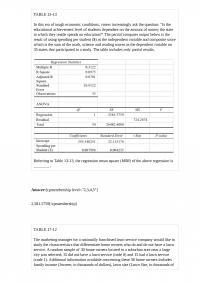
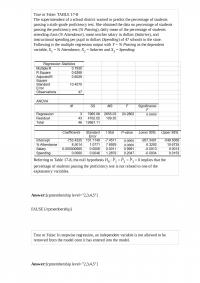
Referring to Table 14-15, predict the percentage of students passing the proficiency test for a school which has a mean teacher salary of 40,000 dollars, and an instructional spending per pupil of 2,000 dollars. TABLE 14-15 The superintendent of a […]
BUA 811
TABLE 9-9 The president of a university claimed that the entering class this year appeared to be larger than the entering class from previous years but their mean SAT score is lower than previous years. He took a sample of […]
BUA 823 Test
The number of power outages at a nuclear power plant has a Poisson distribution with a mean of 6 outages per year. The variance of the number of power outages is ________. TABLE 2-14 The table below contains the number […]
BUA 844 Quiz 2
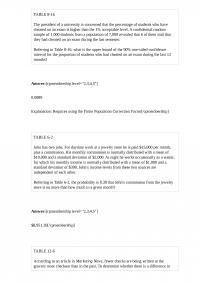
TABLE 8-16 The president of a university is concerned that the percentage of students who have cheated on an exam is higher than the 1% acceptable level. A confidential random sample of 1,000 students from a population of 7,000 revealed […]
BUA 887 Midterm 2
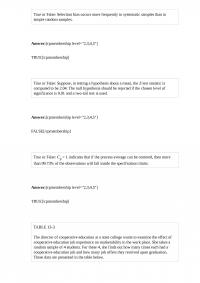
True or False: In testing a hypothesis, you should always raise the question concerning the purpose of the study, survey or experiment. True or False: If the values of the seventh and eighth class in a cumulative percentage distribution are […]
BUS 105 Midterm
True or False: Selection bias occurs more frequently in systematic samples than in simple random samples. True or False: Suppose, in testing a hypothesis about a mean, the Z test statistic is computed to be 2.04. The null hypothesis should […]

BUS 122
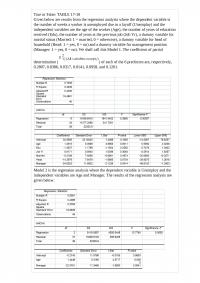
True or False: TABLE 17-10 Given below are results from the regression analysis where the dependent variable is the number of weeks a worker is unemployed due to a layoff (Unemploy) and the independent variables are the age of the […]
BUS 186 Midterm 2 TABLE 214The
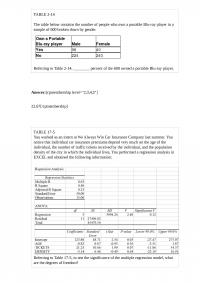
TABLE 2-14 The table below contains the number of people who own a portable Blu-ray player in a sample of 600 broken down by gender. Referring to Table 2-14, ________ percent of the 600 were females who owned a portable […]
BUS 186 Quiz 1
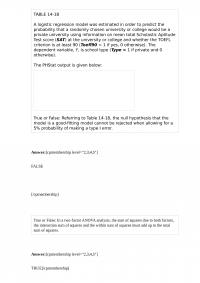
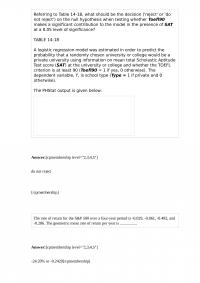
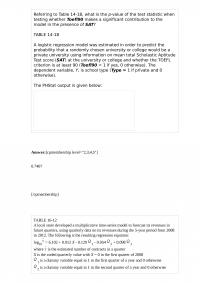
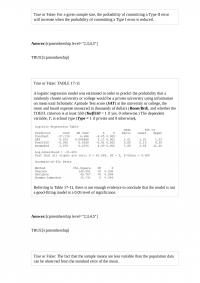
TABLE 14-18 A logistic regression model was estimated in order to predict the probability that a randomly chosen university or college would be a private university using information on mean total Scholastic Aptitude Test score (SAT) at the university or […]
BUS 242 TABLE 63Suppose the time
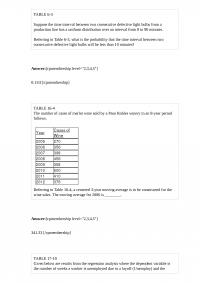
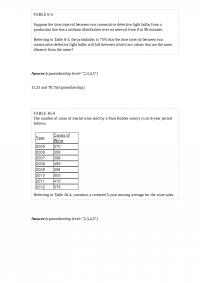
TABLE 6-3 Suppose the time interval between two consecutive defective light bulbs from a production line has a uniform distribution over an interval from 0 to 90 minutes. Referring to Table 6-3, what is the mean of the time interval? […]
BUS 270 Quiz 3
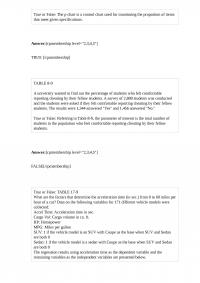
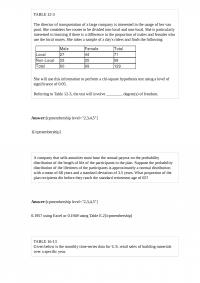
TABLE 12-3 The director of transportation of a large company is interested in the usage of her van pool. She considers her routes to be divided into local and non-local. She is particularly interested in learning if there is a […]
BUS 343 Test
TABLE 11-3 As part of an evaluation program, a sporting goods retailer wanted to compare the downhill coasting speeds of 4 brands of bicycles. She took 3 of each brand and determined their maximum downhill speeds. The results are presented […]
BUS 374 Midterm 1
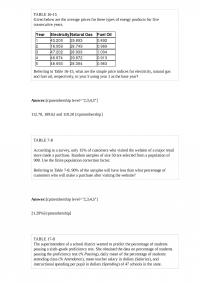
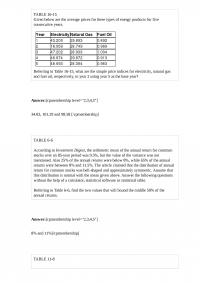
TABLE 16-15 Given below are the average prices for three types of energy products for five consecutive years. Referring to Table 16-15, what are the simple price indices for electricity, natural gas and fuel oil, respectively, in year 5 using […]
BUS 386 Quiz 1
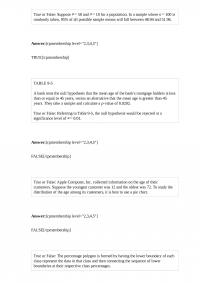
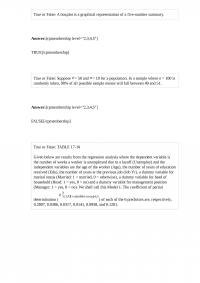
True or False: Suppose = 50 and = 10 for a population. In a sample where n = 100 is randomly taken, 95% of all possible sample means will fall between 48.04 and 51.96. TABLE 9-5 A bank tests the […]
BUS 430 Quiz 2
True or False: The amount of coffee consumed by an individual in a day is an example of a discrete numerical variable. True or False: A Walmart store in a small town monitors customer complaints and organizes these complaints into […]
BUS 503 Quiz 2 True or False If we
True or False: If we use the chi-square method of analysis to test for the difference between proportions, we must assume that there are at least 5 observed frequencies in each cell of the contingency table. True or False: In […]
BUS 531 Quiz 3
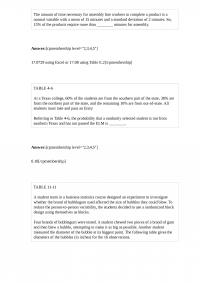
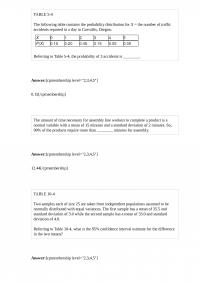
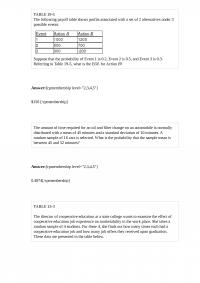
The amount of time necessary for assembly line workers to complete a product is a normal variable with a mean of 15 minutes and a standard deviation of 2 minutes. So, 15% of the products require more than ________ minutes […]
BUS 559 TABLE 1615Given below are
TABLE 16-15 Given below are the average prices for three types of energy products for five consecutive years. Referring to Table 16-15, what are the simple price indices for electricity, natural gas and fuel oil, respectively, in year 2 using […]
BUS 574 Test
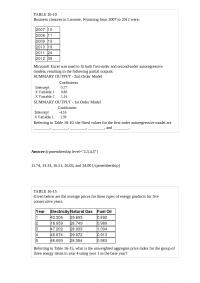
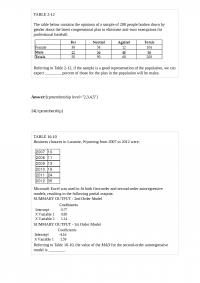
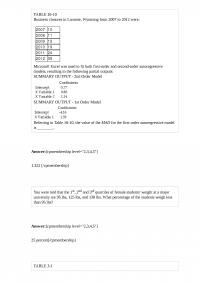
TABLE 16-10 Business closures in Laramie, Wyoming from 2007 to 2012 were: Microsoft Excel was used to fit both first-order and second-order autoregressive models, resulting in the following partial outputs: SUMMARY OUTPUT – 2nd Order Model SUMMARY OUTPUT – 1st […]

BUS 578 Midterm 2
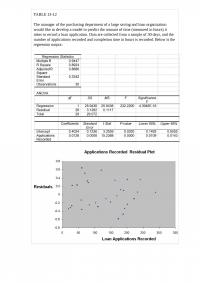
TABLE 13-12 The manager of the purchasing department of a large saving and loan organization would like to develop a model to predict the amount of time (measured in hours) it takes to record a loan application. Data are collected […]
BUS 583 TABLE 1311A computer
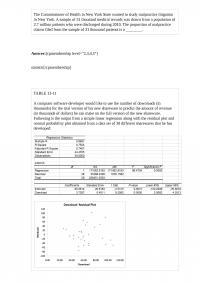
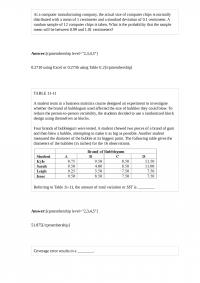
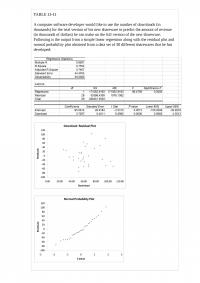
TABLE 13-11 A computer software developer would like to use the number of downloads (in thousands) for the trial version of his new shareware to predict the amount of revenue (in thousands of dollars) he can make on the full […]
BUS 655 Quiz
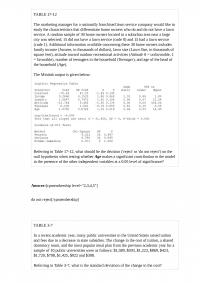
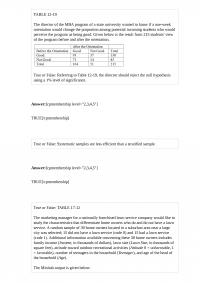
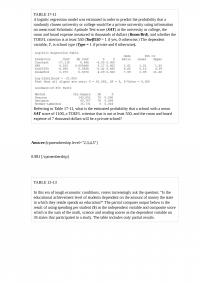
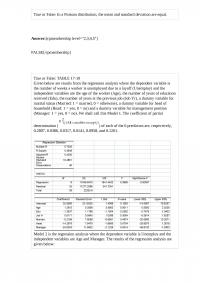
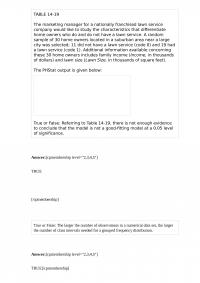
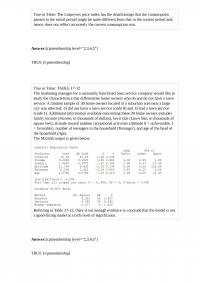
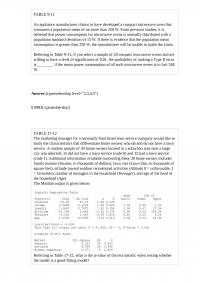
TABLE 17-12 The marketing manager for a nationally franchised lawn service company would like to study the characteristics that differentiate home owners who do and do not have a lawn service. A random sample of 30 home owners located in […]
BUS 680 Homework
True or False: Given a sample mean of 2.1 and a population standard deviation of 0.7 from a sample of 10 data points, a 90% confidence interval will have a width of 2.36. True or False: TABLE 17-8 The superintendent […]
BUS 699 Quiz
Most colleges admit students based on their achievements in a number of different areas. The total SAT score achieved by a student is an example of a ________ numerical variable. TABLE 11-10 An agronomist wants to compare the crop yield […]
BUS 728
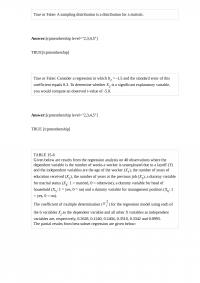
TABLE 15-6 Given below are results from the regression analysis on 40 observations where the dependent variable is the number of weeks a worker is unemployed due to a layoff (Y) and the independent variables are the age of the […]
BUS 770 TABLE 168The manager of a
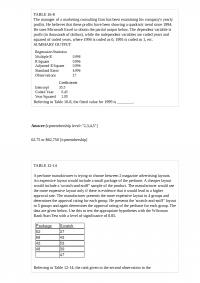
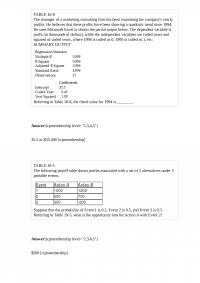
TABLE 16-8 The manager of a marketing consulting firm has been examining his company’s yearly profits. He believes that these profits have been showing a quadratic trend since 1994. He uses Microsoft Excel to obtain the partial output below. The […]
BUS 851
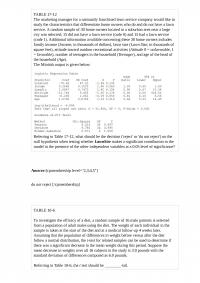
TABLE 17-10 Given below are results from the regression analysis where the dependent variable is the number of weeks a worker is unemployed due to a layoff (Unemploy) and the independent variables are the age of the worker (Age), the […]
BUS 851 Quiz 1
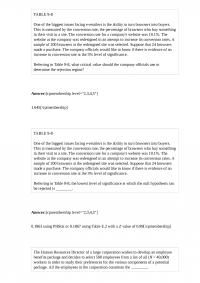
TABLE 9-8 One of the biggest issues facing e-retailers is the ability to turn browsers into buyers. This is measured by the conversion rate, the percentage of browsers who buy something in their visit to a site. The conversion rate […]
BUS 855
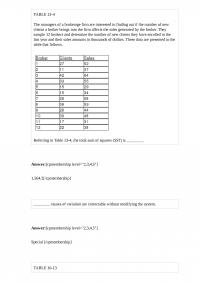
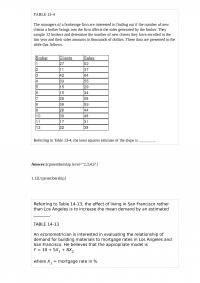
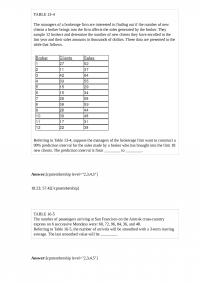
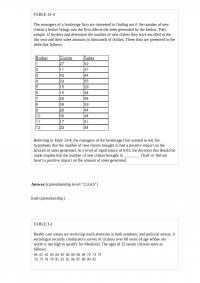
TABLE 13-4 The managers of a brokerage firm are interested in finding out if the number of new clients a broker brings into the firm affects the sales generated by the broker. They sample 12 brokers and determine the number […]
BUS 857 Quiz
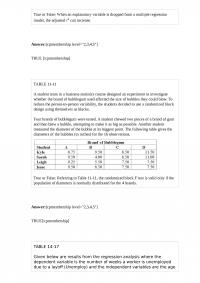
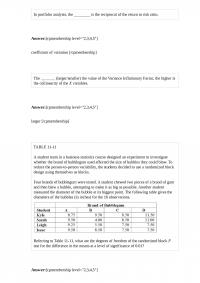
True or False: When an explanatory variable is dropped from a multiple regression model, the adjusted r2 can increase. TABLE 11-11 A student team in a business statistics course designed an experiment to investigate whether the brand of bubblegum used […]
BUS 874 Test 2
True or False: The t distribution allows the calculation of confidence intervals for means for small samples when the population variance is not known, regardless of the shape of the distribution in the population. True or False: Referring to Table […]
EMBA 104 Midterm
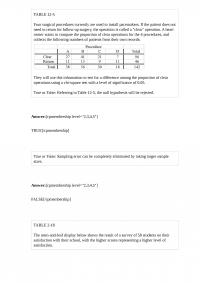
TABLE 12-5 Four surgical procedures currently are used to install pacemakers. If the patient does not need to return for follow-up surgery, the operation is called a “clear” operation. A heart center wants to compare the proportion of clear operations […]
EMBA 107
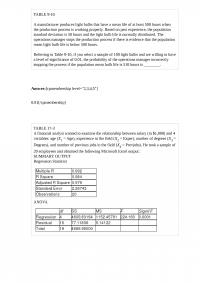
There are only 4 empty rooms available in a student dormitory for eleven new freshmen. All the rooms are considered as homogenous so that it does not matter who is being assigned to which room. How many different ways can […]
EMBA 114
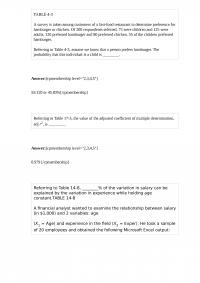
TABLE 4-3 A survey is taken among customers of a fast-food restaurant to determine preference for hamburger or chicken. Of 200 respondents selected, 75 were children and 125 were adults. 120 preferred hamburger and 80 preferred chicken. 55 of the […]
EMBA 131 Homework
True or False: A regression had the following results: SST = 82.55, SSE = 29.85. It can be said that 63.84% of the variation in the dependent variable is explained by the independent variables in the regression. True or False: […]
EMBA 132 Homework
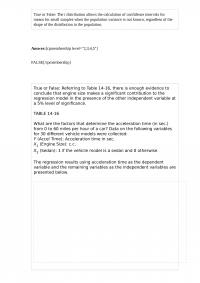
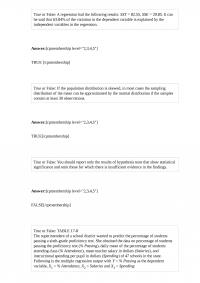
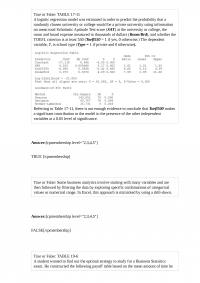
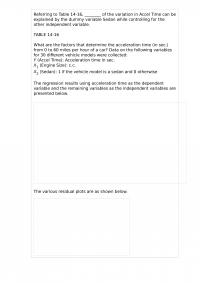
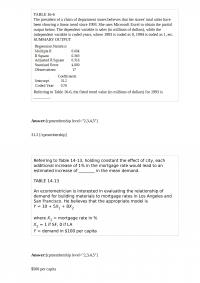
Referring to Table 14-16, what is the value of the test statistic to determine whether engine size makes a signiticant contribution to the regression model in the presence of the other independent variable at a 5% level of signiticance? TABLE […]
EMBA 178
TABLE 5-4 The following table contains the probability distribution for X = the number of traffic accidents reported in a day in Corvallis, Oregon. Referring to Table 5-4, the probability of 3 accidents is ________. The amount of time necessary […]

EMBA 257 Quiz
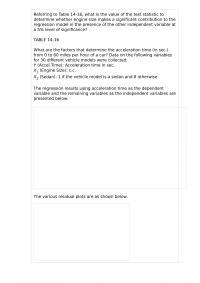
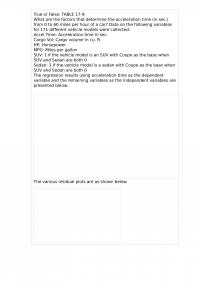
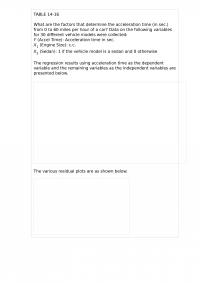
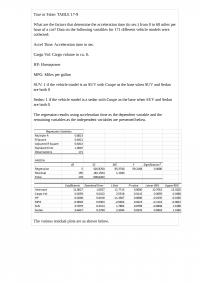
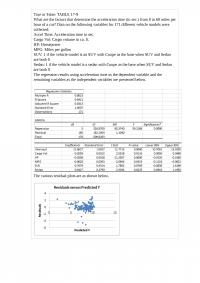
True or False: TABLE 17-9 What are the factors that determine the acceleration time (in sec.) from 0 to 60 miles per hour of a car? Data on the following variables for 171 different vehicle models were collected: Accel Time: […]
EMBA 343
TABLE 17-12 The marketing manager for a nationally franchised lawn service company would like to study the characteristics that differentiate home owners who do and do not have a lawn service. A random sample of 30 home owners located in […]
EMBA 366
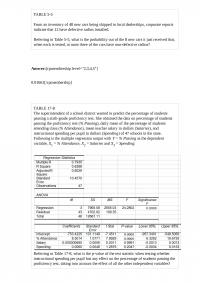
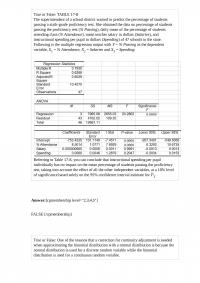
True or False: TABLE 17-8 The superintendent of a school district wanted to predict the percentage of students passing a sixth-grade proficiency test. She obtained the data on percentage of students passing the proficiency test (% Passing), daily mean of […]
EMBA 399 Test 2
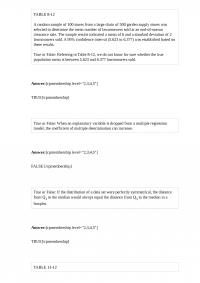
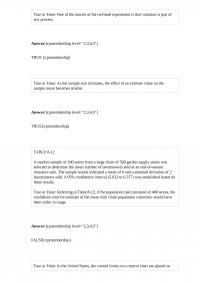
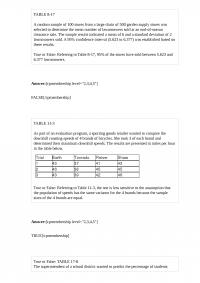
TABLE 8-12 A random sample of 100 stores from a large chain of 500 garden supply stores was selected to determine the mean number of lawnmowers sold at an end-of-season clearance sale. The sample results indicated a mean of 6 […]
EMBA 423 Quiz
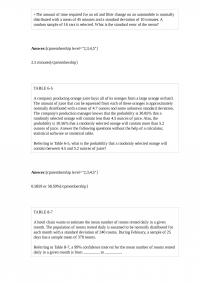
+The amount of time required for an oil and filter change on an automobile is normally distributed with a mean of 45 minutes and a standard deviation of 10 minutes. A random sample of 16 cars is selected. What is […]
EMBA 442 Midterm 1
Eleven freshmen are to be assigned to eleven empty rooms in a student dormitory. Each room is considered unique so that it matters who is being assigned to which room. How many different ways can those eleven freshmen be allocated? […]
EMBA 491 Quiz
True or False: TABLE 17-11 A logistic regression model was estimated in order to predict the probability that a randomly chosen university or college would be a private university using information on mean total Scholastic Aptitude Test score (SAT) at […]

EMBA 503 Quiz 2
True or False: TABLE 17-9 What are the factors that determine the acceleration time (in sec.) from 0 to 60 miles per hour of a car? Data on the following variables for 171 different vehicle models were collected: Accel Time: […]
EMBA 546 Quiz 3
True or False: Apple Computer, Inc. collected information on the age of their customers. Suppose the youngest customer was 12 and the oldest was 72. To study the distribution of the age among its customers, it can use a percentage […]
EMBA 594
TABLE 2-14 The table below contains the number of people who own a portable Blu-ray player in a sample of 600 broken down by gender. Referring to Table 2-14, ________ percent of the 600 owned a portable Blu-ray player. TABLE […]
EMBA 620
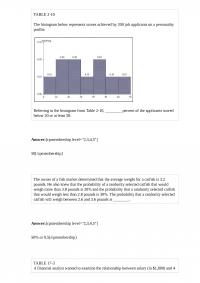
TABLE 2-10 The histogram below represents scores achieved by 200 job applicants on a personality profile. Referring to the histogram from Table 2-10, ________ percent of the applicants scored below 20 or at least 50. The owner of a fish […]
EMBA 653 Midterm 2
True or False: One of the morals of the red bead experiment is that variation is part of any process. True or False: As the sample size increases, the effect of an extreme value on the sample mean becomes smaller. […]
EMBA 671
True or False: The amount of alcohol consumed by a person per week is an example of a continuous variable. TABLE 8-6 After an extensive advertising campaign, the manager of a company wants to estimate the proportion of potential customers […]
EMBA 703 TABLE 31Health care
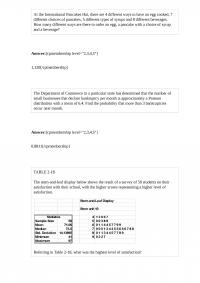
TABLE 3-1 Health care issues are receiving much attention in both academic and political arenas. A sociologist recently conducted a survey of citizens over 60 years of age whose net worth is too high to qualify for Medicaid. The ages […]
EMBA 772 Quiz 1
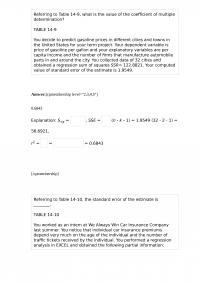
Referring to Table 14-9, what is the value of the coefficient of multiple determination? TABLE 14-9 You decide to predict gasoline prices in different cities and towns in the United States for your term project. Your dependent variable is price […]
EMBA 796 Test 2
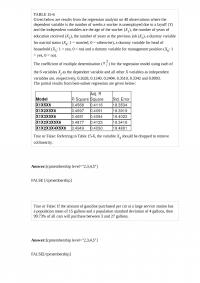
True or False: If the amount of gasoline purchased per car at a large service station has a population mean of 15 gallons and a population standard deviation of 4 gallons, and it is assumed that the amount of gasoline […]
EMBA 805 Homework
TABLE 6-3 Suppose the time interval between two consecutive defective light bulbs from a production line has a uniform distribution over an interval from 0 to 90 minutes. Referring to Table 6-3, what is the probability that the time interval […]
EMBA 853 Midterm 1
Referring to Table 14-18, what should be the decision (‘reject’ or ‘do not reject’) on the null hypothesis when testing whether Toe90 makes a signi”cant contribution to the model in the presence of SAT at a 0.05 level of signi”cance? […]
EMBA 876 Final
True or False: The p chart is a control chart used for monitoring the proportion of items that meet given specifications. TABLE 8-9 A university wanted to find out the percentage of students who felt comfortable reporting cheating by their […]
Management 119 Midterm 2
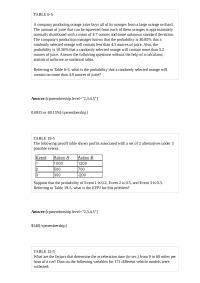
TABLE 6-5 A company producing orange juice buys all of its oranges from a large orange orchard. The amount of juice that can be squeezed from each of these oranges is approximately normally distributed with a mean of 4.7 ounces […]
Management 121 Final
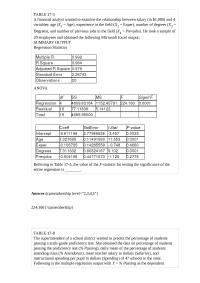
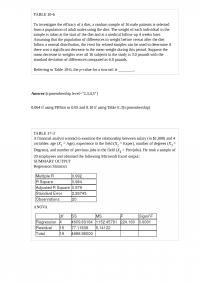
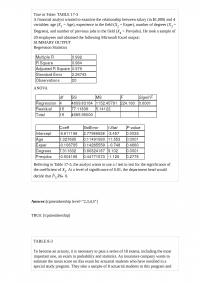
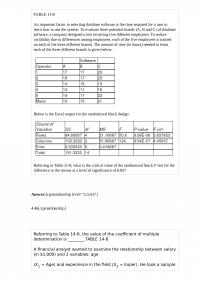
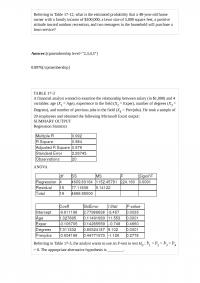
TABLE 17-3 A financial analyst wanted to examine the relationship between salary (in $1,000) and 4 variables: age (X1 = Age), experience in the field (X2 = Exper), number of degrees (X3 = Degrees), and number of previous jobs in […]
Management 238 Midterm 1
True or False: If P(A or B) = 1.0, then A and B must be mutually exclusive. TABLE 8-8 The president of a university would like to estimate the proportion of the student population that owns a personal computer. In […]
Management 248 Test 2
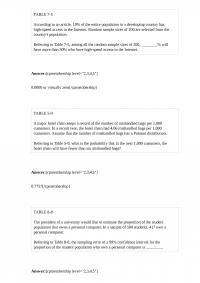
TABLE 7-5 According to an article, 19% of the entire population in a developing country has high-speed access to the Internet. Random sample sizes of 200 are selected from the country’s population. Referring to Table 7-5, among all the random […]
Management 313 Quiz 2
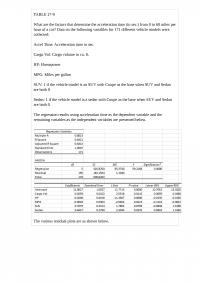
TABLE 17-9 What are the factors that determine the acceleration time (in sec.) from 0 to 60 miles per hour of a car? Data on the following variables for 171 different vehicle models were collected: Accel Time: Acceleration time in […]
Management 457
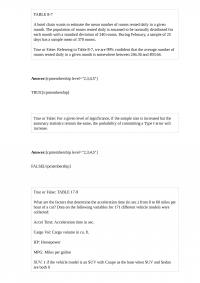
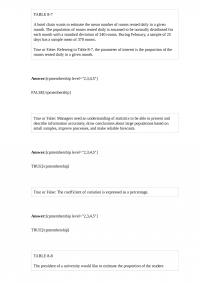
TABLE 8-7 A hotel chain wants to estimate the mean number of rooms rented daily in a given month. The population of rooms rented daily is assumed to be normally distributed for each month with a standard deviation of 240 […]
Management 484 Midterm
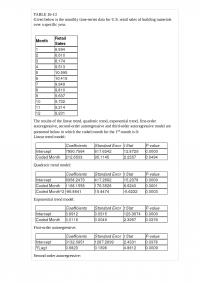
TABLE 16-13 Given below is the monthly time-series data for U.S. retail sales of building materials over a specific year. The results of the linear trend, quadratic trend, exponential trend, first-order autoregressive, second-order autoregressive and third-order autoregressive model are presented […]
Management 484 Test 1
True or False: TABLE 17-10 Given below are results from the regression analysis where the dependent variable is the number of weeks a worker is unemployed due to a layoff (Unemploy) and the independent variables are the age of the […]
Management 489 Midterm 2
TABLE 17-12 The marketing manager for a nationally franchised lawn service company would like to study the characteristics that differentiate home owners who do and do not have a lawn service. A random sample of 30 home owners located in […]
Management 493
TABLE 13-4 The managers of a brokerage firm are interested in finding out if the number of new clients a broker brings into the firm affects the sales generated by the broker. They sample 12 brokers and determine the number […]
Management 605 Quiz 1
TABLE 8-7 A hotel chain wants to estimate the mean number of rooms rented daily in a given month. The population of rooms rented daily is assumed to be normally distributed for each month with a standard deviation of 240 […]
Management 611 Test 2
True or False: TABLE 17-10 Given below are results from the regression analysis where the dependent variable is the number of weeks a worker is unemployed due to a layoff (Unemploy) and the independent variables are the age of the […]
Management 635 Test
TABLE 16-8 The manager of a marketing consulting firm has been examining his company’s yearly profits. He believes that these profits have been showing a quadratic trend since 1994. He uses Microsoft Excel to obtain the partial output below. The […]
Management 652 Quiz
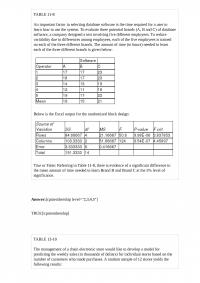
In portfolio analysis, the ________ is the reciprocal of the return to risk ratio. The _______ (larger/smaller) the value of the Variance Inflationary Factor, the higher is the collinearity of the X variables. Answer: larger TABLE 11-11 A student team […]
Management 681
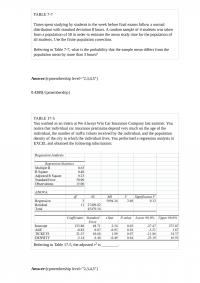
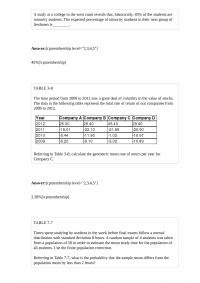
TABLE 7-7 Times spent studying by students in the week before final exams follow a normal distribution with standard deviation 8 hours. A random sample of 4 students was taken from a population of 50 in order to estimate the […]
Management 733 Midterm 1
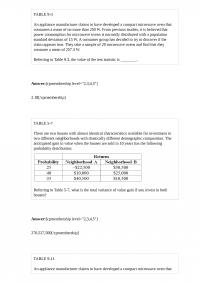
TABLE 9-3 An appliance manufacturer claims to have developed a compact microwave oven that consumes a mean of no more than 250 W. From previous studies, it is believed that power consumption for microwave ovens is normally distributed with a […]
Management 746 Test
True or False: TABLE 17-8 The superintendent of a school district wanted to predict the percentage of students passing a sixth-grade proficiency test. She obtained the data on percentage of students passing the proficiency test (% Passing), daily mean of […]
Management 752 Quiz 1
TABLE 8-17 A random sample of 100 stores from a large chain of 500 garden supply stores was selected to determine the mean number of lawnmowers sold at an end-of-season clearance sale. The sample results indicated a mean of 6 […]
MGMT 105 Quiz 3
TABLE 9-8 One of the biggest issues facing e-retailers is the ability to turn browsers into buyers. This is measured by the conversion rate, the percentage of browsers who buy something in their visit to a site. The conversion rate […]
MGMT 146 Final
True or False: TABLE 17-9 What are the factors that determine the acceleration time (in sec.) from 0 to 60 miles per hour of a car? Data on the following variables for 171 different vehicle models were collected: Accel Time: […]
MGMT 164
True or False: TABLE 17-8 The superintendent of a school district wanted to predict the percentage of students passing a sixth-grade proficiency test. She obtained the data on percentage of students passing the proficiency test (% Passing), daily mean of […]
MGMT 168
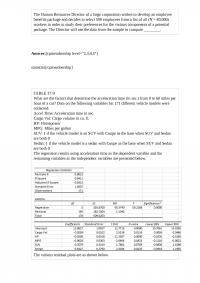
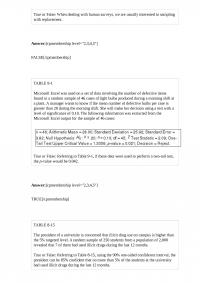
The Human Resources Director of a large corporation wishes to develop an employee benefits package and decides to select 500 employees from a list of all (N = 40,000) workers in order to study their preferences for the various components […]
MGMT 236
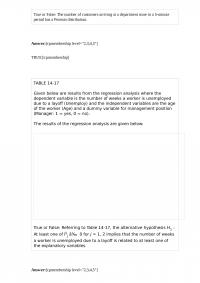
True or False: The number of customers arriving at a department store in a 5-minute period has a Poisson distribution. TABLE 14-17 Given below are results from the regression analysis where the dependent variable is the number of weeks a […]
MGMT 331 Quiz 3
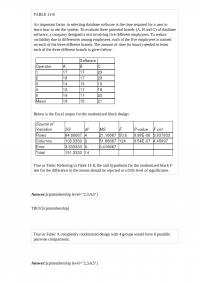
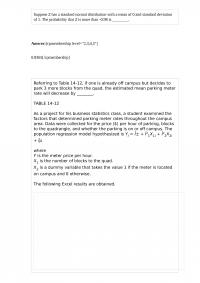
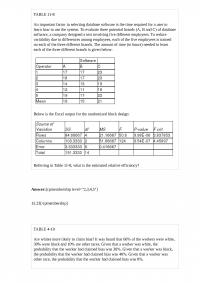
TABLE 11-8 An important factor in selecting database software is the time required for a user to learn how to use the system. To evaluate three potential brands (A, B and C) of database software, a company designed a test […]
MGMT 385 Quiz 2
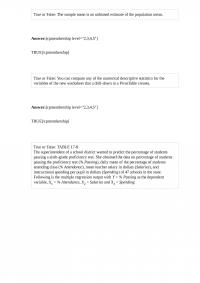
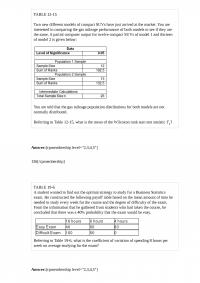
TABLE 2-12 The table below contains the opinions of a sample of 200 people broken down by gender about the latest congressional plan to eliminate anti-trust exemptions for professional baseball. Referring to Table 2-12, if the sample is a good […]
MGMT 422 Quiz 2
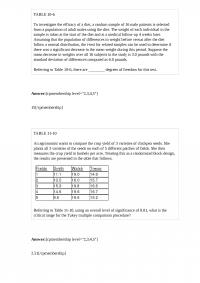
TABLE 10-6 To investigate the efficacy of a diet, a random sample of 16 male patients is selected from a population of adult males using the diet. The weight of each individual in the sample is taken at the start […]
MGMT 449 Homework
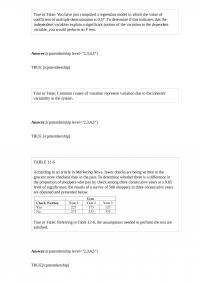
True or False: You have just computed a regression model in which the value of coefficient of multiple determination is 0.57. To determine if this indicates that the independent variables explain a significant portion of the variation in the dependent […]
MGMT 459 Test
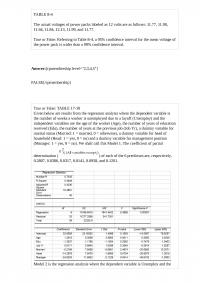
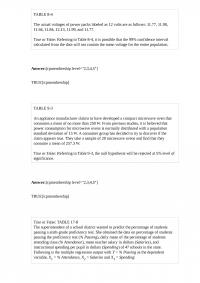
TABLE 8-4 The actual voltages of power packs labeled as 12 volts are as follows: 11.77, 11.90, 11.64, 11.84, 12.13, 11.99, and 11.77. True or False: Referring to Table 8-4, a 95% confidence interval for the mean voltage of the […]
MGMT 522 Quiz 1
TABLE 15-6 Given below are results from the regression analysis on 40 observations where the dependent variable is the number of weeks a worker is unemployed due to a layoff (Y) and the independent variables are the age of the […]
MGMT 533 Test
TABLE 13-3 The director of cooperative education at a state college wants to examine the effect of cooperative education job experience on marketability in the work place. She takes a random sample of 4 students. For these 4, she finds […]
MGMT 558 Homework
TABLE 5-10 An accounting firm in a college town usually recruits employees from two of the universities in town. This year, there are fifteen graduates from University A and five from University B and the firm decides to hire six […]
MGMT 570 Midterm 1
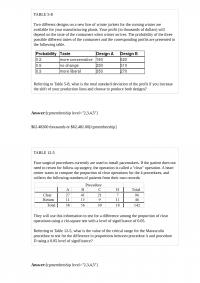
TABLE 5-8 Two different designs on a new line of winter jackets for the coming winter are available for your manufacturing plants. Your profit (in thousands of dollars) will depend on the taste of the consumers when winter arrives. The […]
MGMT 622 Quiz 3
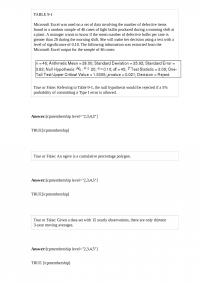
True or False: When dealing with human surveys, we are usually interested in sampling with replacement. TABLE 9-1 Microsoft Excel was used on a set of data involving the number of defective items found in a random sample of 46 […]
MGMT 695
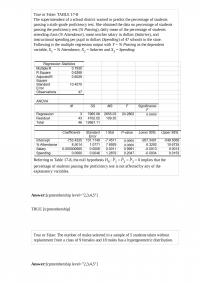
Referring to Table 14-16, ________ of the variation in Accel Time can be explained by the dummy variable Sedan while controlling for the other independent variable. TABLE 14-16 What are the factors that determine the acceleration time (in sec.) from […]
MGMT 702
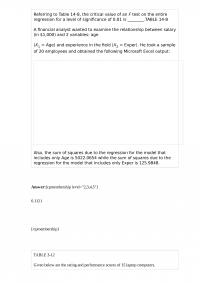
Referring to Table 14-8, the critical value of an F test on the entire regression for a level of significance of 0.01 is ________.TABLE 14-8 A financial analyst wanted to examine the relationship between salary (in $1,000) and 2 variables: […]
MGMT 725 Quiz 3
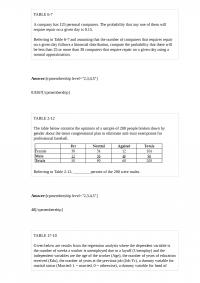
TABLE 6-7 A company has 125 personal computers. The probability that any one of them will require repair on a given day is 0.15. Referring to Table 6-7 and assuming that the number of computers that requires repair on a […]
MGMT 743 Test 2
True or False: The sample mean is an unbiased estimate of the population mean. True or False: You can compute any of the numerical descriptive statistics for the variables of the new worksheet that a drill-down in a PivotTable creates. […]
MGMT 835
True or False: The value of r is always positive. True or False: The Paasche price index is a form of unweighted aggregate price index. Answer: FALSE True or False: The sampling error can either be positive or negative. Answer: […]
MGMT 836 Quiz 3
True or False: “Big data” are data being collected in huge volumes and at very fast rates, and they typically arrive in a variety of forms, organized and unorganized. True or False: The amount of calories contained in a 12-ounce […]
MGT 163 Final
TABLE 17-3 A financial analyst wanted to examine the relationship between salary (in $1,000) and 4 variables: age (X1 = Age), experience in the field (X2 = Exper), number of degrees (X3 = Degrees), and number of previous jobs in […]
MGT 164
True or False: The procedure for the Wilcoxon rank sum test requires that you rank each group separately rather than together. True or False: The method of least squares may be used to estimate both linear and curvilinear trends. Answer: […]
MGT 324 Test
TABLE 5-5 From an inventory of 48 new cars being shipped to local dealerships, corporate reports indicate that 12 have defective radios installed. Referring to Table 5-5, what is the probability out of the 8 new cars it just received […]
MGT 353 Midterm 2
TABLE 12-19 The director of the MBA program of a state university wanted to know if a one-week orientation would change the proportion among potential incoming students who would perceive the program as being good. Given below is the result […]
MGT 375 Homework
TABLE 12-3 The director of transportation of a large company is interested in the usage of her van pool. She considers her routes to be divided into local and non-local. She is particularly interested in learning if there is a […]
MGT 380
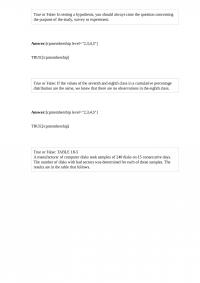
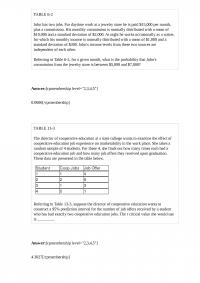
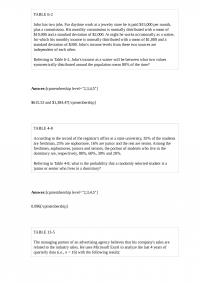
TABLE 6-2 John has two jobs. For daytime work at a jewelry store he is paid $15,000 per month, plus a commission. His monthly commission is normally distributed with a mean of $10,000 and a standard deviation of $2,000. At […]
MGT 382 Midterm 2
TABLE 6-3 Suppose the time interval between two consecutive defective light bulbs from a production line has a uniform distribution over an interval from 0 to 90 minutes. Referring to Table 6-3, the probability is 75% that the time interval […]
MGT 398 Quiz 2
True or False: TABLE 17-11 A logistic regression model was estimated in order to predict the probability that a randomly chosen university or college would be a private university using information on mean total Scholastic Aptitude Test score (SAT) at […]
MGT 415
At a computer manufacturing company, the actual size of computer chips is normally distributed with a mean of 1 centimeter and a standard deviation of 0.1 centimeter. A random sample of 12 computer chips is taken. Above what value do […]
MGT 424 Test 1
TABLE 14-16 What are the factors that determine the acceleration time (in sec.) from 0 to 60 miles per hour of a car? Data on the following variables for 30 different vehicle models were collected: Y (Accel Time): Acceleration time […]
MGT 428 Test 1
True or False: The Chancellor of a university has commissioned a team to collect data on students’ GPAs and the amount of time they spend bar hopping every week (measured in minutes). He wants to know if imposing much tougher […]
MGT 454 Quiz 1
True or False: TABLE 17-3 A financial analyst wanted to examine the relationship between salary (in $1,000) and 4 variables: age (X1 = Age), experience in the field (X2 = Exper), number of degrees (X3 = Degrees), and number of […]
MGT 455 Test 1
TABLE 9-1 Microsoft Excel was used on a set of data involving the number of defective items found in a random sample of 46 cases of light bulbs produced during a morning shift at a plant. A manager wants to […]
MGT 500 Test 1
TABLE 13-4 The managers of a brokerage firm are interested in finding out if the number of new clients a broker brings into the firm affects the sales generated by the broker. They sample 12 brokers and determine the number […]

MGT 569 Midterm 1
TABLE 15-6 Given below are results from the regression analysis on 40 observations where the dependent variable is the number of weeks a worker is unemployed due to a layoff (Y) and the independent variables are the age of the […]

MGT 572 Midterm 1
True or False: TABLE 17-9 What are the factors that determine the acceleration time (in sec.) from 0 to 60 miles per hour of a car? Data on the following variables for 171 different vehicle models were collected: Accel Time: […]
MGT 729 Test
TABLE 6-1 The number of column inches of classified advertisements appearing on Mondays in a certain daily newspaper is normally distributed with a population mean of 320 and a population standard deviation of 20 inches. Referring to Table 6-1, for […]
MGT 731 Test
TABLE 19-6 A student wanted to find out the optimal strategy to study for a Business Statistics exam. He constructed the following payoff table based on the mean amount of time he needed to study every week for the course […]

MGT 742 Midterm
TABLE 17-10 Given below are results from the regression analysis where the dependent variable is the number of weeks a worker is unemployed due to a layoff (Unemploy) and the independent variables are the age of the worker (Age), the […]
MGT 744 Quiz
TABLE 13-4 The managers of a brokerage firm are interested in finding out if the number of new clients a broker brings into the firm affects the sales generated by the broker. They sample 12 brokers and determine the number […]
MGT 822
At the International Pancakes Hut, there are 4 different ways to have an egg cooked, 7 different choices of pancakes, 5 different types of syrups and 8 different beverages. How many different ways are there to order an egg, a […]
MGT 823 Quiz 2
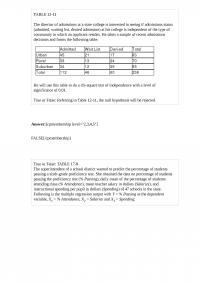
TABLE 12-11 The director of admissions at a state college is interested in seeing if admissions status (admitted, waiting list, denied admission) at his college is independent of the type of community in which an applicant resides. He takes a […]
MGT 842 Quiz 2
TABLE 12-3 The director of transportation of a large company is interested in the usage of her van pool. She considers her routes to be divided into local and non-local. She is particularly interested in learning if there is a […]
MHR 118 Quiz 2
True or False: Regression analysis is used for prediction, while correlation analysis is used to measure the strength of the association between two numerical variables. True or False: The sample proportion is an unbiased estimate of the population proportion. Answer: […]
MHR 187 Midterm 2
Suppose Z has a standard normal distribution with a mean of 0 and standard deviation of 1. The probability that Z is more than -0.98 is ________. Referring to Table 14-12, if one is already o campus but decides to […]

MHR 196 Quiz 1
TABLE 17-10 Given below are results from the regression analysis where the dependent variable is the number of weeks a worker is unemployed due to a layoff (Unemploy) and the independent variables are the age of the worker (Age), the […]
MHR 218 Quiz 1
TABLE 17-8 The superintendent of a school district wanted to predict the percentage of students passing a sixth-grade proficiency test. She obtained the data on percentage of students passing the proficiency test (% Passing), daily mean of the percentage of […]
MHR 231 Midterm 2
True or False: A worker earns $15 per hour at a plant in China and is told that only 2.5% of all workers make a higher wage. If the wage is assumed to be normally distributed and the standard deviation […]
MHR 243 Homework
TABLE 6-2 John has two jobs. For daytime work at a jewelry store he is paid $15,000 per month, plus a commission. His monthly commission is normally distributed with a mean of $10,000 and a standard deviation of $2,000. At […]
MHR 287 Quiz
True or False: A boxplot is a graphical representation of a five-number summary. True or False: Suppose = 50 and = 10 for a population. In a sample where n = 100 is randomly taken, 90% of all possible sample […]
MHR 289 Final
TABLE 11-10 An agronomist wants to compare the crop yield of 3 varieties of chickpea seeds. She plants all 3 varieties of the seeds on each of 5 different patches of fields. She then measures the crop yield in bushels […]
MHR 327 Test 2
TABLE 16-6 The president of a chain of department stores believes that her stores’ total sales have been showing a linear trend since 1993. She uses Microsoft Excel to obtain the partial output below. The dependent variable is sales (in […]
MHR 462 Quiz 3
TABLE 6-5 A company producing orange juice buys all of its oranges from a large orange orchard. The amount of juice that can be squeezed from each of these oranges is approximately normally distributed with a mean of 4.7 ounces […]
MHR 497
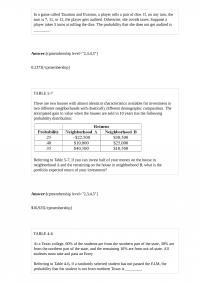
The oranges grown in corporate farms in an agricultural state were damaged by some unknown fungi a few years ago. Suppose the manager of a large farm wanted to study the impact of the fungi on the orange crops on […]
MHR 510
In a game called Taxation and Evasion, a player rolls a pair of dice. If, on any turn, the sum is 7, 11, or 12, the player gets audited. Otherwise, she avoids taxes. Suppose a player takes 5 turns at […]
MHR 551
TABLE 11-8 An important factor in selecting database software is the time required for a user to learn how to use the system. To evaluate three potential brands (A, B and C) of database software, a company designed a test […]
MHR 553 Quiz 2
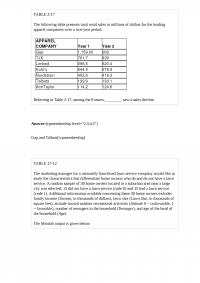
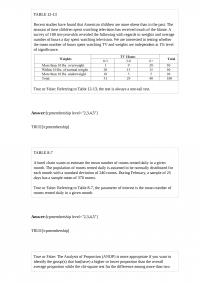
TABLE 2-17 The following table presents total retail sales in millions of dollars for the leading apparel companies over a two-year period. Referring to Table 2-17, among the 8 stores, ________ saw a sales decline. TABLE 17-12 The marketing manager […]
MHR 558 Homework
TABLE 17-11 A logistic regression model was estimated in order to predict the probability that a randomly chosen university or college would be a private university using information on mean total Scholastic Aptitude Test score (SAT) at the university or […]
MHR 562 Midterm 2
TABLE 11-4 An agronomist wants to compare the crop yield of 3 varieties of chickpea seeds. She plants 15 fields, 5 with each variety. She then measures the crop yield in bushels per acre. Treating this as a completely randomized […]
MHR 572
True or False: A sampling distribution is a distribution for a statistic. True or False: Consider a regression in which b2 = -1.5 and the standard error of this coefficient equals 0.3. To determine whether X2 is a significant explanatory […]
MHR 622 Quiz 3
TABLE 16-10 Business closures in Laramie, Wyoming from 2007 to 2012 were: Microsoft Excel was used to fit both first-order and second-order autoregressive models, resulting in the following partial outputs: SUMMARY OUTPUT – 2nd Order Model SUMMARY OUTPUT – 1st […]

MHR 648 Final
TABLE 16-13 Given below is the monthly time-series data for U.S. retail sales of building materials over a specific year. The results of the linear trend, quadratic trend, exponential trend, first-order autoregressive, second-order autoregressive and third-order autoregressive model are presented […]
MHR 668
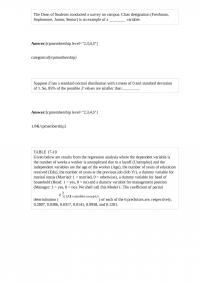
The Dean of Students conducted a survey on campus. Class designation (Freshman, Sophomore, Junior, Senior) is an example of a ________ variable. Suppose Z has a standard normal distribution with a mean of 0 and standard deviation of 1. So, […]
MHR 693 Final
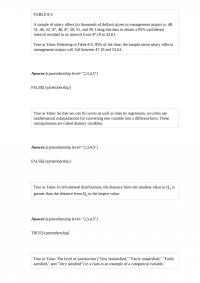
TABLE 8-5 A sample of salary offers (in thousands of dollars) given to management majors is: 48, 51, 46, 52, 47, 48, 47, 50, 51, and 59. Using this data to obtain a 95% confidence interval resulted in an interval […]
MHR 745
TABLE 17-12 The marketing manager for a nationally franchised lawn service company would like to study the characteristics that differentiate home owners who do and do not have a lawn service. A random sample of 30 home owners located in […]
MHR 836 Homework
TABLE 9-10 A manufacturer produces light bulbs that have a mean life of at least 500 hours when the production process is working properly. Based on past experience, the population standard deviation is 50 hours and the light bulb life […]

MHR 851 Quiz 1
TABLE 16-13 Given below is the monthly time-series data for U.S. retail sales of building materials over a specific year. The results of the linear trend, quadratic trend, exponential trend, first-order autoregressive, second-order autoregressive and third-order autoregressive model are presented […]
MHR 878 Quiz 1
True or False: If the covariance between two investments is zero, the variance of the sum of the two investments will be equal to the sum of the variances of the investments. True or False: As a general rule, a […]
OBHR 103 Quiz 1
Referring to Table 14-18, what is the p-value of the test statistic when testing whether Toe90 makes a signiticant contribution to the model in the presence of SAT? TABLE 14-18 A logistic regression model was estimated in order to predict […]
OBHR 110
TABLE 8-4 The actual voltages of power packs labeled as 12 volts are as follows: 11.77, 11.90, 11.64, 11.84, 12.13, 11.99, and 11.77. True or False: Referring to Table 8-4, it is possible that the 99% confidence interval calculated from […]
OBHR 113 Test
TABLE 11-8 An important factor in selecting database software is the time required for a user to learn how to use the system. To evaluate three potential brands (A, B and C) of database software, a company designed a test […]
OBHR 117
True or False: TABLE 17-8 The superintendent of a school district wanted to predict the percentage of students passing a sixth-grade proficiency test. She obtained the data on percentage of students passing the proficiency test (% Passing), daily mean of […]
OBHR 170
True or False: A sampling distribution is defined as the probability distribution of possible sample sizes that can be observed from a given population. True or False: For a t distribution with 12 degrees of freedom, the area between -2.6810 […]
OBHR 201 Test 2
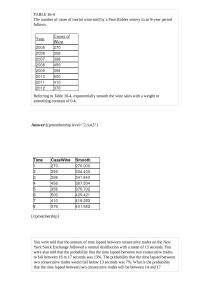
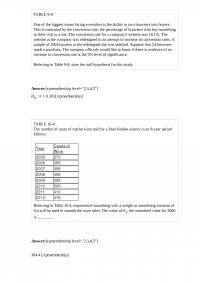
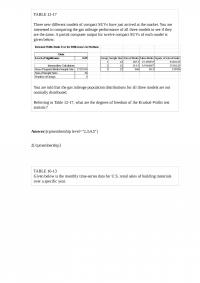
TABLE 16-4 The number of cases of merlot wine sold by a Paso Robles winery in an 8-year period follows. Referring to Table 16-4, exponentially smooth the wine sales with a weight or smoothing constant of 0.4. You were told […]
OBHR 202 Midterm
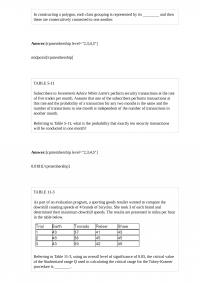
In constructing a polygon, each class grouping is represented by its ________ and then these are consecutively connected to one another. TABLE 5-11 Subscribers to Investment Advice White Letters perform security transactions at the rate of five trades per month. […]
OBHR 209 Quiz 3
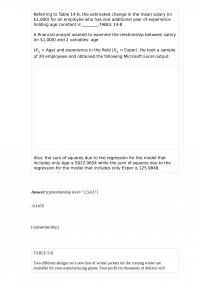
Referring to Table 14-8, the estimated change in the mean salary (in $1,000) for an employee who has one additional year of experience holding age constant is ________.TABLE 14-8 A financial analyst wanted to examine the relationship between salary (in […]
OBHR 248 Quiz
TABLE 9-8 One of the biggest issues facing e-retailers is the ability to turn browsers into buyers. This is measured by the conversion rate, the percentage of browsers who buy something in their visit to a site. The conversion rate […]
OBHR 285 Quiz 3
TABLE 12-13 Recent studies have found that American children are more obese than in the past. The amount of time children spent watching television has received much of the blame. A survey of 100 ten-year-olds revealed the following with regards […]
OBHR 341
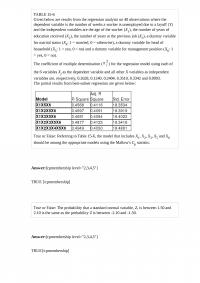
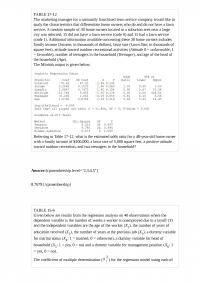
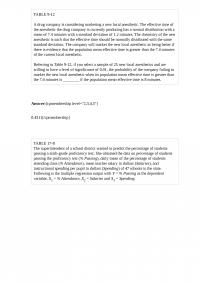
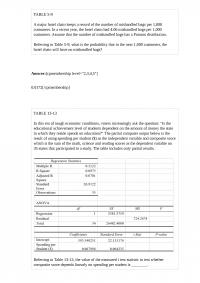
TABLE 13-13 In this era of tough economic conditions, voters increasingly ask the question: “Is the educational achievement level of students dependent on the amount of money the state in which they reside spends on education?” The partial computer output […]
OBHR 343 Test 2
True or False: In a Poisson distribution, the mean and standard deviation are equal. True or False: TABLE 17-10 Given below are results from the regression analysis where the dependent variable is the number of weeks a worker is unemployed […]

OBHR 349 Midterm 2
TABLE 8-9 A university wanted to find out the percentage of students who felt comfortable reporting cheating by their fellow students. A survey of 2,800 students was conducted and the students were asked if they felt comfortable reporting cheating by […]
OBHR 383 Test 2
Referring to Table 17-12, what is the estimated probability that a 48-year-old home owner with a family income of $100,000, a lawn size of 5,000 square feet, a positive attitude toward outdoor recreation, and two teenagers in the household will […]
OBHR 386 Homework
True or False: TABLE 17-9 What are the factors that determine the acceleration time (in sec.) from 0 to 60 miles per hour of a car? Data on the following variables for 171 different vehicle models were collected: Accel Time: […]
OBHR 402 Midterm 1
True or False: TABLE 17-9 What are the factors that determine the acceleration time (in sec.) from 0 to 60 miles per hour of a car? Data on the following variables for 171 different vehicle models were collected: Accel Time: […]
OBHR 428 Test 2
TABLE 14-19 The marketing manager for a nationally franchised lawn service company would like to study the characteristics that di erentiate home owners who do and do not have a lawn service. A random sample of 30 home owners located […]
OBHR 545 Quiz
True or False: TABLE 17-8 The superintendent of a school district wanted to predict the percentage of students passing a sixth-grade proficiency test. She obtained the data on percentage of students passing the proficiency test (% Passing), daily mean of […]
OBHR 548 Test
True or False: The Laspeyres price index has the disadvantage that the consumption pattern in the initial period might be quite different from that in the current period and, hence, does not reflect accurately the current consumption cost. True or […]
OBHR 574 Homework
TABLE 12-15 Two new different models of compact SUVs have just arrived at the market. You are interested in comparing the gas mileage performance of both models to see if they are the same. A partial computer output for twelve […]
OBHR 599 Quiz 2
TABLE 19-6 A student wanted to find out the optimal strategy to study for a Business Statistics exam. He constructed the following payoff table based on the mean amount of time he needed to study every week for the course […]
OBHR 673 Quiz 2
TABLE 8-2 A quality control engineer is interested in the mean length of sheet insulation being cut automatically by machine. The desired mean length of the insulation is 12 feet. It is known that the standard deviation in the cutting […]
OBHR 680 Quiz 3
TABLE 11-8 An important factor in selecting database software is the time required for a user to learn how to use the system. To evaluate three potential brands (A, B and C) of database software, a company designed a test […]
OBHR 701 Midterm
True or False: The principle of parsimony indicates that the simplest model that gets the job done adequately should be used. True or False: A regression had the following results: SST = 82.55, SSE = 29.85. It can be said […]
OBHR 734 Quiz 1
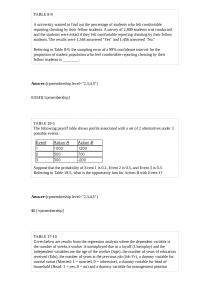
TABLE 9-12 A drug company is considering marketing a new local anesthetic. The effective time of the anesthetic the drug company is currently producing has a normal distribution with a mean of 7.4 minutes with a standard deviation of 1.2 […]
OBHR 757 Midterm 2
TABLE 12-14 A perfume manufacturer is trying to choose between 2 magazine advertising layouts. An expensive layout would include a small package of the perfume. A cheaper layout would include a ‘scratch-and-sniff” sample of the product. The manufacturer would use […]
OBHR 821 Quiz
True or False: For a given sample size, the probability of committing a Type II error will increase when the probability of committing a Type I error is reduced. True or False: TABLE 17-11 A logistic regression model was estimated […]
OBHR 834 Quiz 2
TABLE 10-6 To investigate the efficacy of a diet, a random sample of 16 male patients is selected from a population of adult males using the diet. The weight of each individual in the sample is taken at the start […]
OBHR 862
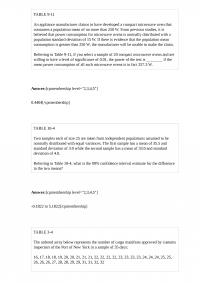
TABLE 9-11 An appliance manufacturer claims to have developed a compact microwave oven that consumes a population mean of no more than 250 W. From previous studies, it is believed that power consumption for microwave ovens is normally distributed with […]
OBHR 895
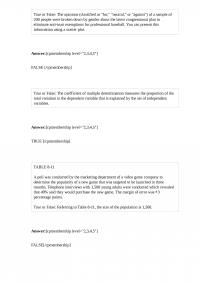
True or False: The opinions (classified as “for,” “neutral,” or “against”) of a sample of 200 people were broken down by gender about the latest congressional plan to eliminate anti-trust exemptions for professional baseball. You can present this information using […]
PRST 134
TABLE 9-11 An appliance manufacturer claims to have developed a compact microwave oven that consumes a population mean of no more than 250 W. From previous studies, it is believed that power consumption for microwave ovens is normally distributed with […]
PRST 161 Midterm 1
True or False: The probability that a standard normal variable, Z, falls between -1.50 and 0.81 is 0.7242. True or False: The coefficient of variation measures variability in a data set relative to the size of the arithmetic mean. Answer: […]
PRST 166 Test 2
TABLE 13-10 The management of a chain electronic store would like to develop a model for predicting the weekly sales (in thousands of dollars) for individual stores based on the number of customers who made purchases. A random sample of […]
PRST 201
TABLE 5-9 A major hotel chain keeps a record of the number of mishandled bags per 1,000 customers. In a recent year, the hotel chain had 4.06 mishandled bags per 1,000 customers. Assume that the number of mishandled bags has […]
PRST 234
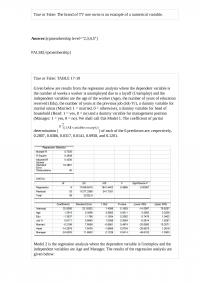
True or False: The brand of TV one owns is an example of a numerical variable. True or False: TABLE 17-10 Given below are results from the regression analysis where the dependent variable is the number of weeks a worker […]

PRST 283
True or False: TABLE 17-10 Given below are results from the regression analysis where the dependent variable is the number of weeks a worker is unemployed due to a layoff (Unemploy) and the independent variables are the age of the […]
PRST 324 Test 1
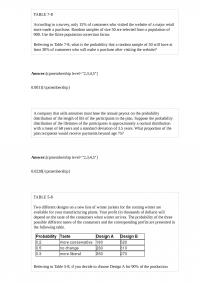
TABLE 7-8 According to a survey, only 15% of customers who visited the website of a major retail store made a purchase. Random samples of size 50 are selected from a population of 900. Use the finite population correction factor. […]
PRST 413 Final
TABLE 11-4 An agronomist wants to compare the crop yield of 3 varieties of chickpea seeds. She plants 15 fields, 5 with each variety. She then measures the crop yield in bushels per acre. Treating this as a completely randomized […]
PRST 448 Midterm
True or False: The Z score of a value measures how many standard deviations the value is from the mean. TABLE 8-17 A random sample of 100 stores from a large chain of 500 garden supply stores was selected to […]
PRST 461 TABLE 114An agronomist
TABLE 11-4 An agronomist wants to compare the crop yield of 3 varieties of chickpea seeds. She plants 15 fields, 5 with each variety. She then measures the crop yield in bushels per acre. Treating this as a completely randomized […]
PRST 623
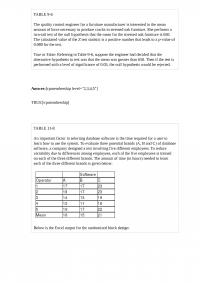
TABLE 9-6 The quality control engineer for a furniture manufacturer is interested in the mean amount of force necessary to produce cracks in stressed oak furniture. She performs a two-tail test of the null hypothesis that the mean for the […]

PRST 674 Quiz 1
True or False: TABLE 17-10 Given below are results from the regression analysis where the dependent variable is the number of weeks a worker is unemployed due to a layoff (Unemploy) and the independent variables are the age of the […]
PRST 734
A study at a college in the west coast reveals that, historically, 45% of the students are minority students. The expected percentage of minority students in their next group of freshmen is ________. TABLE 3-8 The time period from 2009 […]
PRST 749
TABLE 12-17 Three new different models of compact SUVs have just arrived at the market. You are interested in comparing the gas mileage performance of all three models to see if they are the same. A partial computer output for […]
PRST 765
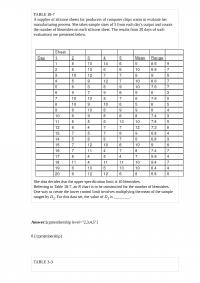
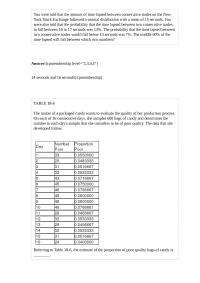
TABLE 18-7 A supplier of silicone sheets for producers of computer chips wants to evaluate her manufacturing process. She takes sample sizes of 5 from each day’s output and counts the number of blemishes on each silicone sheet. The results […]
PRST 781
TABLE 13-12 The manager of the purchasing department of a large saving and loan organization would like to develop a model to predict the amount of time (measured in hours) it takes to record a loan application. Data are collected […]
PRST 784
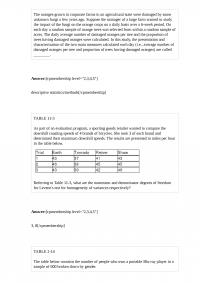
TABLE 19-5 The following payoff table shows profits associated with a set of 2 alternatives under 3 possible events. Suppose that the probability of Event 1 is 0.2, Event 2 is 0.5, and Event 3 is 0.3. Referring to Table […]
PRST 790
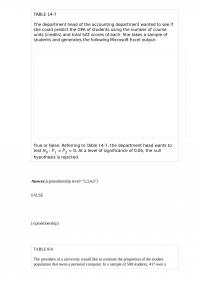
TABLE 14-7 The department head of the accounting department wanted to see if she could predict the GPA of students using the number of course units (credits) and total SAT scores of each. She takes a sample of students and […]
PRST 800 Quiz 2
You were told that the amount of time lapsed between consecutive trades on the New York Stock Exchange followed a normal distribution with a mean of 15 seconds. You were also told that the probability that the time lapsed between […]

PRST 815
True or False: TABLE 17-9 What are the factors that determine the acceleration time (in sec.) from 0 to 60 miles per hour of a car? Data on the following variables for 171 different vehicle models were collected: Accel Time: […]
PRST 831 Midterm
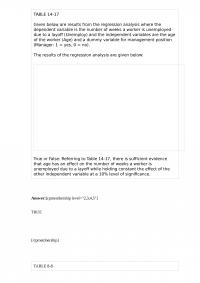
TABLE 14-17 Given below are results from the regression analysis where the dependent variable is the number of weeks a worker is unemployed due to a layo! (Unemploy) and the independent variables are the age of the worker (Age) and […]
PRST 855
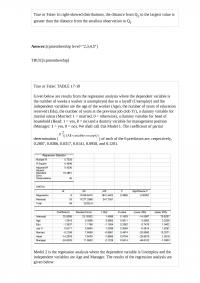
True or False: In right-skewed distributions, the distance from Q3 to the largest value is greater than the distance from the smallest observation to Q1. True or False: TABLE 17-10 Given below are results from the regression analysis where the […]
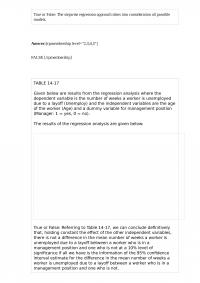
PRST 895 Quiz 1
True or False: The stepwise regression approach takes into consideration all possible models. TABLE 14-17 Given below are results from the regression analysis where the dependent variable is the number of weeks a worker is unemployed due to a layo! […]