
True or False: The t distribution allows the calculation of confidence intervals for
means for small samples when the population variance is not known, regardless of the
shape of the distribution in the population.
True or False: Referring to Table 14-16, there is enough evidence to
conclude that engine size makes a significant contribution to the
regression model in the presence of the other independent variable at
a 5% level of significance.
TABLE 14-16
What are the factors that determine the acceleration time (in sec.)
from 0 to 60 miles per hour of a car? Data on the following variables
for 30 different vehicle models were collected:
Y (Accel Time): Acceleration time in sec.
X1 (Engine Size): c.c.
X2 (Sedan): 1 if the vehicle model is a sedan and 0 otherwise
The regression results using acceleration time as the dependent
variable and the remaining variables as the independent variables are
presented below.

The various residual plots are as shown below.
The coefficient of partial determinations and are 0.3301,
and 0.0594, respectively.
The coefficient of determination for the regression model using each
of the 2 independent variables as the dependent variable and the
other independent variable as independent variables ( ) are,
respectively 0.0077, and 0.0077.
True or False: To gather opinions on the efficacy of U.S. foreign policies, a sample of
50 faculty members is selected from the pool of university professors who have taught
political science at the graduate level. This is an example of a judgment sample.
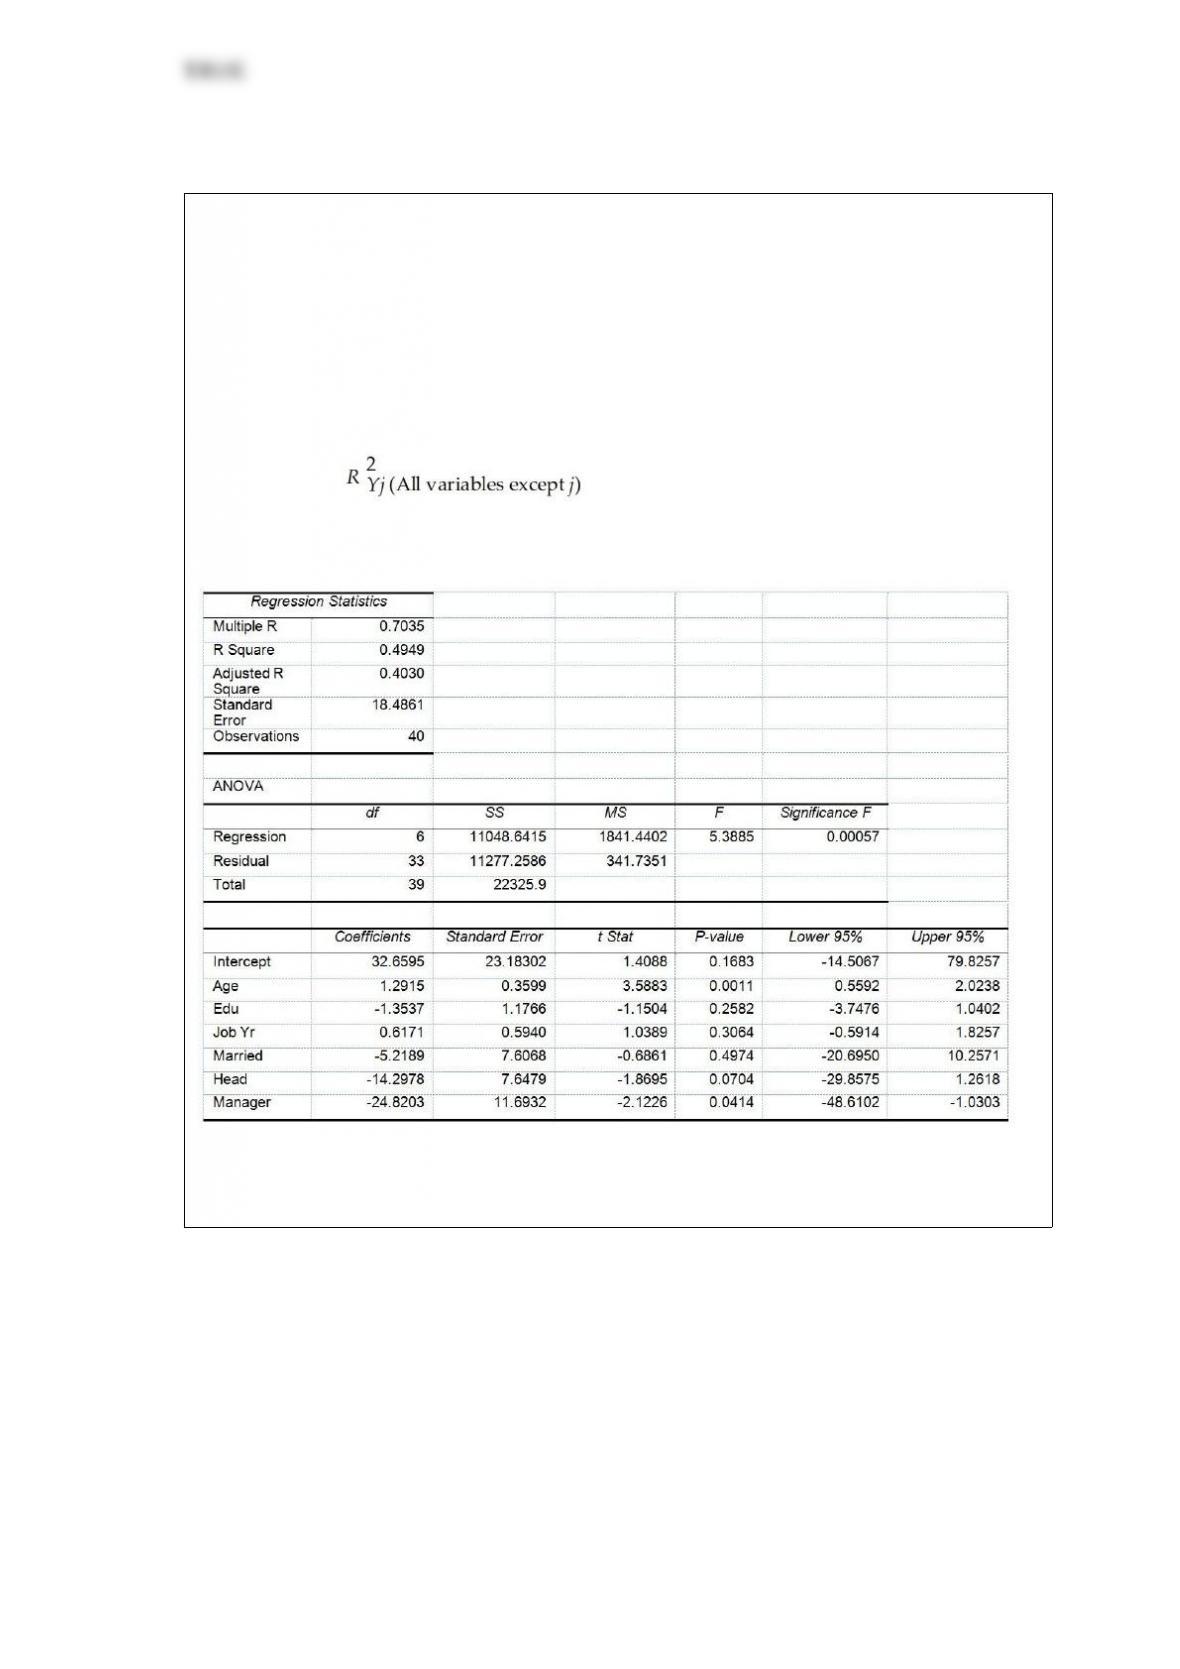
True or False: TABLE 17-10
Given below are results from the regression analysis where the dependent variable is
the number of weeks a worker is unemployed due to a layoff (Unemploy) and the
independent variables are the age of the worker (Age), the number of years of education
received (Edu), the number of years at the previous job (Job Yr), a dummy variable for
marital status (Married: 1 = married, 0 = otherwise), a dummy variable for head of
household (Head: 1 = yes, 0 = no) and a dummy variable for management position
(Manager: 1 = yes, 0 = no). We shall call this Model 1. The coefficient of partial
determination ( ) of each of the 6 predictors are, respectively,
0.2807, 0.0386, 0.0317, 0.0141, 0.0958, and 0.1201.
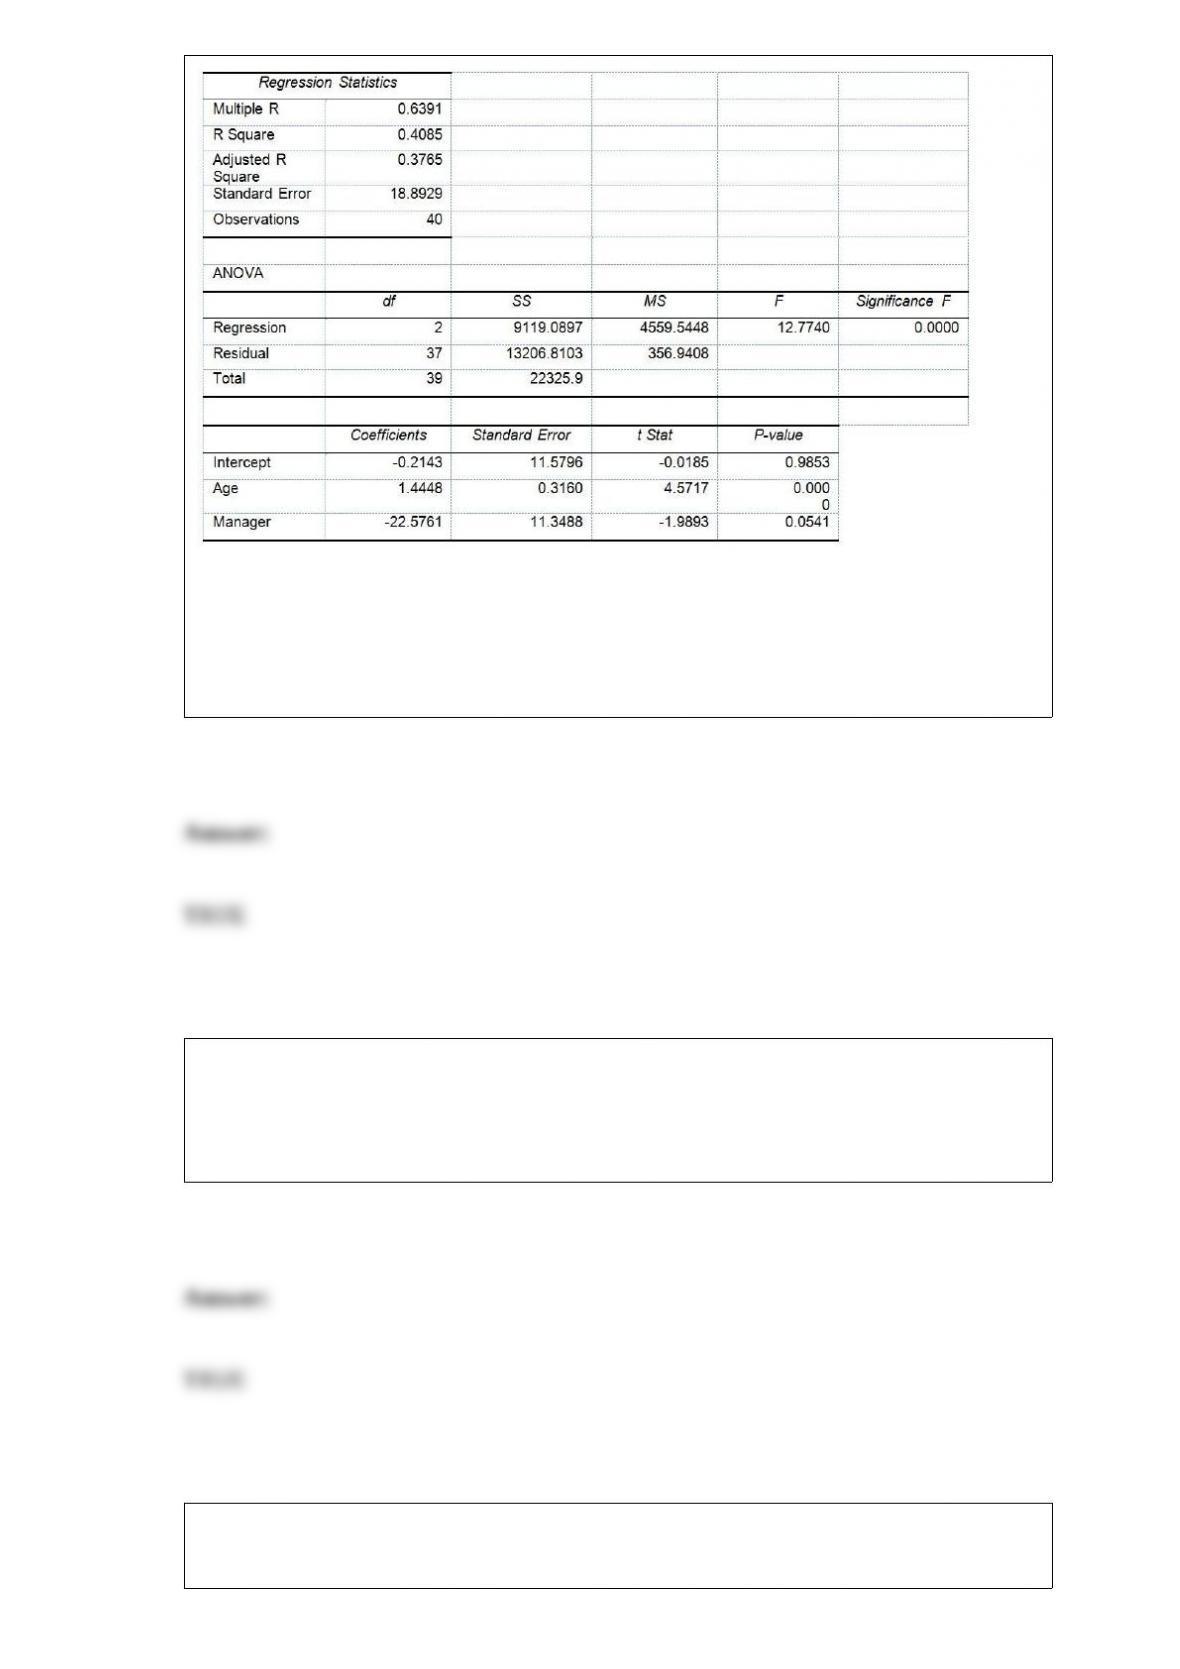
Model 2 is the regression analysis where the dependent variable is Unemploy and the
independent variables are Age and Manager. The results of the regression analysis are
given below:
Referring to Table 17-10, Model 1, you can conclude that, holding constant the effect of
the other independent variables, the number of years of education received has no
impact on the mean number of weeks a worker is unemployed due to a layoff at a 5%
level of significance if we use only the information of the 95% confidence interval
estimate forβ2.
True or False: If the amount of gasoline purchased per car at a large service station has
a population mean of 15 gallons and a population standard deviation of 4 gallons, and a
random sample of 64 cars is selected, there is approximately a 95.44% chance that the
sample mean will be between 14 and 16 gallons.
TABLE 11-3
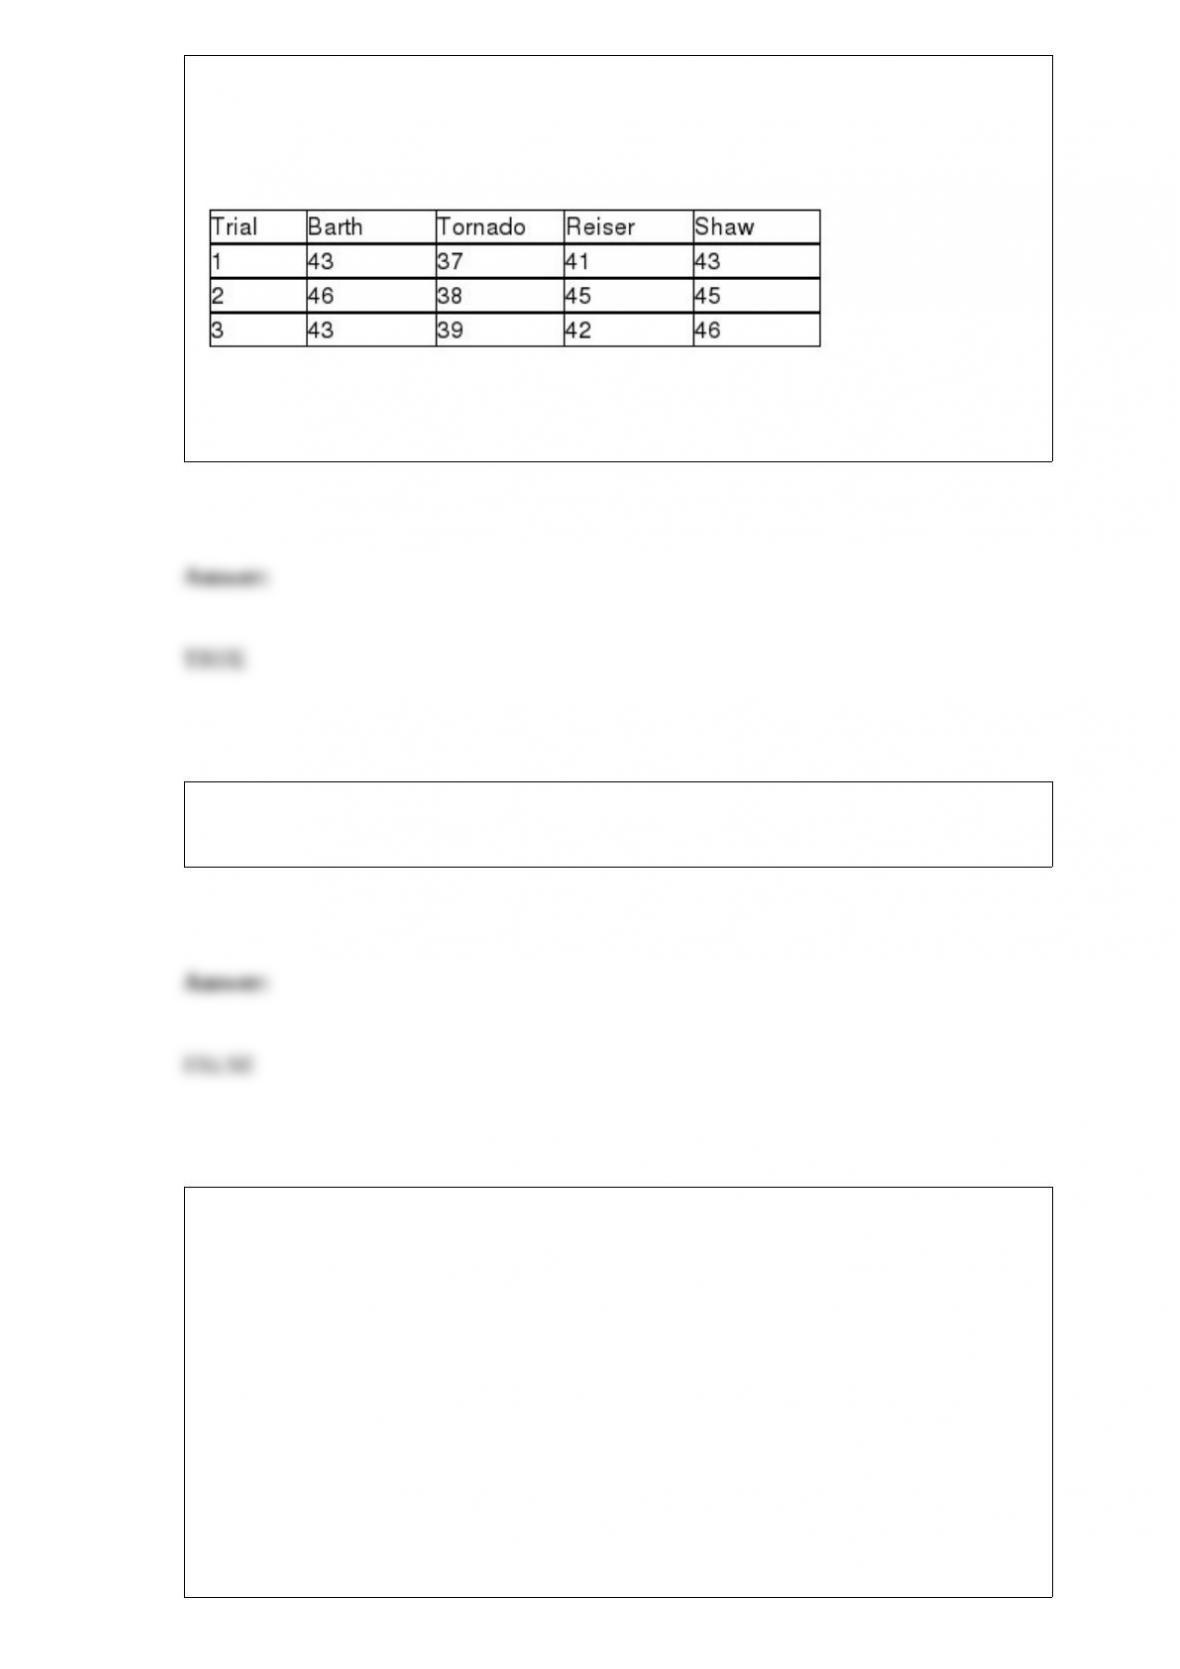
As part of an evaluation program, a sporting goods retailer wanted to compare the
downhill coasting speeds of 4 brands of bicycles. She took 3 of each brand and
determined their maximum downhill speeds. The results are presented in miles per hour
in the table below.
True or False: Referring to Table 11-3, the test is robust to the violation of the
assumption that the population of speeds is normally distributed.
True or False: The grade level (K-12) of a student is an example of a nominal scaled
variable.
TABLE 1-1
The manager of the customer service division of a major consumer electronics company
is interested in determining whether the customers who have purchased a Blu-ray
player made by the company over the past 12 months are satisfied with their products.
Referring to Table 1-1, the possible responses to the question “How many people are
there in your household?” are values from a
A) discrete numerical variable.
B) continuous numerical variable.

C) categorical variable.
D) table of random numbers.
Blossom’s Flowers purchases roses for sale for Valentine’s Day. The roses are purchased
for $10 a dozen and are sold for $20 a dozen. Any roses not sold on Valentine’s Day can
be sold for $5 per dozen. The owner will purchase 1 of 3 amounts of roses for
Valentine’s Day: 100, 200, or 400 dozen roses. The payoff for buying and selling 400
dozen roses at the full price is
A) $12,000.
B) $6,000.
C) $4,000.
D) It cannot be determined.
The Tampa International Airport (TIA) has been criticized for the waiting times
associated with departing flights. While the critics acknowledge that many flights have
little or no waiting times, their complaints deal more specifically with the longer waits
attributed to some flights. The critics are interested in showing, mathematically, exactly
what the problems are. Which type of distribution would best model the waiting times
of the departing flights at TIA?
A) Uniform distribution
B) Binomial distribution
C) Normal distribution
D) Exponential distribution

You have collected data on the responses to two questions asked in a survey of 40
college students majoring in business’“”What is your gender (Male = M; Female = F)?”
and “What is your major (Accountancy = A; Computer Information Systems = C;
Marketing = M)?” Which of the following is the best for presenting the data?
A) a contingency table
B) a stem-and-leaf display
C) a time-series plot
D) a Pareto chart
Referring to Table 14-3, when the economist used a simple linear regression model with
consumption as the dependent variable and GDP as the independent variable, he
obtained an r2 value of 0.971. What additional percentage of the total variation of
consumption has been explained by including aggregate prices in the multiple
regression?
TABLE 14-3
An economist is interested to see how consumption for an economy (in $ billions) is
influenced by gross domestic product ($ billions) and aggregate price (consumer price
index). The Microsoft Excel output of this regression is partially reproduced below.
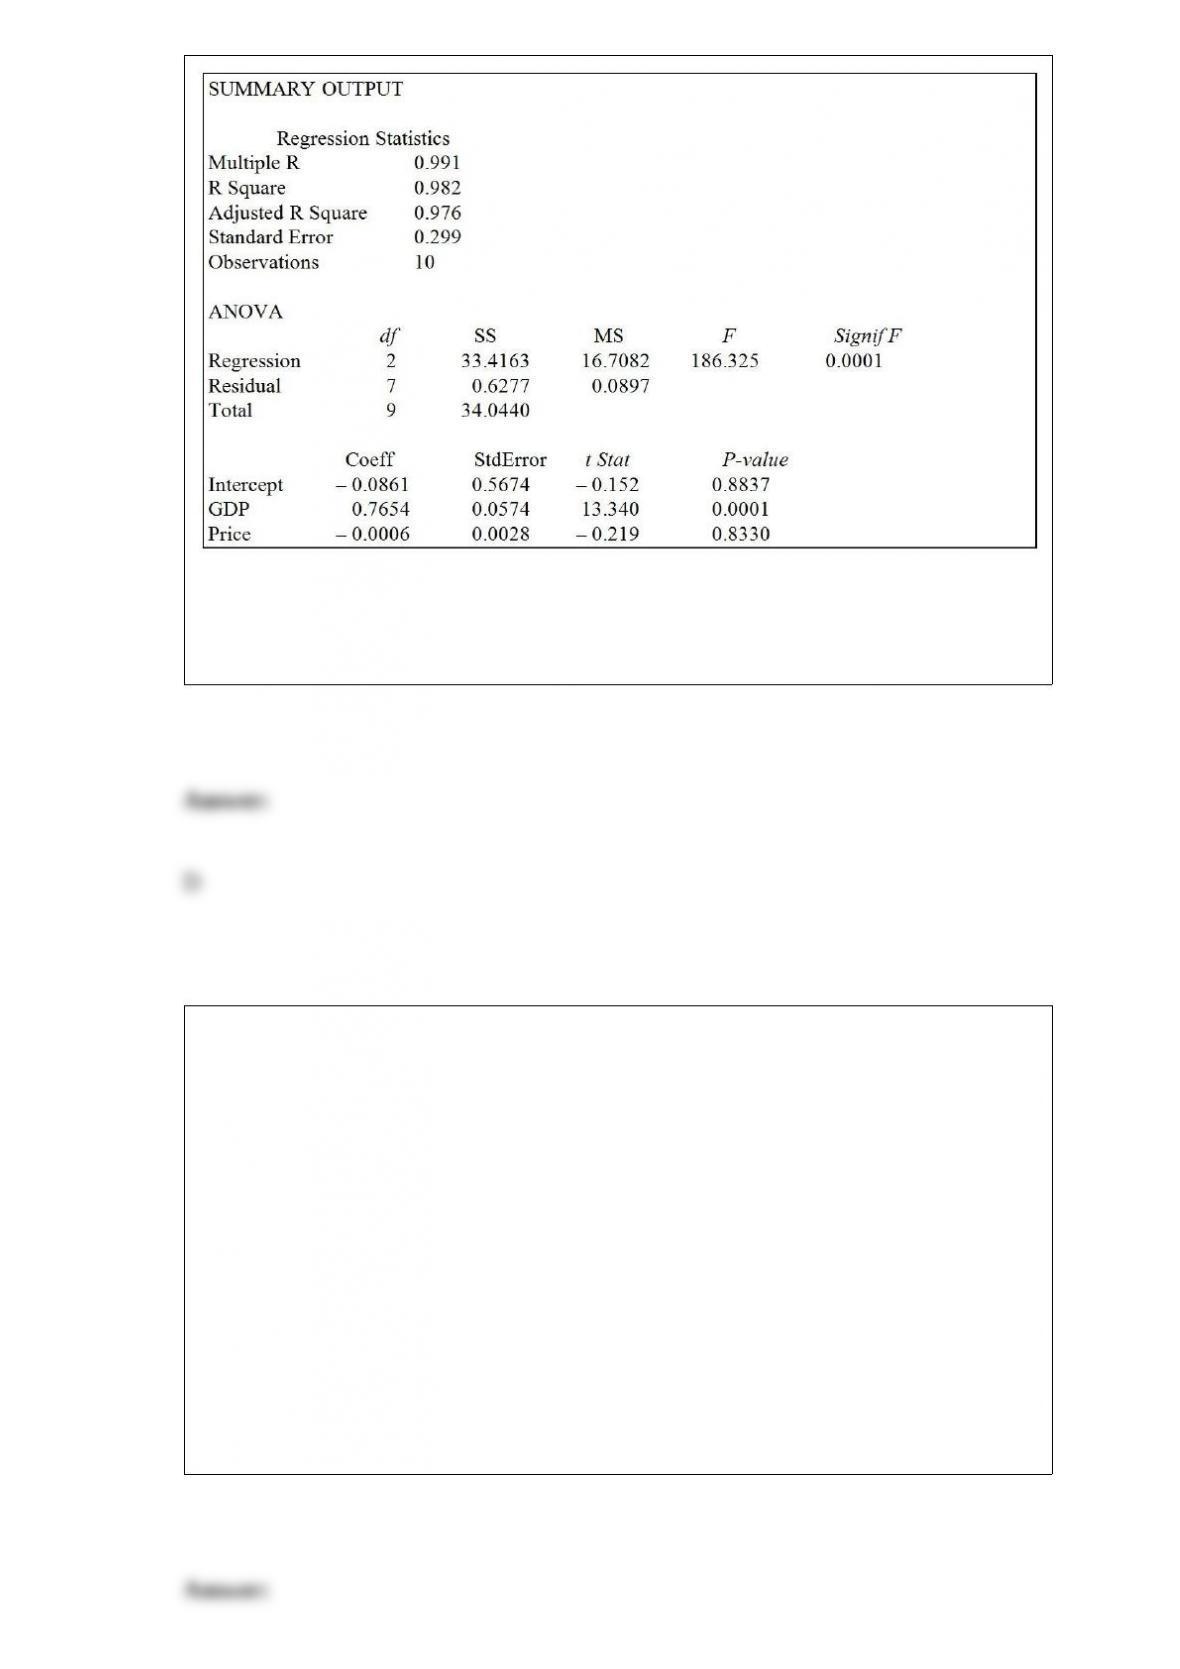
A) 98.2
B) 11.1
C) 2.8
D) 1.1
The marketing manager for an automobile manufacturer is interested in determining the
proportion of new compact-car owners who would have purchased a side curtain air bag
if it had been available for an additional cost of $300. The manager believes from
previous information that the proportion is 0.30. Suppose that a survey of 200 new
compact-car owners is selected and 79 indicate that they would have purchased the side
curtain air bags. If you were to conduct a test to determine whether there is evidence
that the proportion is different from 0.30, which test would you use?
A) Z test of a population mean
B) Z test of a population proportion
C) t test of population mean
D) t test of a population proportion
The probability that a new advertising campaign will increase sales is assessed as being
0.80. The probability that the cost of developing the new ad campaign can be kept
within the original budget allocation is 0.40. Assuming that the two events are
independent, the probability that the cost is not kept within budget or the campaign will
not increase sales is
A) 0.12.
B) 0.32.
C) 0.68.
D) 0.88.
TABLE 10-2
A researcher randomly sampled 30 graduates of an MBA program and recorded data
concerning their starting salaries. Of primary interest to the researcher was the effect of
gender on starting salaries. The result of the pooled-variance t-test of the mean salaries
of the females (Population 1) and males (Population 2) in the sample is given below.
Referring to Table 10-2, the researcher was attempting to show statistically that the
female MBA graduates have a significantly lower mean starting salary than the male
MBA graduates. Which of the following is an appropriate alternative hypothesis?
A) H1 : females > males
B) H1 : females < males
C) H1 : females ≠males
D) H1 : females = males
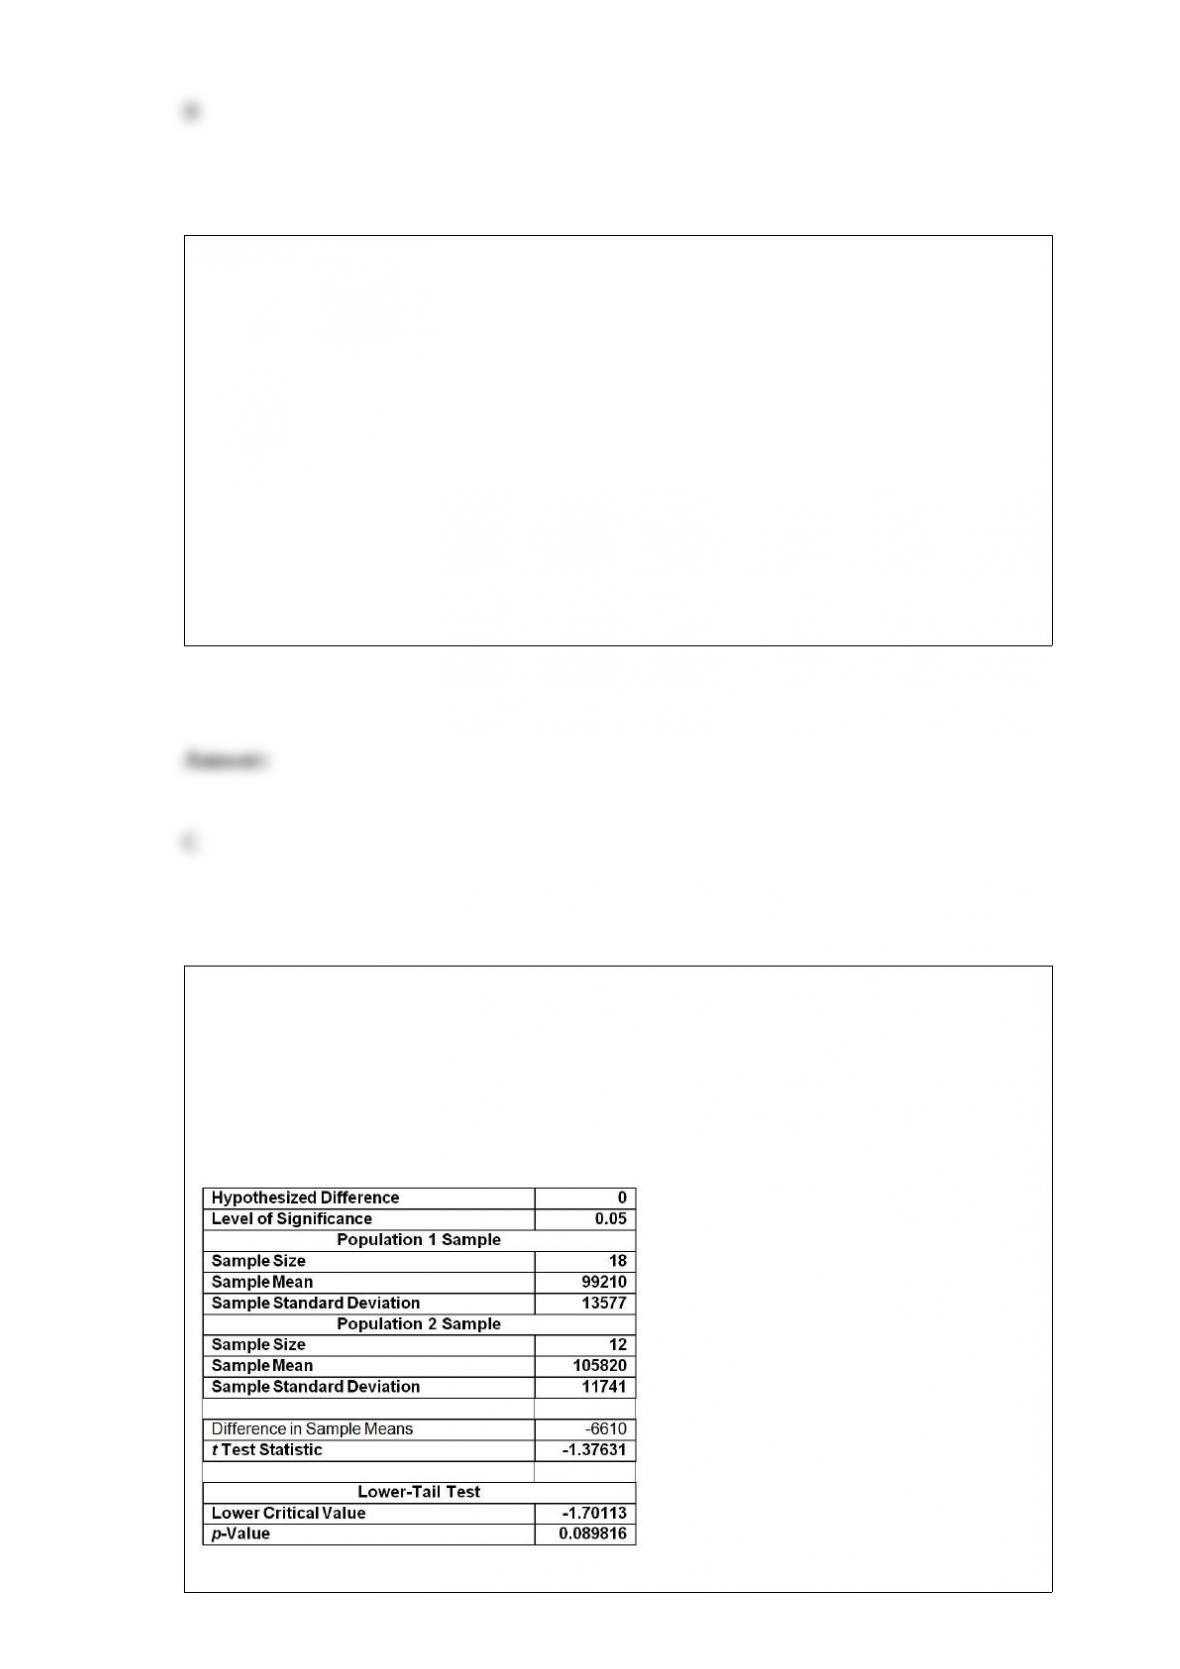
TABLE 10-3
A real estate company is interested in testing whether the mean time that families in
Gotham have been living in their current homes is less than families in Metropolis.
Assume that the two population variances are equal. A random sample of 100 families
from Gotham and a random sample of 150 families in Metropolis yield the following
data on length of residence in current homes.
Gotham: G = 35 months, = 900 Metropolis: M = 50 months, = 1050
Referring to Table 10-3, what is the estimated standard error of the difference between
the 2 sample means?
A) 4.06
B) 5.61
C) 8.01
D) 16.00

An economist is interested to see how consumption for an economy (in $ billions) is
influenced by gross domestic product ($ billions) and aggregate price (consumer price
index). Annual data from 30 years were collected. Which of the following would be the
most appropriate analysis to perform?
A) Simple linear regression
B) Multiple linear regression
C) Exponential smoothing
D) Autoregressive modeling for trend fitting and forecasting
Suppose that past history shows that 60% of college students prefer Brand C cola. A
sample of 5 students is to be selected. The probability that exactly 4 prefer brand C is
________.
TABLE 10-4
Two samples each of size 25 are taken from independent populations assumed to be
normally distributed with equal variances. The first sample has a mean of 35.5 and
standard deviation of 3.0 while the second sample has a mean of 33.0 and standard
deviation of 4.0.
Referring to Table 10-4, the p-value for a one-tail test (in the hypothesized direction) is
________.
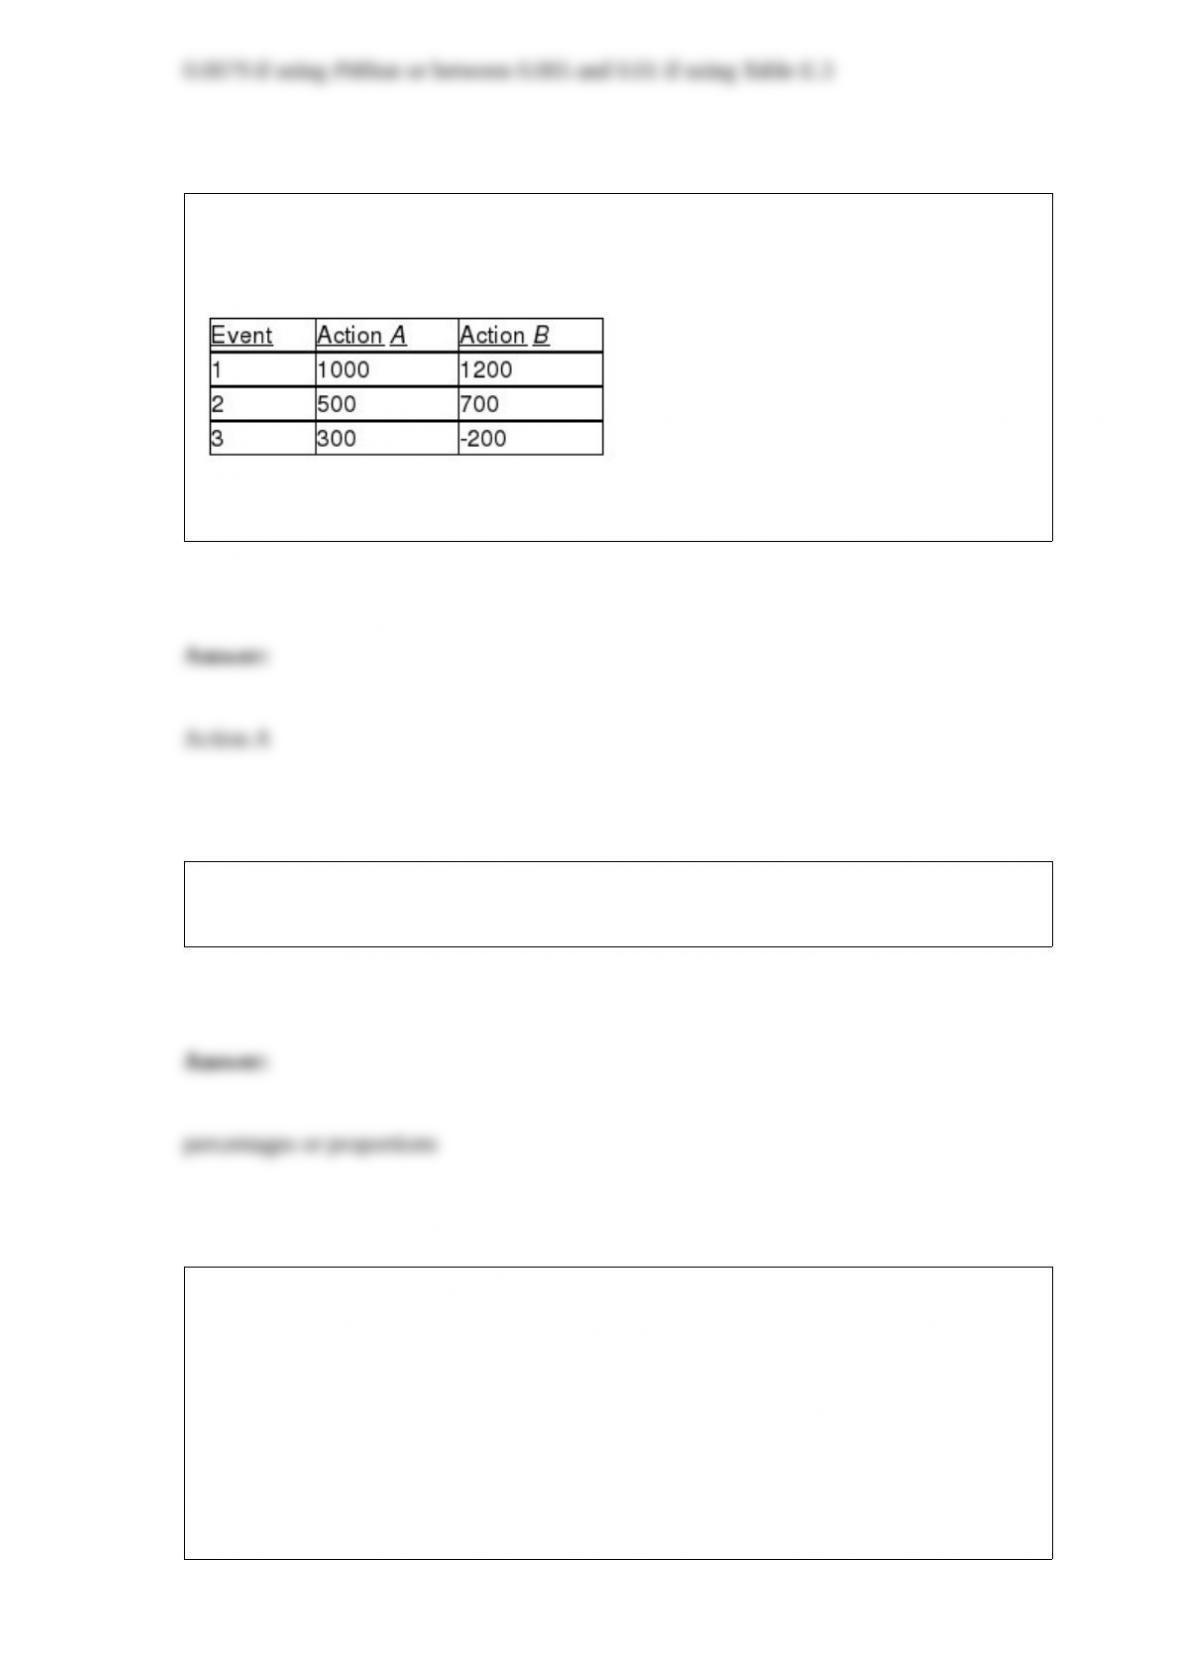
TABLE 19-5
The following payoff table shows profits associated with a set of 2 alternatives under 3
possible events.
Suppose that the probability of Event 1 is 0.2, Event 2 is 0.5, and Event 3 is 0.3.
Referring to Table 19-5, what is the optimal action using EOL?
Relationships in a contingency table can be examined more fully if the frequencies are
converted into ________.
TABLE 9-1
Microsoft Excel was used on a set of data involving the number of defective items
found in a random sample of 46 cases of light bulbs produced during a morning shift at
a plant. A manager wants to know if the mean number of defective bulbs per case is
greater than 20 during the morning shift. She will make her decision using a test with a
level of significance of 0.10. The following information was extracted from the
Microsoft Excel output for the sample of 46 cases:
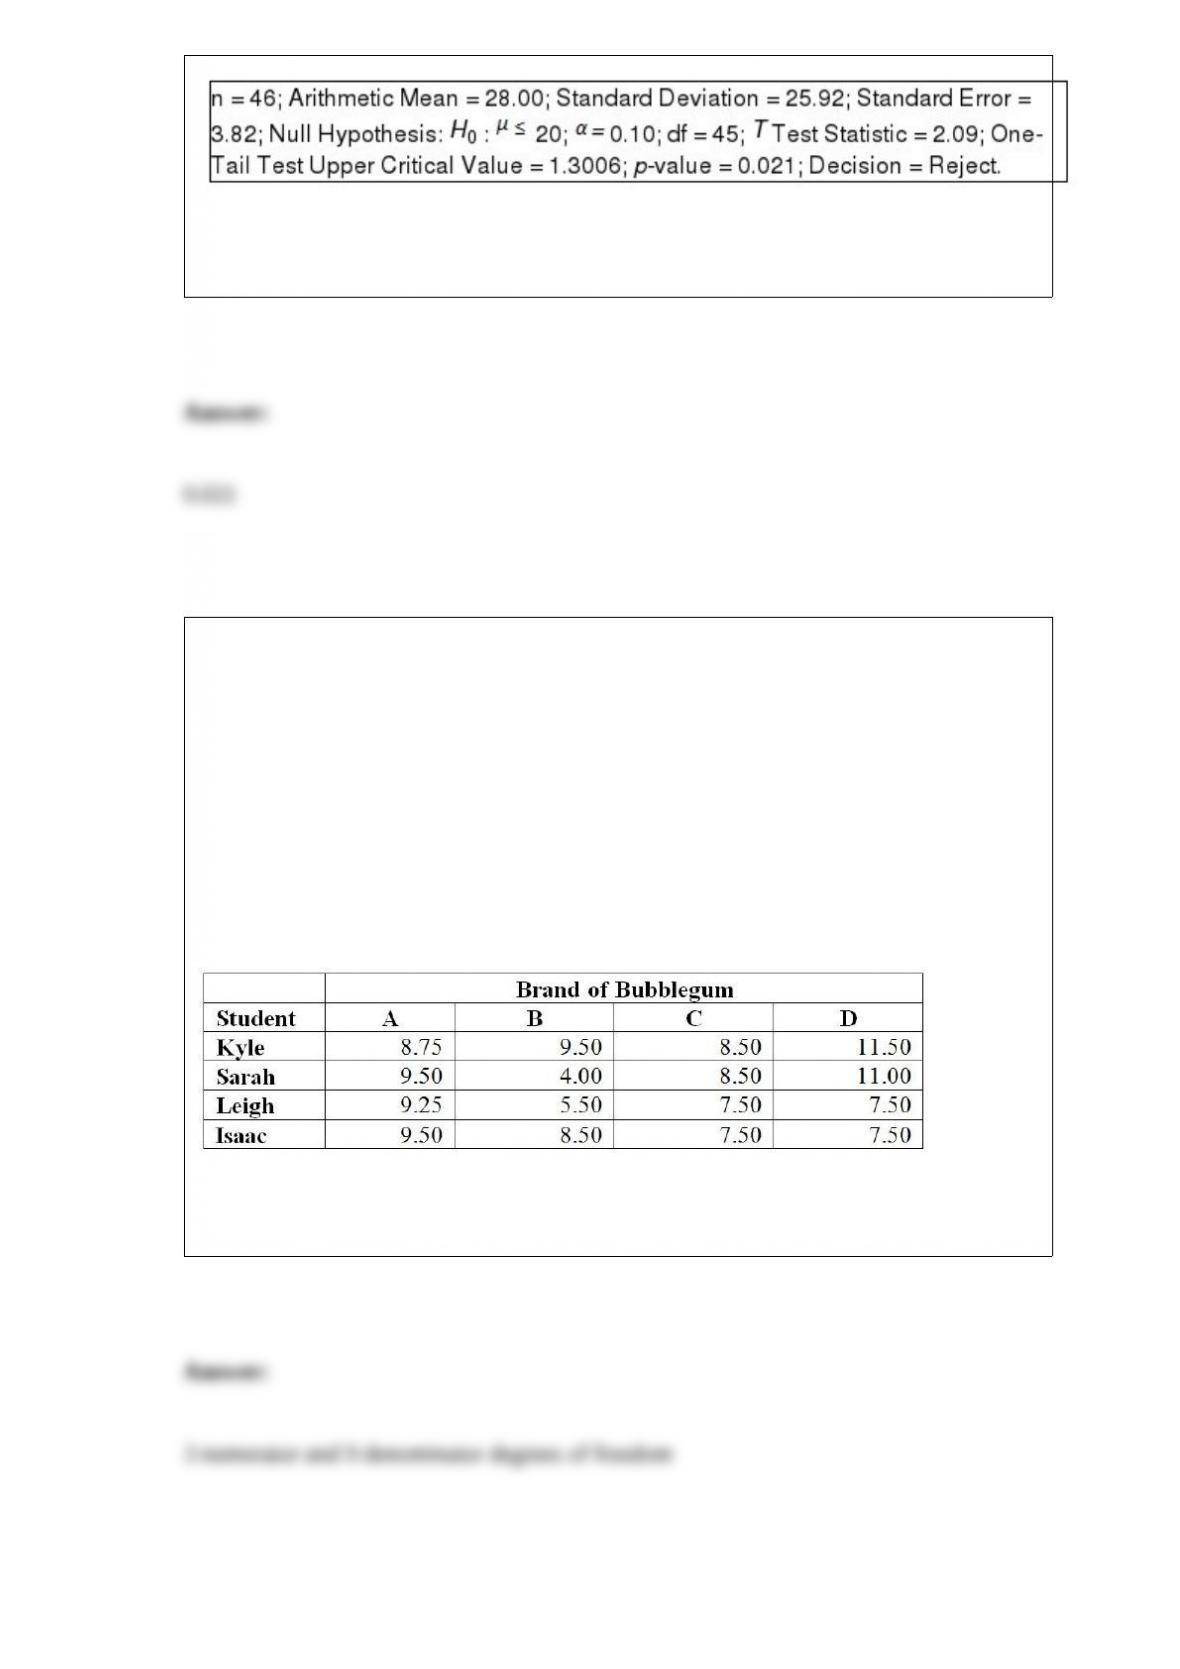
Referring to Table 9-1, the lowest level of significance at which the null hypothesis can
be rejected is ________.
TABLE 11-11
A student team in a business statistics course designed an experiment to investigate
whether the brand of bubblegum used affected the size of bubbles they could blow. To
reduce the person-to-person variability, the students decided to use a randomized block
design using themselves as blocks.
Four brands of bubblegum were tested. A student chewed two pieces of a brand of gum
and then blew a bubble, attempting to make it as big as possible. Another student
measured the diameter of the bubble at its biggest point. The following table gives the
diameters of the bubbles (in inches) for the 16 observations.
Referring to Table 11-11, what are the degrees of freedom of the F test statistic for
testing the block effects?

Referring to Table 14-8, the estimated change in the mean salary (in
$1,000) when an employee is a year older holding experience
constant is ________.TABLE 14-8
A financial analyst wanted to examine the relationship between salary
(in $1,000) and 2 variables: age
(X1 = Age) and experience in the field (X2 = Exper). He took a sample
of 20 employees and obtained the following Microsoft Excel output:
Also, the sum of squares due to the regression for the model that
includes only Age is 5022.0654 while the sum of squares due to the
regression for the model that includes only Exper is 125.9848.
TABLE 13-3
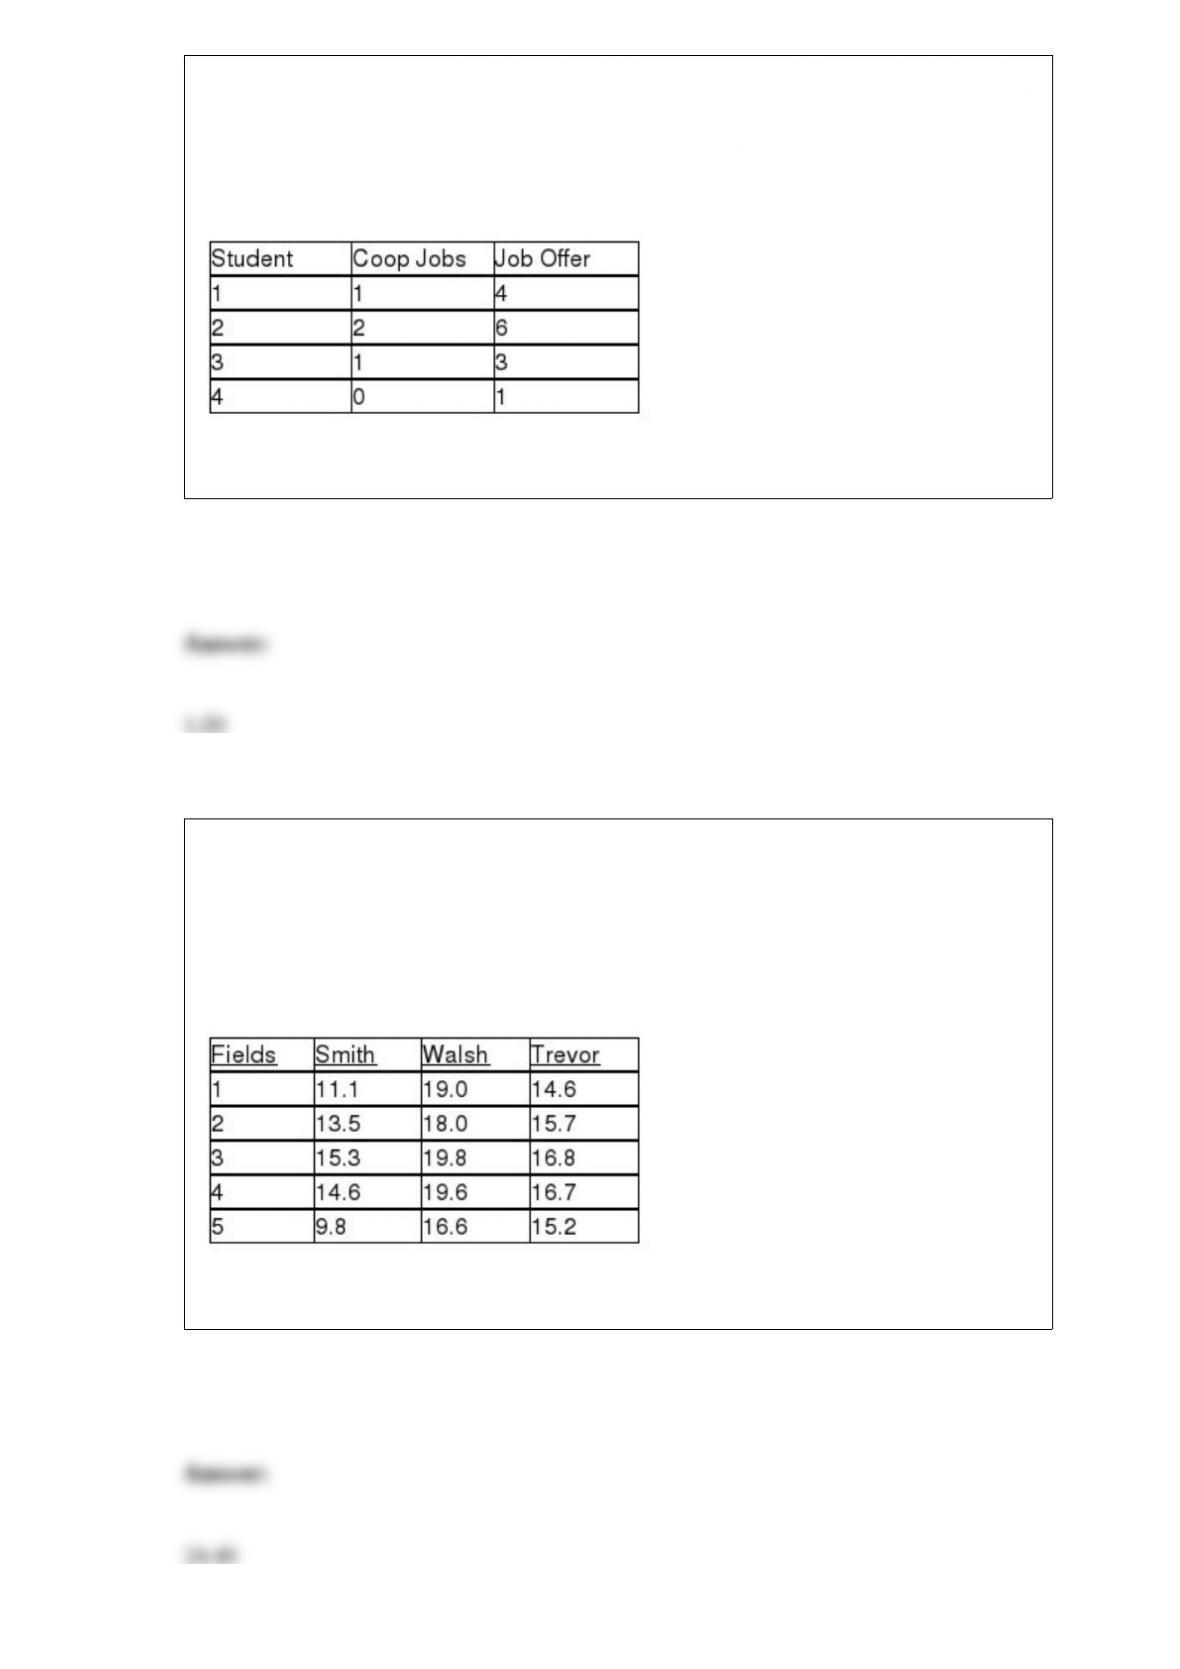
The director of cooperative education at a state college wants to examine the effect of
cooperative education job experience on marketability in the work place. She takes a
random sample of 4 students. For these 4, she finds out how many times each had a
cooperative education job and how many job offers they received upon graduation.
These data are presented in the table below.
Referring to Table 13-3, the least squares estimate of the Y-intercept is ________.
TABLE 11-10
An agronomist wants to compare the crop yield of 3 varieties of chickpea seeds. She
plants all 3 varieties of the seeds on each of 5 different patches of fields. She then
measures the crop yield in bushels per acre. Treating this as a randomized block design,
the results are presented in the table that follows.
Referring to Table 11-10, the among-block variation or SSBL is ________.

Referring to Table 14-8, the coefficient of partial determination is
________.TABLE 14-8
A financial analyst wanted to examine the relationship between salary
(in $1,000) and 2 variables: age
(X1 = Age) and experience in the field (X2 = Exper). He took a sample
of 20 employees and obtained the following Microsoft Excel output:
Also, the sum of squares due to the regression for the model that
includes only Age is 5022.0654 while the sum of squares due to the
regression for the model that includes only Exper is 125.9848.
TABLE 18-4
A factory supervisor is concerned that the time it takes workers to complete an
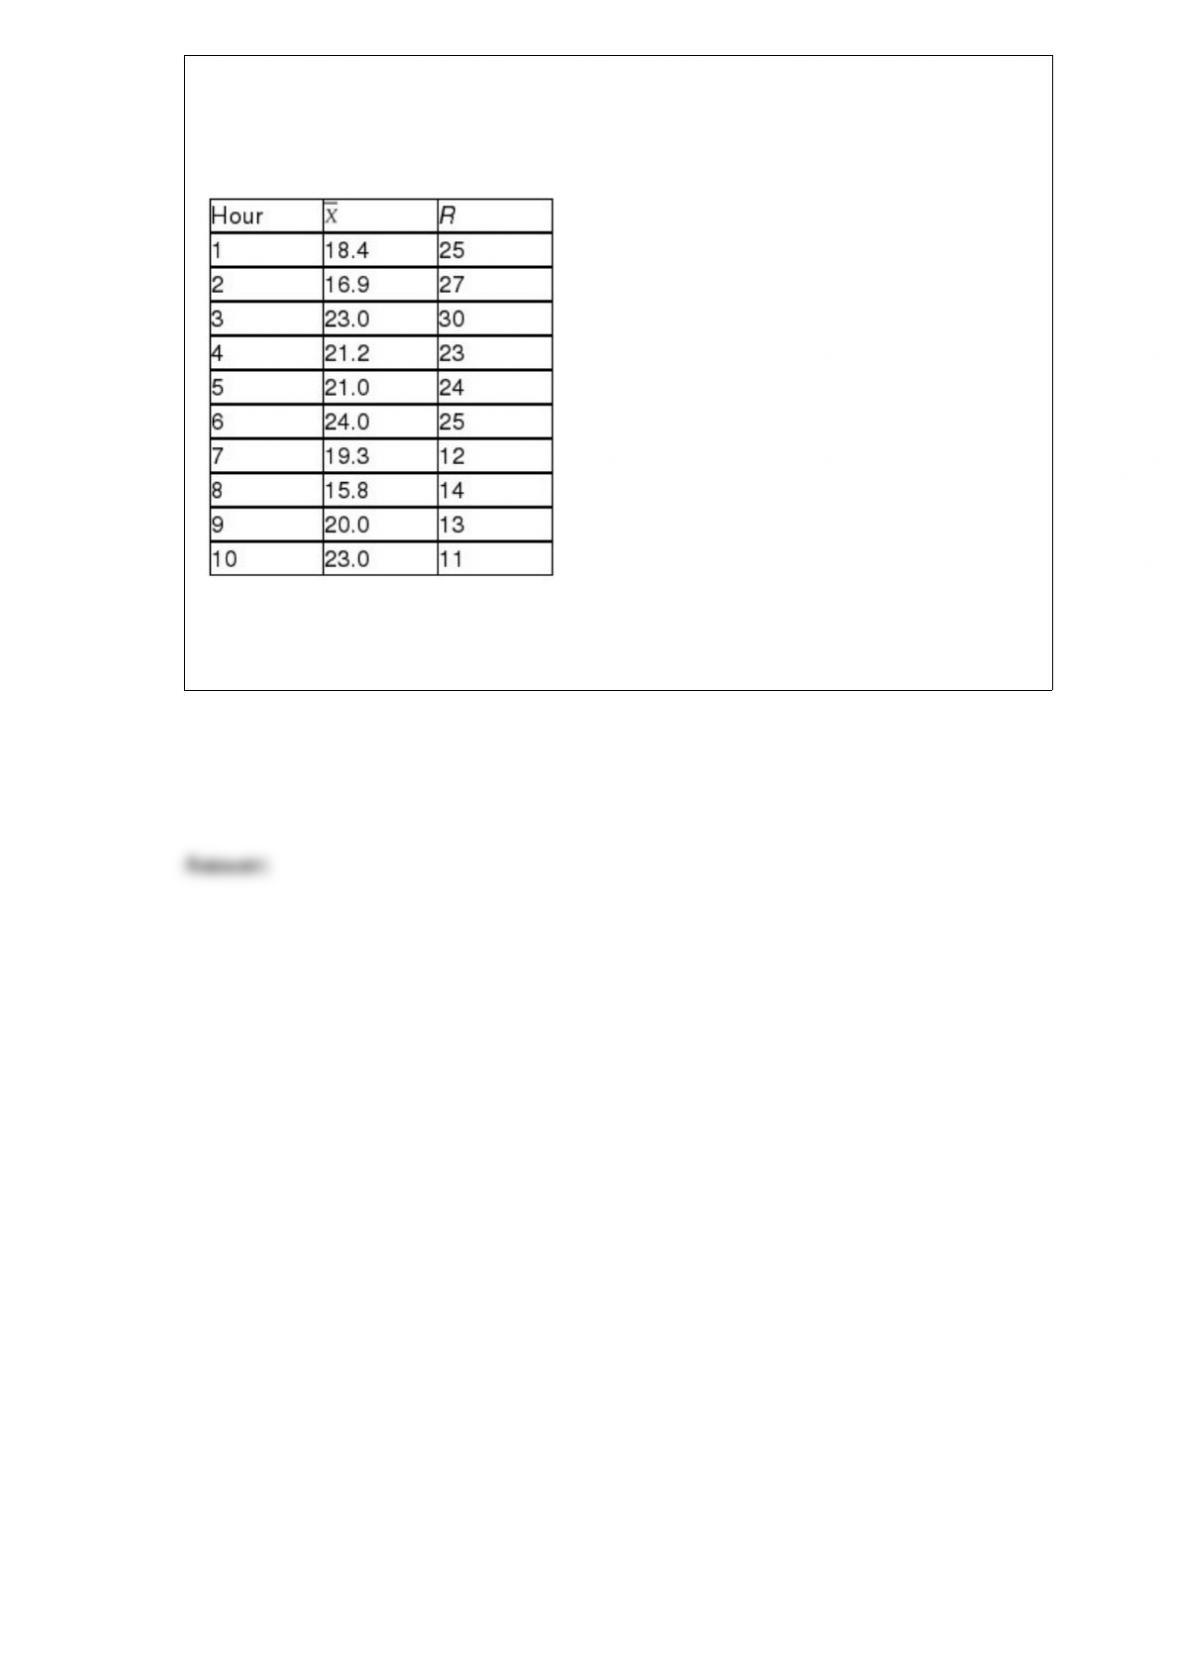
important production task (measured in seconds) is too erratic and adversely affects
expected profits. The supervisor proceeds by randomly sampling 5 individuals per hour
for a period of 10 hours. The sample mean and range for each hour are listed below.
She also decides that lower and upper specification limit for the critical-to-quality
variable should be 10 and 30 seconds, respectively.
Referring to Table 18-4, what is the value of the CPL index?