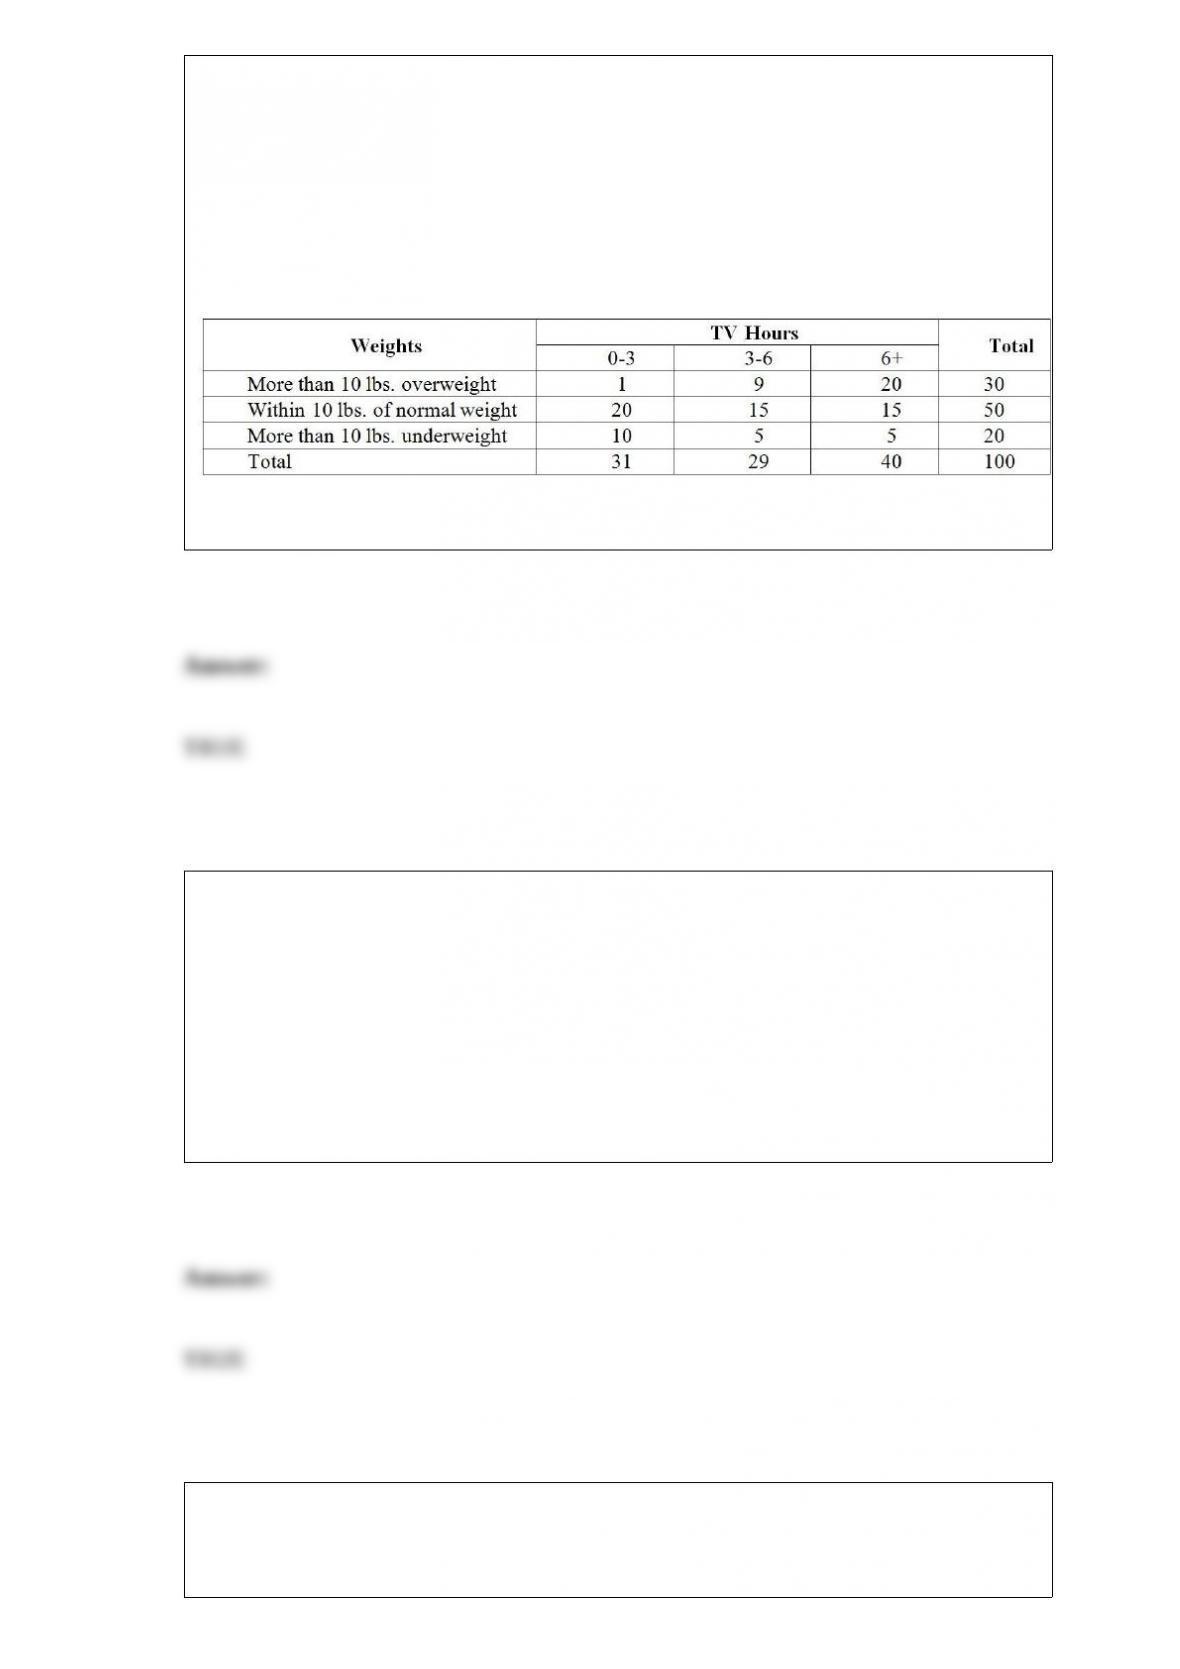
TABLE 12-13
Recent studies have found that American children are more obese than in the past. The
amount of time children spent watching television has received much of the blame. A
survey of 100 ten-year-olds revealed the following with regards to weights and average
number of hours a day spent watching television. We are interested in testing whether
the mean number of hours spent watching TV and weights are independent at 1% level
of significance.
True or False: Referring to Table 12-13, the test is always a one-tail test.
TABLE 8-7
A hotel chain wants to estimate the mean number of rooms rented daily in a given
month. The population of rooms rented daily is assumed to be normally distributed for
each month with a standard deviation of 240 rooms. During February, a sample of 25
days has a sample mean of 370 rooms.
True or False: Referring to Table 8-7, the parameter of interest is the mean number of
rooms rented daily in a given month.
True or False: The Analysis of Proportion (ANOP) is more appropriate if you want to
identify the group(s) that has(have) a higher or lower proportion than the overall
average proportion while the chi-square test for the difference among more than two

proportions is more appropriate when you just want to see if the proportions of all the
different groups are the same.
True or False: The opinions (classified as “for,” “neutral,” or “against”) of a sample of
200 people were broken down by gender about the latest congressional plan to
eliminate anti-trust exemptions for professional baseball. You can present this
information using a scatter plot.
TABLE 9-9
The president of a university claimed that the entering class this year appeared to be
larger than the entering class from previous years but their mean SAT score is lower
than previous years. He took a sample of 20 of this year’s entering students and found
that their mean SAT score is 1,501 with a standard deviation of 53. The university’s
record indicates that the mean SAT score for entering students from previous years is
1,520. He wants to find out if his claim is supported by the evidence at a 5% level of
significance.
True or False: Referring to Table 9-9, the null hypothesis would be rejected.
True or False: If P(A and B) = 0, then A and B must be collectively exhaustive.
True or False: Multiple regression is the process of using several independent variables
to predict a number of dependent variables.
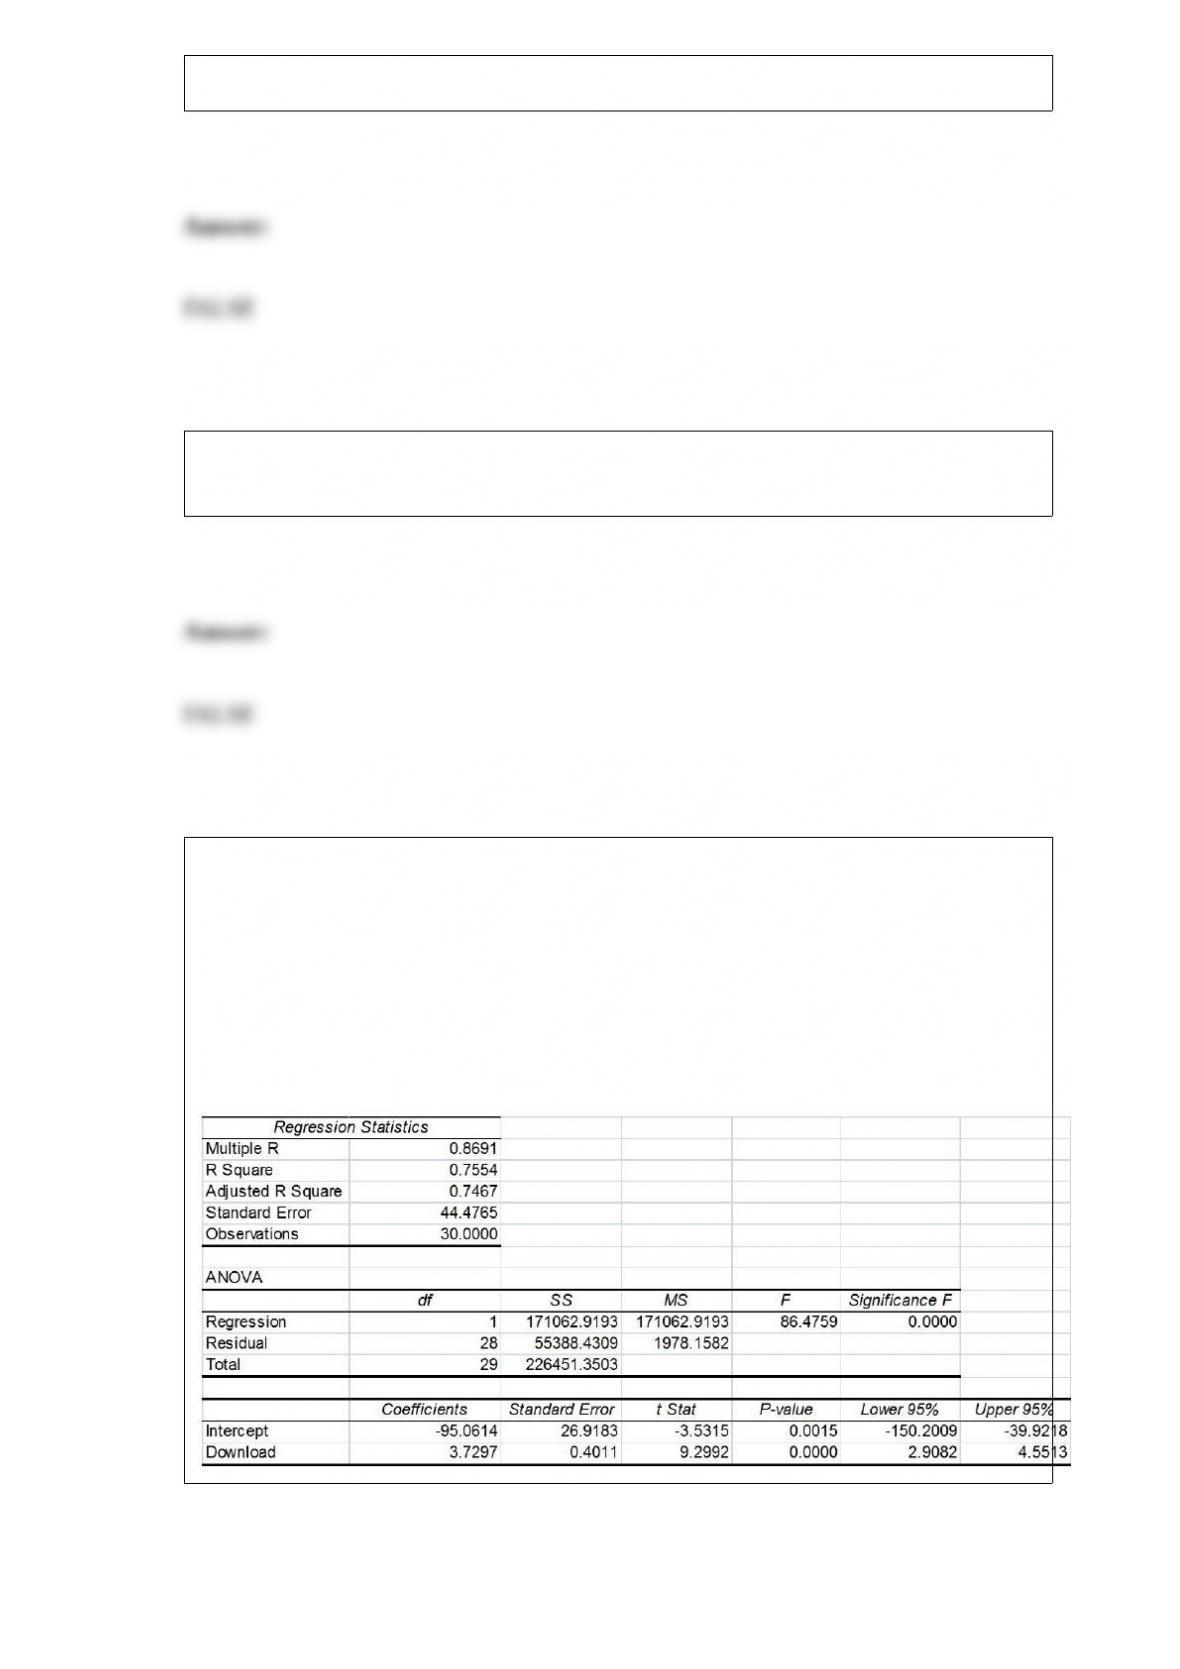
TABLE 13-11
A computer software developer would like to use the number of downloads (in
thousands) for the trial version of his new shareware to predict the amount of revenue
(in thousands of dollars) he can make on the full version of the new shareware.
Following is the output from a simple linear regression along with the residual plot and
normal probability plot obtained from a data set of 30 different sharewares that he has
developed:
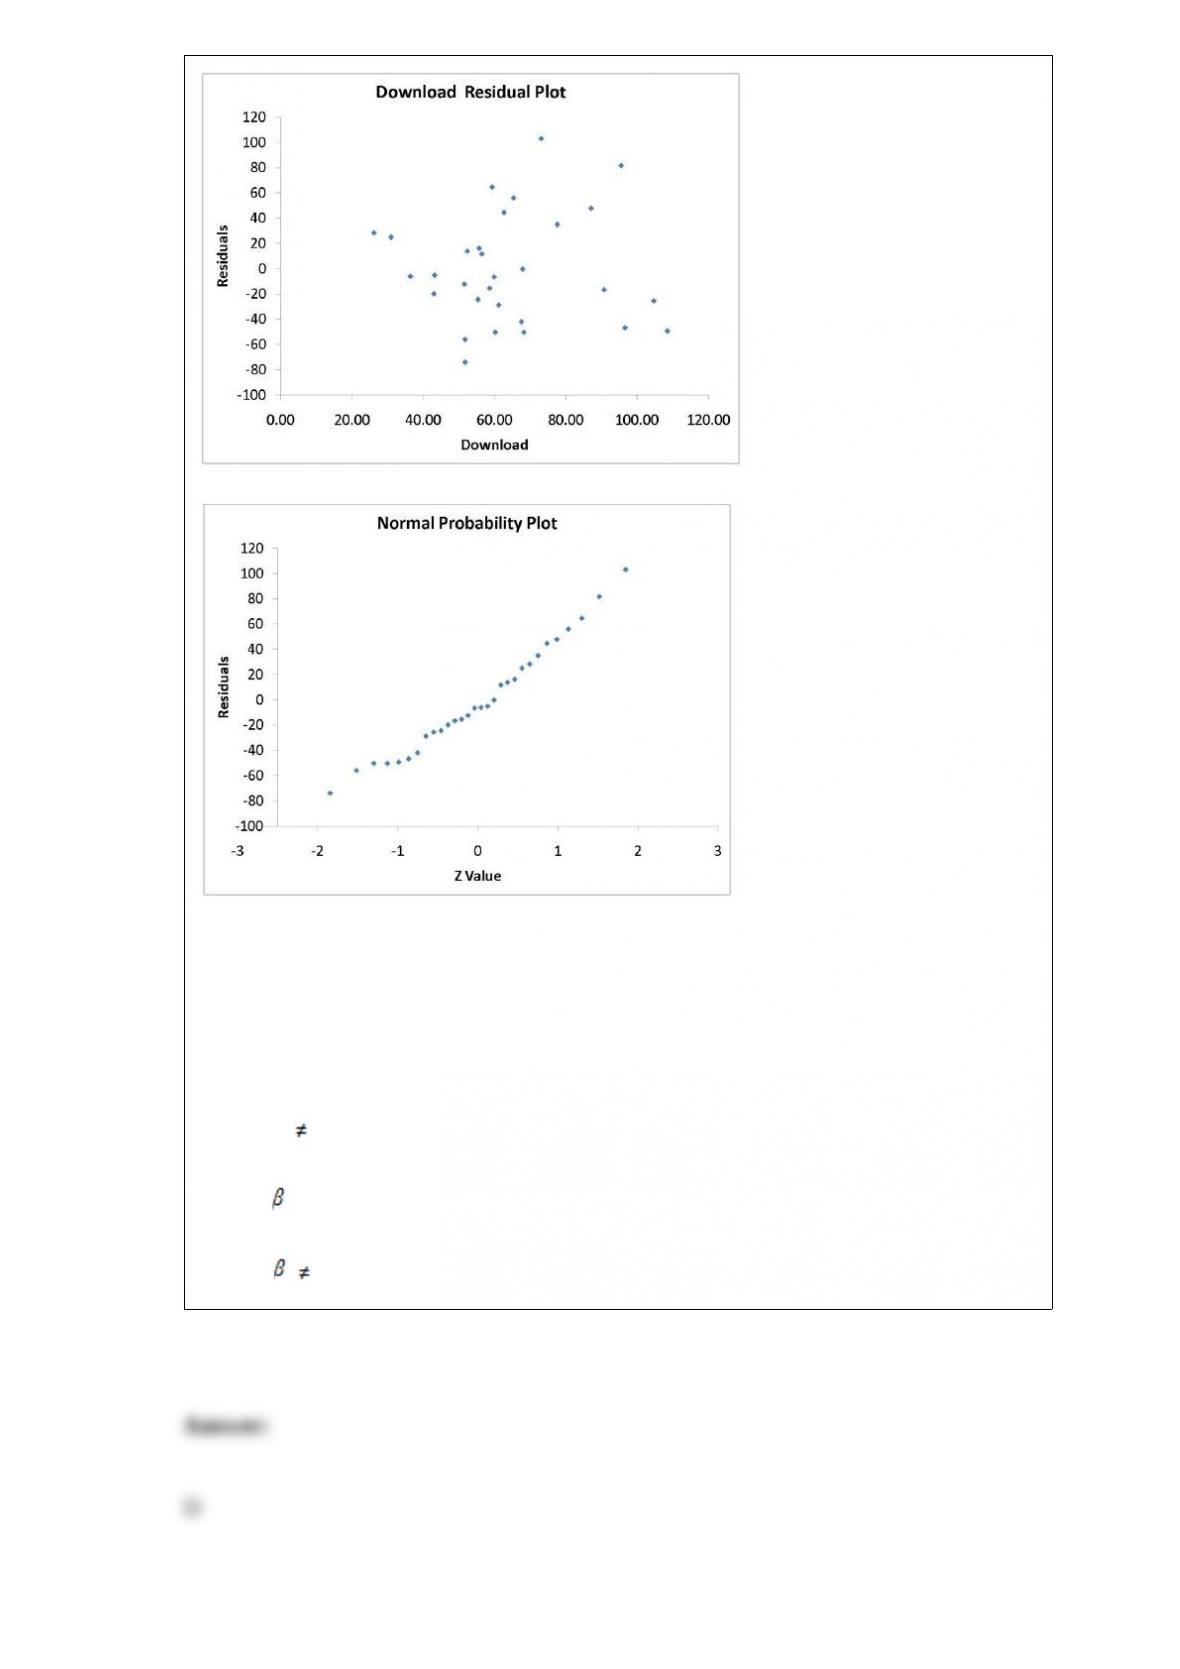
Referring to Table 13-11, which of the following is the correct alternative hypothesis for
testing whether there is a linear relationship between revenue and the number of
downloads?
A) H1 : b1 = 0
B) H1 : b1 0
C) H1 : 1 = 0
D) H1 : 1 0

The overall upward or downward pattern of the data in an annual time series will be
contained in the ________ component.
A) trend
B) cyclical
C) irregular
D) seasonal
A Type I error is committed when
A) you reject a null hypothesis that is true.
B) you don’t reject a null hypothesis that is true.
C) you reject a null hypothesis that is false.
D) you don’t reject a null hypothesis that is false.
Every spring semester, the School of Business coordinates with local business leaders a
luncheon for graduating seniors, their families, and friends. Corporate sponsorship pays
for the lunches of each of the seniors, but students have to purchase tickets to cover the
cost of lunches served to guests they bring with them. Data on the number of guests
each graduating senior invited to the luncheon from 500 graduating seniors last year
were collected. Based on this information, which of the following will you construct to
learn about the percentage of seniors who will bring at least one guest to the luncheon?
A) Confidence interval estimate for the total using the Student’s t distribution
B) Confidence interval estimate for the mean using the Student’s t distribution
C) Confidence interval estimate for the proportion using the standard normal
distribution
D) Confidence interval estimate for the difference between two means using the
standard normal distribution
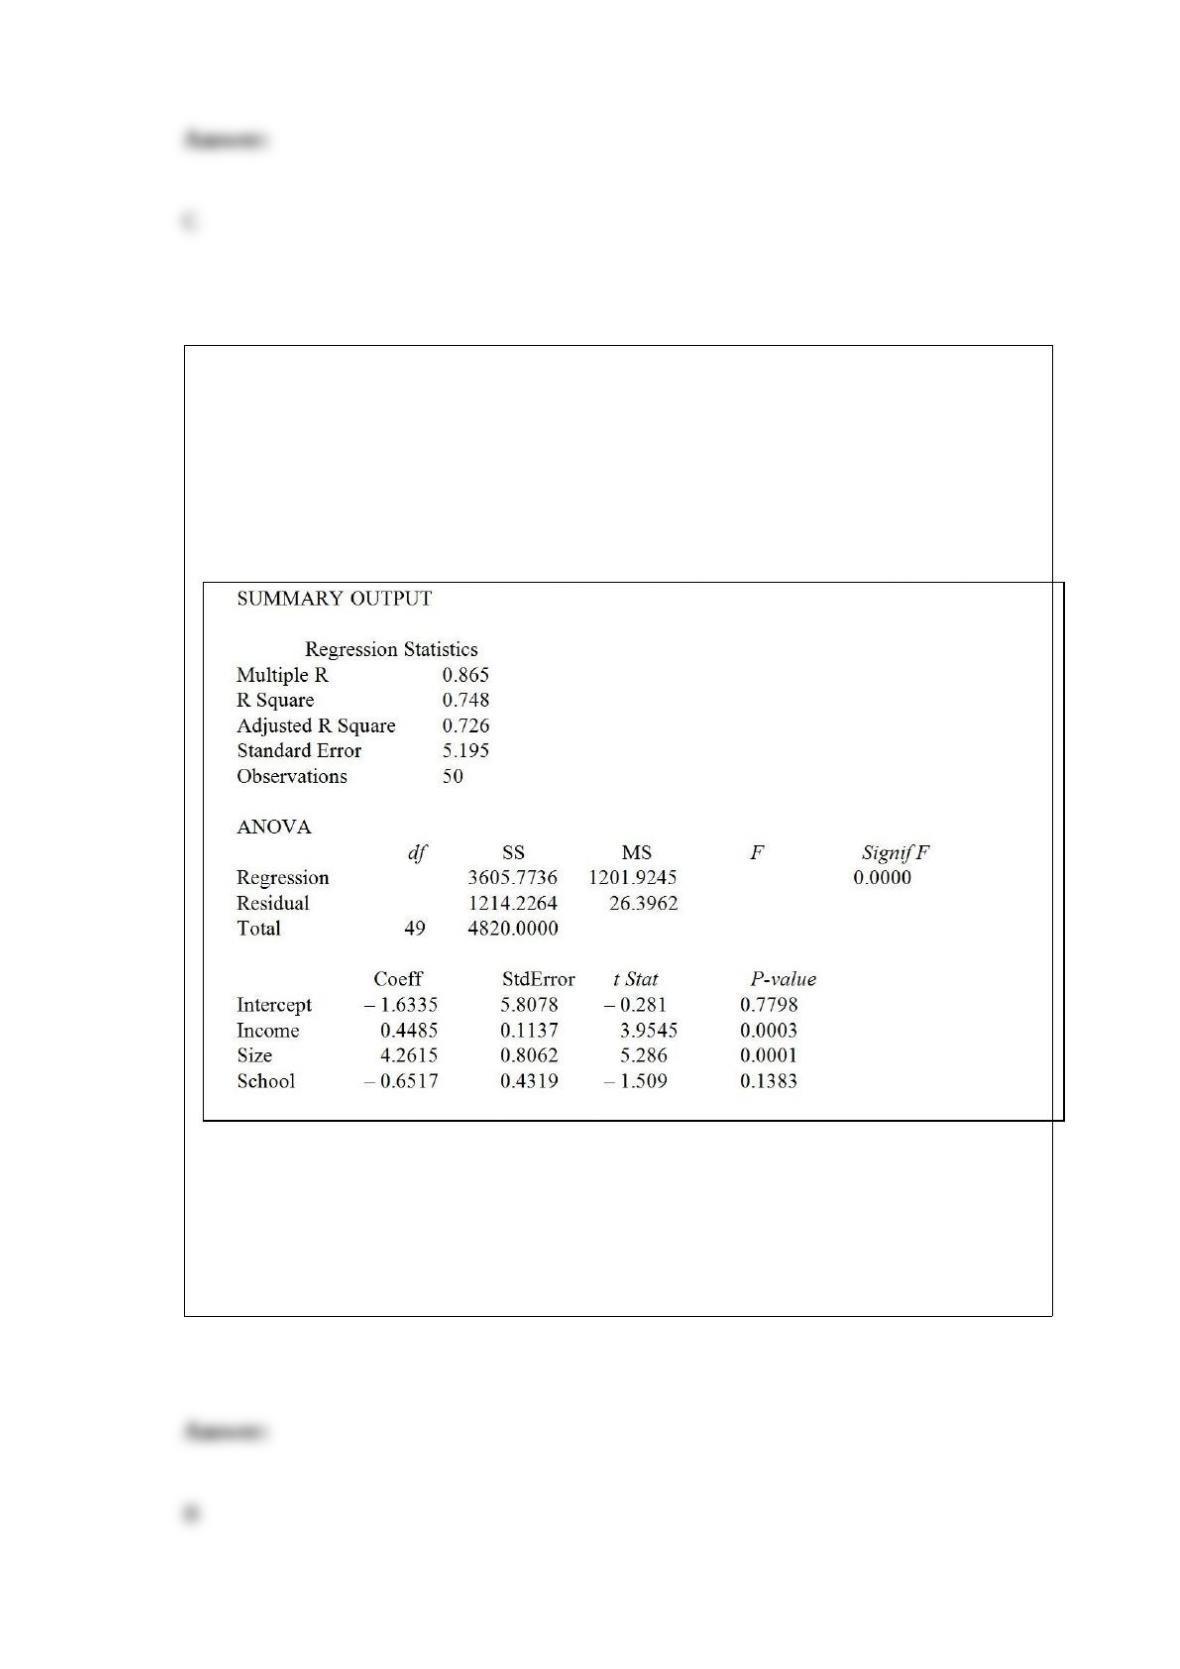
TABLE 17-1
A real estate builder wishes to determine how house size (House) is influenced by
family income (Income), family size (Size), and education of the head of household
(School). House size is measured in hundreds of square feet, income is measured in
thousands of dollars, and education is in years. The builder randomly selected 50
families and ran the multiple regression. Microsoft Excel output is provided below:
Referring to Table 17-1, which of the independent variables in the model are significant
at the 5% level?
A) Income, Size, School
B) Income, Size
C) Size, School
D) Income, School
Why is the Central Limit Theorem so important to the study of sampling distributions?
A) It allows us to disregard the size of the sample selected when the population is not
normal.
B) It allows us to disregard the shape of the sampling distribution when the size of the
population is large.
C) It allows us to disregard the size of the population we are sampling from.
D) It allows us to disregard the shape of the population when n is large.
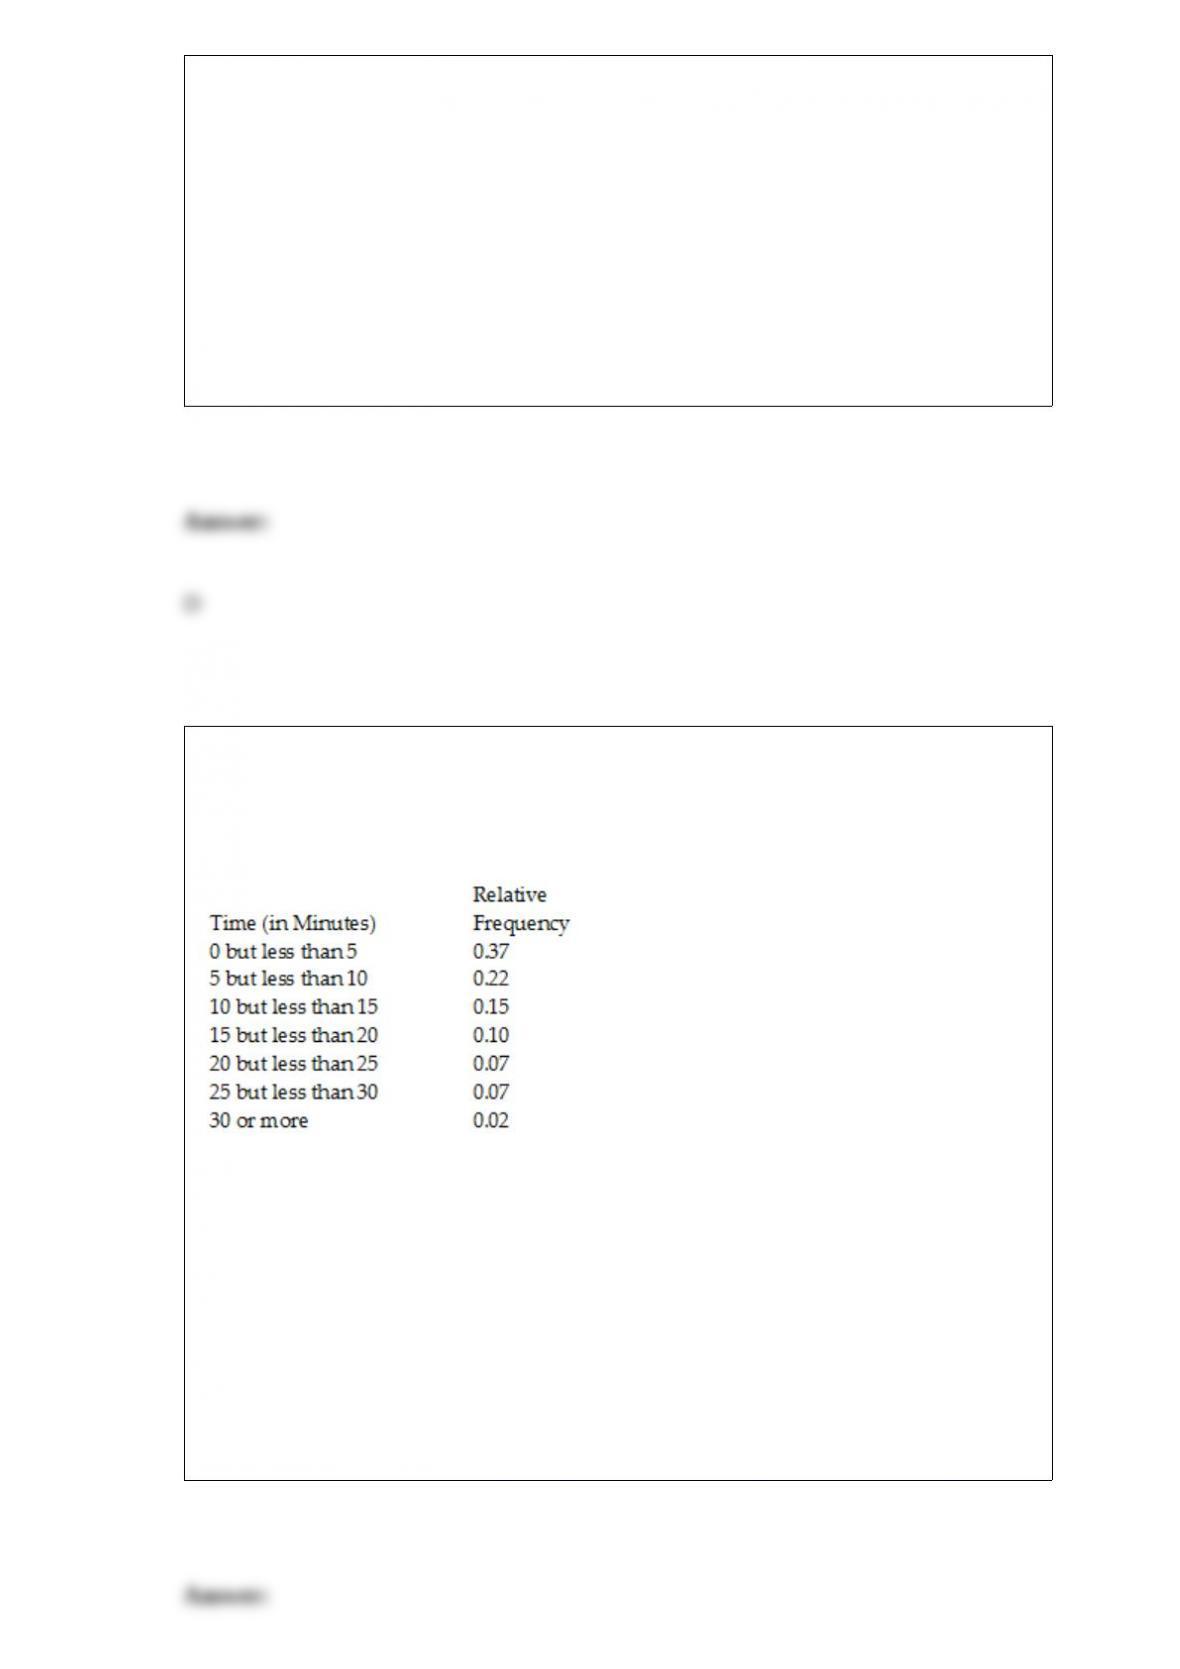
TABLE 2-5
The following are the duration in minutes of a sample of long-distance phone calls
made within the continental United States reported by one long-distance carrier.
Referring to Table 2-5, if 1,000 calls were randomly sampled, how many calls lasted
under 10 minutes?
A) 220
B) 370
C) 410
D) 590
Which of the following is not true about the Student’s t distribution?
A) It has more area in the tails and less in the center than does the normal distribution.
B) It is used to construct confidence intervals for the population mean when the
population standard deviation is known.
C) It is bell shaped and symmetrical.
D) As the number of degrees of freedom increases, the t distribution approaches the
normal distribution.
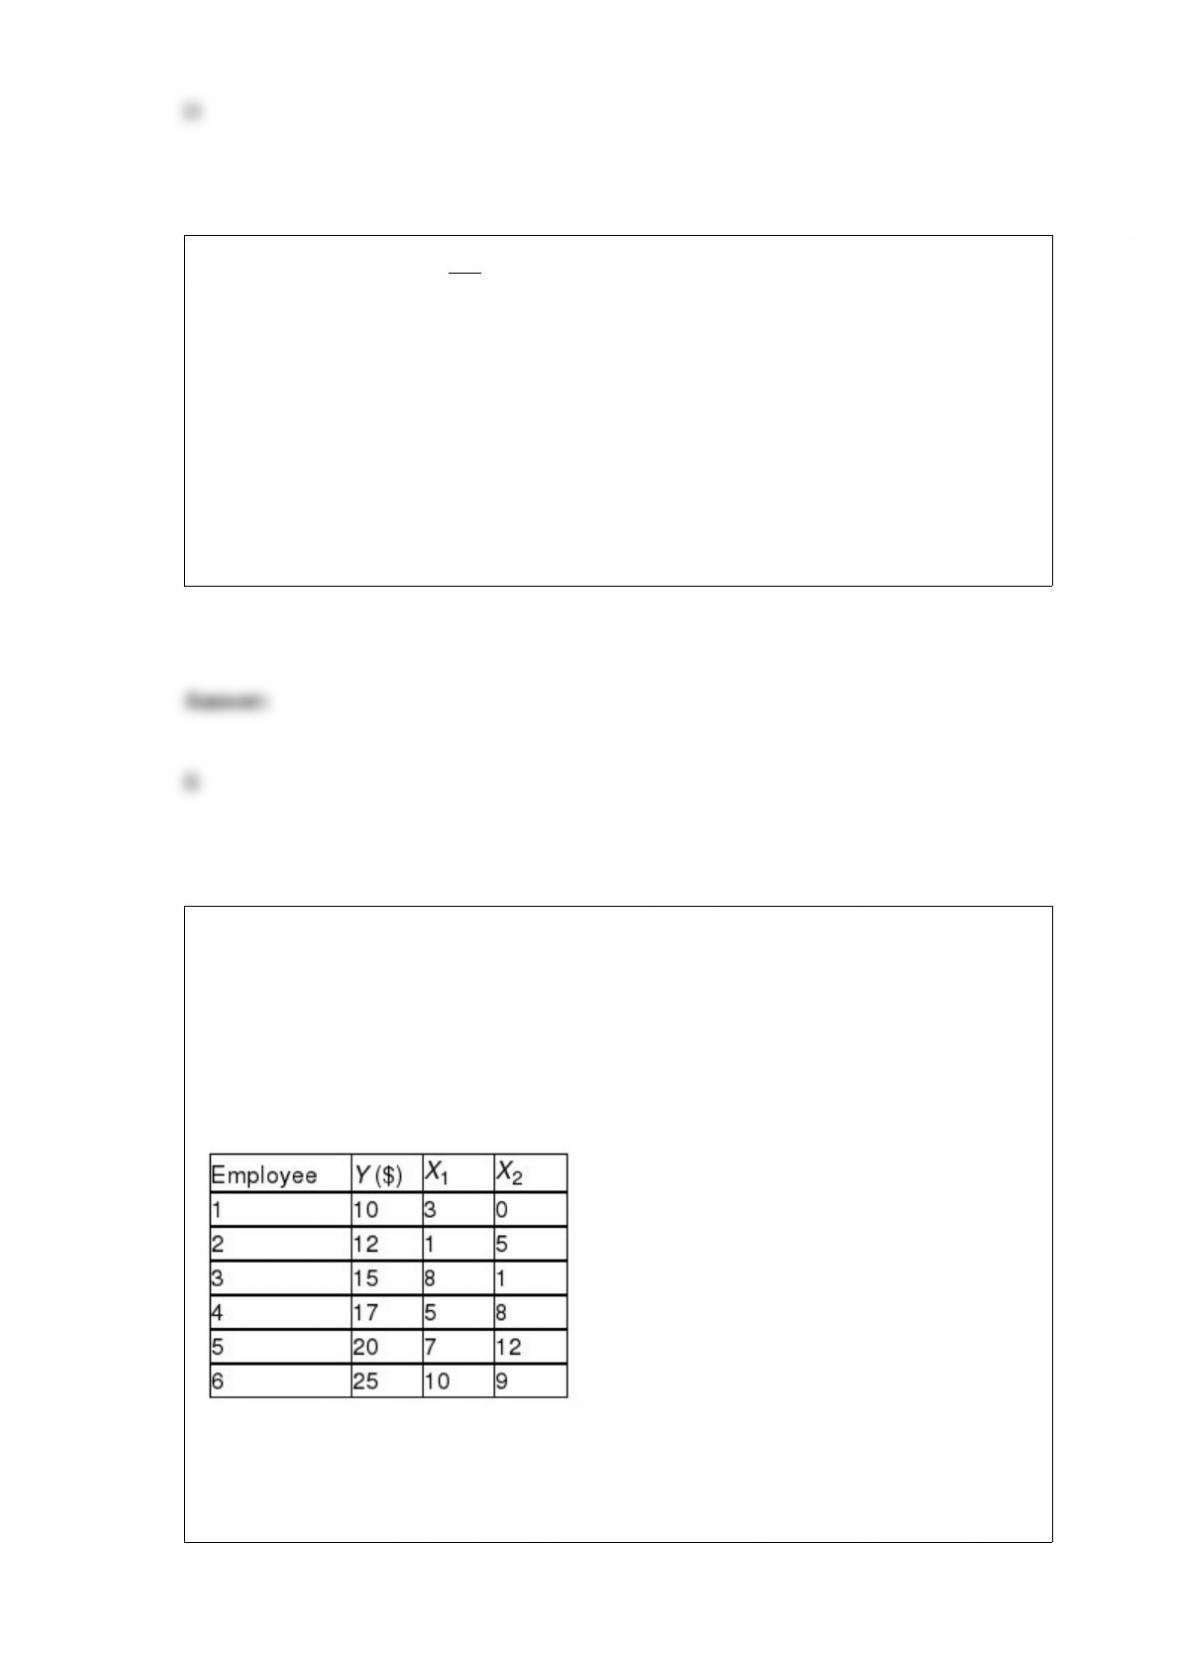
Referring to Table 14-2, for these data, what is the value for the regression constant, b0?
TABLE 14-2
A professor of industrial relations believes that an individual’s wage rate at a factory (Y)
depends on his performance rating (X1) and the number of economics courses the
employee successfully completed in college (X2). The professor randomly selects 6
workers and collects the following information:
A) 0.616
B) 1.054
C) 6.932
D) 9.103
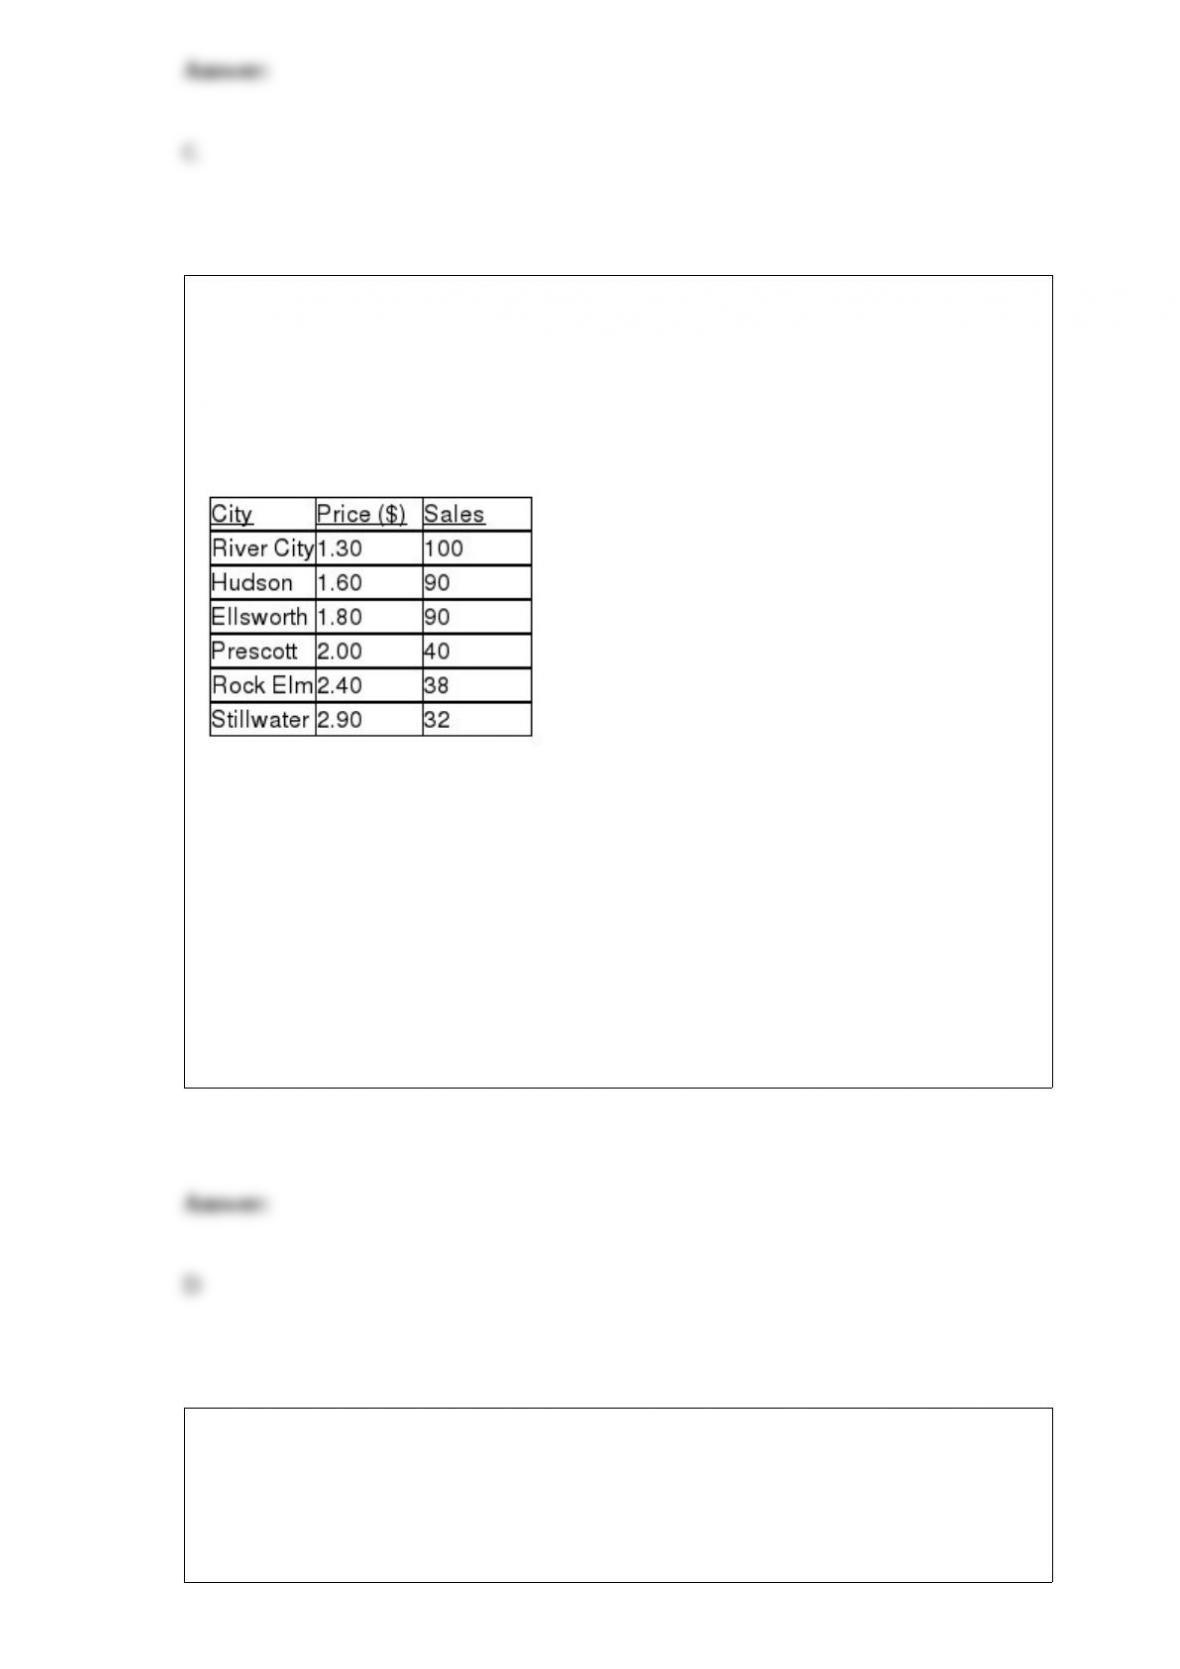
TABLE 13-2
A candy bar manufacturer is interested in trying to estimate how sales are influenced by
the price of their product. To do this, the company randomly chooses 6 small cities and
offers the candy bar at different prices. Using candy bar sales as the dependent variable,
the company will conduct a simple linear regression on the data below:
Referring to Table 13-2, what is the estimated mean change in the sales of the candy bar
if price goes up by $1.00?
A) 161.386
B) 0.784
C) -3.810
D) -48.193
If a group of independent variables are not significant individually but are significant as
a group at a specified level of significance, this is most likely due to
A) autocorrelation.
B) the presence of dummy variables.
C) the absence of dummy variables.
D) collinearity.
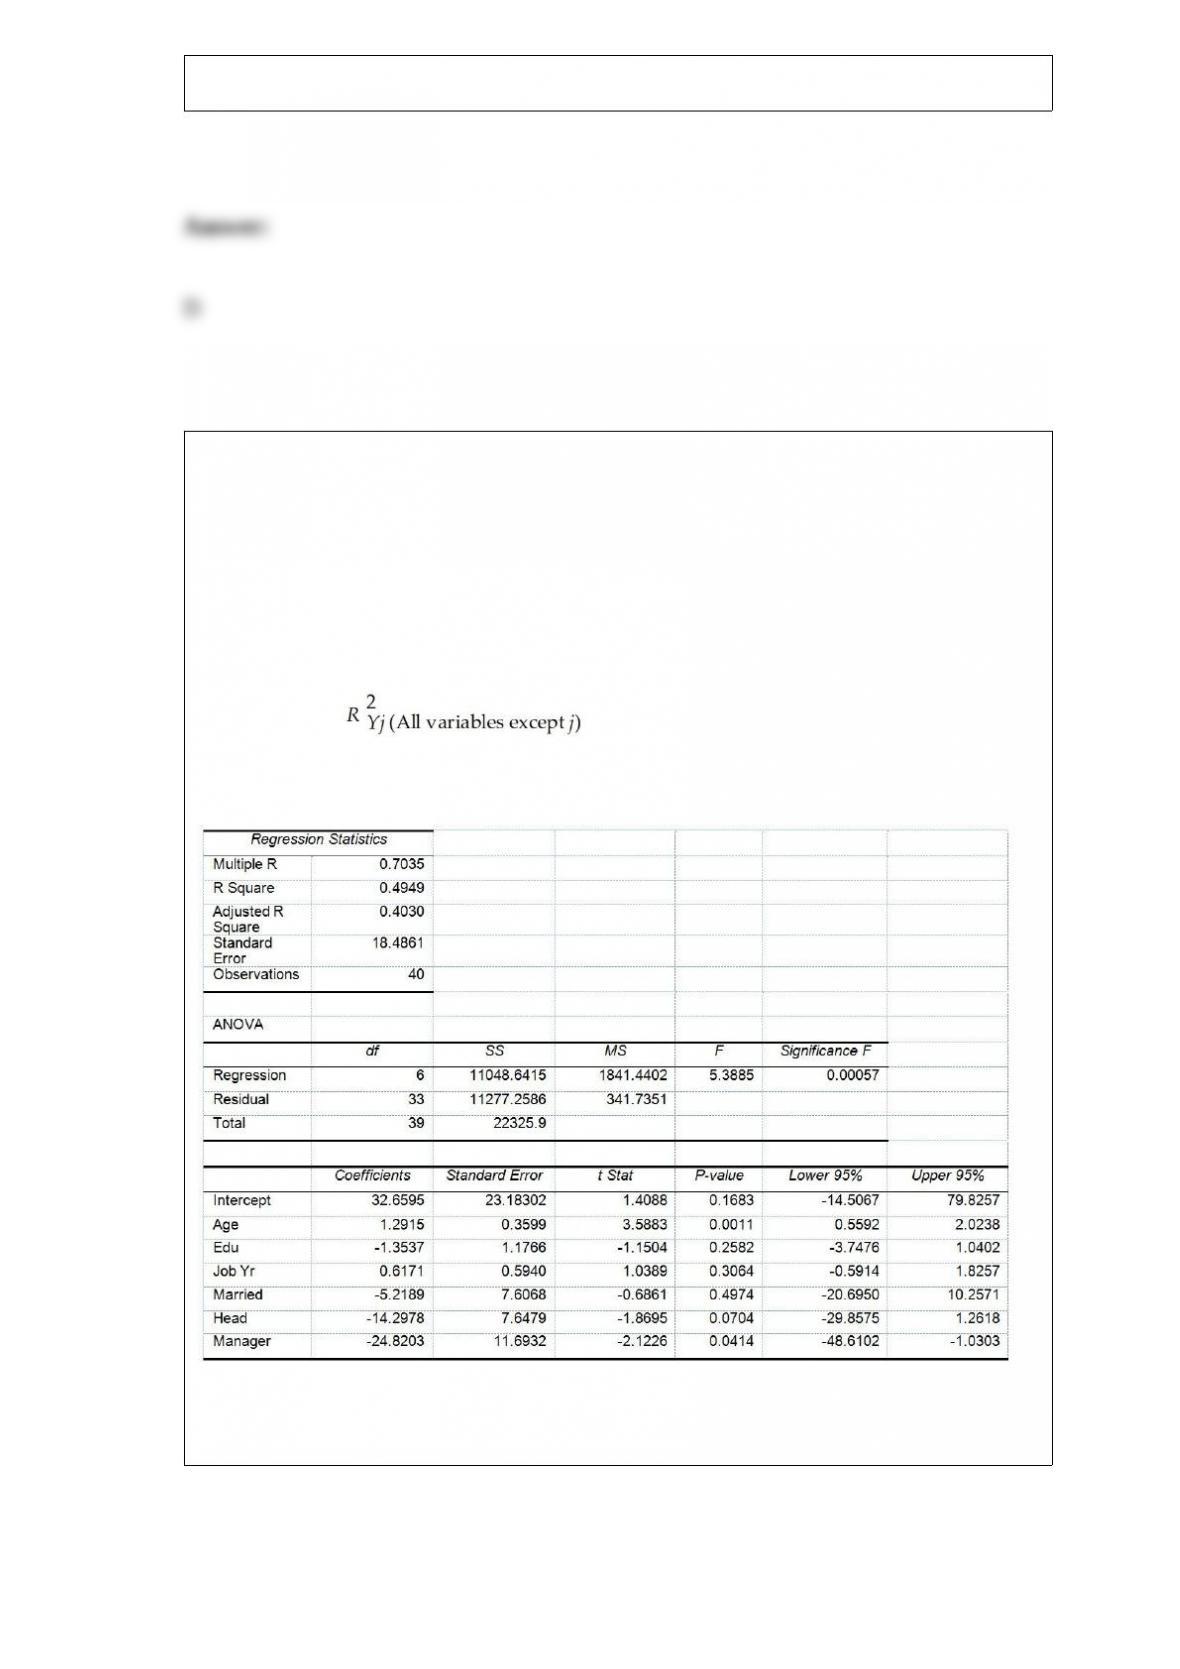
TABLE 17-10
Given below are results from the regression analysis where the dependent variable is
the number of weeks a worker is unemployed due to a layoff (Unemploy) and the
independent variables are the age of the worker (Age), the number of years of education
received (Edu), the number of years at the previous job (Job Yr), a dummy variable for
marital status (Married: 1 = married, 0 = otherwise), a dummy variable for head of
household (Head: 1 = yes, 0 = no) and a dummy variable for management position
(Manager: 1 = yes, 0 = no). We shall call this Model 1. The coefficient of partial
determination ( ) of each of the 6 predictors are, respectively,
0.2807, 0.0386, 0.0317, 0.0141, 0.0958, and 0.1201.
Model 2 is the regression analysis where the dependent variable is Unemploy and the
independent variables are Age and Manager. The results of the regression analysis are
given below:
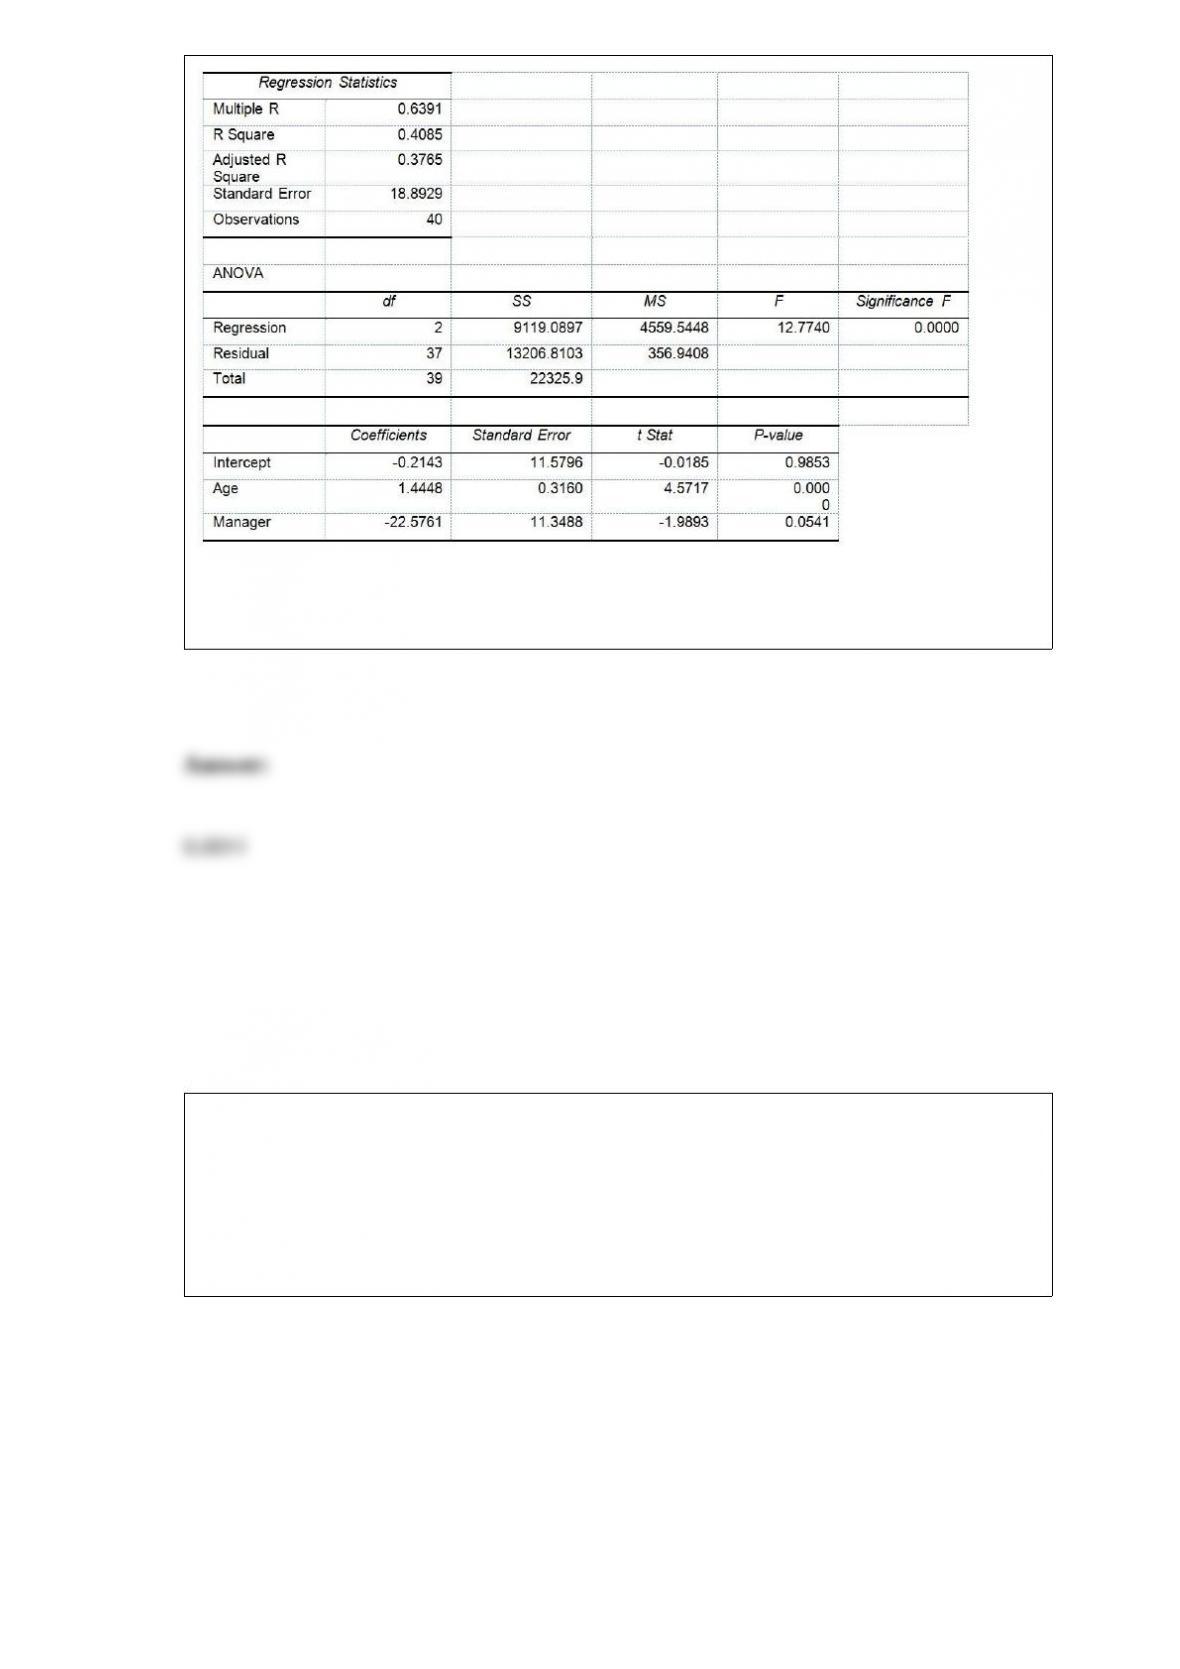
Referring to Table 17-10, Model 1, what is the p-value of the test statistic when testing
whether age has any effect on the number of weeks a worker is unemployed due to a
layoff while holding constant the effect of all the other independent variables?
TABLE 17-5
You worked as an intern at We Always Win Car Insurance Company last summer. You
notice that individual car insurance premiums depend very much on the age of the
individual, the number of traffic tickets received by the individual, and the population
density of the city in which the individual lives. You performed a regression analysis in
EXCEL and obtained the following information:
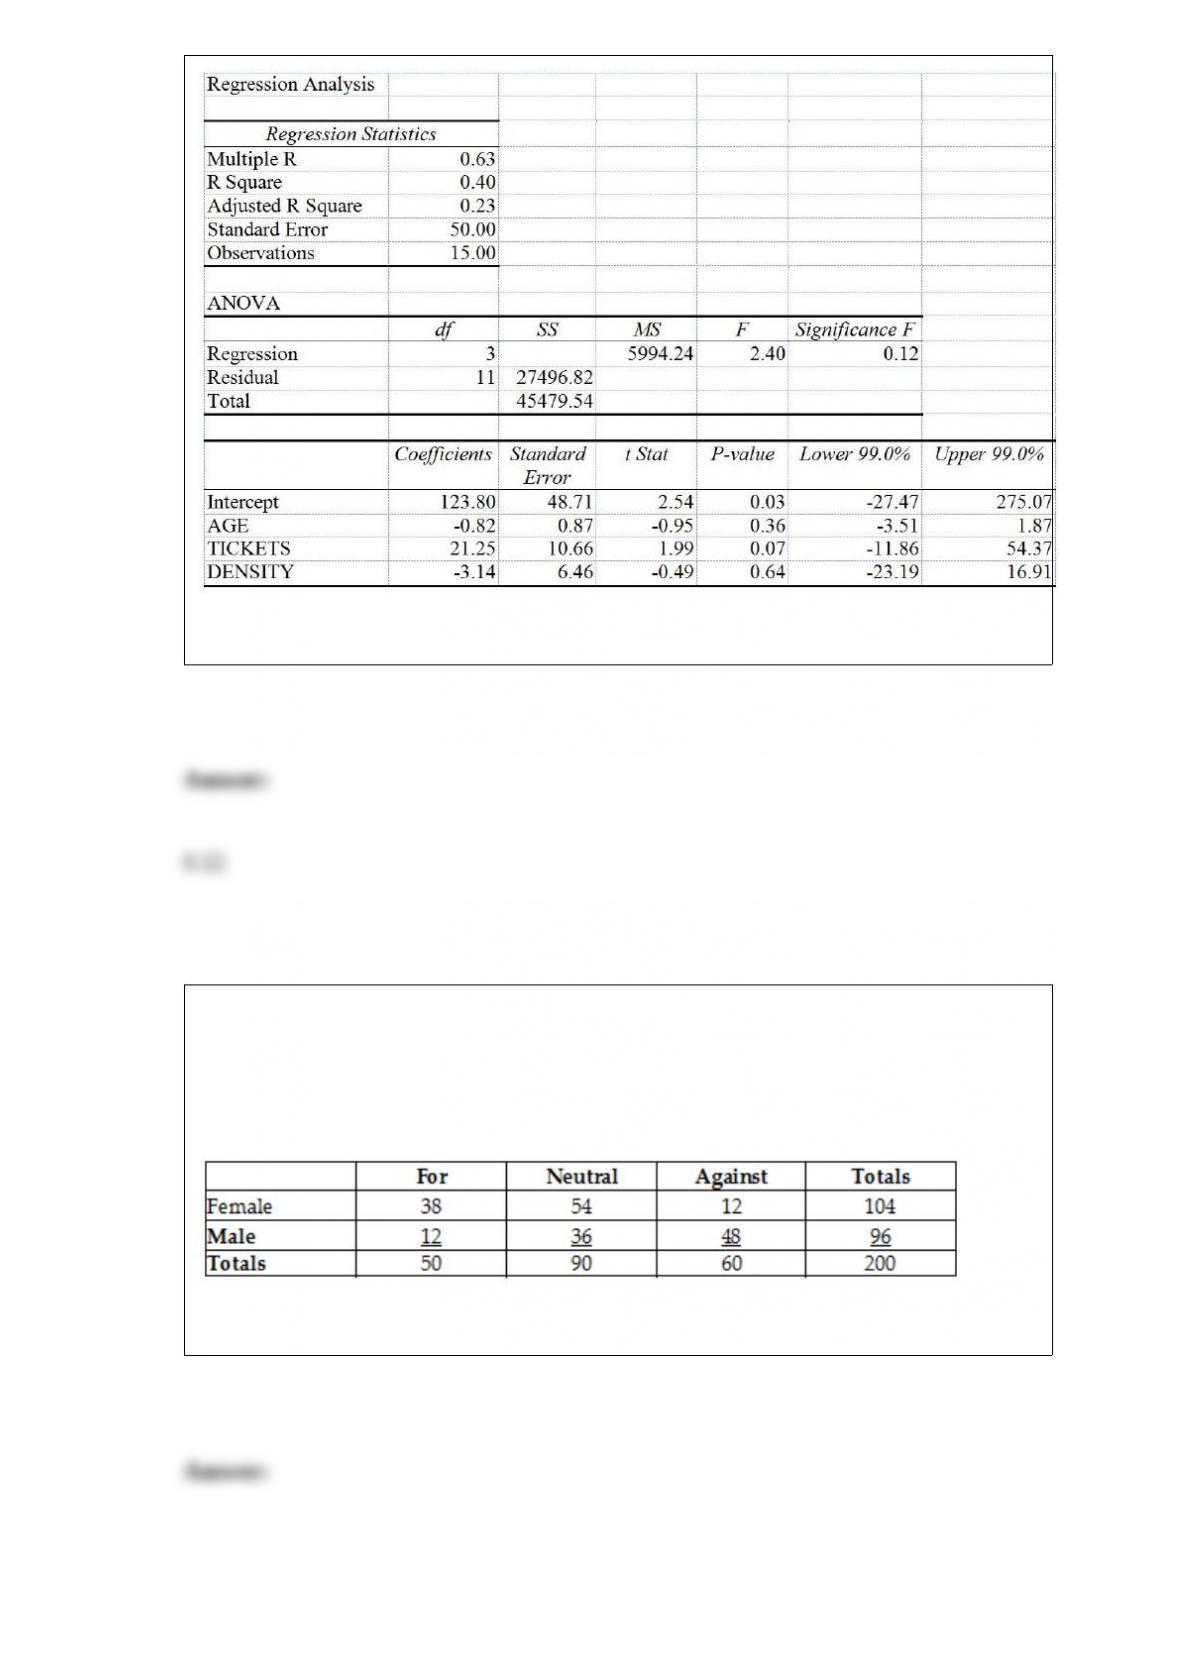
Referring to Table 17-5, to test the significance of the multiple regression model, the
p-value of the test statistic in the sample is ________.
TABLE 2-12
The table below contains the opinions of a sample of 200 people broken down by
gender about the latest congressional plan to eliminate anti-trust exemptions for
professional baseball.
Referring to Table 2-12, construct a table of row percentages.
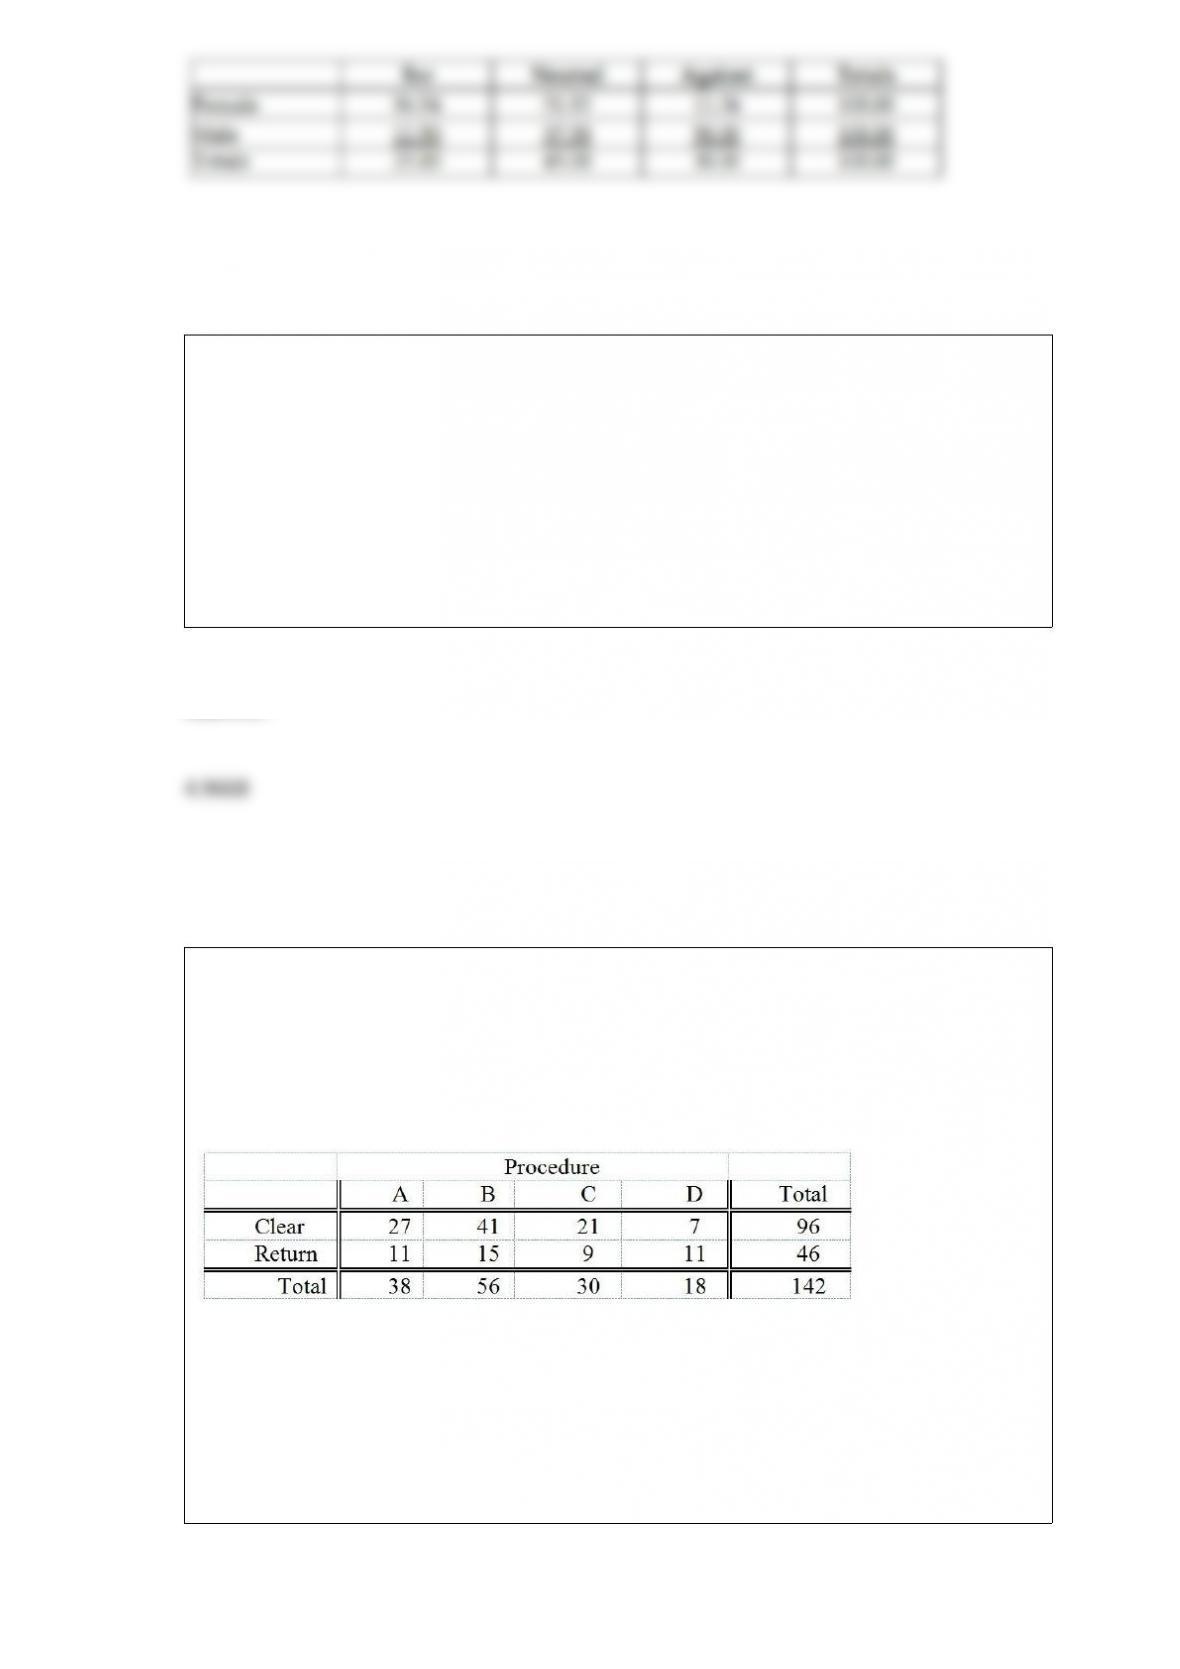
TABLE 7-7
Times spent studying by students in the week before final exams follow a normal
distribution with standard deviation 8 hours. A random sample of 4 students was taken
from a population of 50 in order to estimate the mean study time for the population of
all students. Use the finite population correction.
Referring to Table 7-7, 80% of all the samples of 4 will have a sample mean of no more
than how many hours from the population mean?
TABLE 12-5
Four surgical procedures currently are used to install pacemakers. If the patient does not
need to return for follow-up surgery, the operation is called a “clear” operation. A heart
center wants to compare the proportion of clear operations for the 4 procedures, and
collects the following numbers of patients from their own records:
They will use this information to test for a difference among the proportion of clear
operations using a chi-square test with a level of significance of 0.05.
Referring to Table 12-5, what is the value of the critical range for the Marascuilo
procedure to test for the difference in proportions between procedure B and procedure
D using a 0.05 level of significance?

TABLE 10-6
To investigate the efficacy of a diet, a random sample of 16 male patients is selected
from a population of adult males using the diet. The weight of each individual in the
sample is taken at the start of the diet and at a medical follow-up 4 weeks later.
Assuming that the population of differences in weight before versus after the diet
follow a normal distribution, the t-test for related samples can be used to determine if
there was a significant decrease in the mean weight during this period. Suppose the
mean decrease in weights over all 16 subjects in the study is 3.0 pounds with the
standard deviation of differences computed as 6.0 pounds.
Referring to Table 10-6, what is the 95% confidence interval estimate for the mean
difference in weight before and after the diet?
TABLE 6-2
John has two jobs. For daytime work at a jewelry store he is paid $15,000 per month,
plus a commission. His monthly commission is normally distributed with a mean of
$10,000 and a standard deviation of $2,000. At night he works occasionally as a waiter,
for which his monthly income is normally distributed with a mean of $1,000 and a
standard deviation of $300. John’s income levels from these two sources are
independent of each other.
Referring to Table 6-2, John’s commission from the jewelry store will be between what
two values, symmetrically distributed around the population mean 90% of the time?
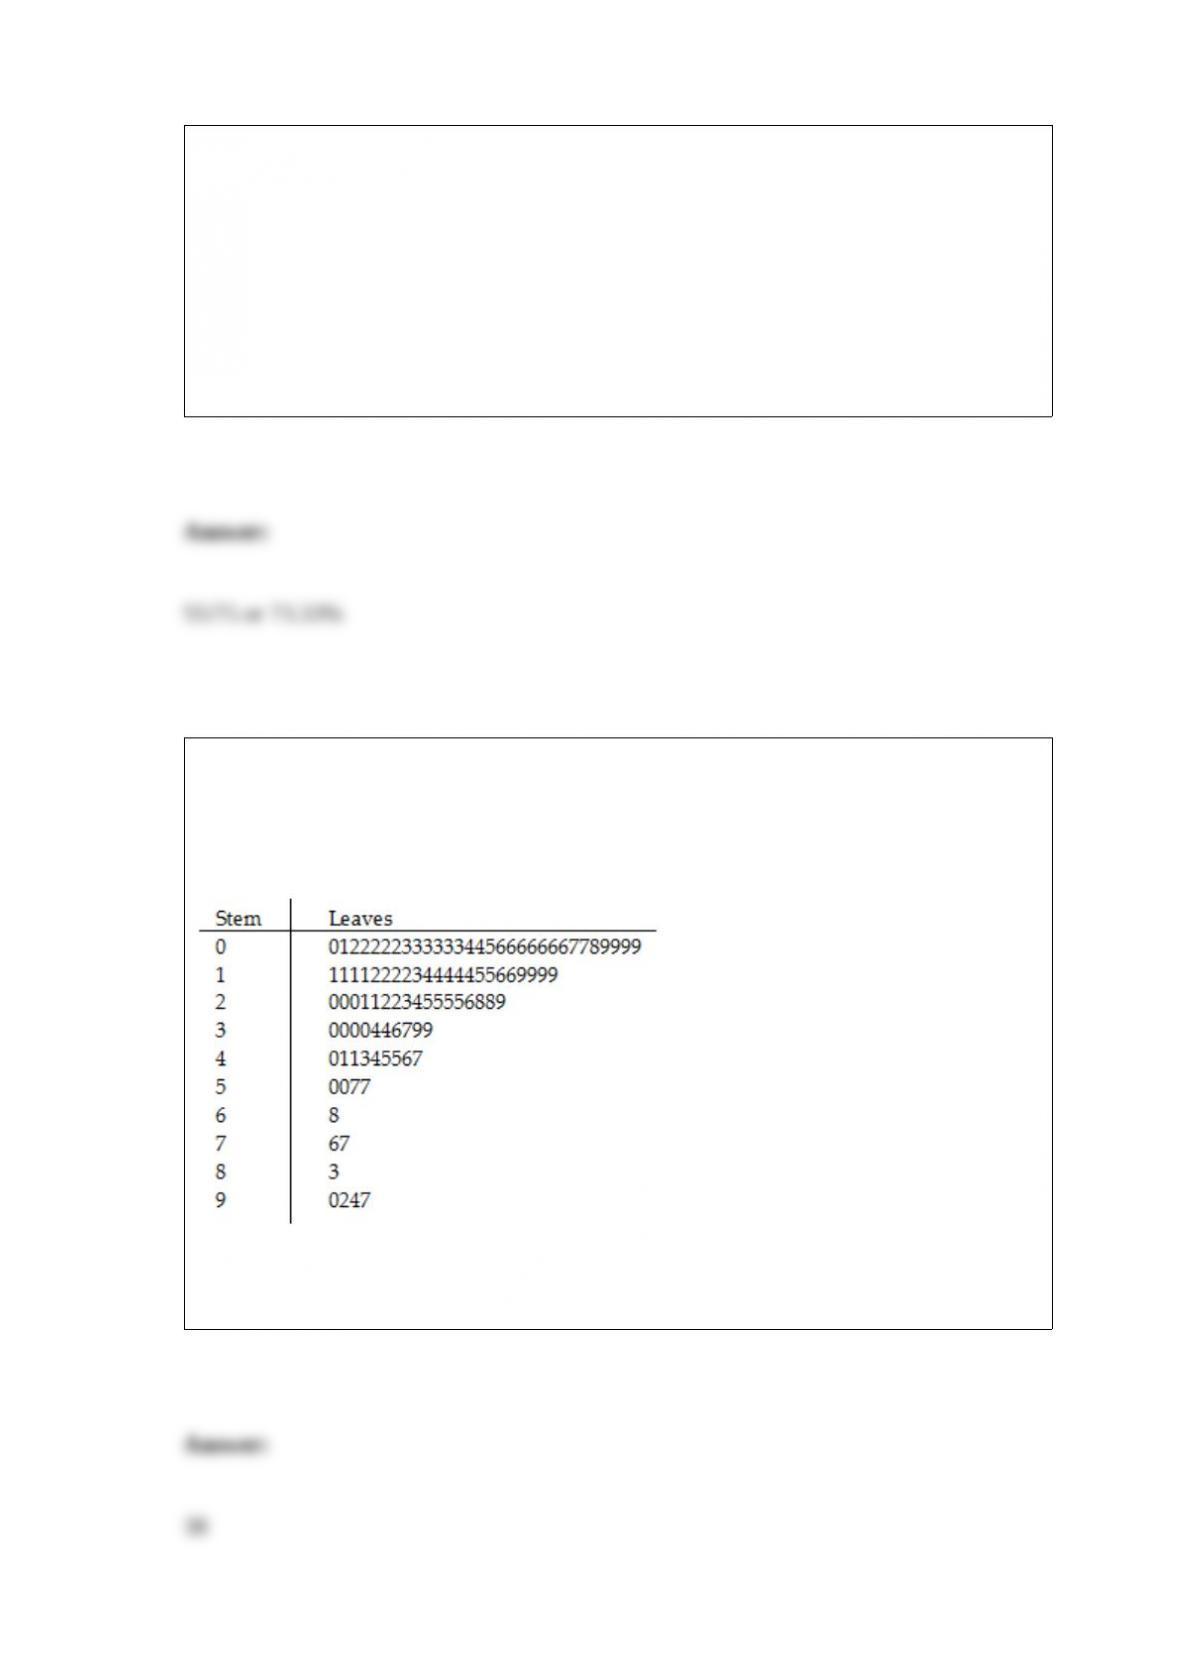
TABLE 4-3
A survey is taken among customers of a fast-food restaurant to determine preference for
hamburger or chicken. Of 200 respondents selected, 75 were children and 125 were
adults. 120 preferred hamburger and 80 preferred chicken. 55 of the children preferred
hamburger.
Referring to Table 4-3, assume we know the person is a child. The probability that this
individual prefers hamburger is ________.
TABLE 2-8
The Stem-and-Leaf display represents the number of times in a year that a random
sample of 100 “lifetime” members of a health club actually visited the facility.
Referring to Table 2-8, ________ of the 100 members visited the health club no more
than 12 times in a year.