True or False: The opinions (classified as “for,” “neutral,” or “against”) of a sample of
200 people were broken down by gender about the latest congressional plan to
eliminate anti-trust exemptions for professional baseball. You can present this
information using a scatter plot.
True or False: The coefficient of multiple determination measures the proportion of the
total variation in the dependent variable that is explained by the set of independent
variables.
TABLE 8-11
A poll was conducted by the marketing department of a video game company to
determine the popularity of a new game that was targeted to be launched in three
months. Telephone interviews with 1,500 young adults were conducted which revealed
that 49% said they would purchase the new game. The margin of error was 3
percentage points.
True or False: Referring to Table 8-11, the size of the population is 1,500.
True or False: One of the reasons that a correction for continuity adjustment is needed
when approximating the binomial distribution with a normal distribution is because the
probability of getting a specific value of a random variable is zero with the normal
distribution.
TABLE 9-4
A drug company is considering marketing a new local anesthetic. The effective time of
the anesthetic the drug company is currently producing has a normal distribution with a
mean of 7.4 minutes with a standard deviation of 1.2 minutes. The chemistry of the new
anesthetic is such that the effective time should be normally distributed with the same
standard deviation, but the mean effective time may be lower. If it is lower, the drug
company will market the new anesthetic; otherwise, they will continue to produce the
older one. A sample size of 36 results in a sample mean of 7.1. A hypothesis test will be
done to help make the decision.
True or False: Referring to Table 9-4, if the level of significance had been chosen as
0.05, the null hypothesis would be rejected.
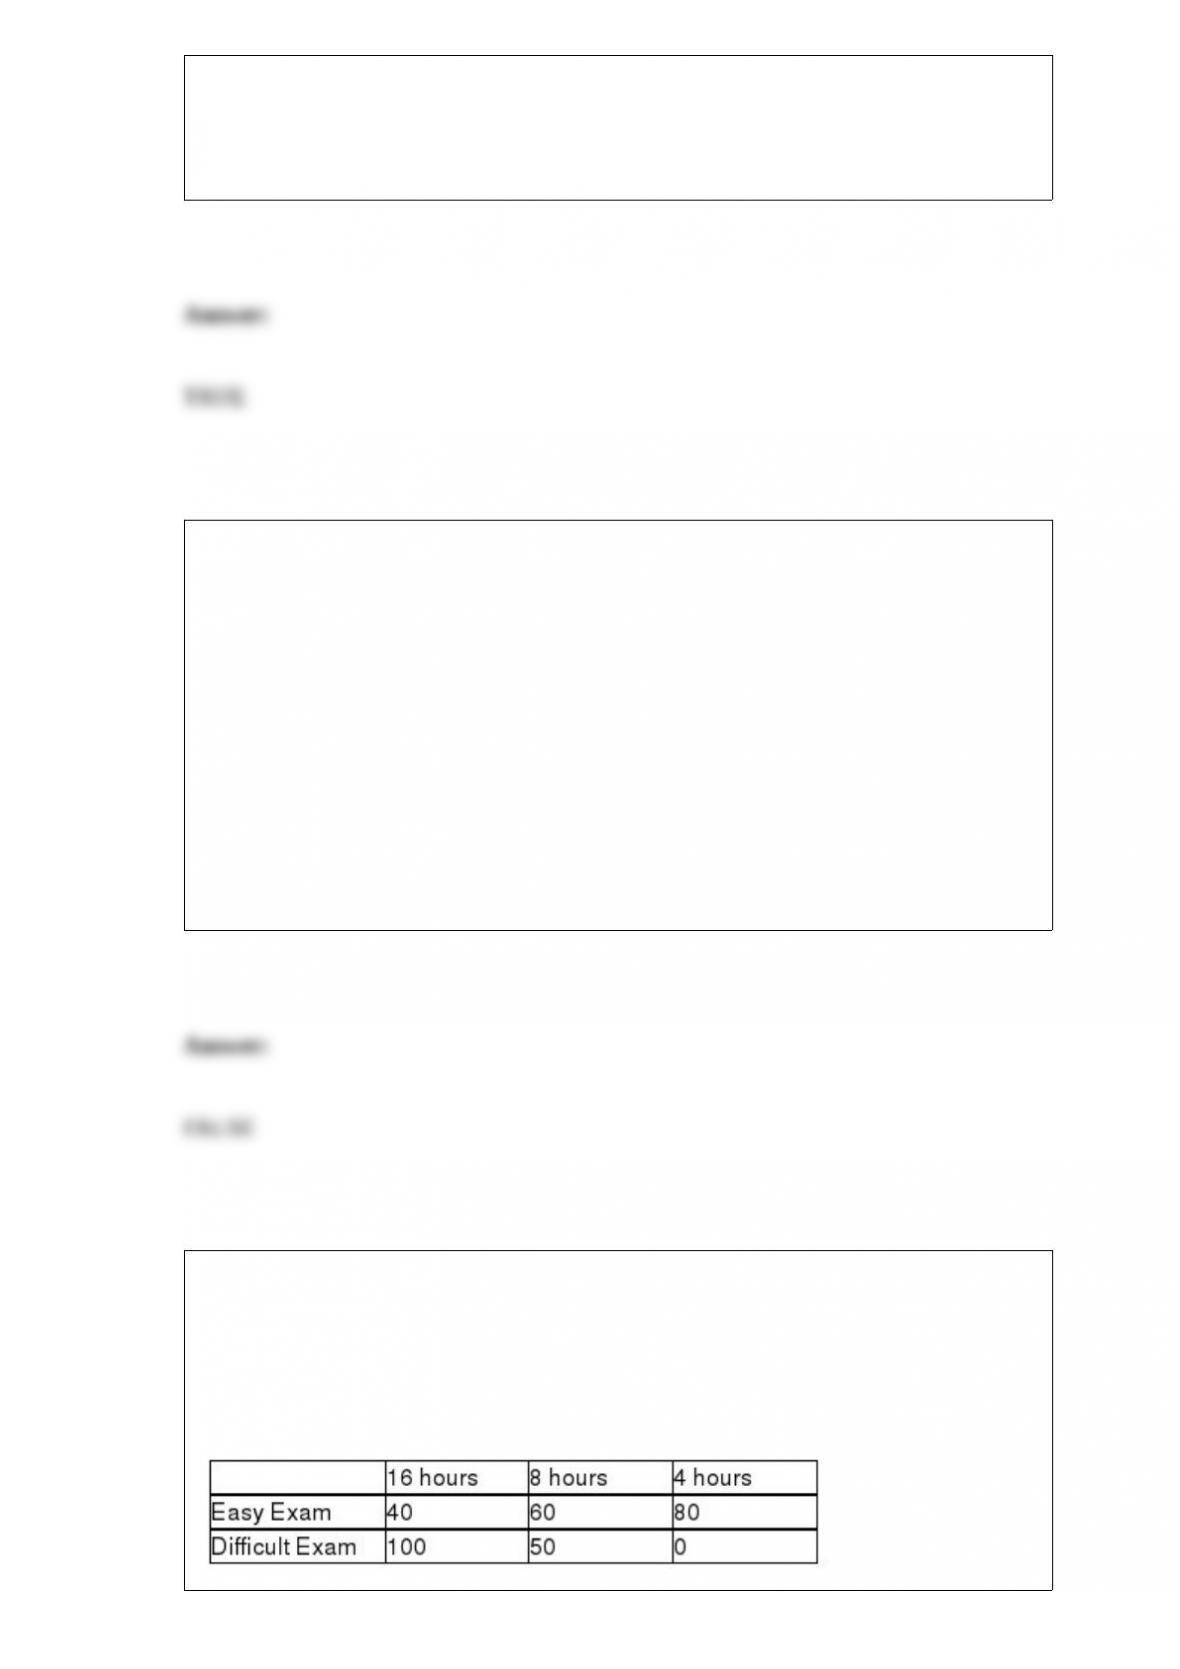
True or False: TABLE 19-6
A student wanted to find out the optimal strategy to study for a Business Statistics
exam. He constructed the following payoff table based on the mean amount of time he
needed to study every week for the course and the degree of difficulty of the exam.
From the information that he gathered from students who had taken the course, he
concluded that there was a 40% probability that the exam would be easy.
Referring to Table 19-6, the optimal strategy using the expected opportunity loss
criterion is to study 16 hours per week on average for the exam.
True or False: If the population distribution is unknown, in most cases the sampling
distribution of the mean can be approximated by the normal distribution if the samples
contain at least 30 observations.
True or False: In exploratory data analysis, a boxplot can be used to illustrate the
median, quartiles, and extreme values.
TABLE 8-11
A poll was conducted by the marketing department of a video game company to
determine the popularity of a new game that was targeted to be launched in three
months. Telephone interviews with 1,500 young adults were conducted which revealed
that 49% said they would purchase the new game. The margin of error was 3
percentage points.
True or False: Referring to Table 8-11, the report contains all the essential components
for an ethical reporting of poll results.
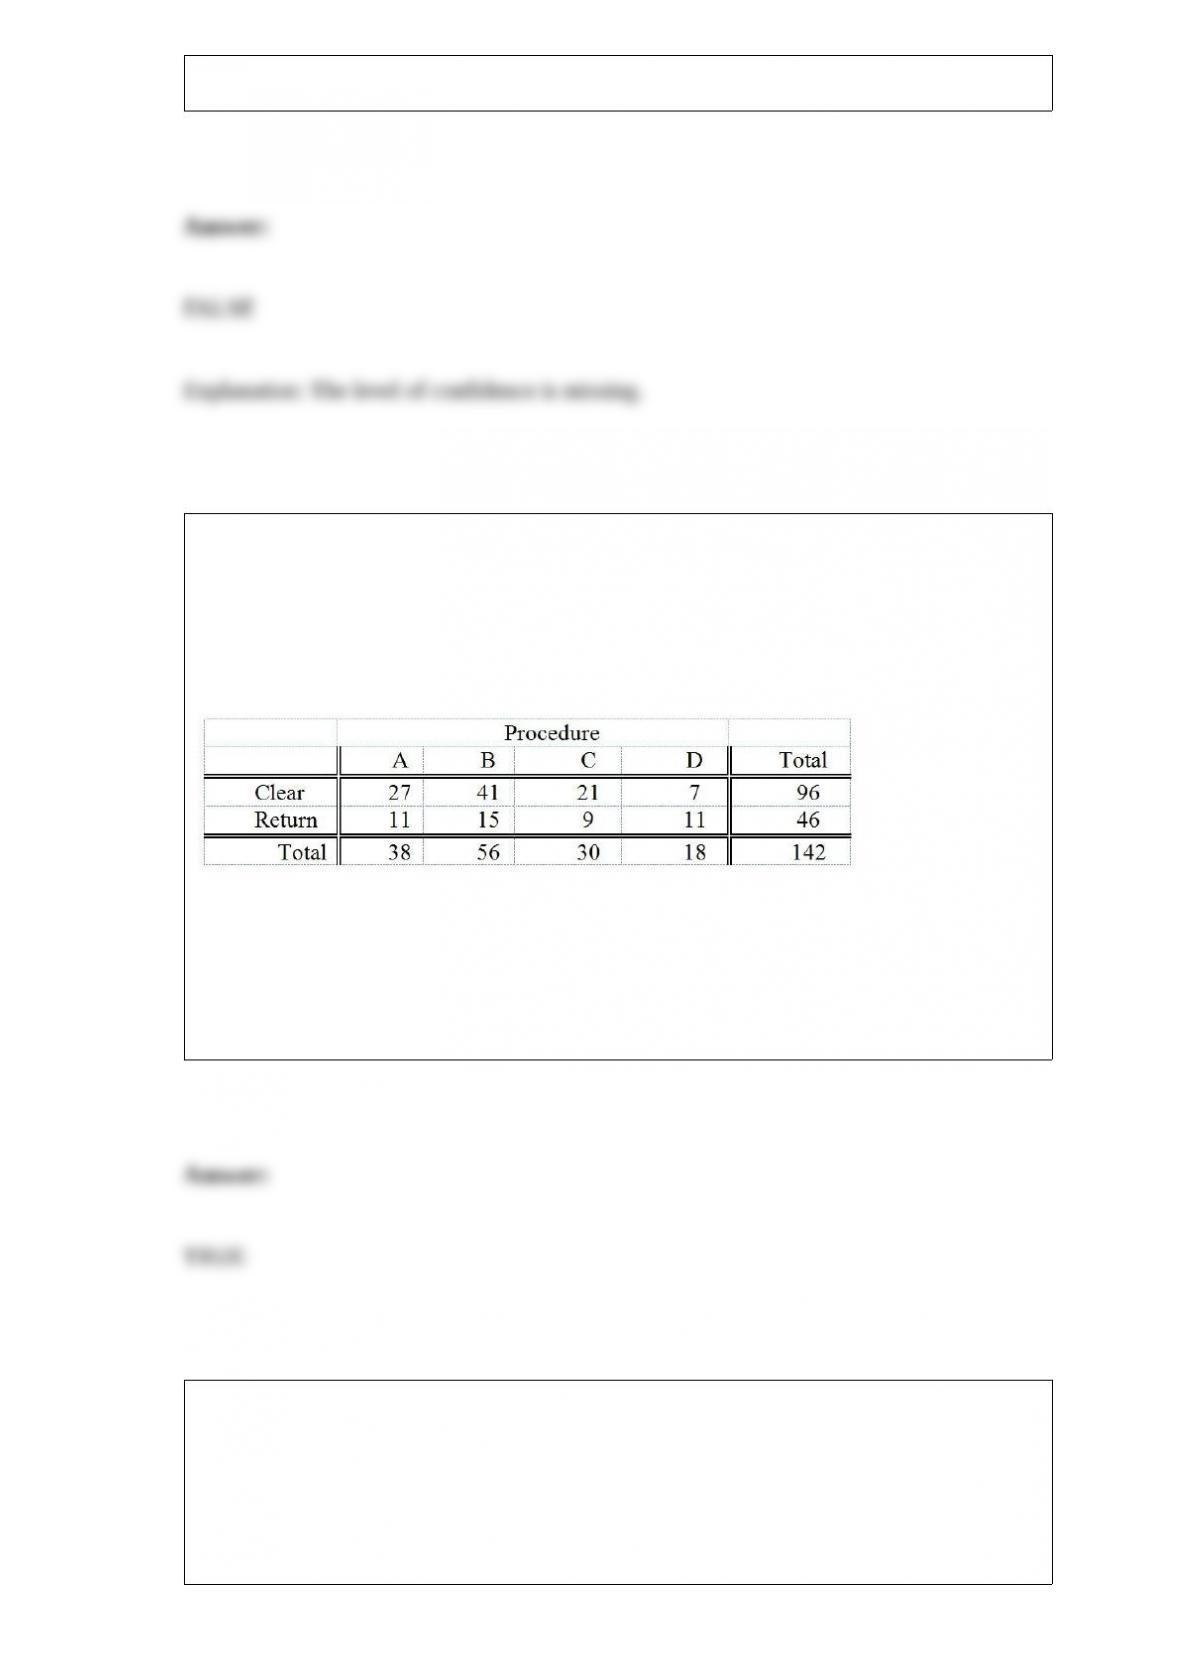
TABLE 12-5
Four surgical procedures currently are used to install pacemakers. If the patient does not
need to return for follow-up surgery, the operation is called a “clear” operation. A heart
center wants to compare the proportion of clear operations for the 4 procedures, and
collects the following numbers of patients from their own records:
They will use this information to test for a difference among the proportion of clear
operations using a chi-square test with a level of significance of 0.05.
True or False: Referring to Table 12-5, the decision made suggests that the 4 procedures
do not all have the same proportion of clear operations.
Which of the following yields a simple random sample?
A) All students in a class are grouped according to their gender. A random sample of 8
is selected from the males and a separate random sample of 7 is drawn from the
females.
B) The best 15 students, according to the opinion of the instructor, in a class are
selected.
C) The names of 50 students in a class are written on 50 different pieces of paper and
put in a hat. The first 15 pieces of paper are selected blindly one at a time after shuffling
the papers thoroughly and each of the selected pieces is placed back into the hat before
the next piece is selected.
D) All students in a class are divided into groups according to the rows that they are
seated. One of the groups is randomly selected.
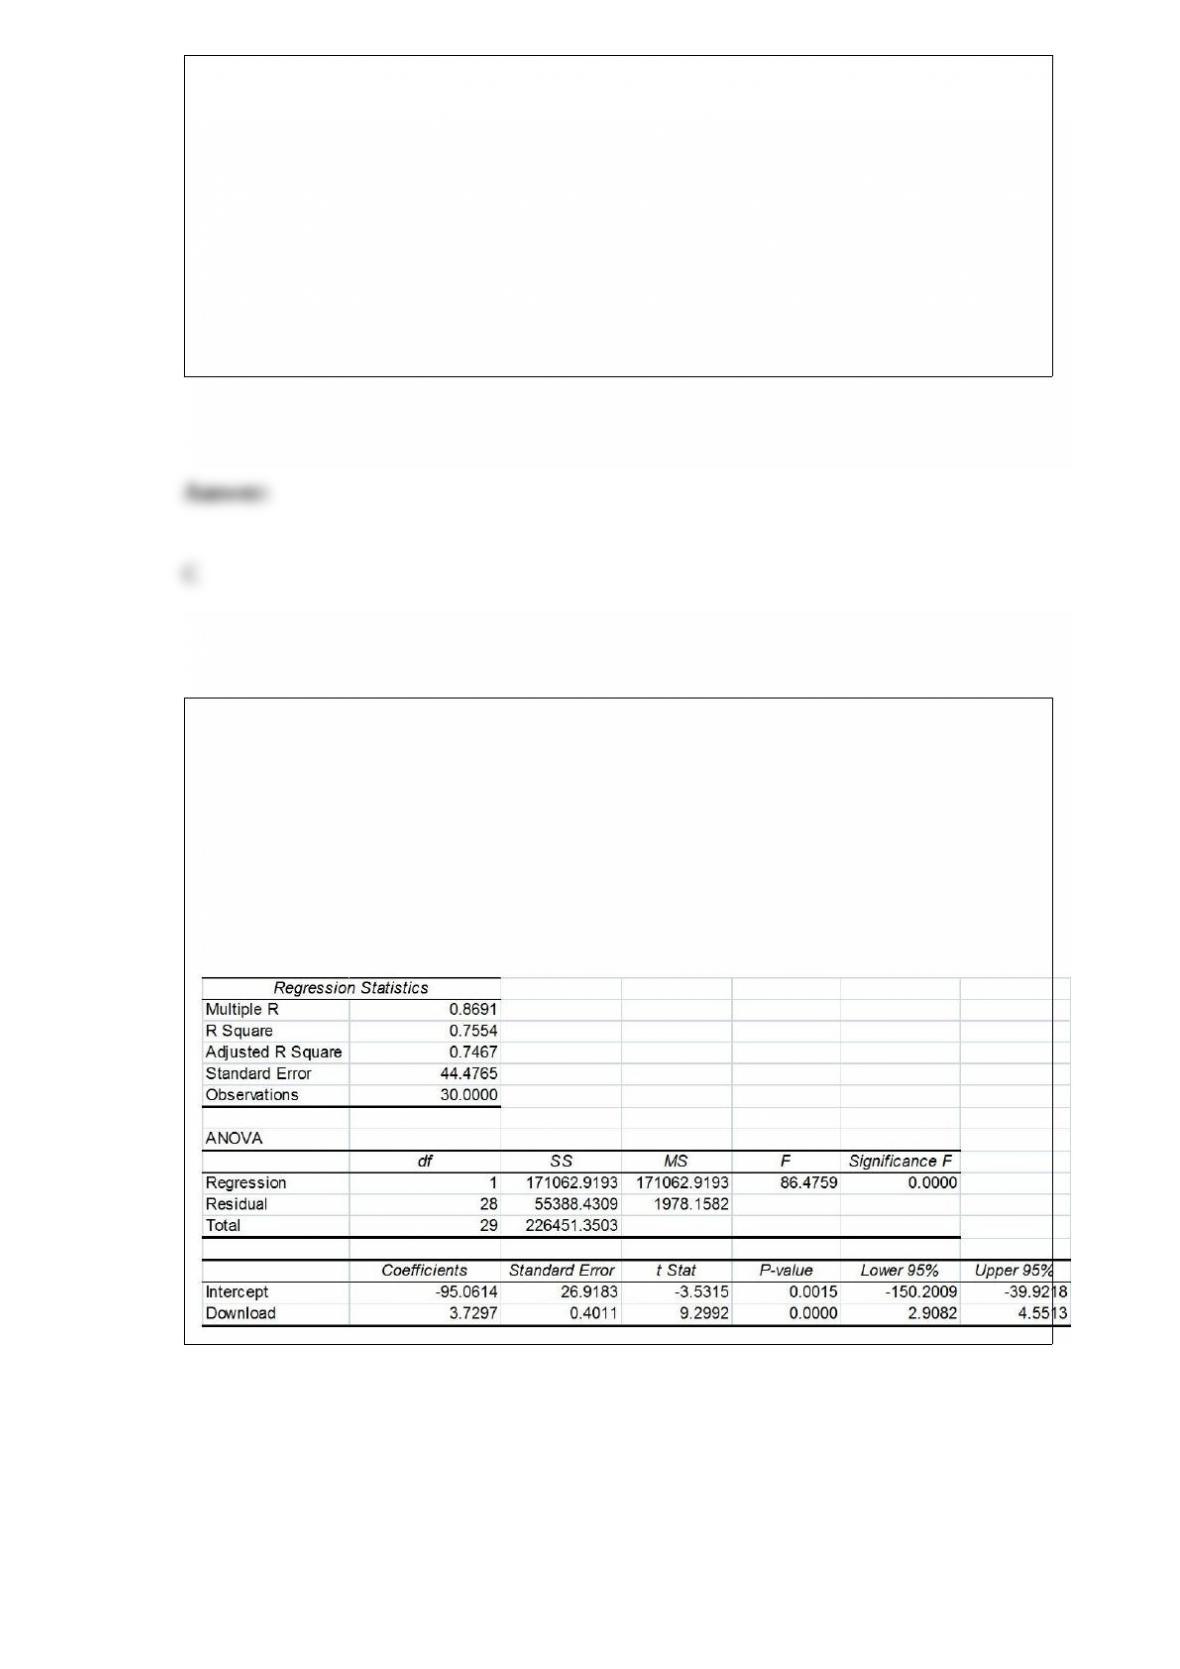
TABLE 13-11
A computer software developer would like to use the number of downloads (in
thousands) for the trial version of his new shareware to predict the amount of revenue
(in thousands of dollars) he can make on the full version of the new shareware.
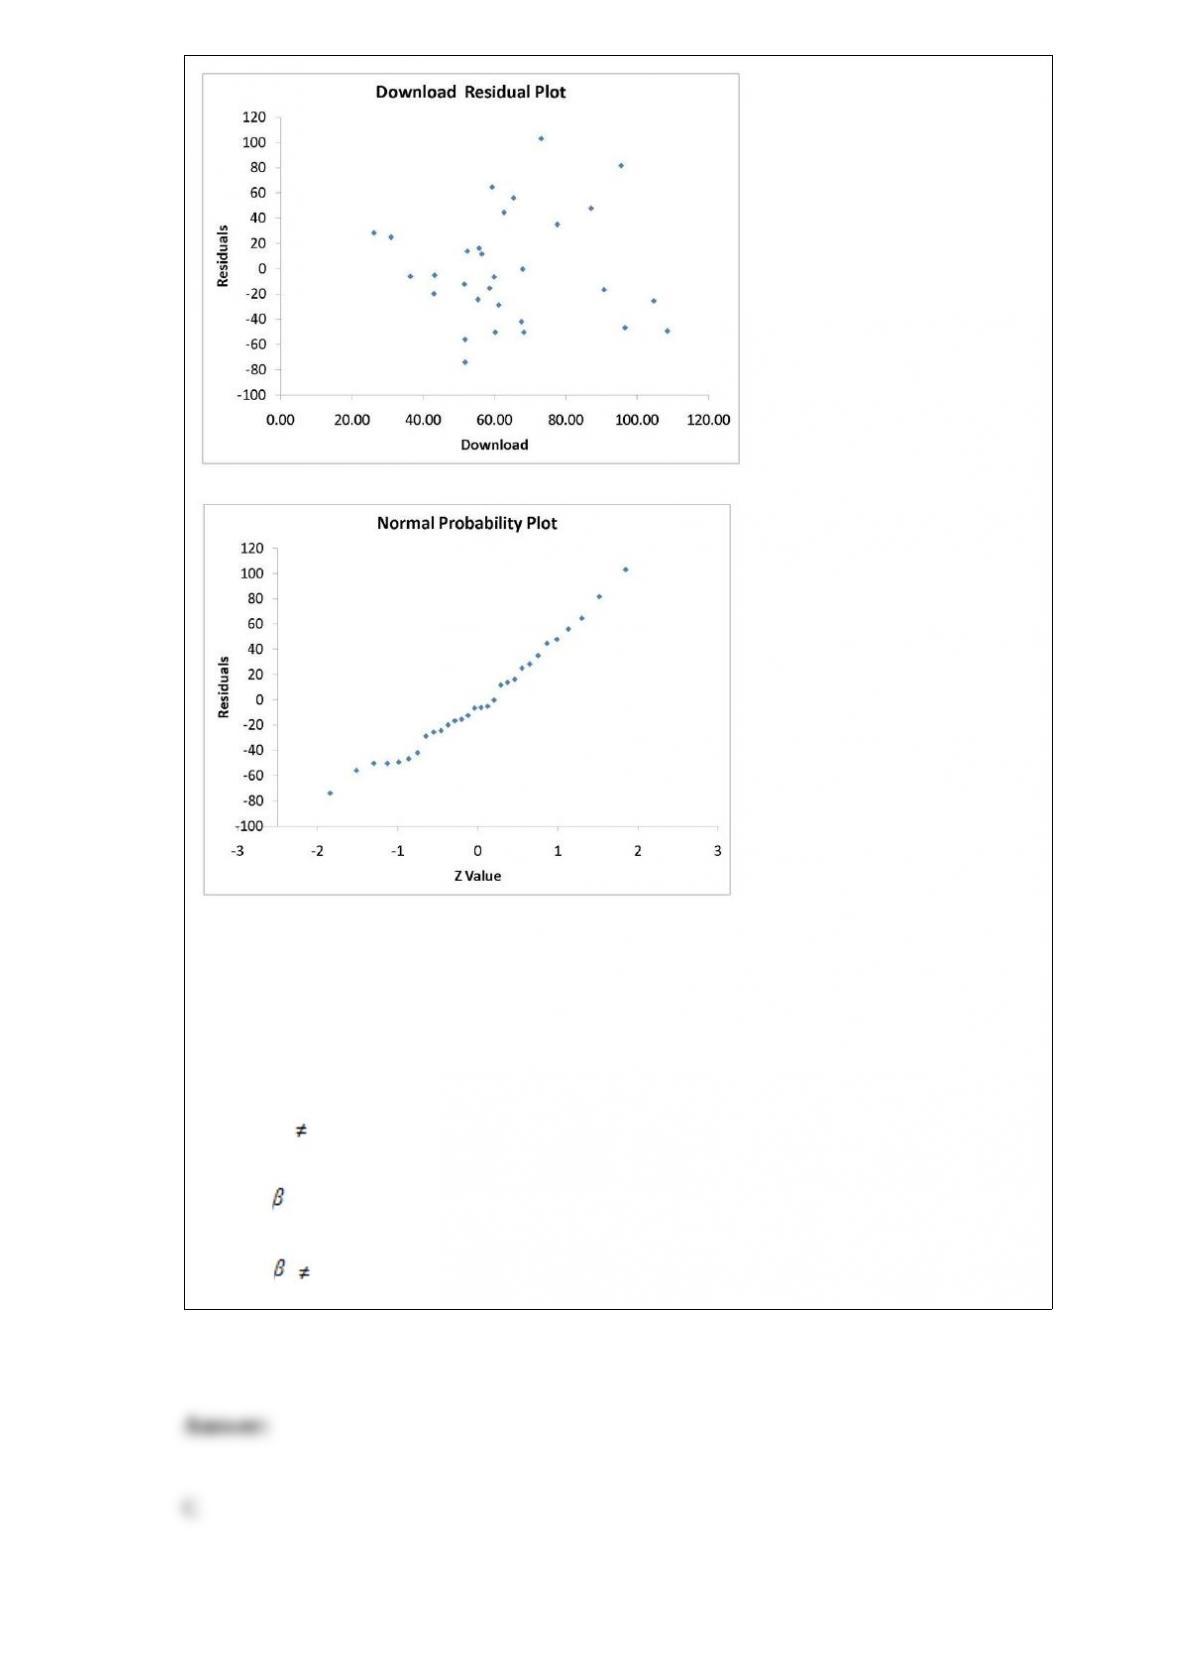
Following is the output from a simple linear regression along with the residual plot and
normal probability plot obtained from a data set of 30 different sharewares that he has
developed:
Referring to Table 13-11, which of the following is the correct null hypothesis for
testing whether there is a linear relationship between revenue and the number of
downloads?
A) H0 : b1 = 0
B) H0 : b1 0
C) H0 : 1 = 0
D) H0 : 1 0
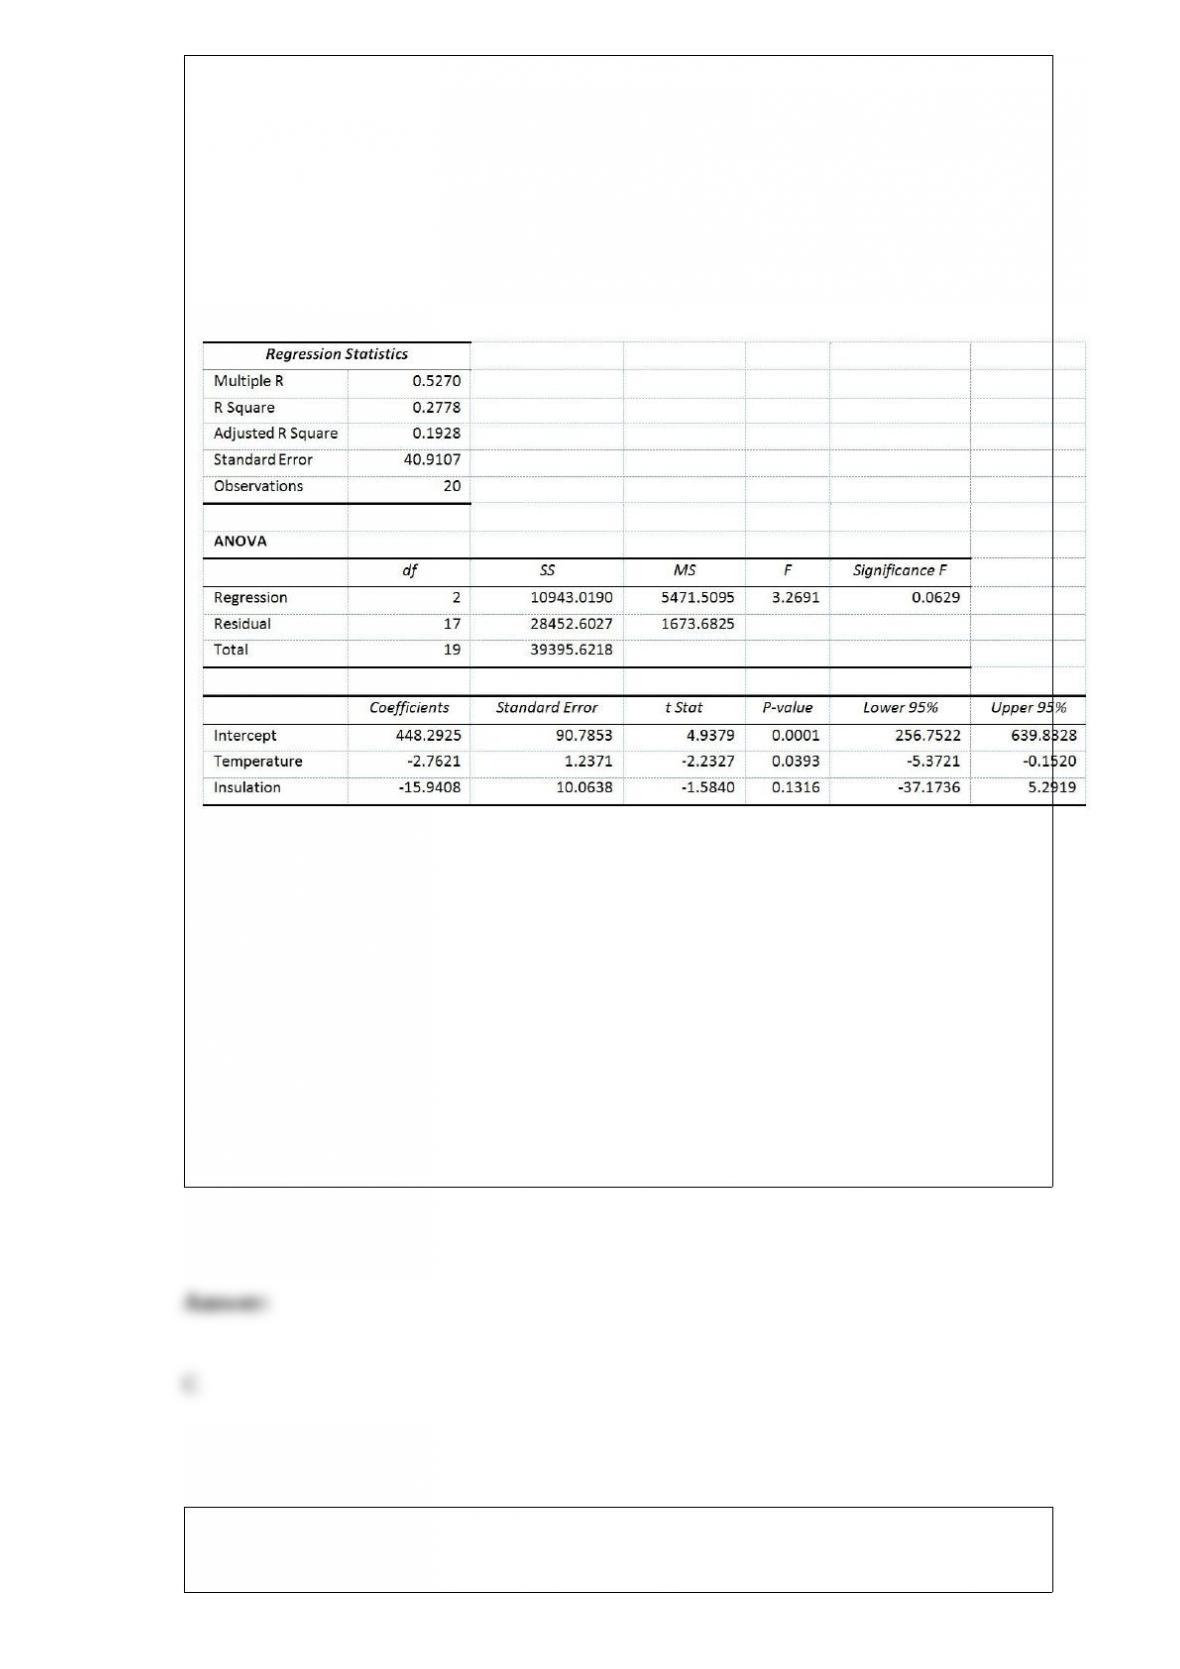
Referring to Table 14-6, the estimated value of the regression parameter β1 means that
TABLE 14-6
One of the most common questions of prospective house buyers pertains to the cost of
heating in dollars (Y). To provide its customers with information on that matter, a large
real estate firm used the following 2 variables to predict heating costs: the daily
minimum outside temperature in degrees of Fahrenheit (X1) and the amount of
insulation in inches (X2). Given below is EXCEL output of the regression model.
Also SSR (X1∣ X2) = 8343.3572 and SSR (X2∣ X1) = 4199.2672
A) holding the effect of the amount of insulation constant, an estimated expected $1
increase in heating costs is associated with a decrease in the daily minimum outside
temperature by 2.76 degrees.
B) holding the effect of the amount of insulation constant, a 1 degree increase in the
daily minimum outside temperature results in a decrease in heating costs by $2.76.
C) holding the effect of the amount of insulation constant, a 1 degree increase in the
daily minimum outside temperature results in an estimated decrease in mean heating
costs by $2.76.
D) holding the effect of the amount of insulation constant, a 1% increase in the daily
minimum outside temperature results in an estimated decrease in mean heating costs by
2.76%.
For a potential investment of $5,000, a portfolio has an EMV of $1,000 and a standard
deviation of $100. What is the coefficient of variation?
A) 10%
B) 20%
C) 50%
D) 100%
An agronomist wants to compare the crop yield of 3 varieties of chickpea seeds. She
plants all 3 varieties of the seeds on each of 5 different patches of fields. She then
measures the crop yield in bushels per acre. Which of the following tests will be the
most appropriate to find out if there is any difference in crop yield among the 3
varieties?
A) Paired t test
B) One-way ANOVA F test for differences among more than two means
C) Randomized block F test for differences among more than two means
D) Two-way ANOVA F test for the variety effect
TABLE 13-2
A candy bar manufacturer is interested in trying to estimate how sales are influenced by
the price of their product. To do this, the company randomly chooses 6 small cities and
offers the candy bar at different prices. Using candy bar sales as the dependent variable,
the company will conduct a simple linear regression on the data below:
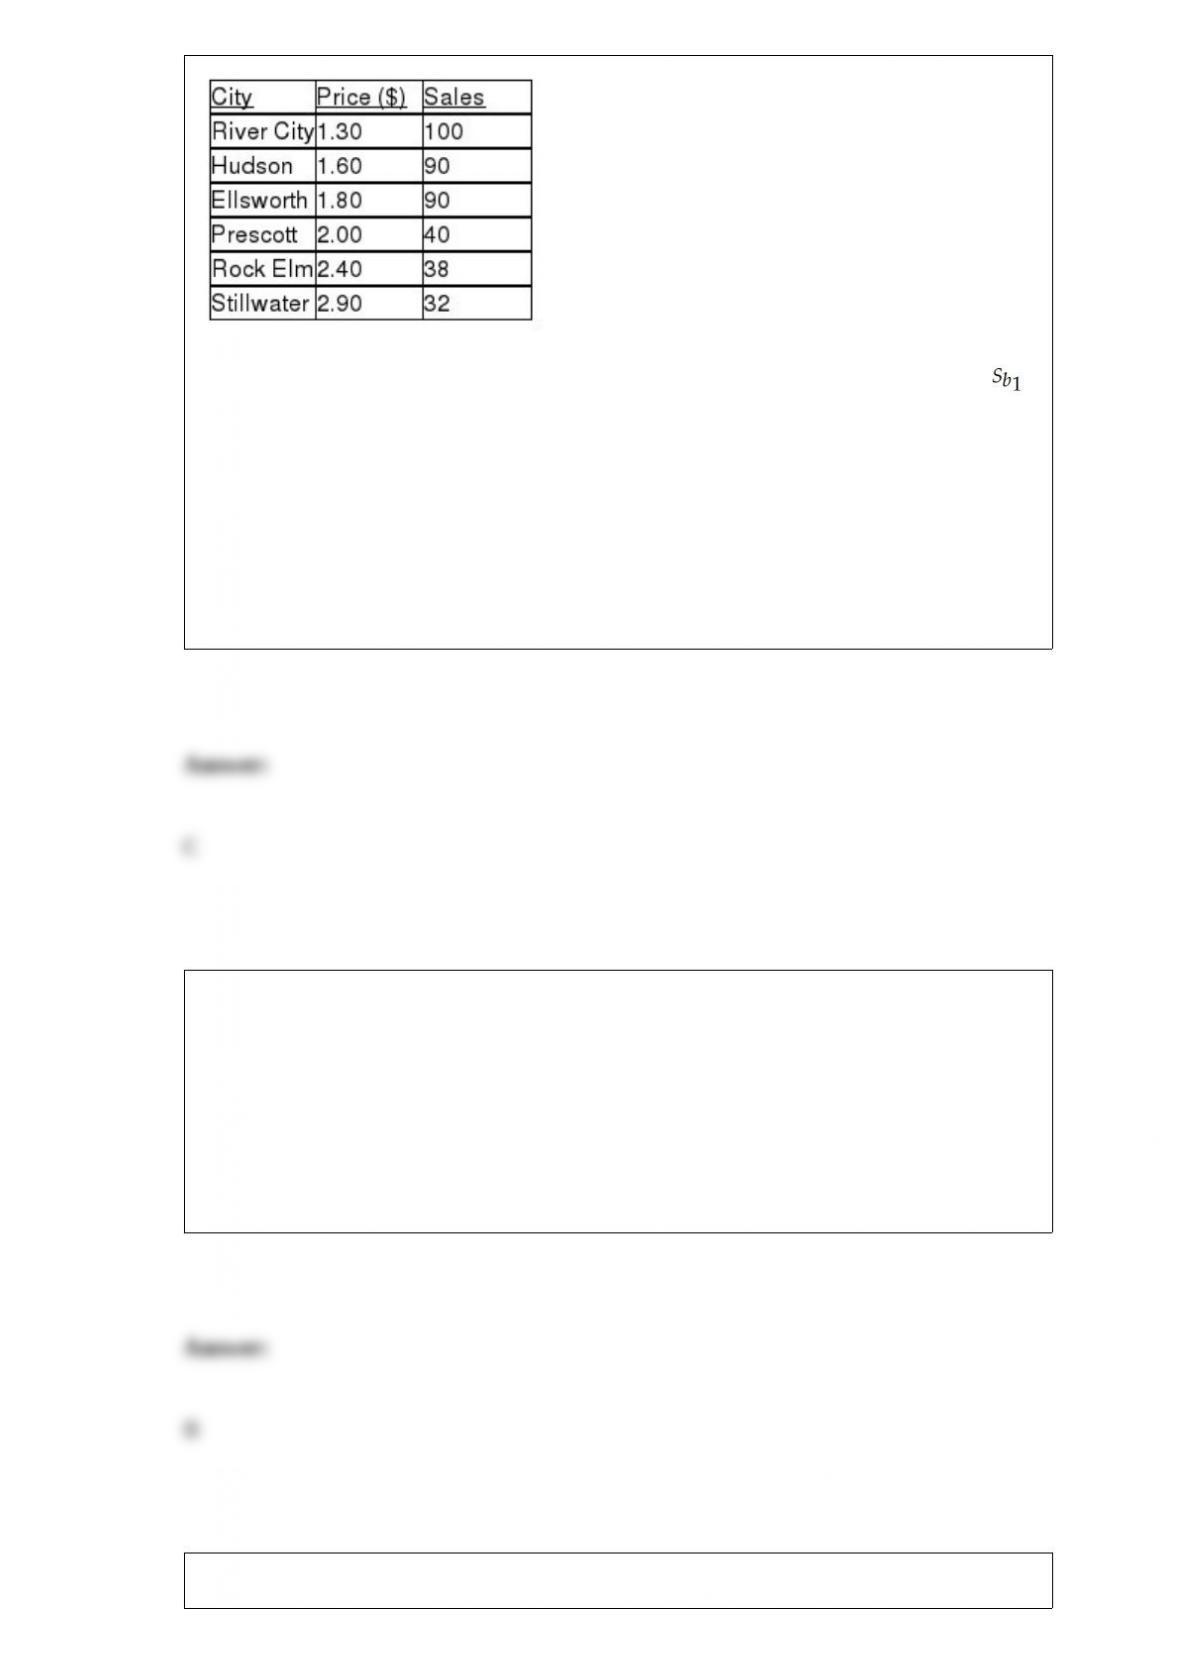
Referring to Table 13-2, what is the standard error of the regression slope estimate, ?
A) 0.784
B) 0.885
C) 12.650
D) 16.299
To test the effectiveness of a business school preparation course, 8 students took a
general business test before and after the course. Suppose the before and after exam
scores are both normally distributed. Which of the following tests will be the most
appropriate?
A) Pooled-variance t test
B) Paired t test
C) Wilcoxon rank sum test
D) McNemar test
TABLE 18-4
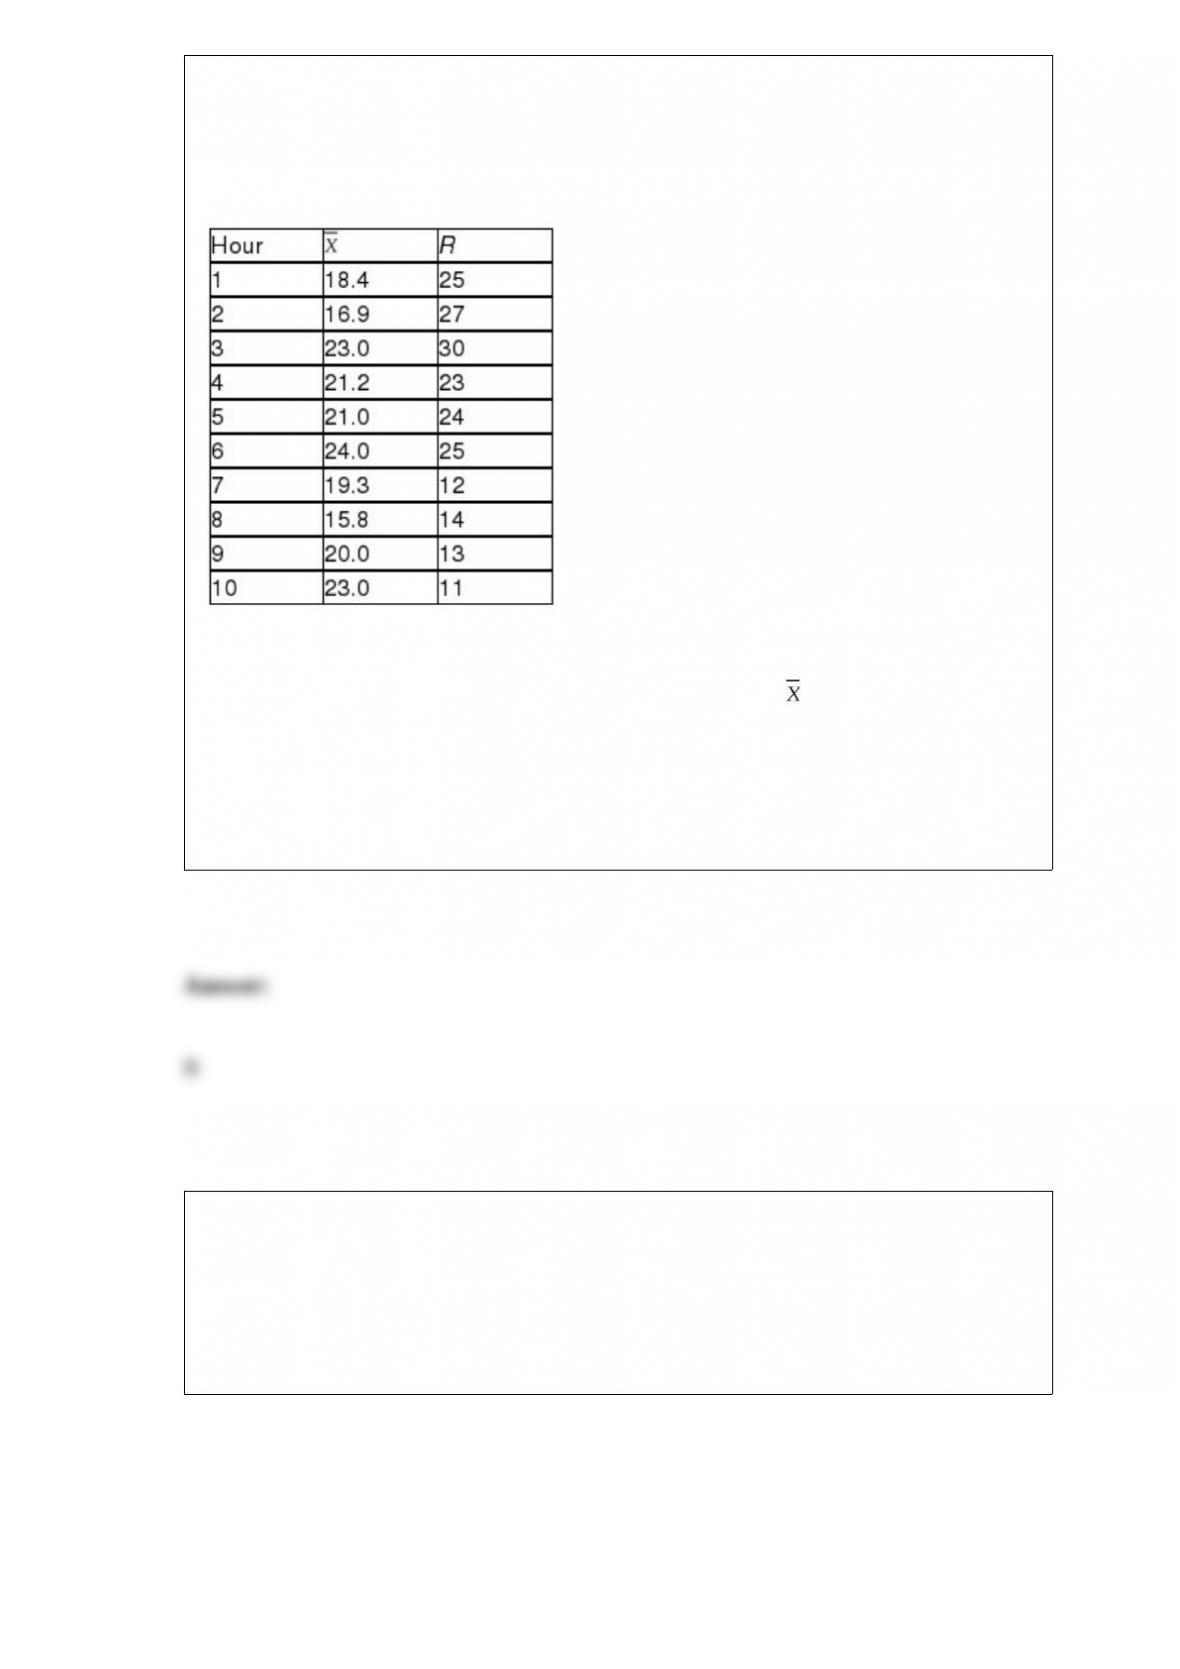
A factory supervisor is concerned that the time it takes workers to complete an
important production task (measured in seconds) is too erratic and adversely affects
expected profits. The supervisor proceeds by randomly sampling 5 individuals per hour
for a period of 10 hours. The sample mean and range for each hour are listed below.
She also decides that lower and upper specification limit for the critical-to-quality
variable should be 10 and 30 seconds, respectively.
Referring to Table 18-4, suppose the supervisor constructs an chart to see if the
process is in-control. What are the lower and upper control limits of this chart?
A) 10.00, 30.00
B) 8.49, 32.03
C) 5.39, 35.13
D) 4.96, 35.56
TABLE 17-1
A real estate builder wishes to determine how house size (House) is influenced by
family income (Income), family size (Size), and education of the head of household
(School). House size is measured in hundreds of square feet, income is measured in
thousands of dollars, and education is in years. The builder randomly selected 50
families and ran the multiple regression. Microsoft Excel output is provided below:
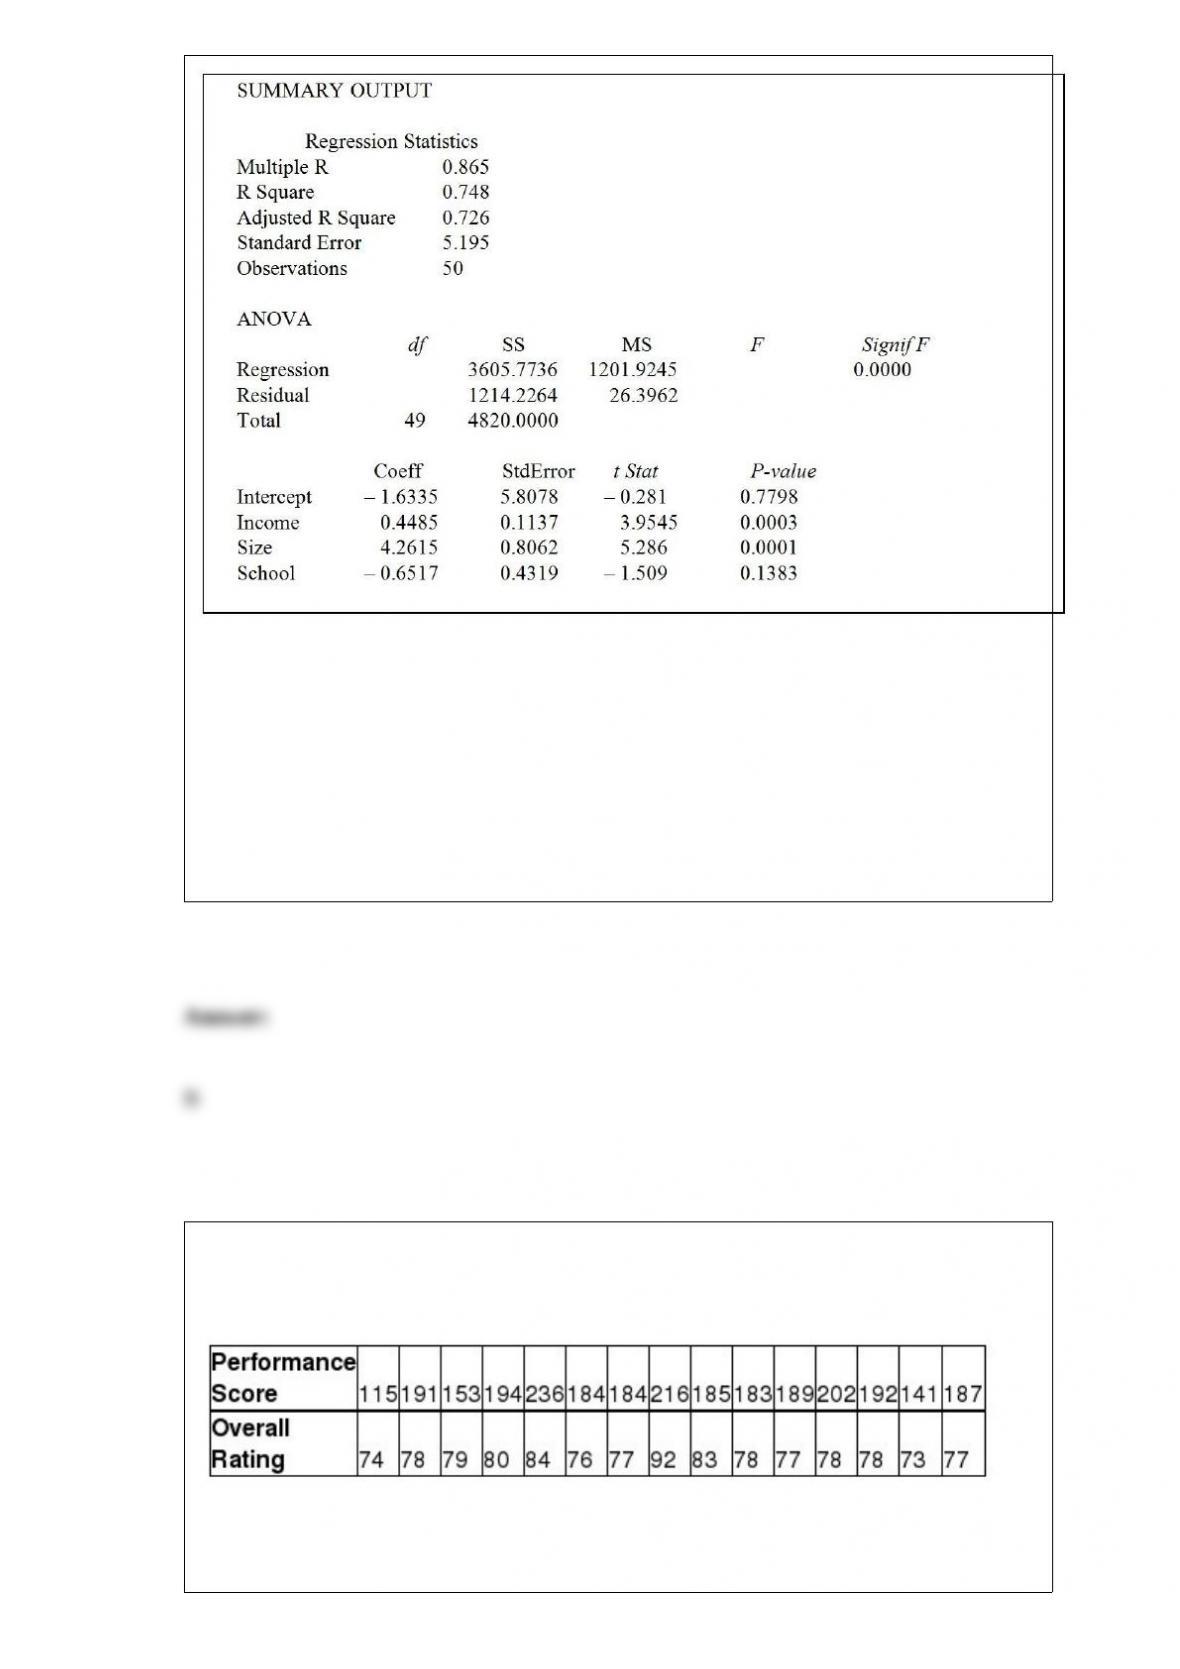
Referring to Table 17-1, when the builder used a simple linear regression model with
house size (House) as the dependent variable and education (School) as the independent
variable, he obtained an r2 value of 23.0%. What additional percentage of the total
variation in house size has been explained by including family size and income in the
multiple regression?
A) 2.8%
B) 51.8%
C) 72.6%
D) 74.8%
TABLE 3-12
Given below are the rating and performance scores of 15 laptop computers.
Referring to Table 3-12, you will expect a decrease in the performance score of one
laptop computer to be associated with
A) an increase in its rating.
B) a decrease in its rating.
C) no predictable change in its rating.
D) no predictable change in the performance score of another laptop computer.
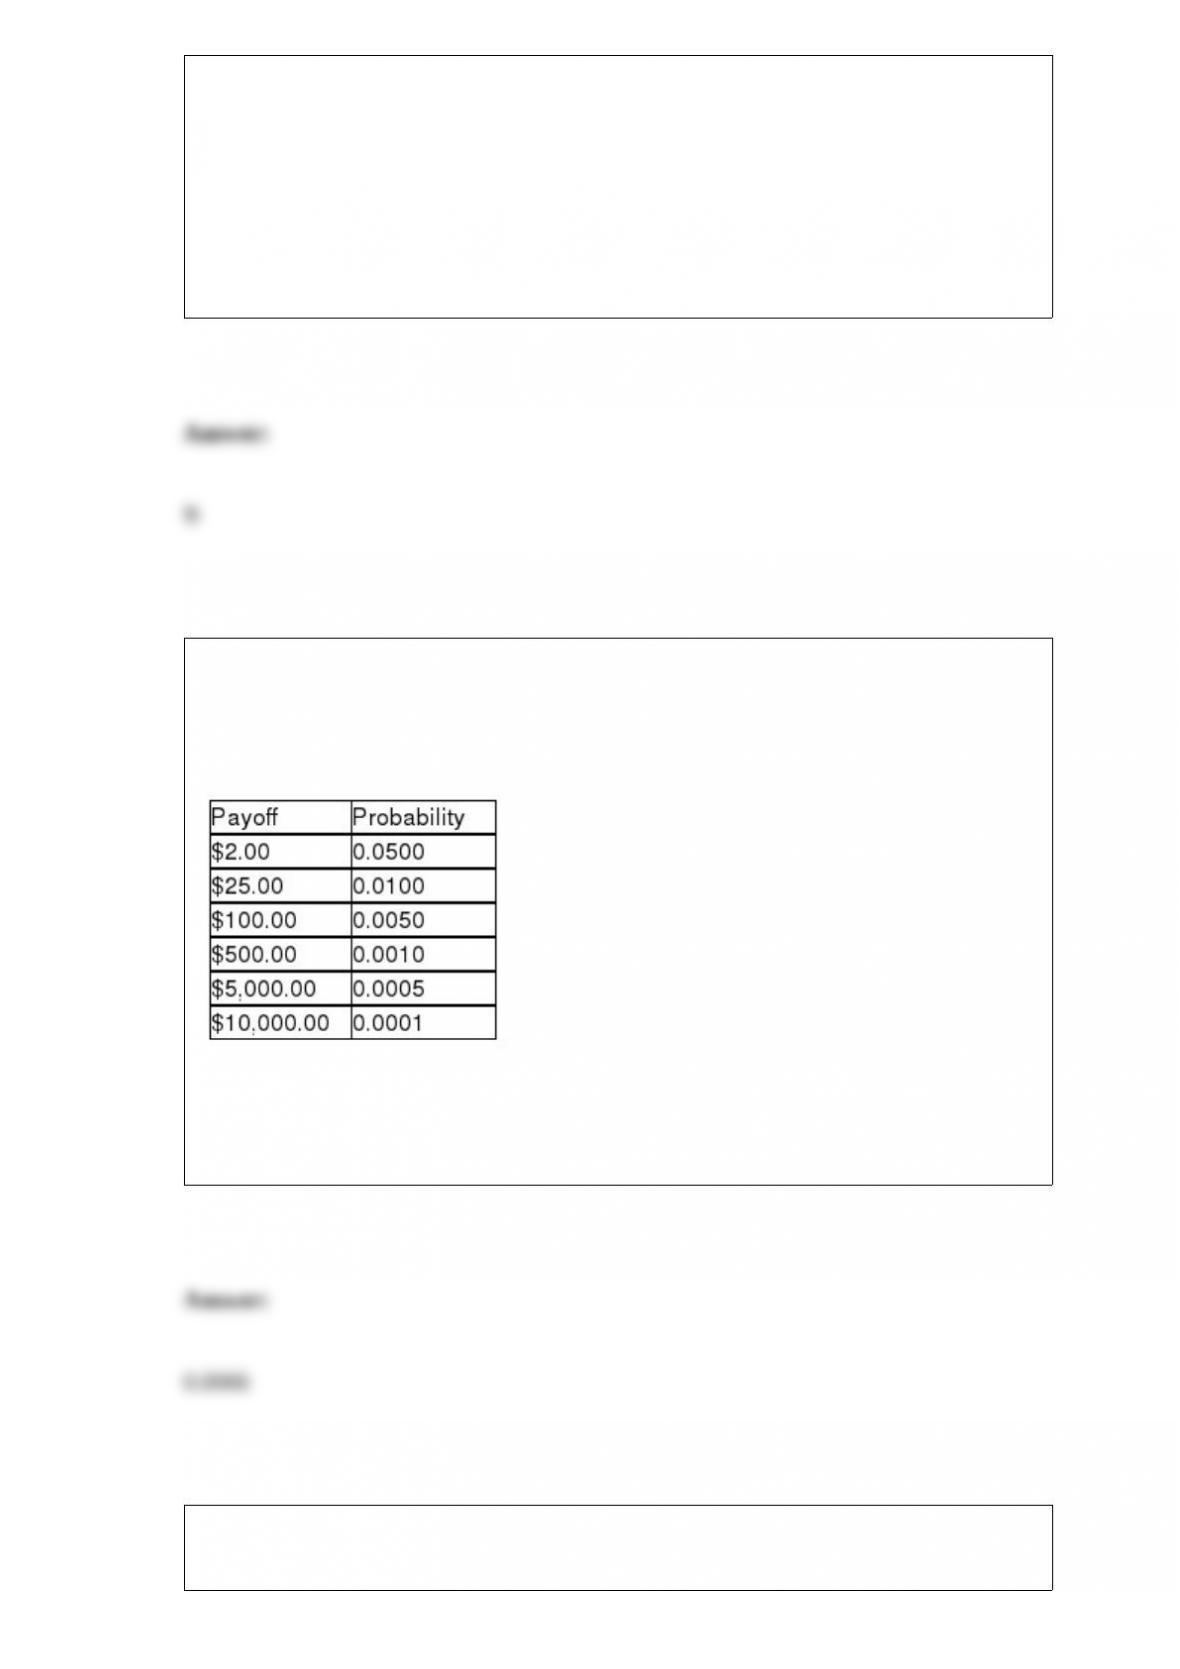
TABLE 4-7
The next state lottery will have the following payoffs possible with their associated
probabilities.
You buy a single ticket.
Referring to Table 4-7, the probability that you win at least $100.00 is ________.
TABLE 6-3

Suppose the time interval between two consecutive defective light bulbs from a
production line has a uniform distribution over an interval from 0 to 90 minutes.
Referring to Table 6-3, what is the standard deviation of the time interval?
TABLE 6-2
John has two jobs. For daytime work at a jewelry store he is paid $15,000 per month,
plus a commission. His monthly commission is normally distributed with a mean of
$10,000 and a standard deviation of $2,000. At night he works occasionally as a waiter,
for which his monthly income is normally distributed with a mean of $1,000 and a
standard deviation of $300. John’s income levels from these two sources are
independent of each other.
Referring to Table 6-2, the probability is 0.10 that John’s commission from the jewelry
store is more than how much in a given month?
TABLE 9-9
The president of a university claimed that the entering class this year appeared to be
larger than the entering class from previous years but their mean SAT score is lower
than previous years. He took a sample of 20 of this year’s entering students and found
that their mean SAT score is 1,501 with a standard deviation of 53. The university’s
record indicates that the mean SAT score for entering students from previous years is
1,520. He wants to find out if his claim is supported by the evidence at a 5% level of
significance.
Referring to Table 9-9, what critical value should the president use to determine the
rejection region?
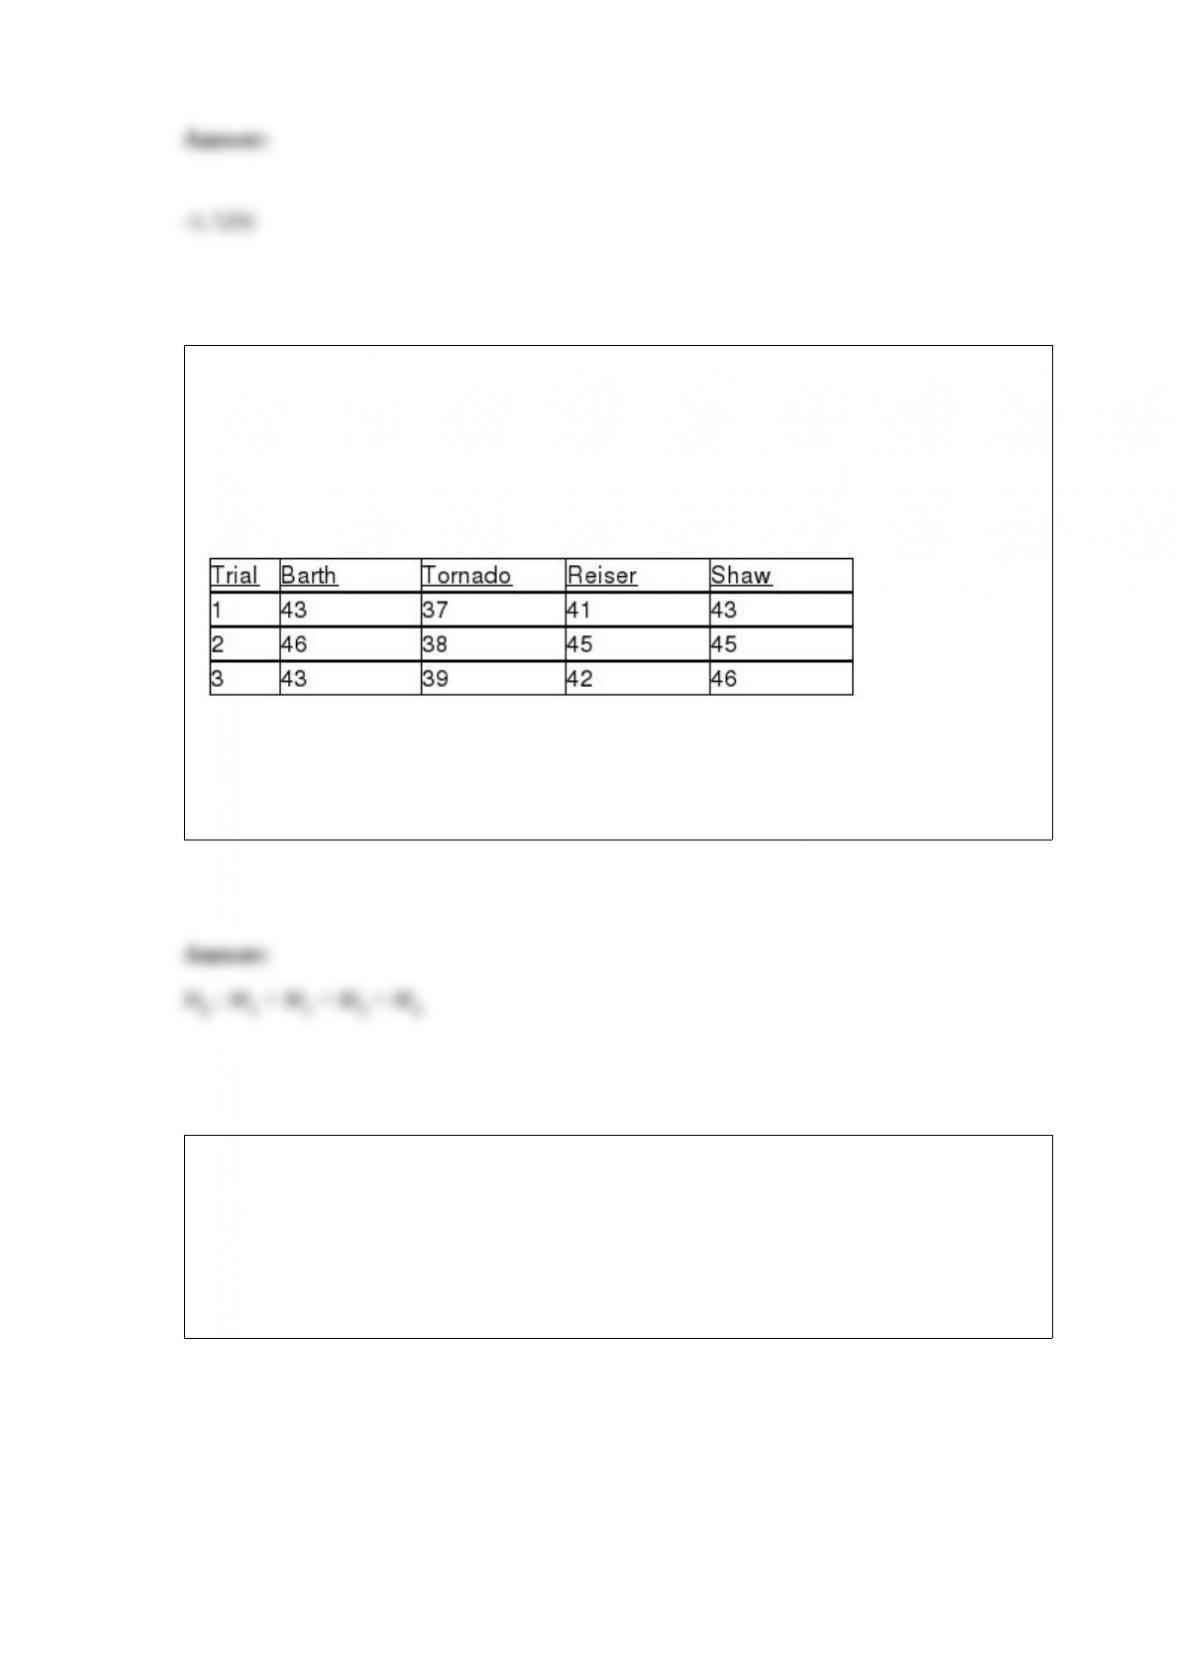
TABLE 12-16
As part of an evaluation program, a sporting goods retailer wanted to compare the
downhill coasting speeds of 4 brands of bicycles. She took 3 of each brand and
determined their maximum downhill speeds. The results are presented in miles per hour
in the table below.
Referring to Table 12-16, the sporting goods retailer decided to perform a
Kruskal-Wallis test even though the sample size in each of the 4 groups is not larger
than 5. The null hypothesis of the test is ________.
TABLE 13-10
The management of a chain electronic store would like to develop a model for
predicting the weekly sales (in thousands of dollars) for individual stores based on the
number of customers who made purchases. A random sample of 12 stores yields the
following results:
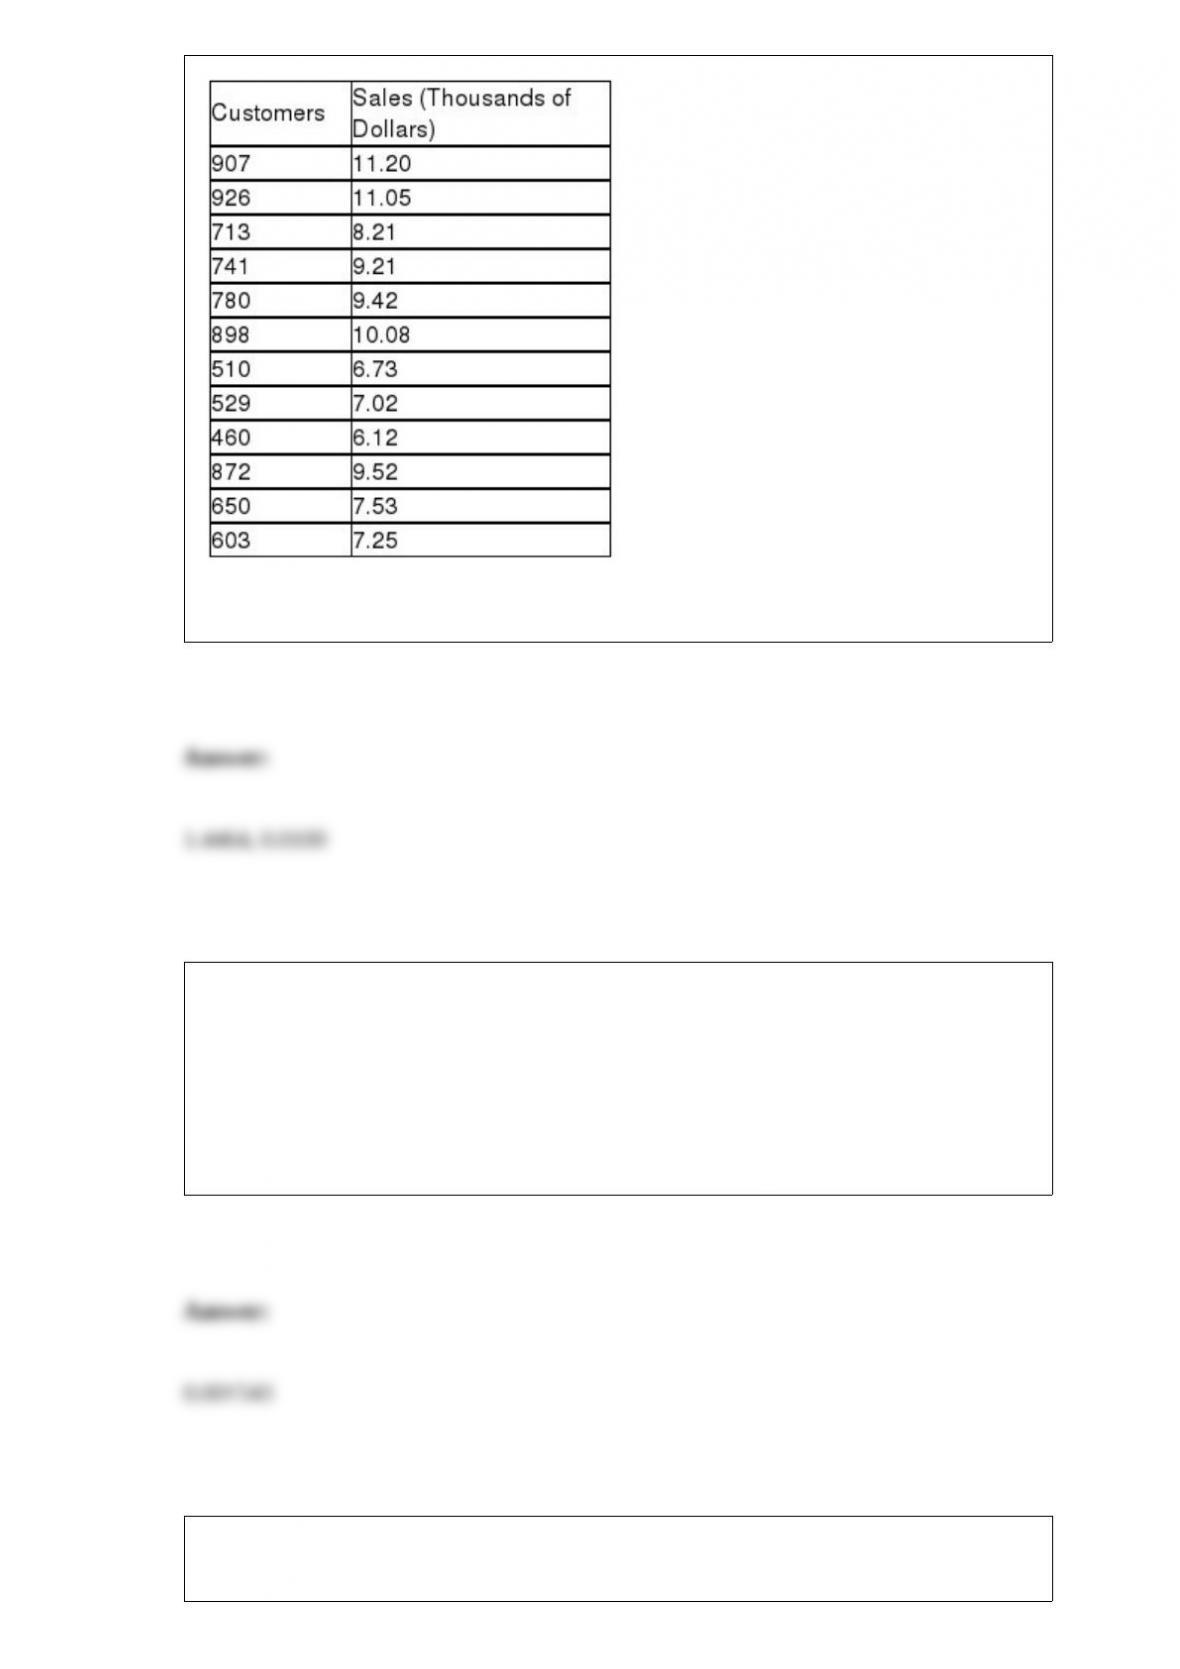
Referring to Table 13-10, what are the values of the estimated intercept and slope?
TABLE 5-5
From an inventory of 48 new cars being shipped to local dealerships, corporate reports
indicate that 12 have defective radios installed.
Referring to Table 5-5, what is the probability out of the 8 new cars it just received that,
when each is tested, exactly two of the cars have non-defective radios?
TABLE 19-5
The following payoff table shows profits associated with a set of 2 alternatives under 3
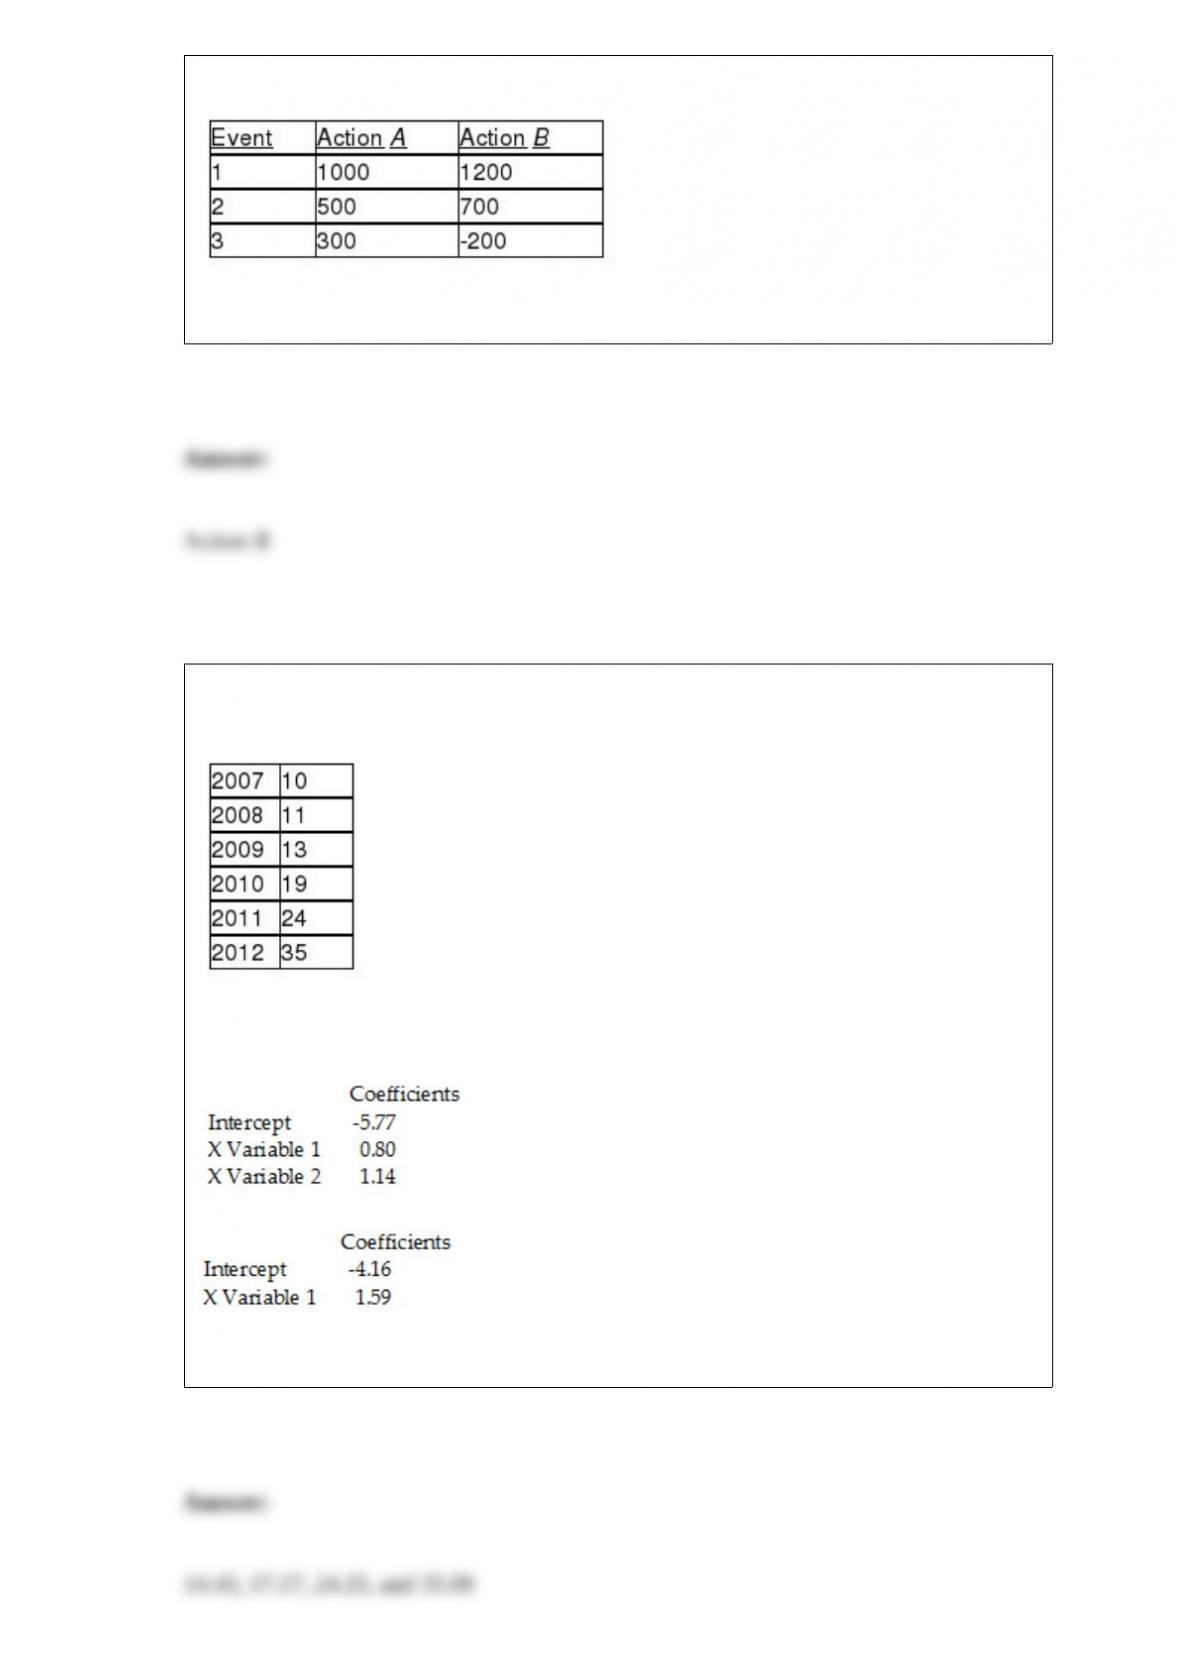
possible events.
Suppose that the probability of Event 1 is 0.2, Event 2 is 0.5, and Event 3 is 0.3.
Referring to Table 19-5, what is the optimal action using maximax criterion?
TABLE 16-10
Business closures in Laramie, Wyoming from 2007 to 2012 were:
Microsoft Excel was used to fit both first-order and second-order autoregressive
models, resulting in the following partial outputs:
SUMMARY OUTPUT – 2nd Order Model
SUMMARY OUTPUT – 1st Order Model
Referring to Table 16-10, the fitted values for the second-order autoregressive model
are ________, ________, ________, and ________.

The online access computer service industry is growing at an extraordinary rate.
Current estimates suggest that 75% of the home-based computers have access to online
services. Suppose 20 people with home-based computers were randomly and
independently sampled. Find the probability that fewer than 10 of those sampled
currently have access to online services.