TABLE 4-3
A survey is taken among customers of a fast-food restaurant to determine preference for
hamburger or chicken. Of 200 respondents selected, 75 were children and 125 were
adults. 120 preferred hamburger and 80 preferred chicken. 55 of the children preferred
hamburger.
Referring to Table 4-3, assume we know that a person prefers hamburger. The
probability that this individual is a child is ________.
Referring to Table 17-3, the value of the adjusted coefficient of multiple determination,
adj r2, is ________.
Referring to Table 14-8, ________% of the variation in salary can be
explained by the variation in experience while holding age
constant.TABLE 14-8
A financial analyst wanted to examine the relationship between salary
(in $1,000) and 2 variables: age
(X1 = Age) and experience in the field (X2 = Exper). He took a sample
of 20 employees and obtained the following Microsoft Excel output:
Also, the sum of squares due to the regression for the model that
includes only Age is 5022.0654 while the sum of squares due to the
regression for the model that includes only Exper is 125.9848.
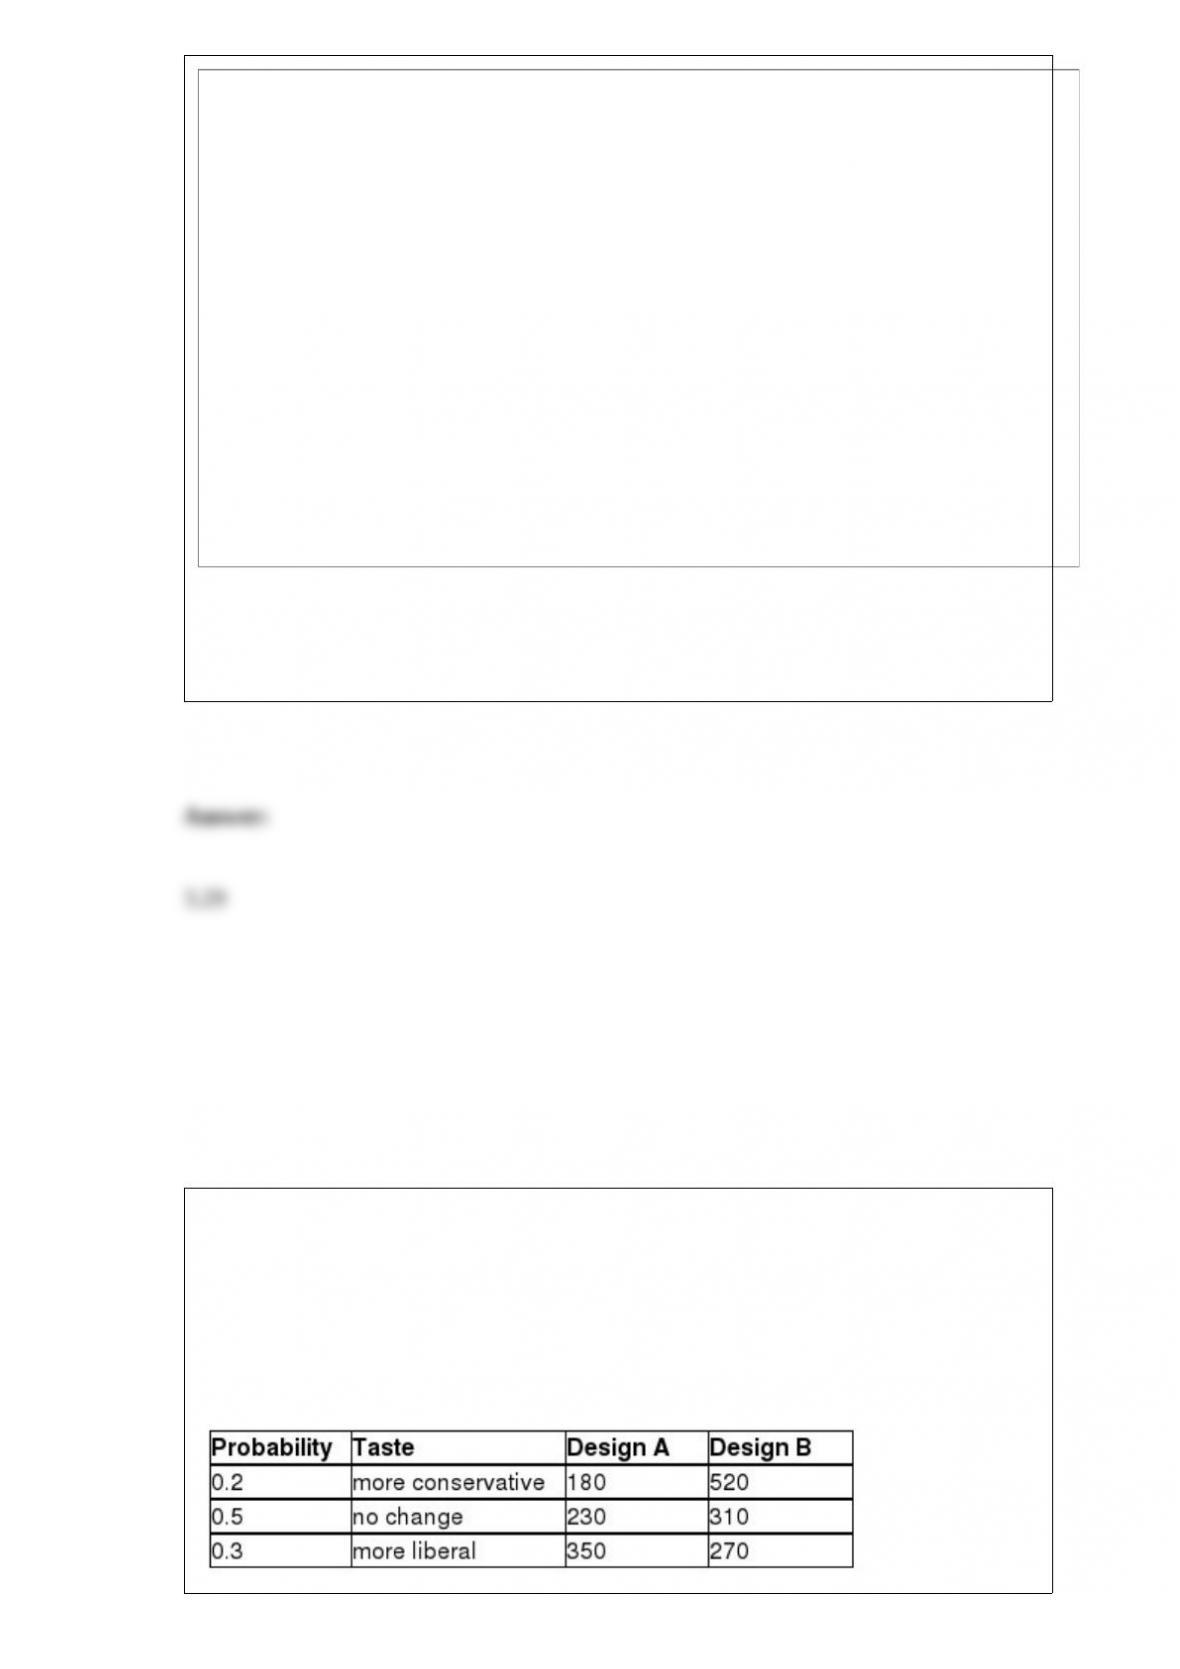
TABLE 5-8
Two different designs on a new line of winter jackets for the coming winter are
available for your manufacturing plants. Your profit (in thousands of dollars) will
depend on the taste of the consumers when winter arrives. The probability of the three
possible different tastes of the consumers and the corresponding profits are presented in
the following table.
Referring to Table 5-8, the table above is called the ________ for the two designs.
Suppose Z has a standard normal distribution with a mean of 0 and standard deviation
of 1. The probability that Z is between -2.33 and 2.33 is ________.
A study at a college in the west coast reveals that, historically, 45% of the students are
minority students. If a random sample size of 75 is selected, the probability is ________
that more than half of the students in the sample will be minority students.