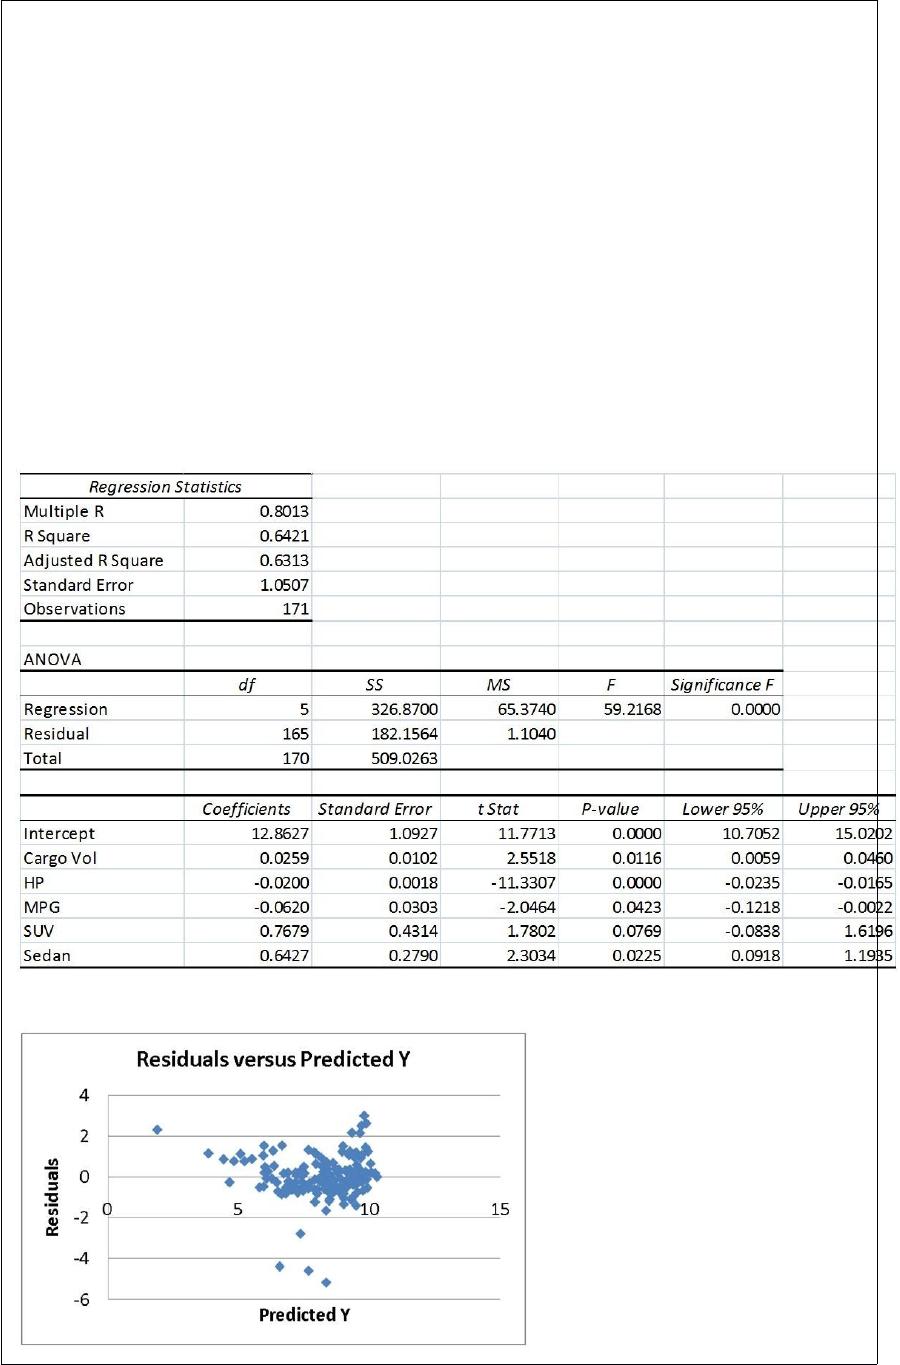
True or False: TABLE 17-9
What are the factors that determine the acceleration time (in sec.) from 0 to 60 miles per
hour of a car? Data on the following variables for 171 different vehicle models were
collected:
Accel Time: Acceleration time in sec.
Cargo Vol: Cargo volume in cu. ft.
HP: Horsepower
MPG: Miles per gallon
SUV: 1 if the vehicle model is an SUV with Coupe as the base when SUV and Sedan
are both 0
Sedan: 1 if the vehicle model is a sedan with Coupe as the base when SUV and Sedan
are both 0
The regression results using acceleration time as the dependent variable and the
remaining variables as the independent variables are presented below.
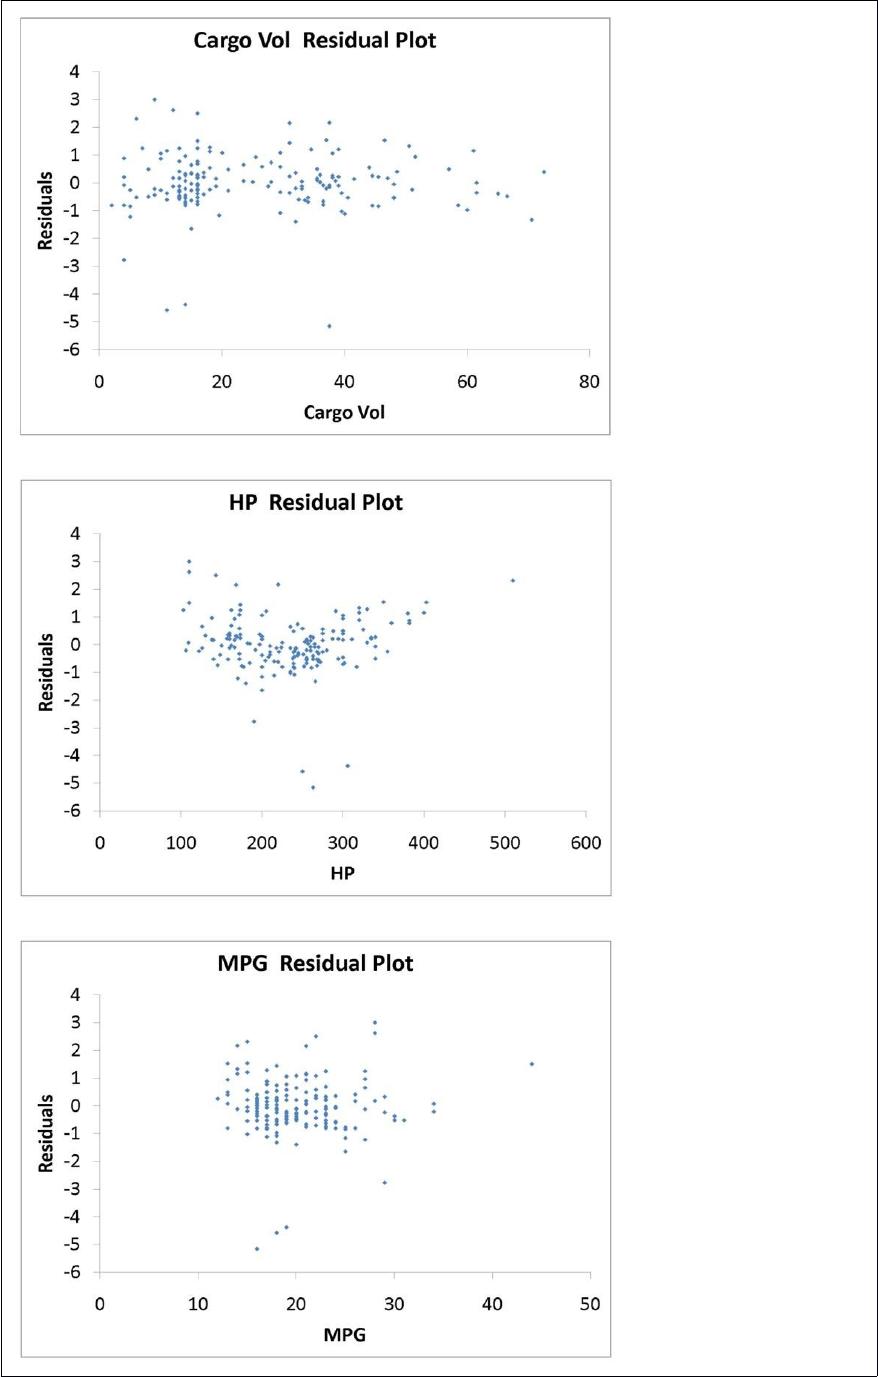
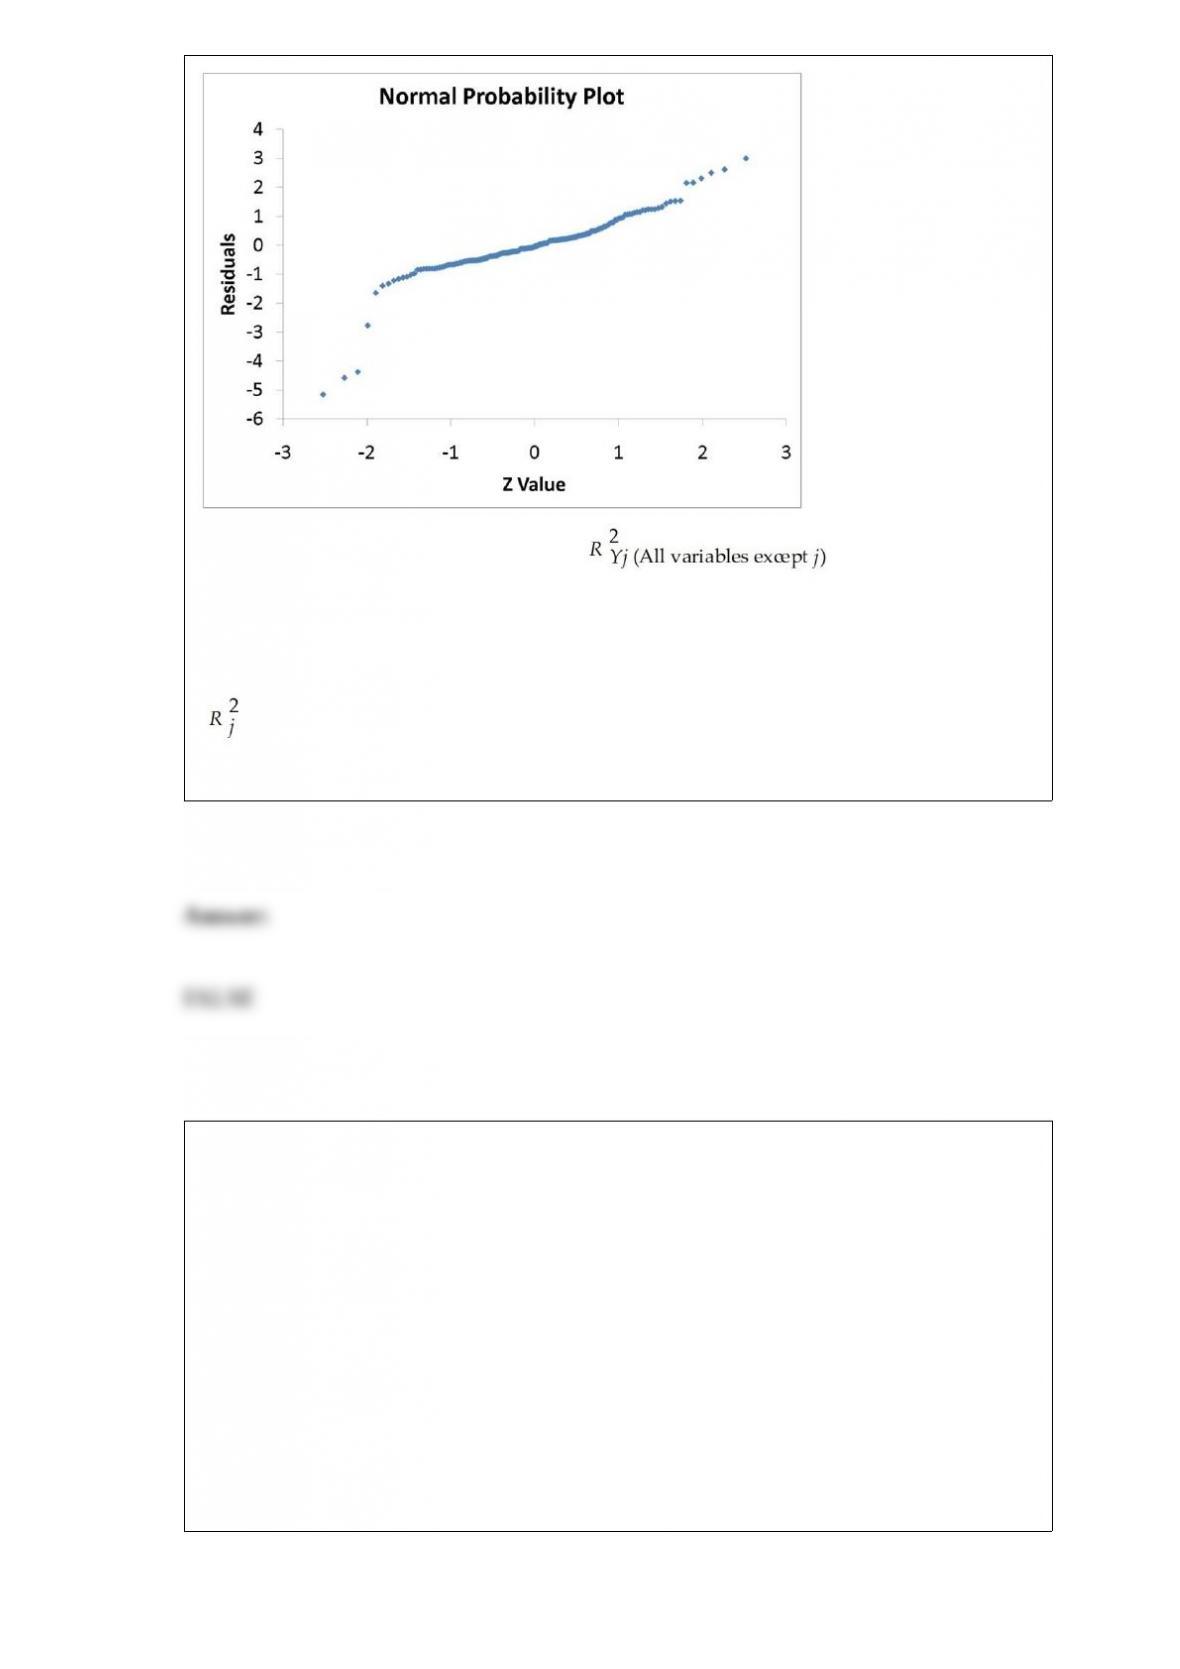
The various residual plots are as shown below.
The coefficient of partial determination ( ) of each of the 5
predictors are, respectively, 0.0380, 0.4376, 0.0248, 0.0188, and 0.0312.
The coefficient of multiple determination for the regression model using each of the 5
variables Xj as the dependent variable and all other X variables as independent variables
( ) are, respectively, 0.7461, 0.5676, 0.6764, 0.8582, 0.6632.
Referring to Table 17-9, the errors (residuals) appear to be normally distributed.
TABLE 9-4
A drug company is considering marketing a new local anesthetic. The effective time of
the anesthetic the drug company is currently producing has a normal distribution with a
mean of 7.4 minutes with a standard deviation of 1.2 minutes. The chemistry of the new
anesthetic is such that the effective time should be normally distributed with the same
standard deviation, but the mean effective time may be lower. If it is lower, the drug
company will market the new anesthetic; otherwise, they will continue to produce the
older one. A sample size of 36 results in a sample mean of 7.1. A hypothesis test will be
done to help make the decision.
True or False: Referring to Table 9-4, if the level of significance had been chosen as
0.05, the company would market the new anesthetic.
TABLE 8-9
A university wanted to find out the percentage of students who felt comfortable
reporting cheating by their fellow students. A survey of 2,800 students was conducted
and the students were asked if they felt comfortable reporting cheating by their fellow
students. The results were 1,344 answered “Yes” and 1,456 answered “No.”
True or False: Referring to Table 8-9, it is possible that the 99% confidence interval
calculated from the data will not contain the sample proportion of students who feel
comfortable reporting cheating by their fellow students.
TABLE 11-10
An agronomist wants to compare the crop yield of 3 varieties of chickpea seeds. She
plants all 3 varieties of the seeds on each of 5 different patches of fields. She then
measures the crop yield in bushels per acre. Treating this as a randomized block design,
the results are presented in the table that follows.
True or False: Referring to Table 11-10, the decision made at a 0.01 level of
significance on the F test for the block effects implies that the blocking has been
advantageous in reducing the experiment error.
True or False: Data that exhibit an autocorrelation effect violate the regression
assumption of independence.
You know that the probability of a randomly selected student will cheat on an exam is
1%. You also know that the probability of a randomly selected student will cheat on an
exam knowing that his/her fellow classmate is cheating on the exam is also 1%. Which
of the following is true about the event of “the randomly selected student cheating on an
exam” and “his/her classmate is cheating on the exam”?
A) They are mutually exclusive.
B) They are collectively exhaustive.
C) They are independent.
D) None of the above.
In a two-way ANOVA, the degrees of freedom for the interaction term is
A) (r – 1) (c – 1).
B) rc(n – 1).
C) (r – 1).
D) rcn + 1.
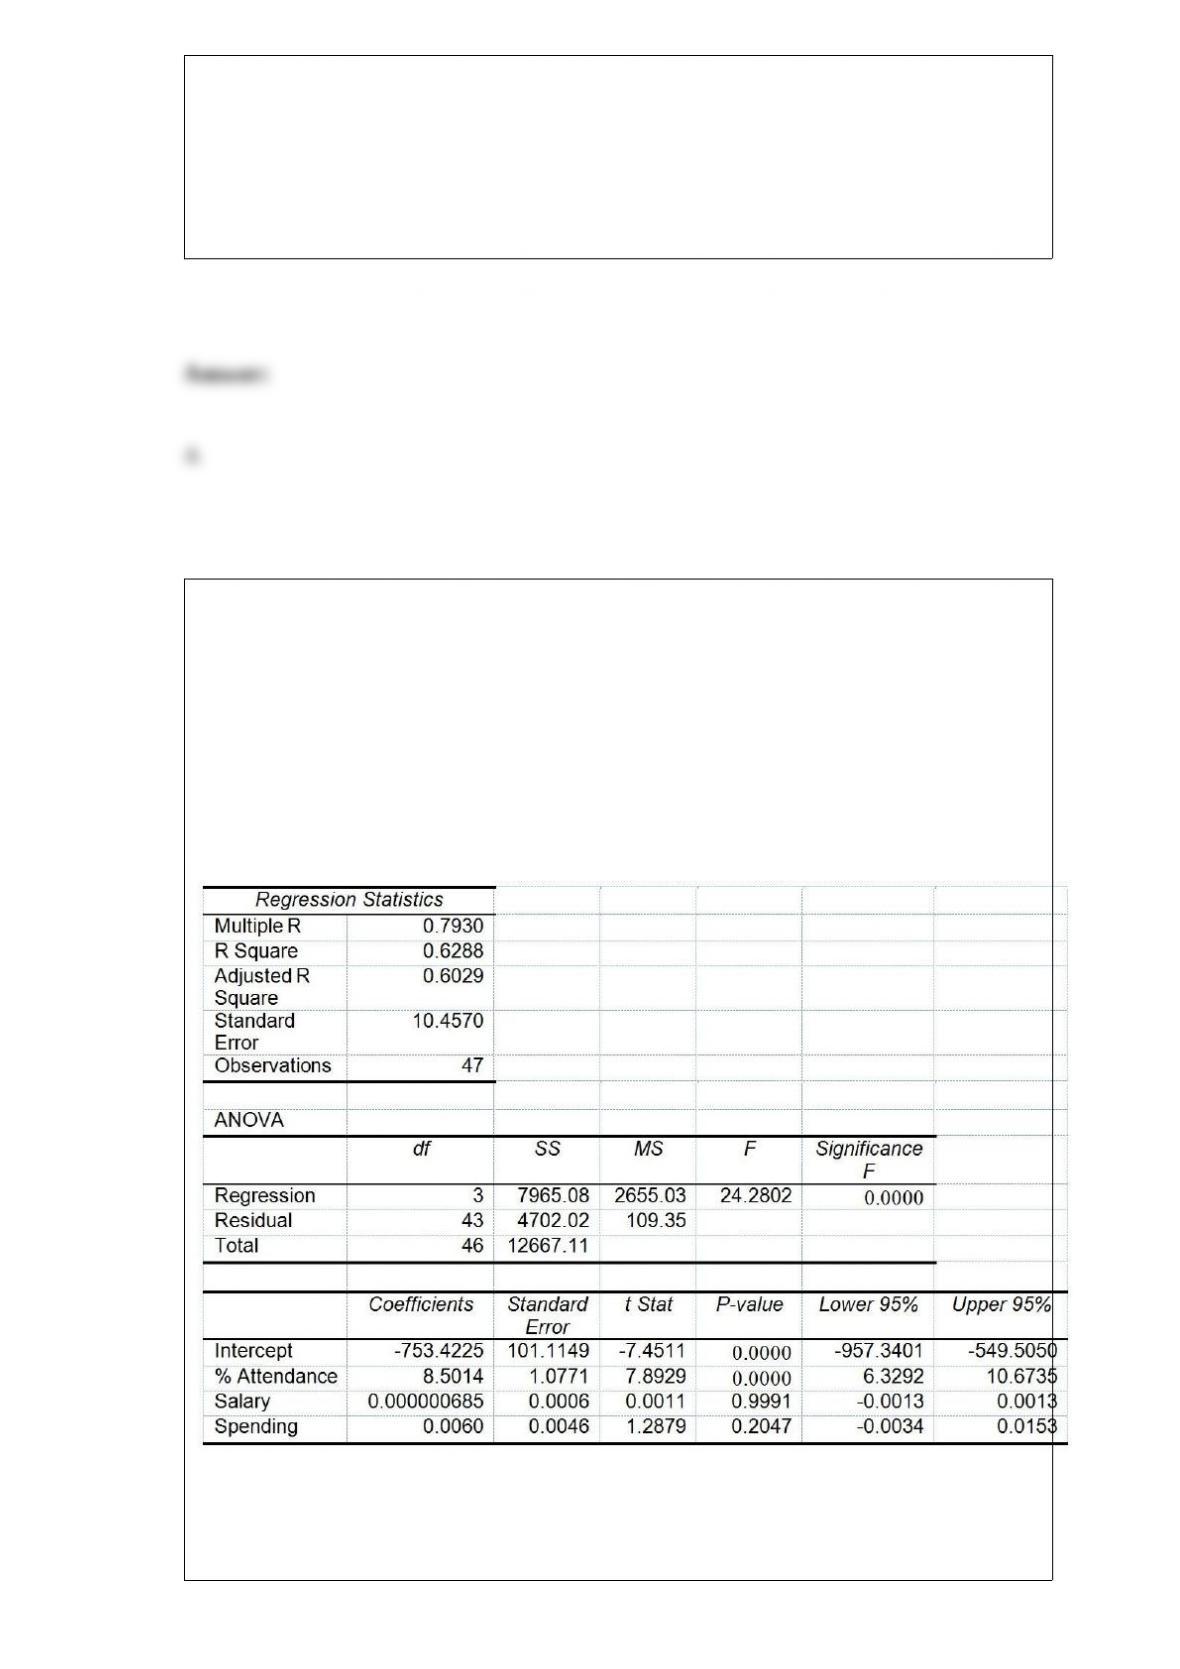
TABLE 17-8
The superintendent of a school district wanted to predict the percentage of students
passing a sixth-grade proficiency test. She obtained the data on percentage of students
passing the proficiency test (% Passing), daily mean of the percentage of students
attending class (% Attendance), mean teacher salary in dollars (Salaries), and
instructional spending per pupil in dollars (Spending) of 47 schools in the state.
Following is the multiple regression output with Y = % Passing as the dependent
variable, X1 = % Attendance, X2 = Salaries and X3 = Spending:
Referring to Table 17-8, which of the following is the correct alternative hypothesis to
test whether instructional spending per pupil has any effect on the percentage of
students passing the proficiency test, taking into account the effect of all the other
independent variables?
A) H1 : β0 ≠0
B) H1 : β1 ≠0
C) H1 : β2 ≠0
D) H1 : β3 ≠0
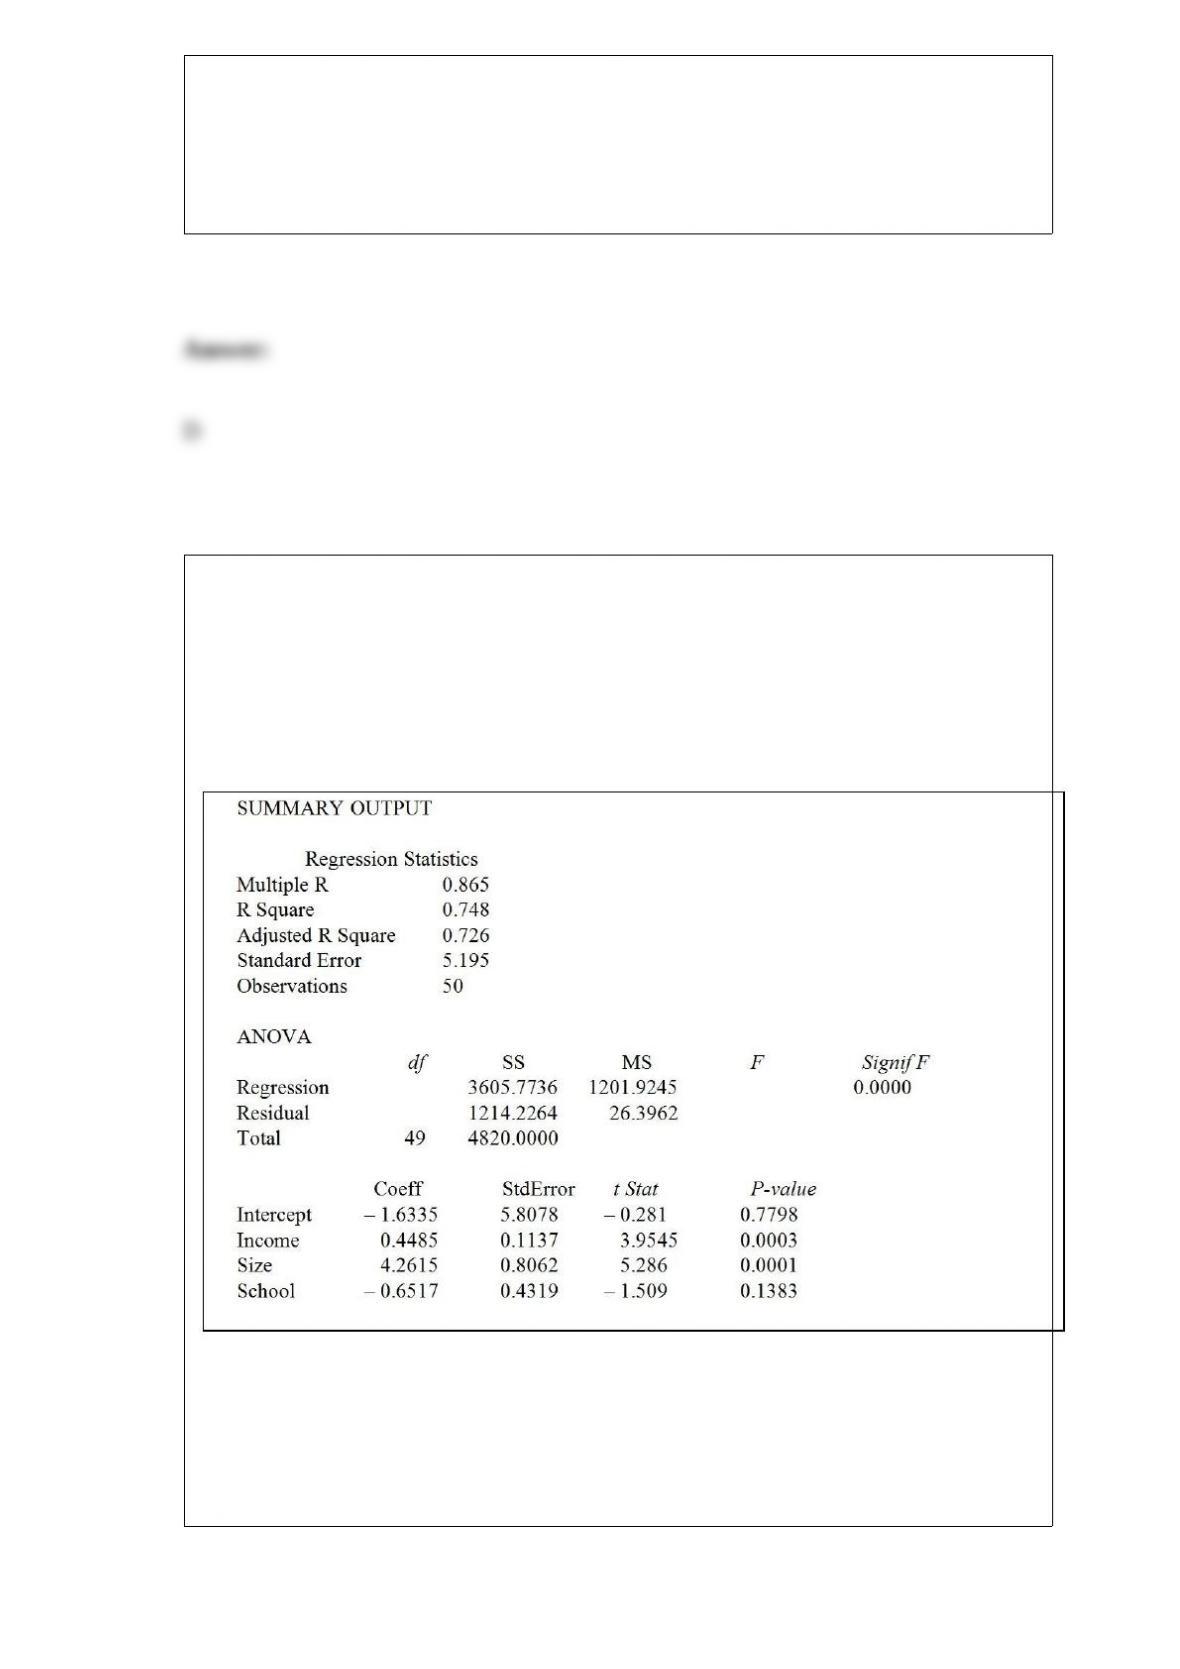
TABLE 17-1
A real estate builder wishes to determine how house size (House) is influenced by
family income (Income), family size (Size), and education of the head of household
(School). House size is measured in hundreds of square feet, income is measured in
thousands of dollars, and education is in years. The builder randomly selected 50
families and ran the multiple regression. Microsoft Excel output is provided below:
Referring to Table 17-1, what are the regression degrees of freedom that are missing
from the output?
A) 3
B) 46
C) 49
D) 50
If the assumptions of the one-way ANOVA F test are not met, which of the following
tests could be used?
A) McNemar test
B) Kruskal-Wallis test
C) Marascuilo procedure
D) None of the above
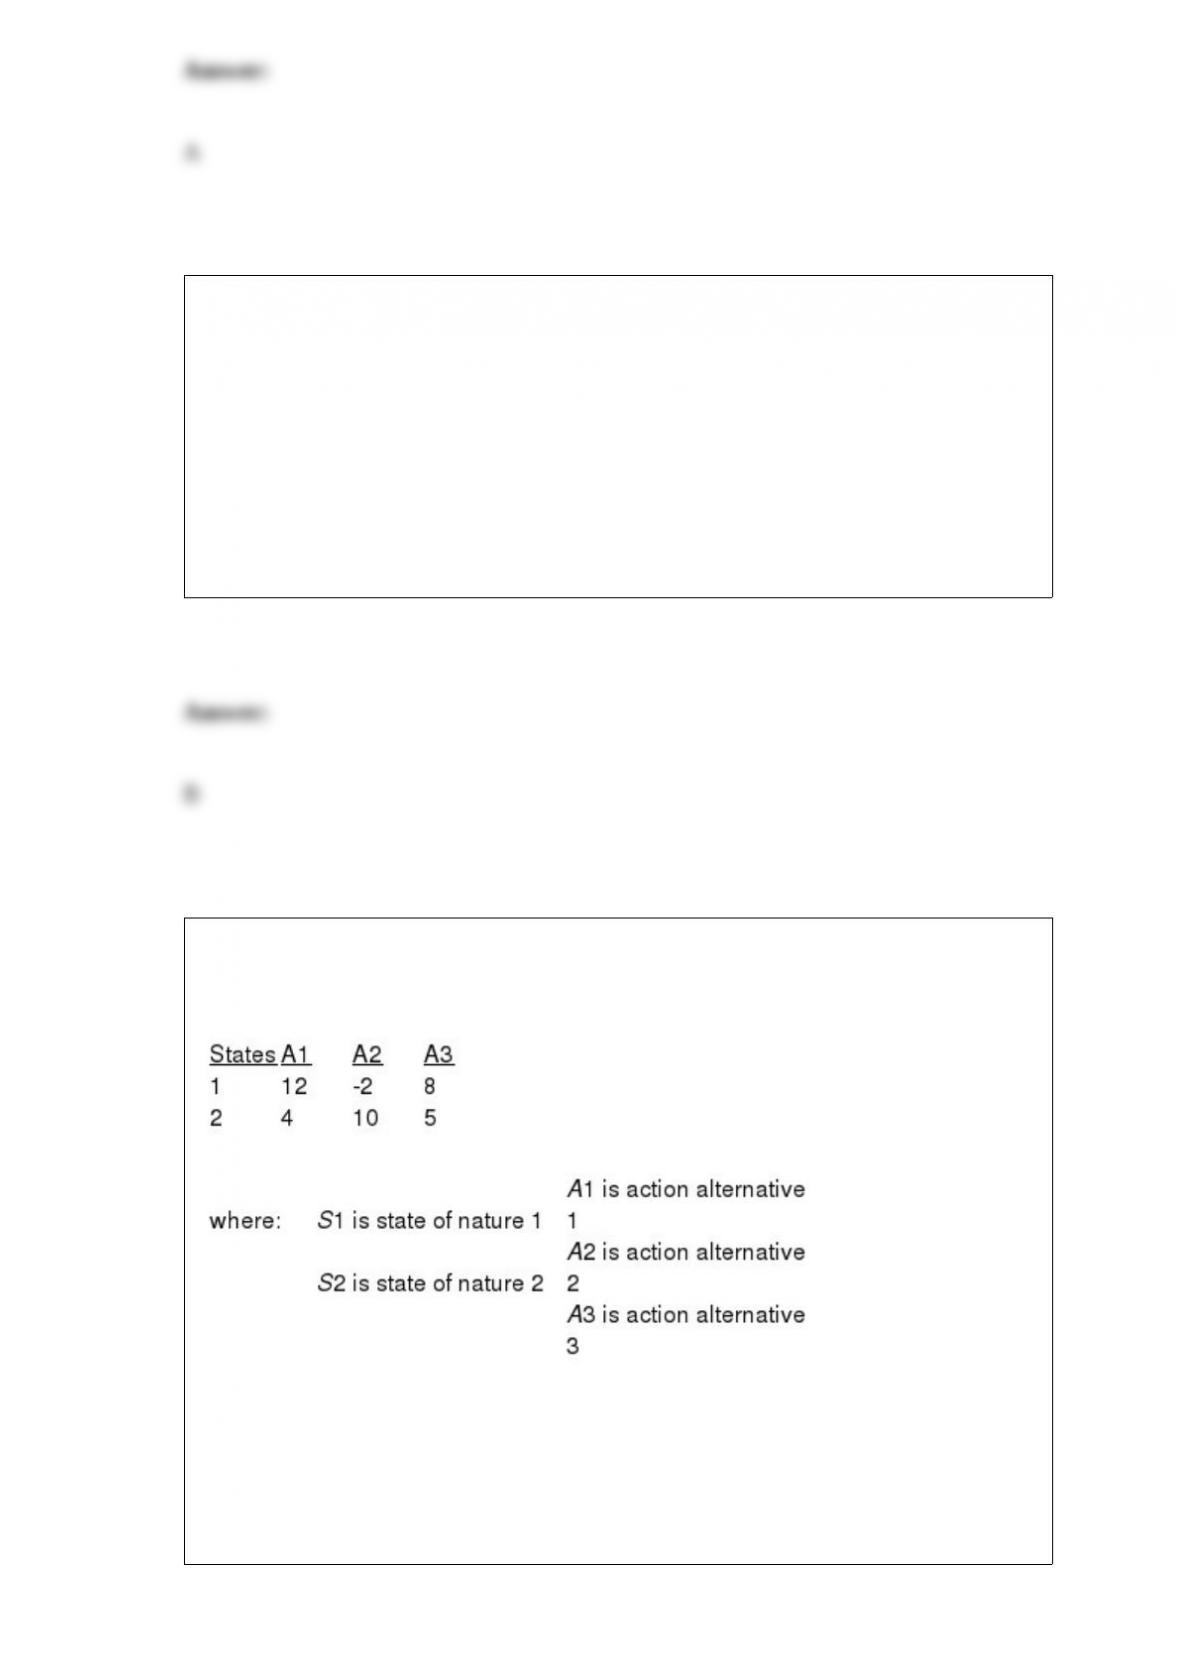
TABLE 19-1
The following payoff table shows profits associated with a set of 3 alternatives under 2
possible states of nature
Referring to Table 19-1, if the probability of S1 is 0.5, then the return to risk ratio for
A3 is
A) 0.667.
B) 1.5.
C) 2.
D) 4.333.
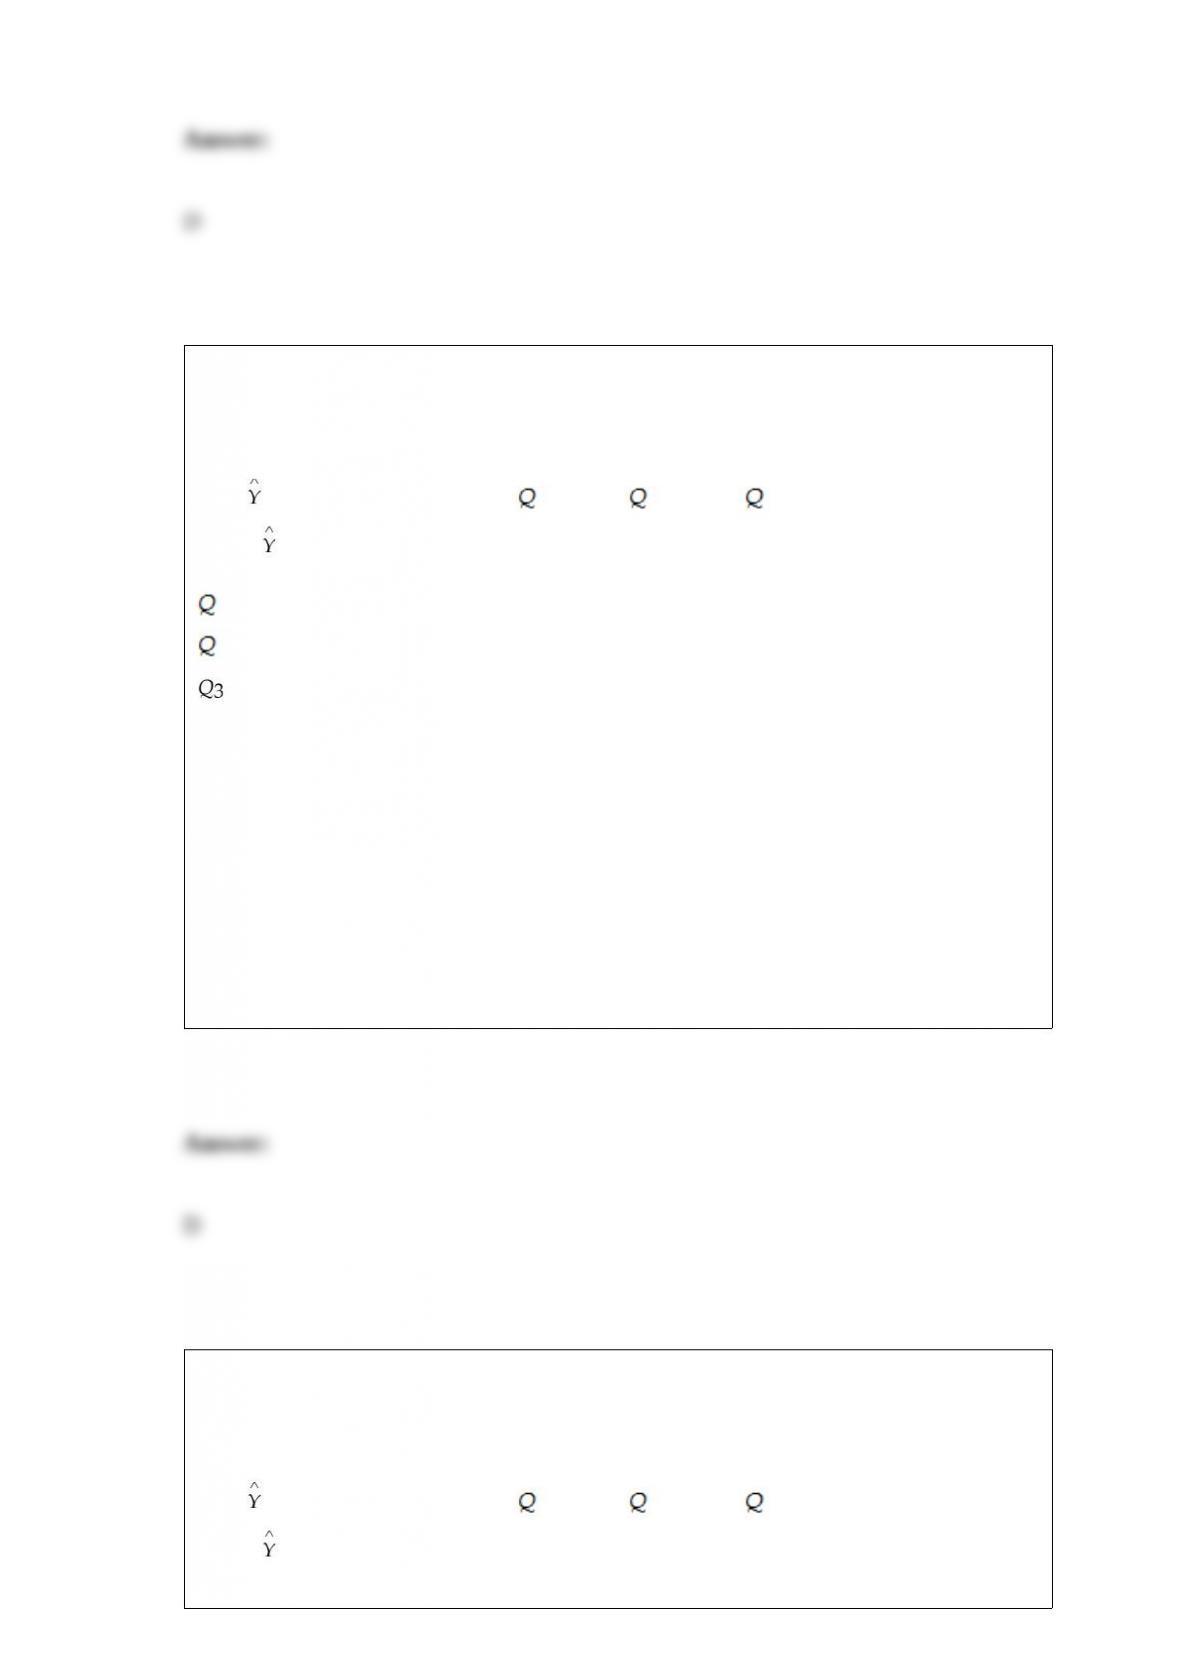
TABLE 16-12
A local store developed a multiplicative time-series model to forecast its revenues in
future quarters, using quarterly data on its revenues during the 5-year period from 2008
to 2012. The following is the resulting regression equation:
log10 = 6.102 + 0.012 X – 0.129 1 – 0.054 2 + 0.098 3
where is the estimated number of contracts in a quarter
X is the coded quarterly value with X = 0 in the first quarter of 2008
1 is a dummy variable equal to 1 in the first quarter of a year and 0 otherwise
2 is a dummy variable equal to 1 in the second quarter of a year and 0 otherwise
is a dummy variable equal to 1 in the third quarter of a year and 0 otherwise
Referring to Table 16-12, the best interpretation of the coefficient of Q3 (0.098) in the
regression equation is
A) the revenues in the third quarter of a year is approximately 9.8% higher than the
average over all 4 quarters.
B) the revenues in the third quarter of a year is approximately 9.8% higher than it
would be during the fourth quarter.
C) the revenues in the third quarter of a year is approximately 25.31% higher than the
average over all 4 quarters.
D) the revenues in the third quarter of a year is approximately 25.31% higher than it
would be during the fourth quarter.
TABLE 16-12
A local store developed a multiplicative time-series model to forecast its revenues in
future quarters, using quarterly data on its revenues during the 5-year period from 2008
to 2012. The following is the resulting regression equation:
log10 = 6.102 + 0.012 X – 0.129 1 – 0.054 2 + 0.098 3
where is the estimated number of contracts in a quarter
X is the coded quarterly value with X = 0 in the first quarter of 2008
1 is a dummy variable equal to 1 in the first quarter of a year and 0 otherwise
2 is a dummy variable equal to 1 in the second quarter of a year and 0 otherwise
is a dummy variable equal to 1 in the third quarter of a year and 0 otherwise
Referring to Table 16-12, to obtain the fitted value for the first quarter of 2012 using the
model, which of the following sets of values should be used in the regression equation?
A) X = 16, 1 = 1, 2 = 0, 3 = 0
B) X = 16, 1 = 0, 2 = 1, 3 = 0
C) X = 17, 1 = 1, 2 = 0, 3 = 0
D) X = 17, 1 = 0, 2 = 1, 3 = 0
TABLE 17-8
The superintendent of a school district wanted to predict the percentage of students
passing a sixth-grade proficiency test. She obtained the data on percentage of students
passing the proficiency test (% Passing), daily mean of the percentage of students
attending class (% Attendance), mean teacher salary in dollars (Salaries), and
instructional spending per pupil in dollars (Spending) of 47 schools in the state.
Following is the multiple regression output with Y = % Passing as the dependent
variable, X1 = % Attendance, X2 = Salaries and X3 = Spending:
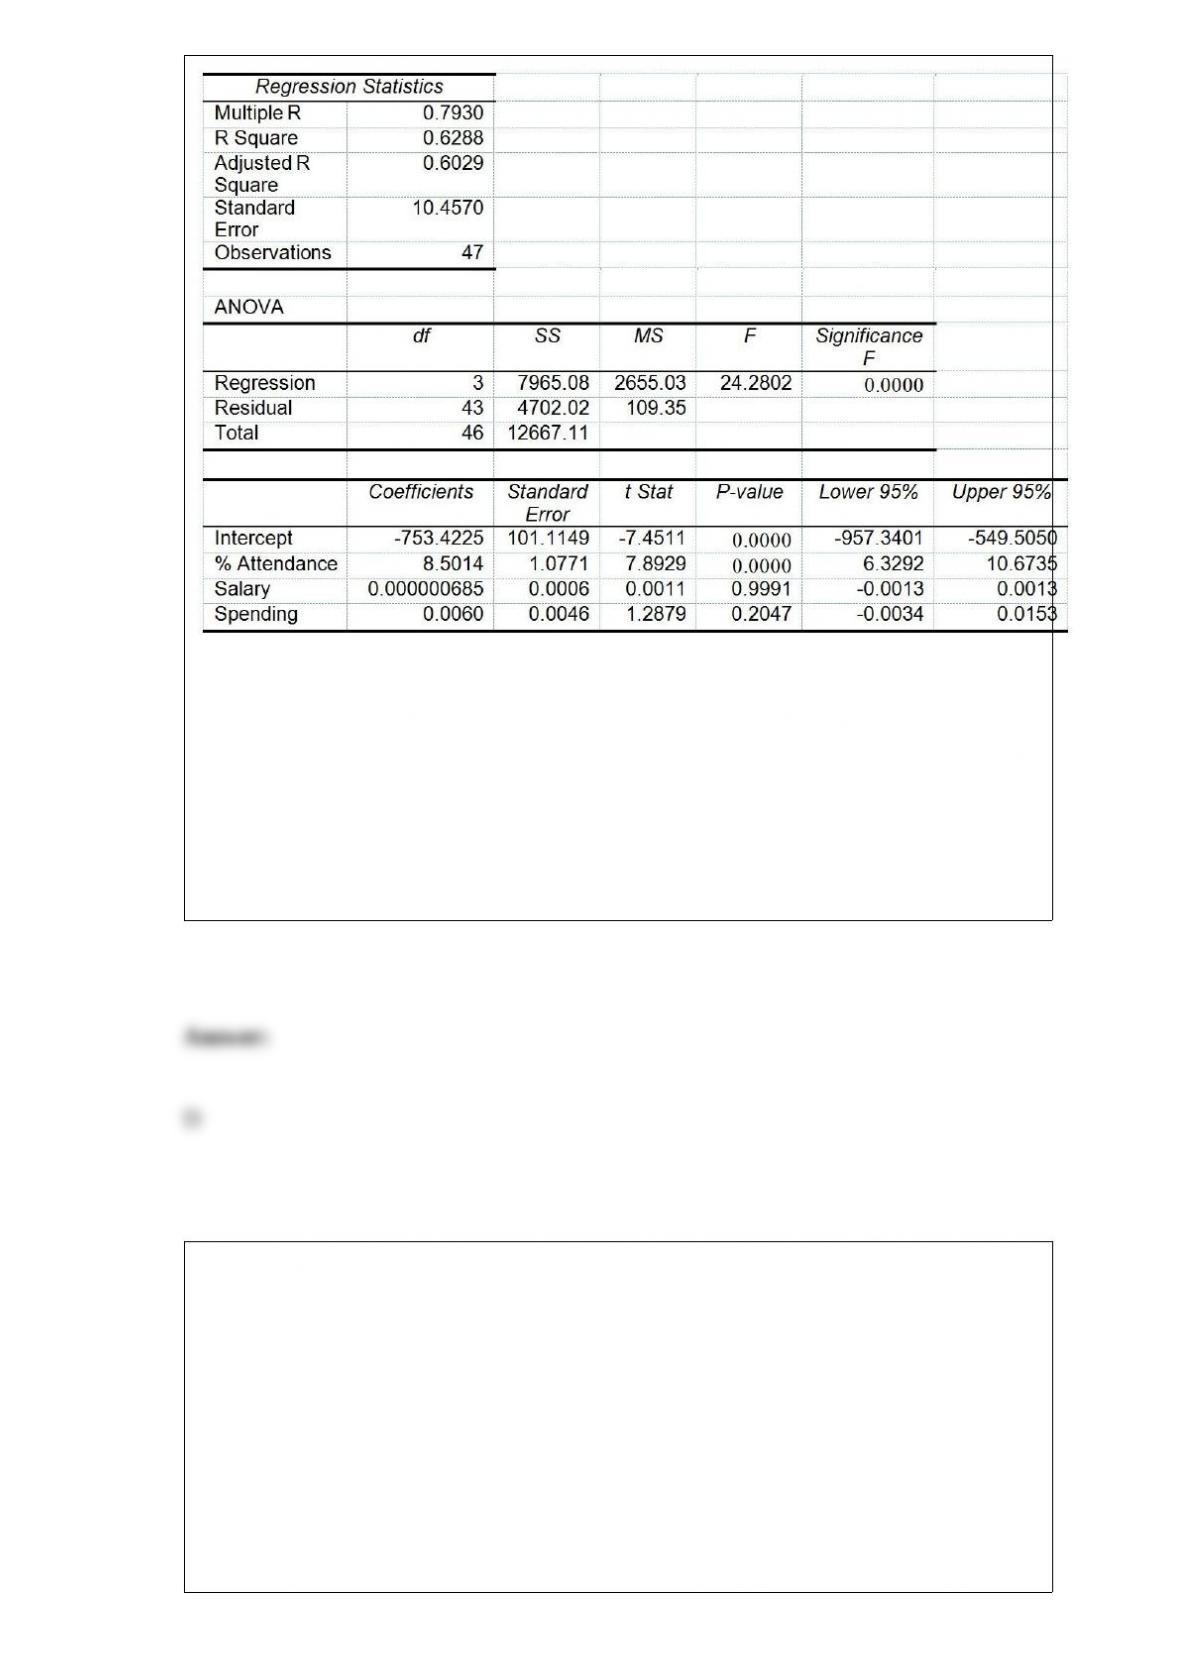
Referring to Table 17-8, which of the following is the correct null hypothesis to test
whether instructional spending per pupil has any effect on the percentage of students
passing the proficiency test, taking into account the effect of all the other independent
variables?
A) H0 : β0 = 0
B) H0 : β1 = 0
C) H0 : β2 = 0
D) H0 : β3 = 0
According to the empirical rule, if the data form a “bell-shaped” normal distribution,
________ percent of the observations will be contained within 2 standard deviations
around the arithmetic mean.
A) 68.26
B) 88.89
C) 93.75
D) 95.44
TABLE 12-2
The dean of a college is interested in the proportion of graduates from his college who
have a job offer on graduation day. He is particularly interested in seeing if there is a
difference in this proportion for accounting and economics majors. In a random sample
of 100 of each type of major at graduation, he found that 65 accounting majors and 52
economics majors had job offers. If the accounting majors are designated as “Group 1”
and the economics majors are designated as “Group 2,” perform the appropriate
hypothesis test using a level of significance of 0.05.
Referring to Table 12-2, the hypotheses the dean should use are
A) H0 : 1 – 2 = 0 versus H1 : 1 – 2 0.
B) H0 : 1 – 2 0 versus H1 : 1 – 2 = 0.
C) H0 : 1 – 2 0 versus H1 : 1 – 2 > 0.
D) H0 : 1 – 2 0 versus H1 : 1 – 2 < 0.
TABLE 5-7
There are two houses with almost identical characteristics available for investment in
two different neighborhoods with drastically different demographic composition. The
anticipated gain in value when the houses are sold in 10 years has the following
probability distribution:
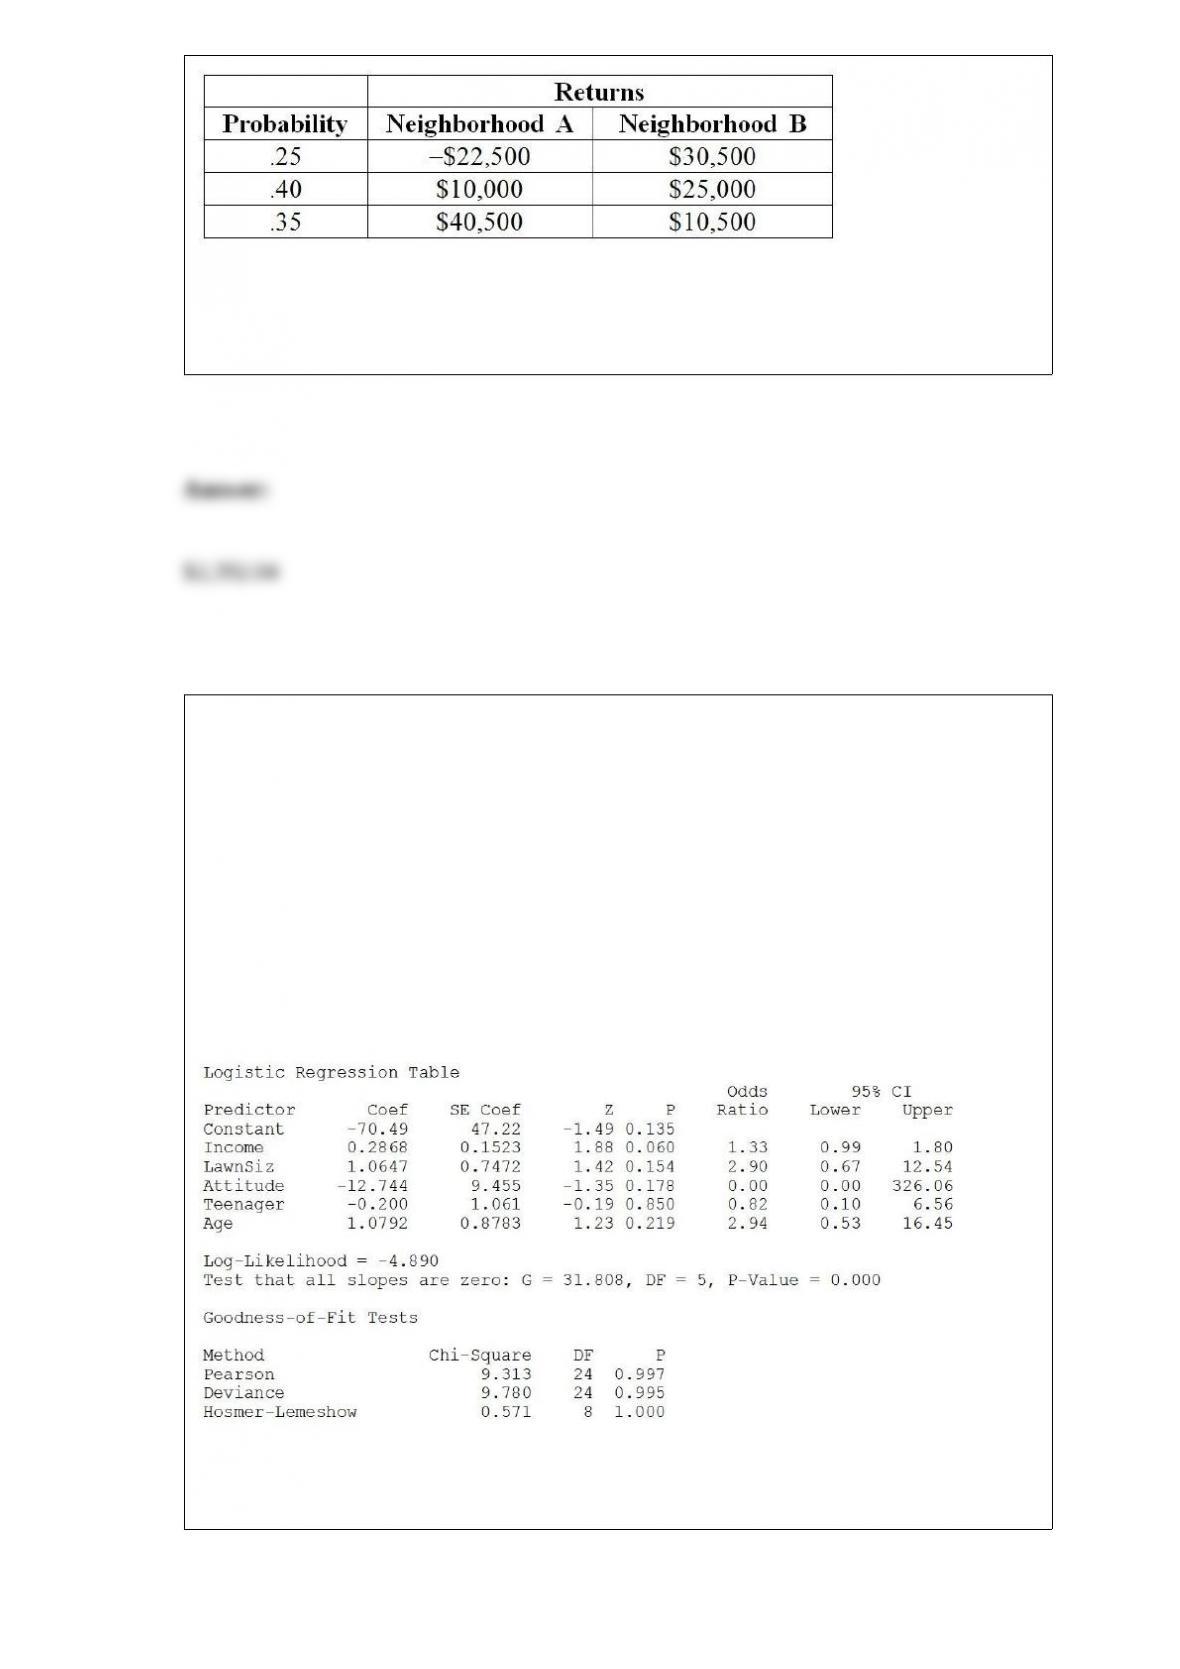
Referring to Table 5-7, if you can invest 30% of your money on the house in
neighborhood A and the remaining on the house in neighborhood B, what is the
portfolio risk of your investment?
TABLE 17-12
The marketing manager for a nationally franchised lawn service company would like to
study the characteristics that differentiate home owners who do and do not have a lawn
service. A random sample of 30 home owners located in a suburban area near a large
city was selected; 15 did not have a lawn service (code 0) and 15 had a lawn service
(code 1). Additional information available concerning these 30 home owners includes
family income (Income, in thousands of dollars), lawn size (Lawn Size, in thousands of
square feet), attitude toward outdoor recreational activities (Attitude 0 = unfavorable, 1
= favorable), number of teenagers in the household (Teenager), and age of the head of
the household (Age).
The Minitab output is given below:
Referring to Table 17-12, what should be the decision (‘reject’ or ‘do not reject’) on the
null hypothesis when testing whether Teenager makes a significant contribution to the
model in the presence of the other independent variables at a 0.05 level of significance?
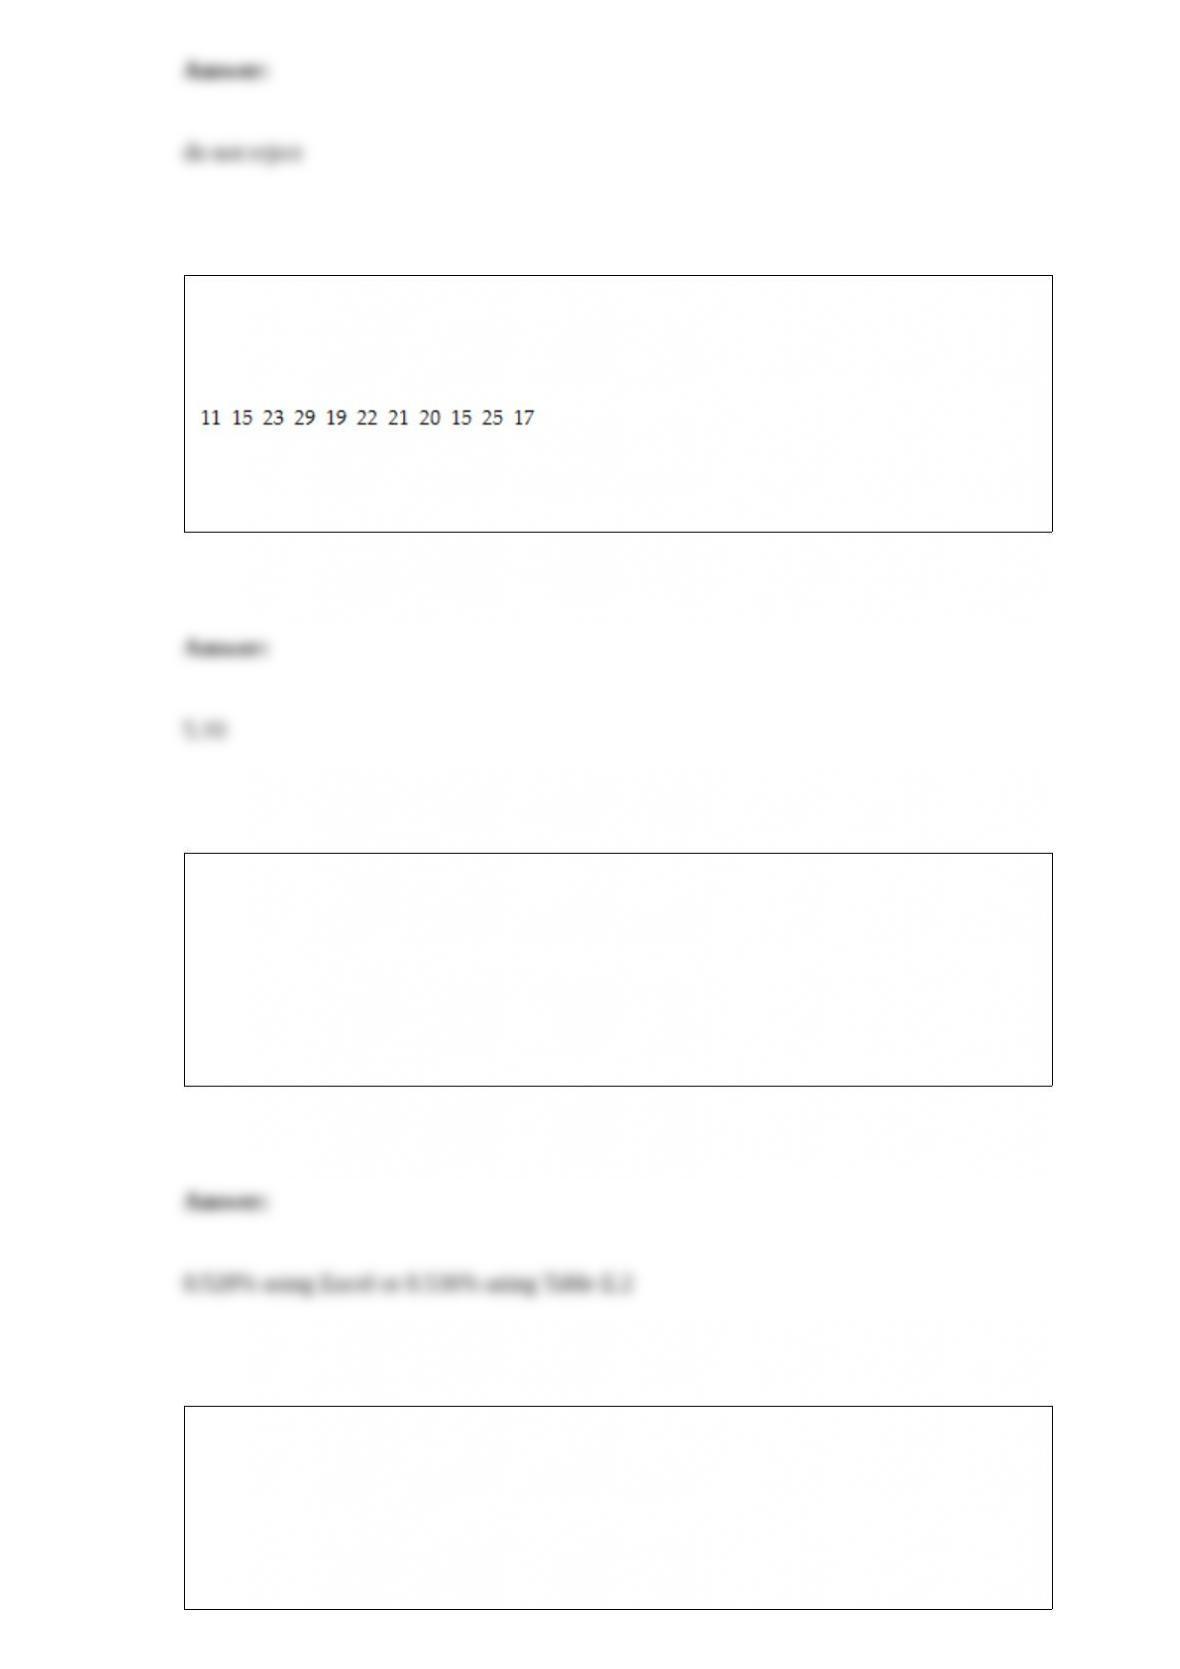
TABLE 3-2
The data below represent the amount of grams of carbohydrates in a serving of
breakfast cereal in a sample of 11 different servings.
Referring to Table 3-2, the standard deviation of the carbohydrate amounts is ________
grams.
TABLE 7-4
According to a survey, only 15% of customers who visited the website of a major retail
store made a purchase. Random sample sizes of 50 are selected.
Referring to Table 7-4, 90% of the samples will have more than what percentage of
customers who will make a purchase after visiting the website?
You were told that the amount of time lapsed between consecutive trades on the New
York Stock Exchange followed a normal distribution with a mean of 15 seconds. You
were also told that the probability that the time lapsed between two consecutive trades
to fall between 16 to 17 seconds was 13%. The probability that the time lapsed between
two consecutive trades would fall below 13 seconds was 7%. What is the probability
that the time lapsed between two consecutive trades will be between 15 and 16
seconds?
TABLE 6-4
The interval between consecutive hits at a website is assumed to follow an exponential
distribution with an average of 40 hits per minute.
Referring to Table 6-4, what is the probability that the next hit at the website will occur
between the next 1.2 and 1.5 seconds after just being hit by a visitor?
TABLE 4-8
According to the record of the registrar’s office at a state university, 35% of the students
are freshman, 25% are sophomore, 16% are junior and the rest are senior. Among the
freshmen, sophomores, juniors and seniors, the portion of students who live in the
dormitory are, respectively, 80%, 60%, 30% and 20%.
Referring to Table 4-8, what is the probability that a randomly selected student is a
freshman who lives in a dormitory?