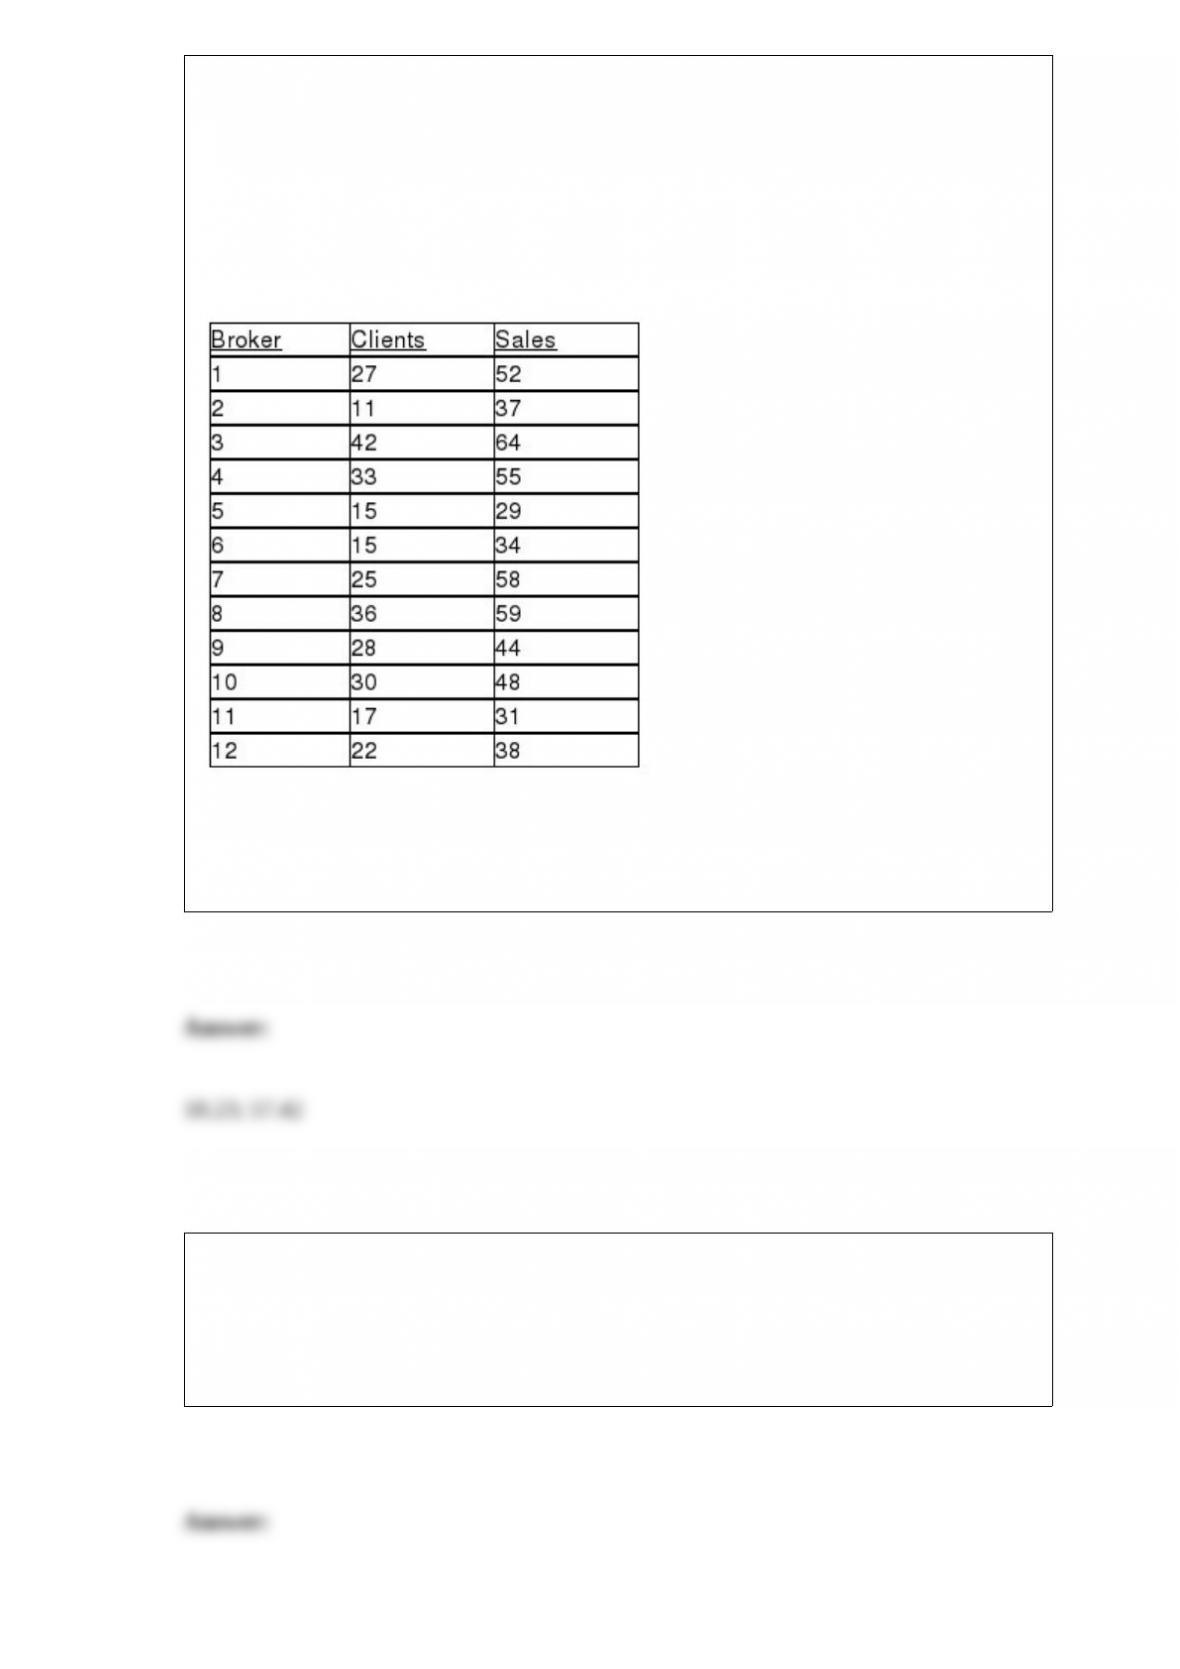
TABLE 13-4
The managers of a brokerage firm are interested in finding out if the number of new
clients a broker brings into the firm affects the sales generated by the broker. They
sample 12 brokers and determine the number of new clients they have enrolled in the
last year and their sales amounts in thousands of dollars. These data are presented in the
table that follows.
Referring to Table 13-4, suppose the managers of the brokerage firm want to construct a
99% prediction interval for the sales made by a broker who has brought into the firm 18
new clients. The prediction interval is from ________ to ________.
TABLE 16-5
The number of passengers arriving at San Francisco on the Amtrak cross-country
express on 6 successive Mondays were: 60, 72, 96, 84, 36, and 48.
Referring to Table 16-5, the number of arrivals will be smoothed with a 3-term moving
average. The last smoothed value will be ________.

TABLE 7-5
According to an article, 19% of the entire population in a developing country has
high-speed access to the Internet. Random sample sizes of 200 are selected from the
country’s population.
Referring to Table 7-5, the population mean of all the sample proportions is ________.
TABLE 8-18
A wealthy real estate investor wants to decide whether it is a good investment to build a
high-end shopping complex in a suburban county in Chicago. His main concern is the
total market value of the 3,605 houses in the suburban county. He commissioned a
statistical consulting group to take a sample of 200 houses and obtained a sample mean
market price of $225,000 and a sample standard deviation of $38,700. The consulting
group also found out that the mean differences between market prices and appraised
prices was $125,000 with a standard deviation of $3,400. Also the proportion of houses
in the sample that are appraised for higher than the market prices is 0.24.
Referring to Table 8-18, what will be the 90% confidence interval for the mean market
price of the houses in the suburban county constructed by the consulting group?
The amount of time necessary for assembly line workers to complete a product is a
normal variable with a mean of 15 minutes and a standard deviation of 2 minutes. The
probability is ________ that a product is assembled in between 16 and 21 minutes.
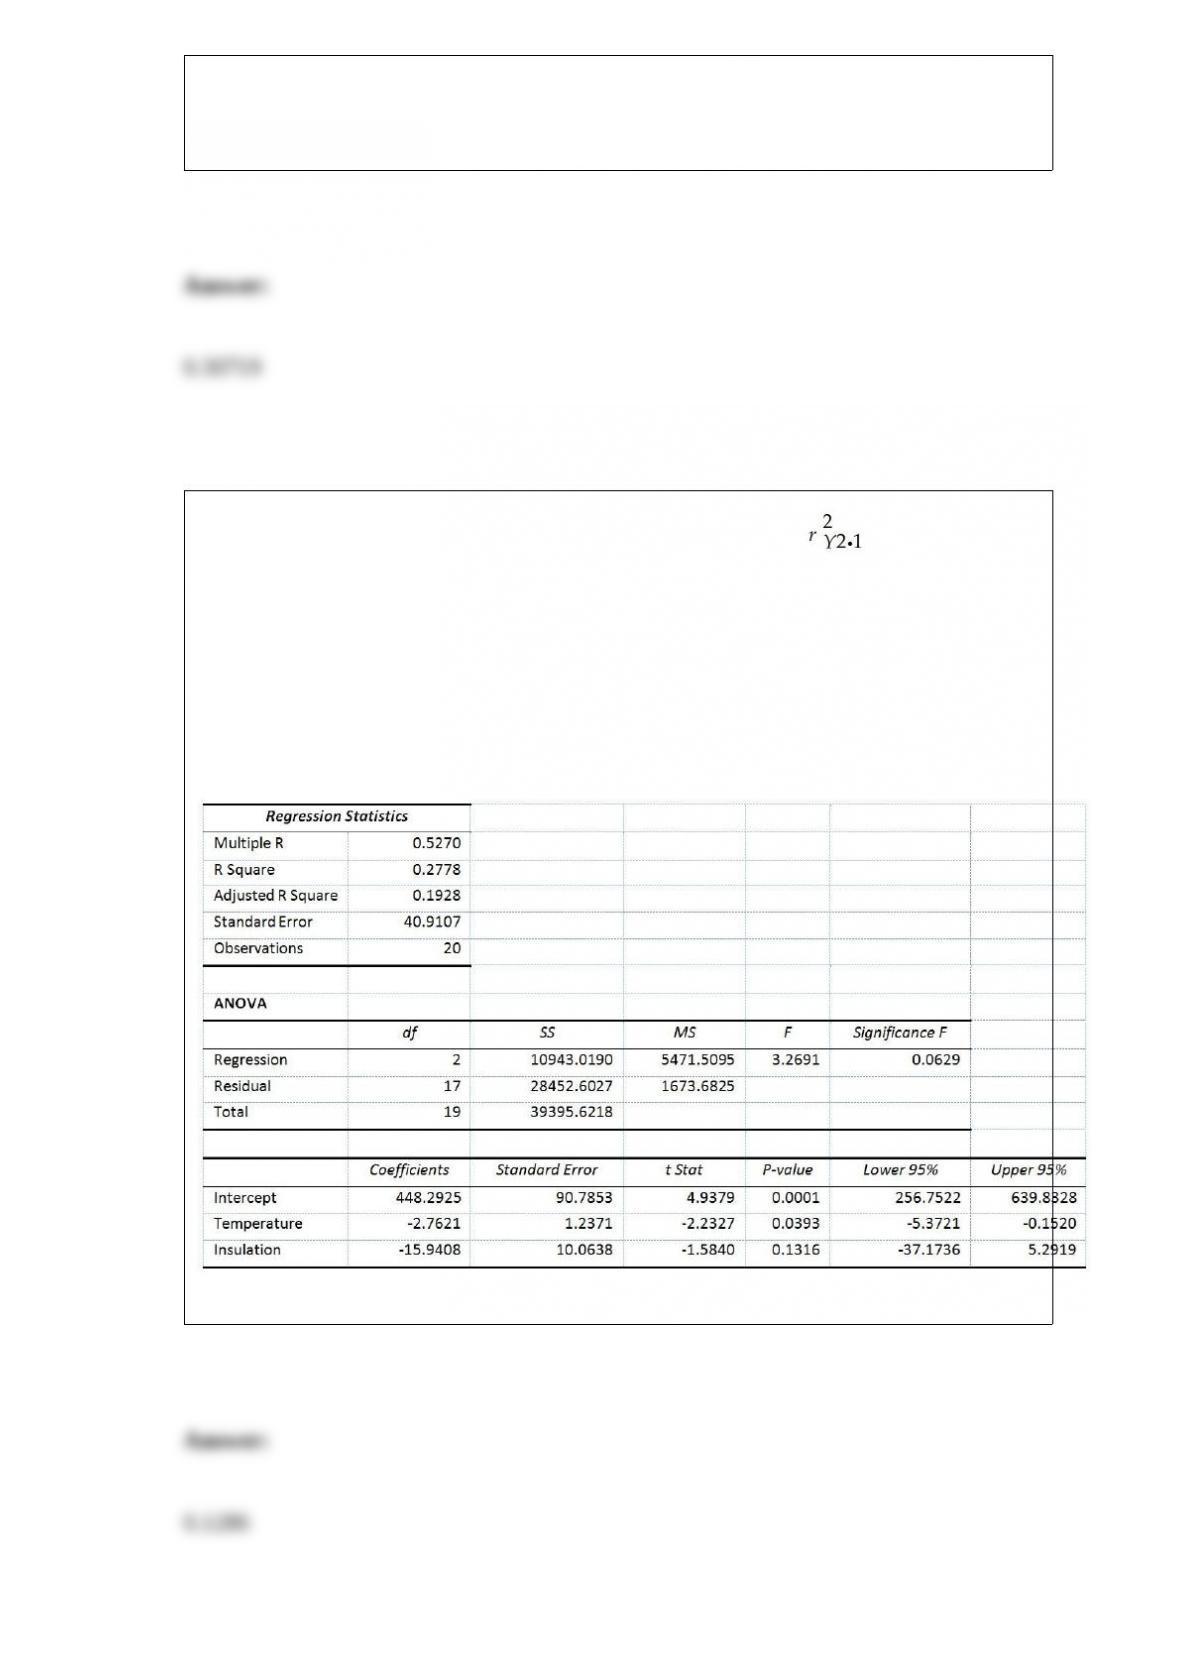
Referring to Table 14-6, the coefficient of partial determination is ________.
TABLE 14-6
One of the most common questions of prospective house buyers pertains to the cost of
heating in dollars (Y). To provide its customers with information on that matter, a large
real estate firm used the following 2 variables to predict heating costs: the daily
minimum outside temperature in degrees of Fahrenheit (X1) and the amount of
insulation in inches (X2). Given below is EXCEL output of the regression model.
Also SSR (X1∣ X2) = 8343.3572 and SSR (X2∣ X1) = 4199.2672

The Human Resources Director of a large corporation wishes to develop an employee
benefits package and decides to select 500 employees from a list of all (N = 40,000)
workers in order to study their preferences for the various components of a potential
package. In this study, methods that result in decisions concerning population
characteristics based only on the sample results are called ________.
TABLE 8-11
A poll was conducted by the marketing department of a video game company to
determine the popularity of a new game that was targeted to be launched in three
months. Telephone interviews with 1,500 young adults were conducted which revealed
that 49% said they would purchase the new game. The margin of error was 3
percentage points.
Referring to Table 8-11, what is the needed sample size to obtain a 90% confidence
interval estimate of the percentage of the targeted young adults who will purchase the
new game by allowing the same level of margin of error?
TABLE 12-17
Three new different models of compact SUVs have just arrived at the market. You are
interested in comparing the gas mileage performance of all three models to see if they
are the same. A partial computer output for twelve compact SUVs of each model is
given below:
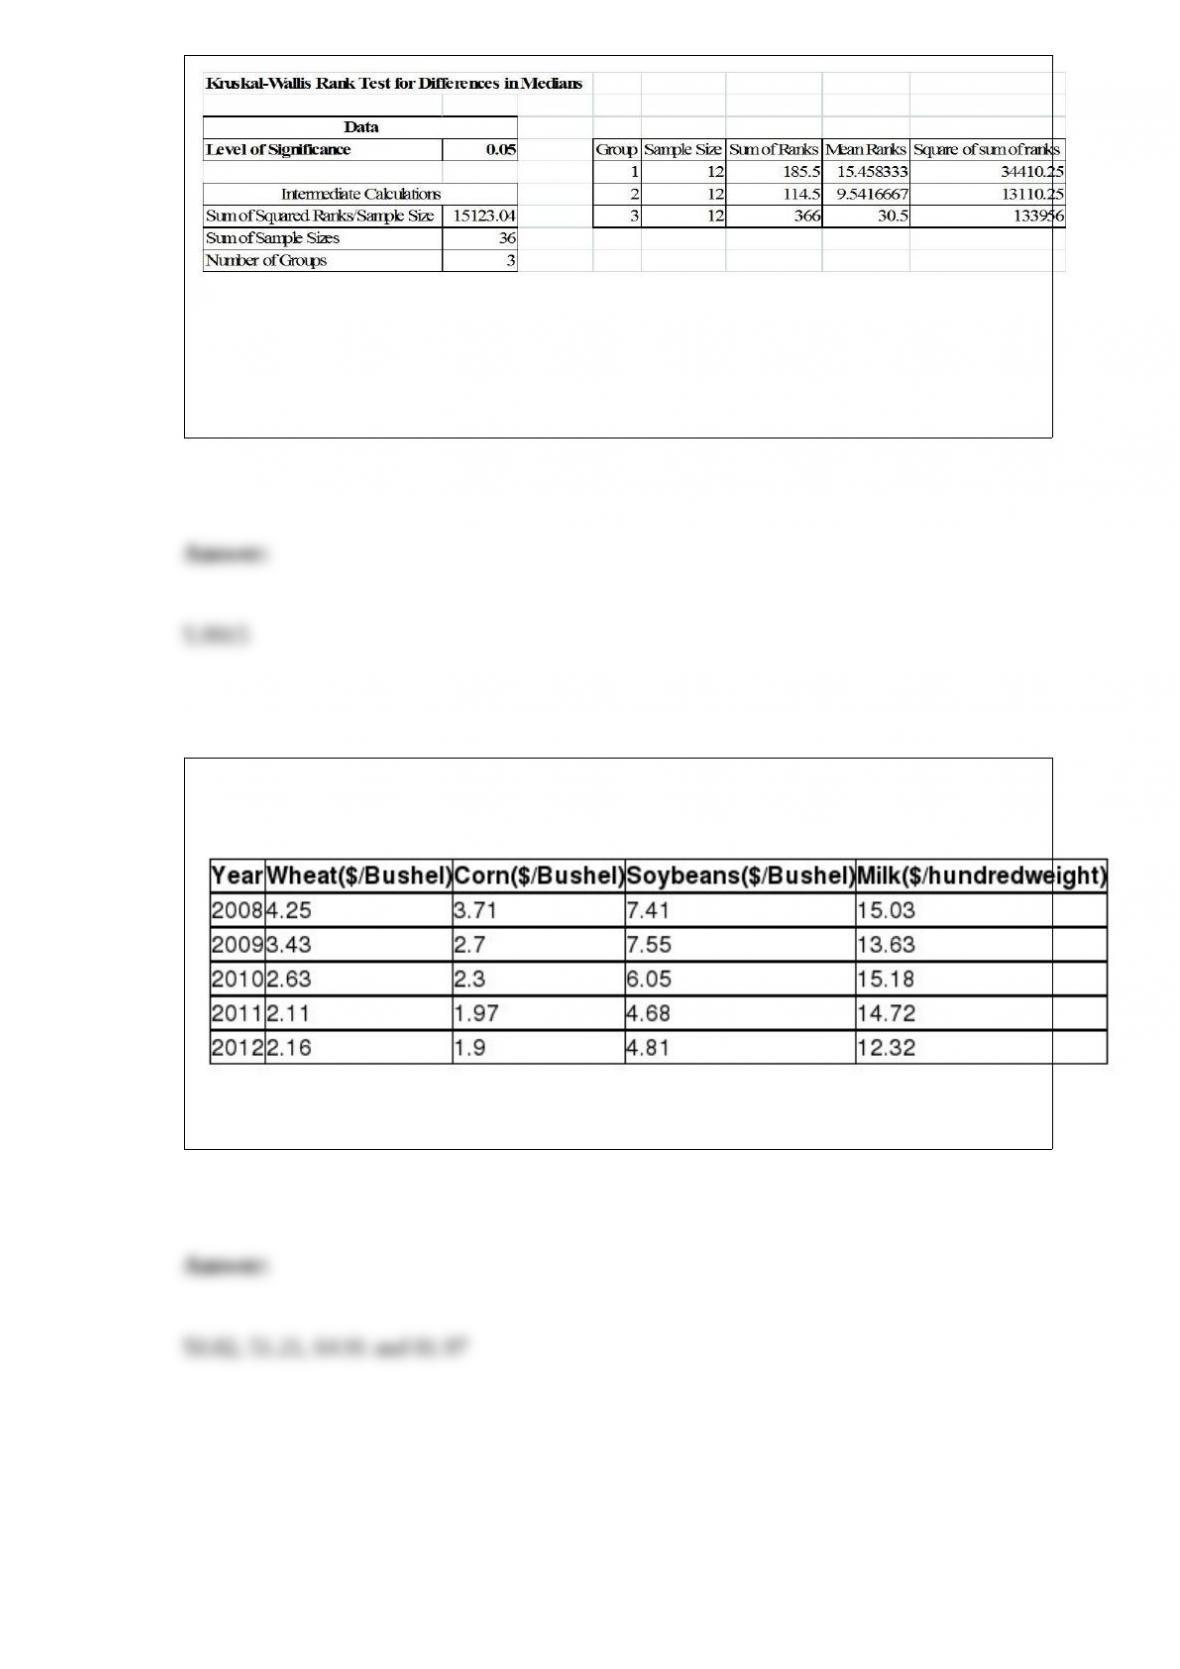
You are told that the gas mileage population distributions for all three models are not
normally distributed.
Referring to Table 12-17, what is the critical value of the Kruskal-Wallis test statistic?
TABLE 16-16
Given below are the prices of a basket of four food items from 2008 to 2012.
Referring to Table 16-16, what are the simple price indices for wheat, corn, soybeans
and milk, respectively, in 2012 using 2008 as the base year?