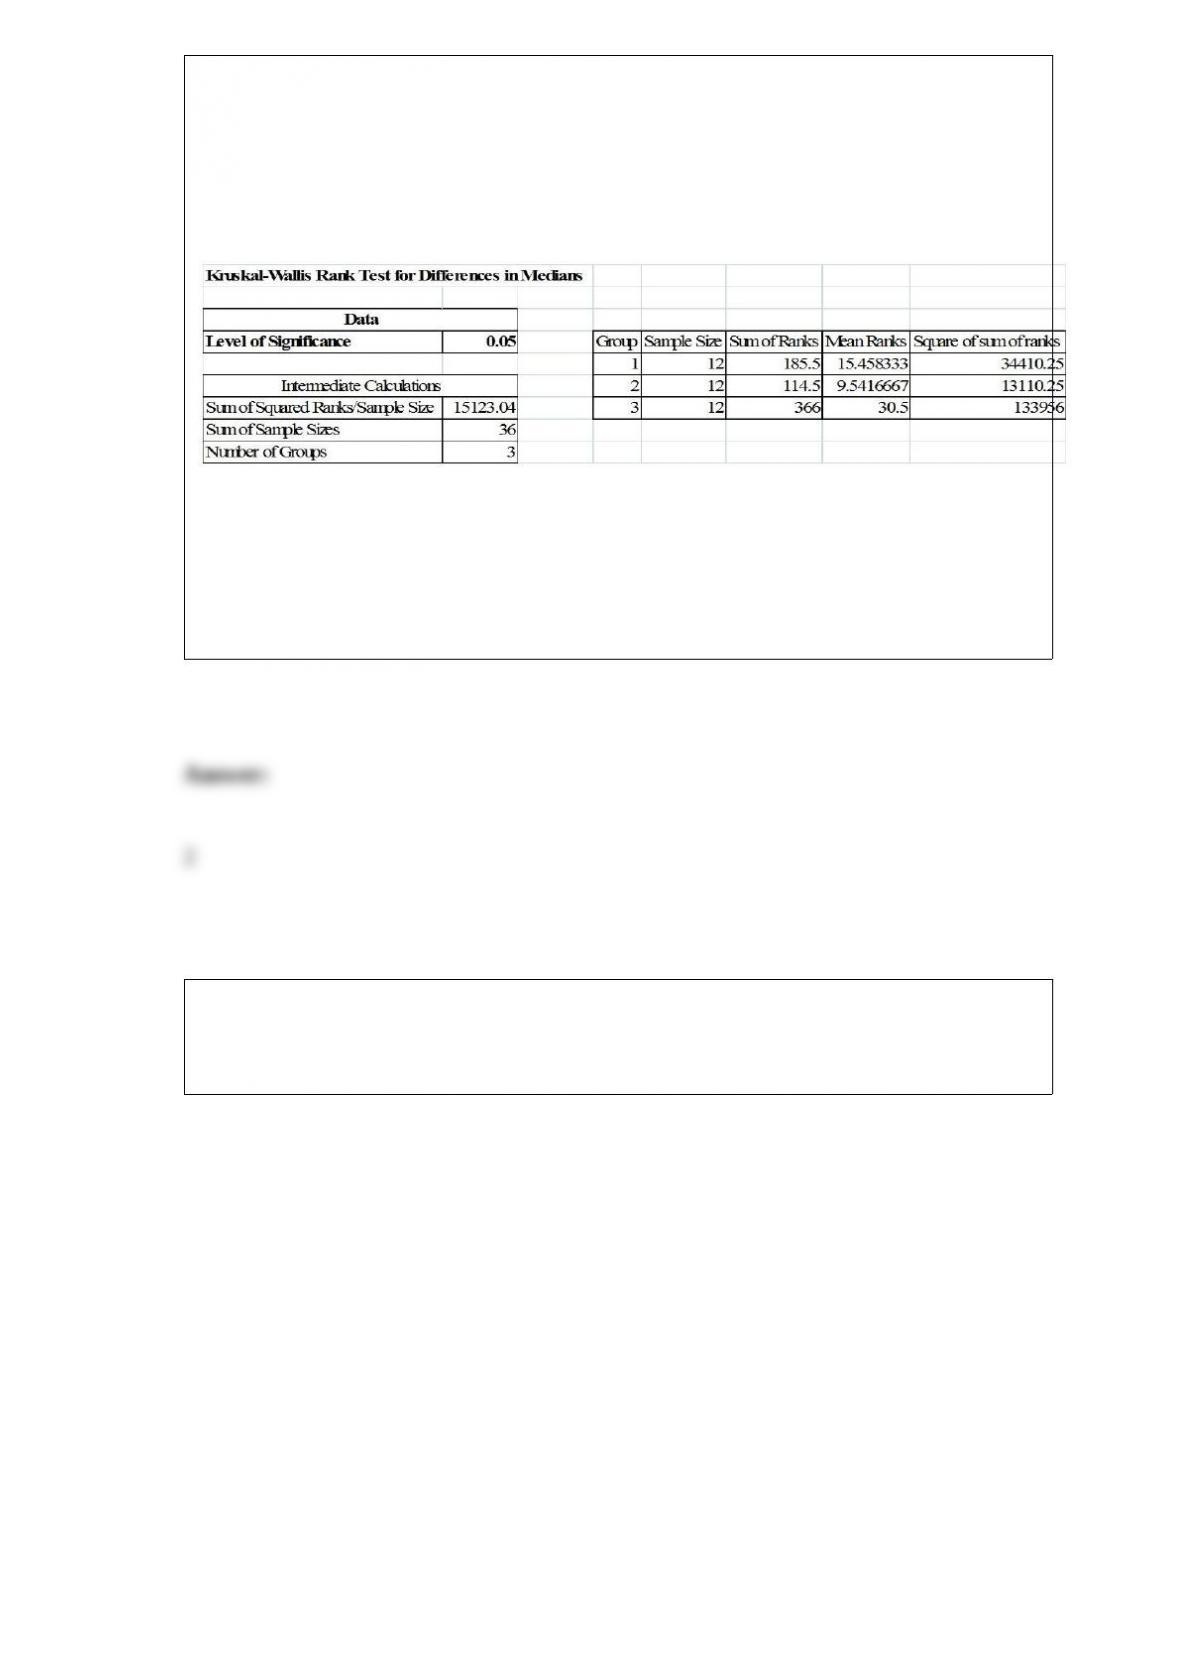
TABLE 12-17
Three new different models of compact SUVs have just arrived at the market. You are
interested in comparing the gas mileage performance of all three models to see if they
are the same. A partial computer output for twelve compact SUVs of each model is
given below:
You are told that the gas mileage population distributions for all three models are not
normally distributed.
Referring to Table 12-17, what are the degrees of freedom of the Kruskal-Wallis test
statistic?
TABLE 16-13
Given below is the monthly time-series data for U.S. retail sales of building materials
over a specific year.
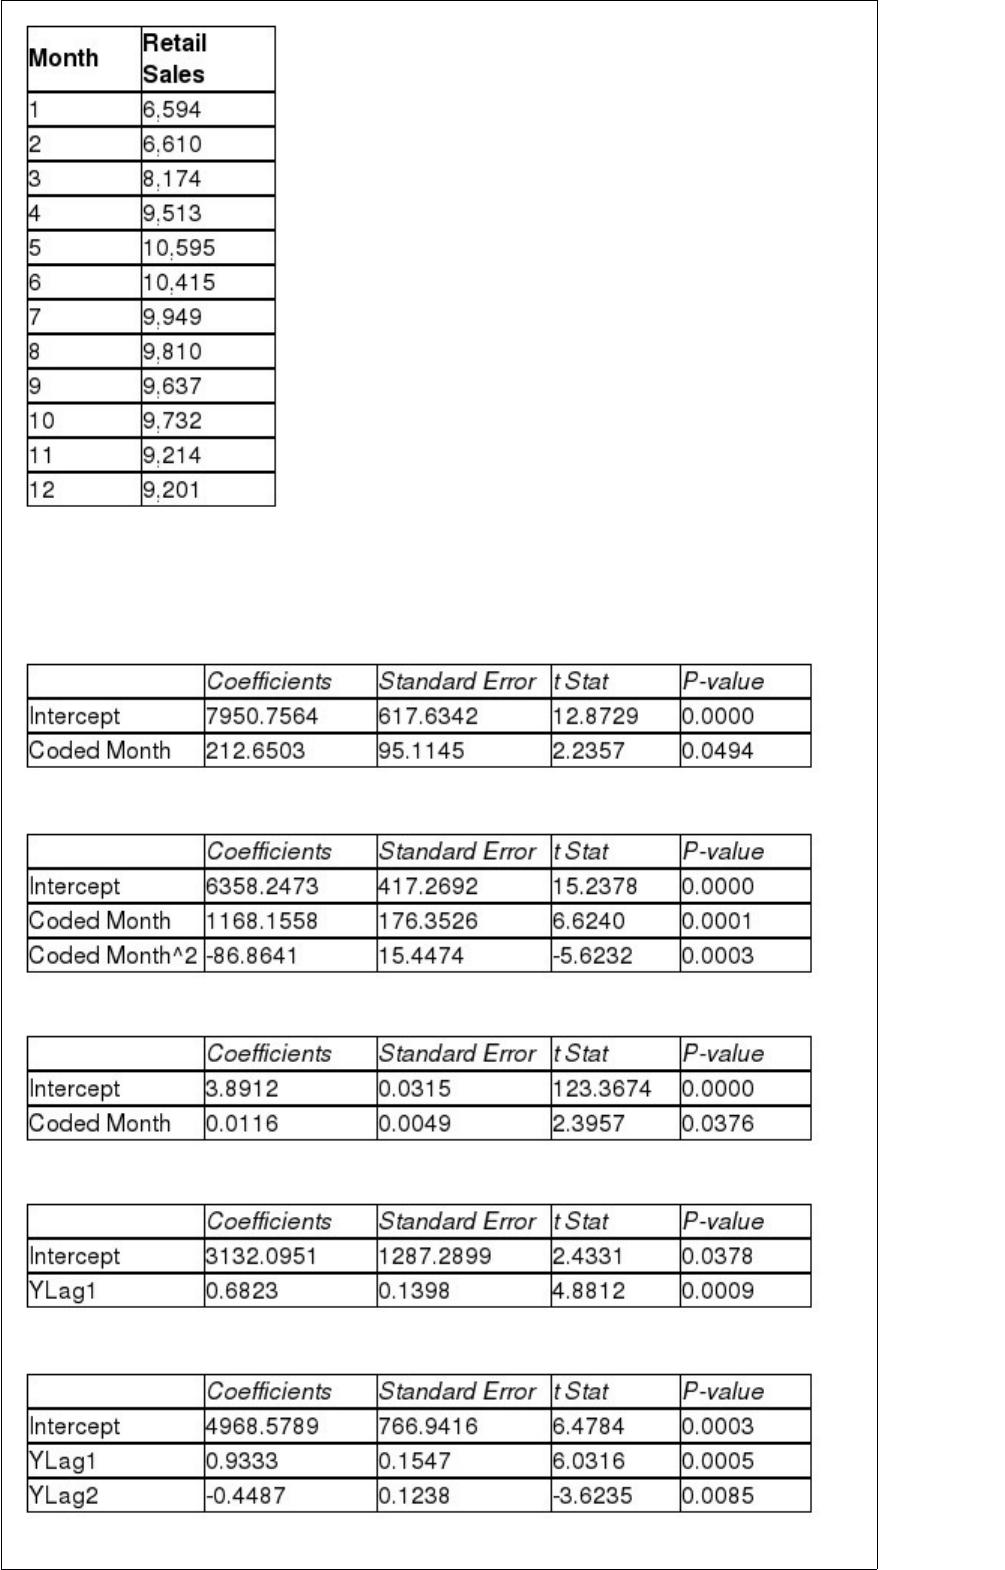
The results of the linear trend, quadratic trend, exponential trend, first-order
autoregressive, second-order autoregressive and third-order autoregressive model are
presented below in which the coded month for the 1st month is 0:
Linear trend model:
Quadratic trend model:
Exponential trend model:
First-order autoregressive:
Second-order autoregressive:
Third-order autoregressive:
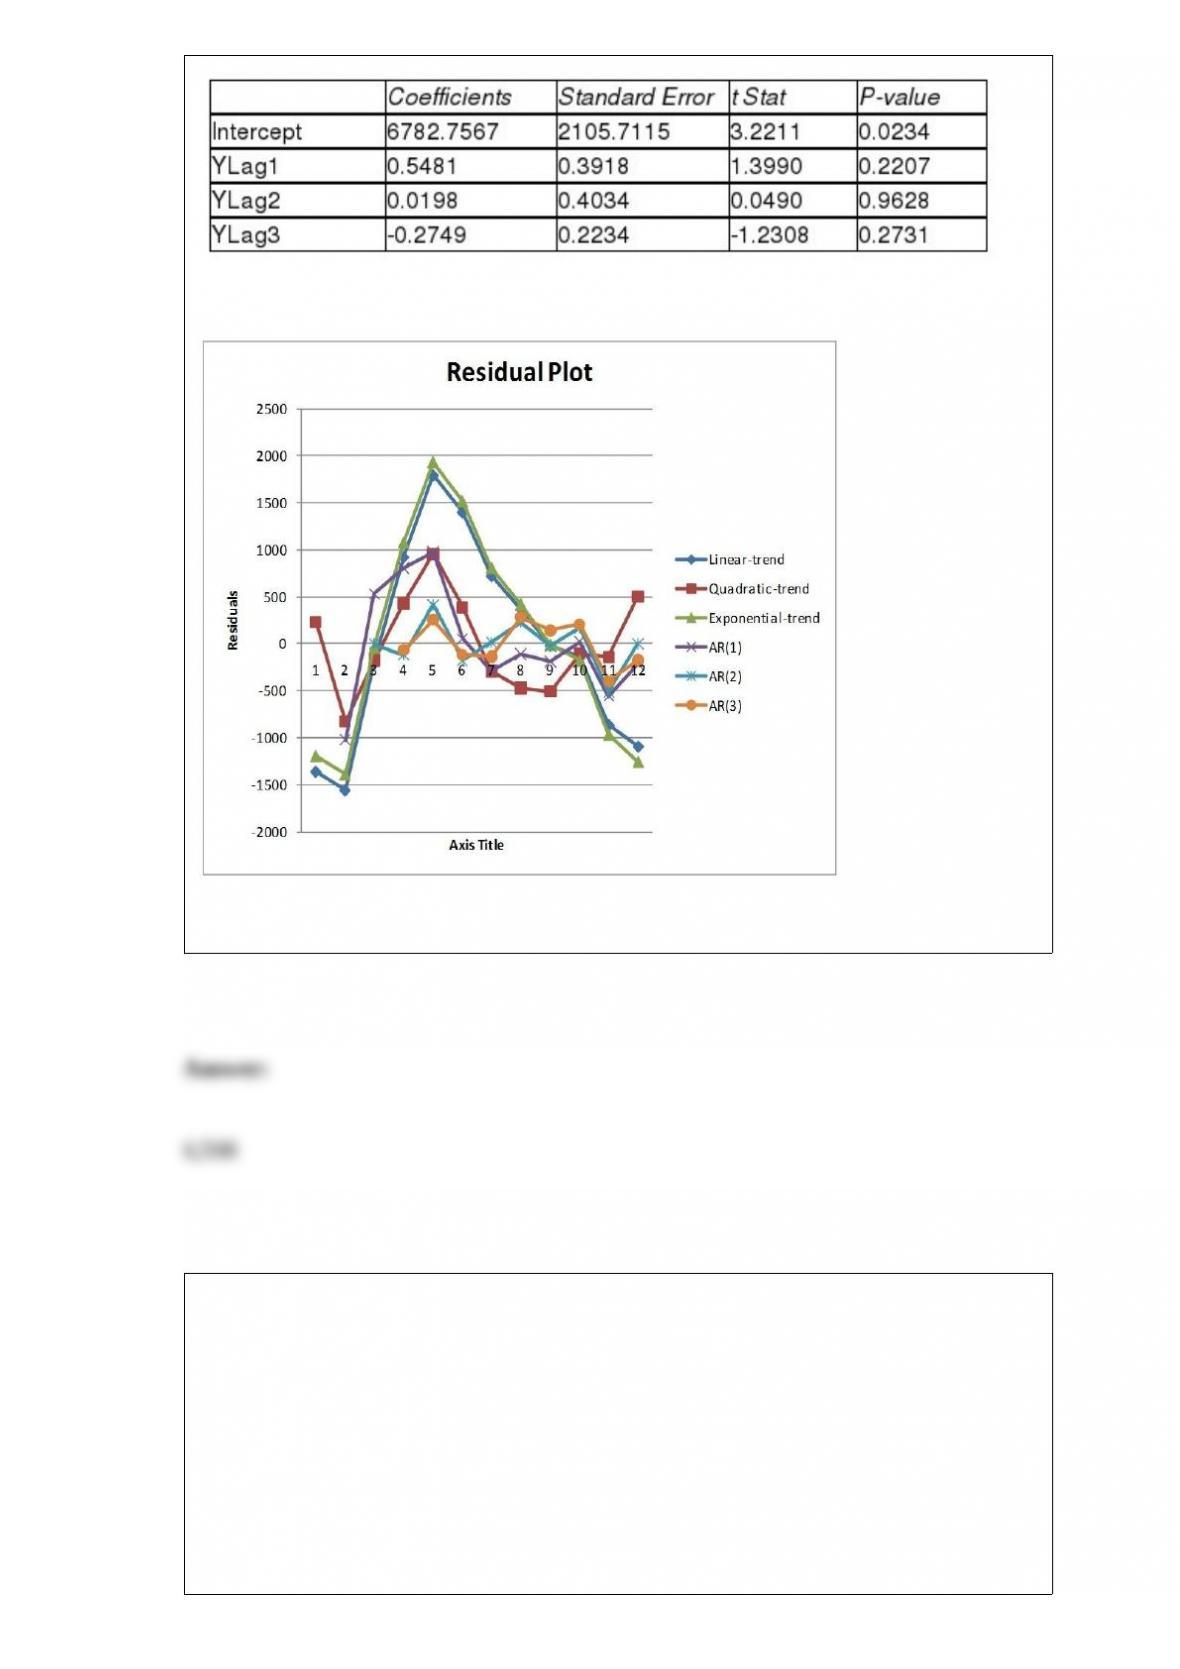
Below is the residual plot of the various models:
Referring to Table 16-13, what is the exponentially smoothed value for the second
month using a smoothing coefficient of W = 0.25?
TABLE 8-10
A sales and marketing management magazine conducted a survey on salespeople
cheating on their expense reports and other unethical conduct. In the survey on 200
managers, 58% of the managers have caught salespeople cheating on an expense report,
50% have caught salespeople working a second job on company time, 22% have caught
salespeople listing a ‘strip bar” as a restaurant on an expense report, and 19% have
caught salespeople giving a kickback to a customer.
Referring to Table 8-10, construct a 95% confidence interval estimate of the population
proportion of managers who have caught salespeople giving a kickback to a customer.
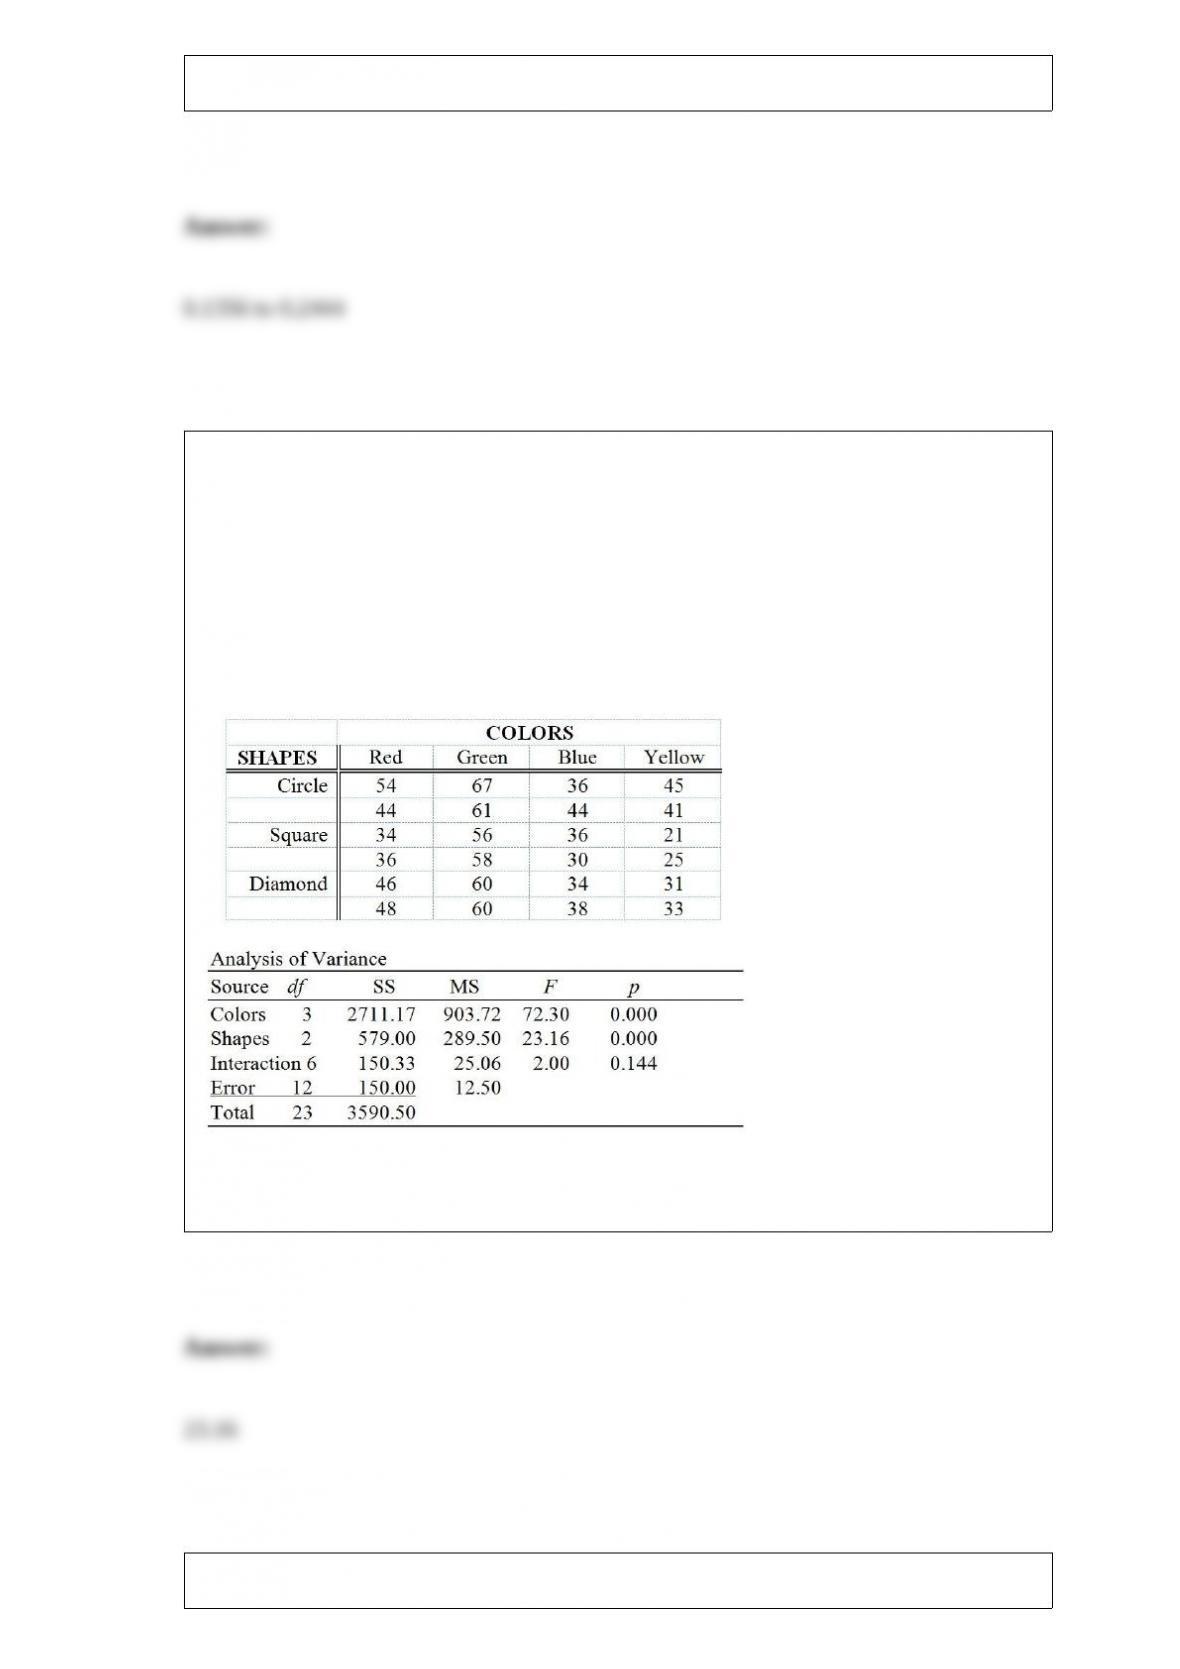
TABLE 11-9
The marketing manager of a company producing a new cereal aimed for children wants
to examine the effect of the color and shape of the box’s logo on the approval rating of
the cereal. He combined 4 colors and 3 shapes to produce a total of 12 designs. Each
logo was presented to 2 different groups (a total of 24 groups) and the approval rating
for each was recorded and is shown below. The manager analyzed these data using the
α = 0.05 level of significance for all inferences.
Referring to Table 11-9, the value of the statistic used to test for significant differences
between shapes is ________.
TABLE 5-11
Subscribers to Investment Advice White Letters perform security transactions at the rate
of five trades per month. Assume that one of the subscribers performs transactions at
this rate and the probability of a transaction for any two months is the same and the
number of transactions in one month is independent of the number of transactions in
another month.
Referring to Table 5-11, what is the mean number of transactions per month for this
subscriber?
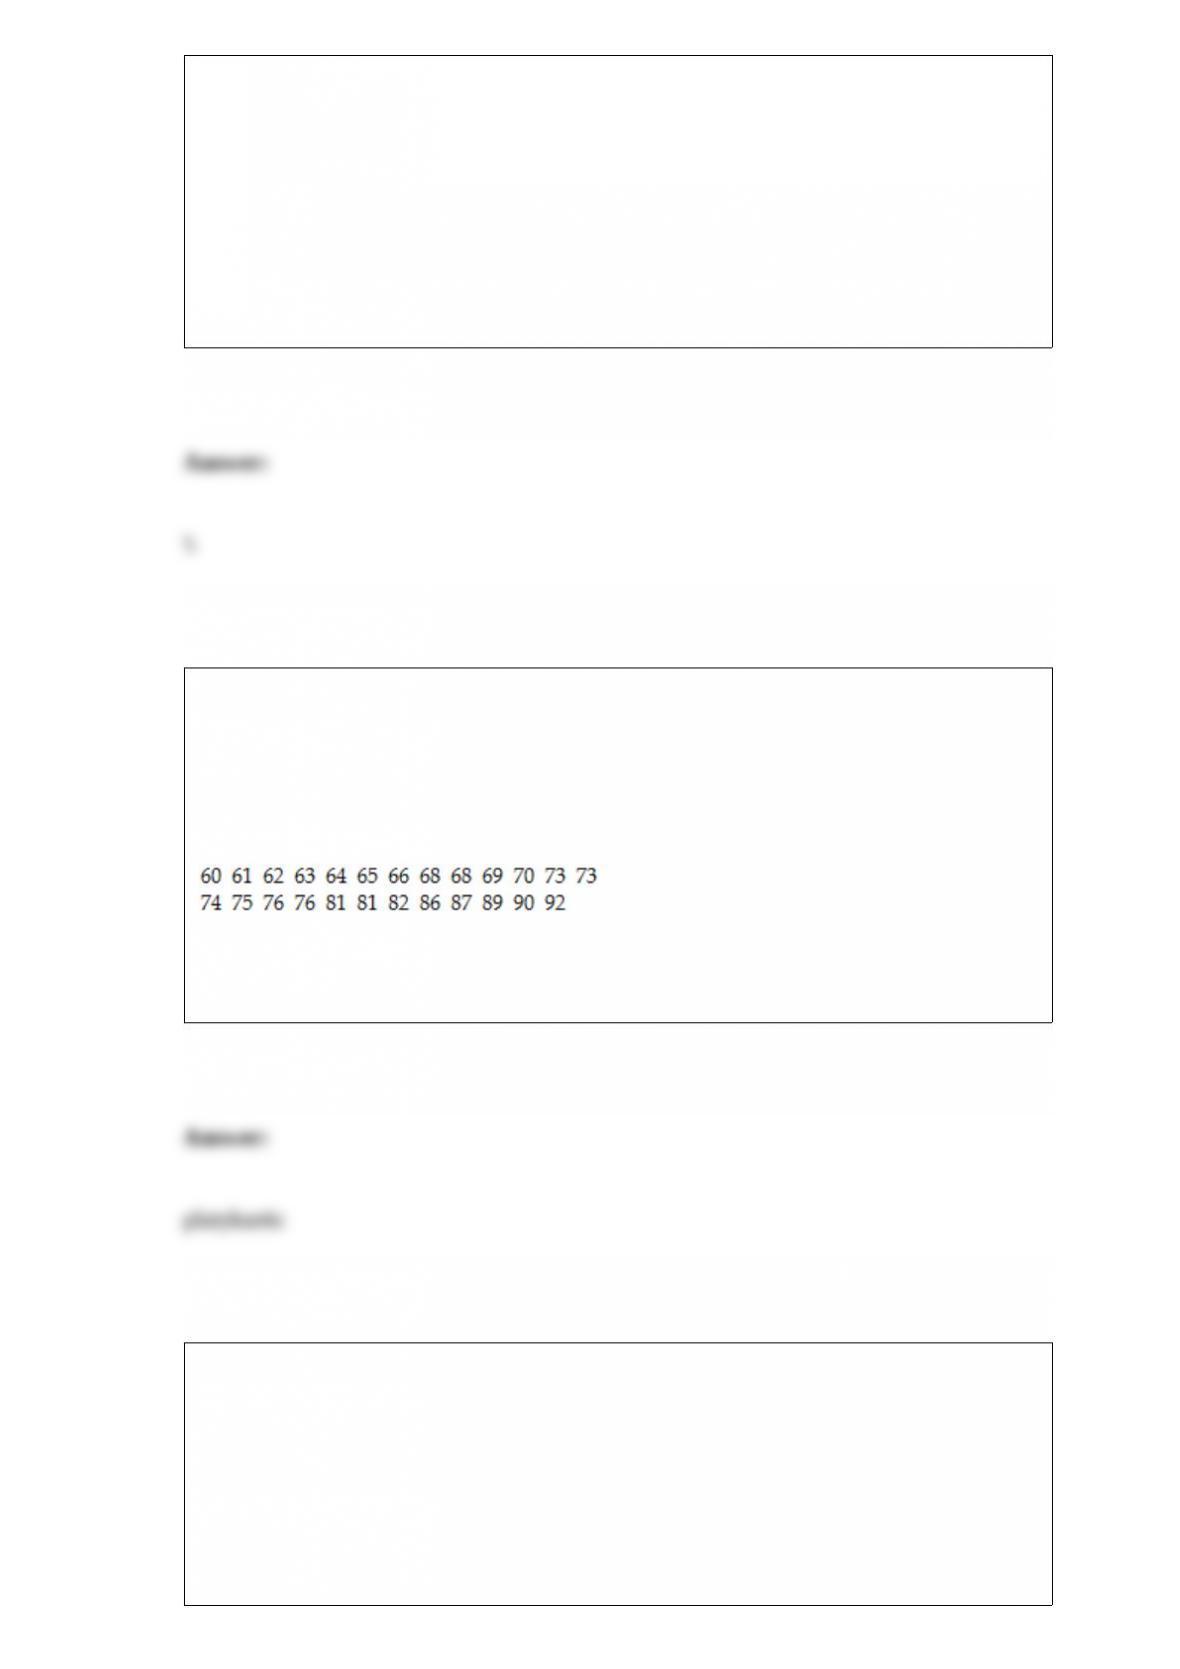
TABLE 3-1
Health care issues are receiving much attention in both academic and political arenas. A
sociologist recently conducted a survey of citizens over 60 years of age whose net
worth is too high to qualify for Medicaid. The ages of 25 senior citizens were as
follows:
Referring to Table 3-1, does the distribution of the sample appear to be lepokurtic or
platykurtic?
TABLE 10-6
To investigate the efficacy of a diet, a random sample of 16 male patients is selected
from a population of adult males using the diet. The weight of each individual in the
sample is taken at the start of the diet and at a medical follow-up 4 weeks later.
Assuming that the population of differences in weight before versus after the diet
follow a normal distribution, the t-test for related samples can be used to determine if
there was a significant decrease in the mean weight during this period. Suppose the

mean decrease in weights over all 16 subjects in the study is 3.0 pounds with the
standard deviation of differences computed as 6.0 pounds.
Referring to Table 10-6, what is the 90% confidence interval estimate for the mean
difference in weight before and after the diet?
The amount of tea leaves in a can from a particular production line is normally
distributed with = 110 grams and = 25 grams. What is the probability that a
randomly selected can will contain between 82 and 100 grams of tea leaves?