At a computer manufacturing company, the actual size of computer chips is normally
distributed with a mean of 1 centimeter and a standard deviation of 0.1 centimeter. A
random sample of 12 computer chips is taken. What is the probability that the sample
mean will be between 0.99 and 1.01 centimeters?
TABLE 11-11
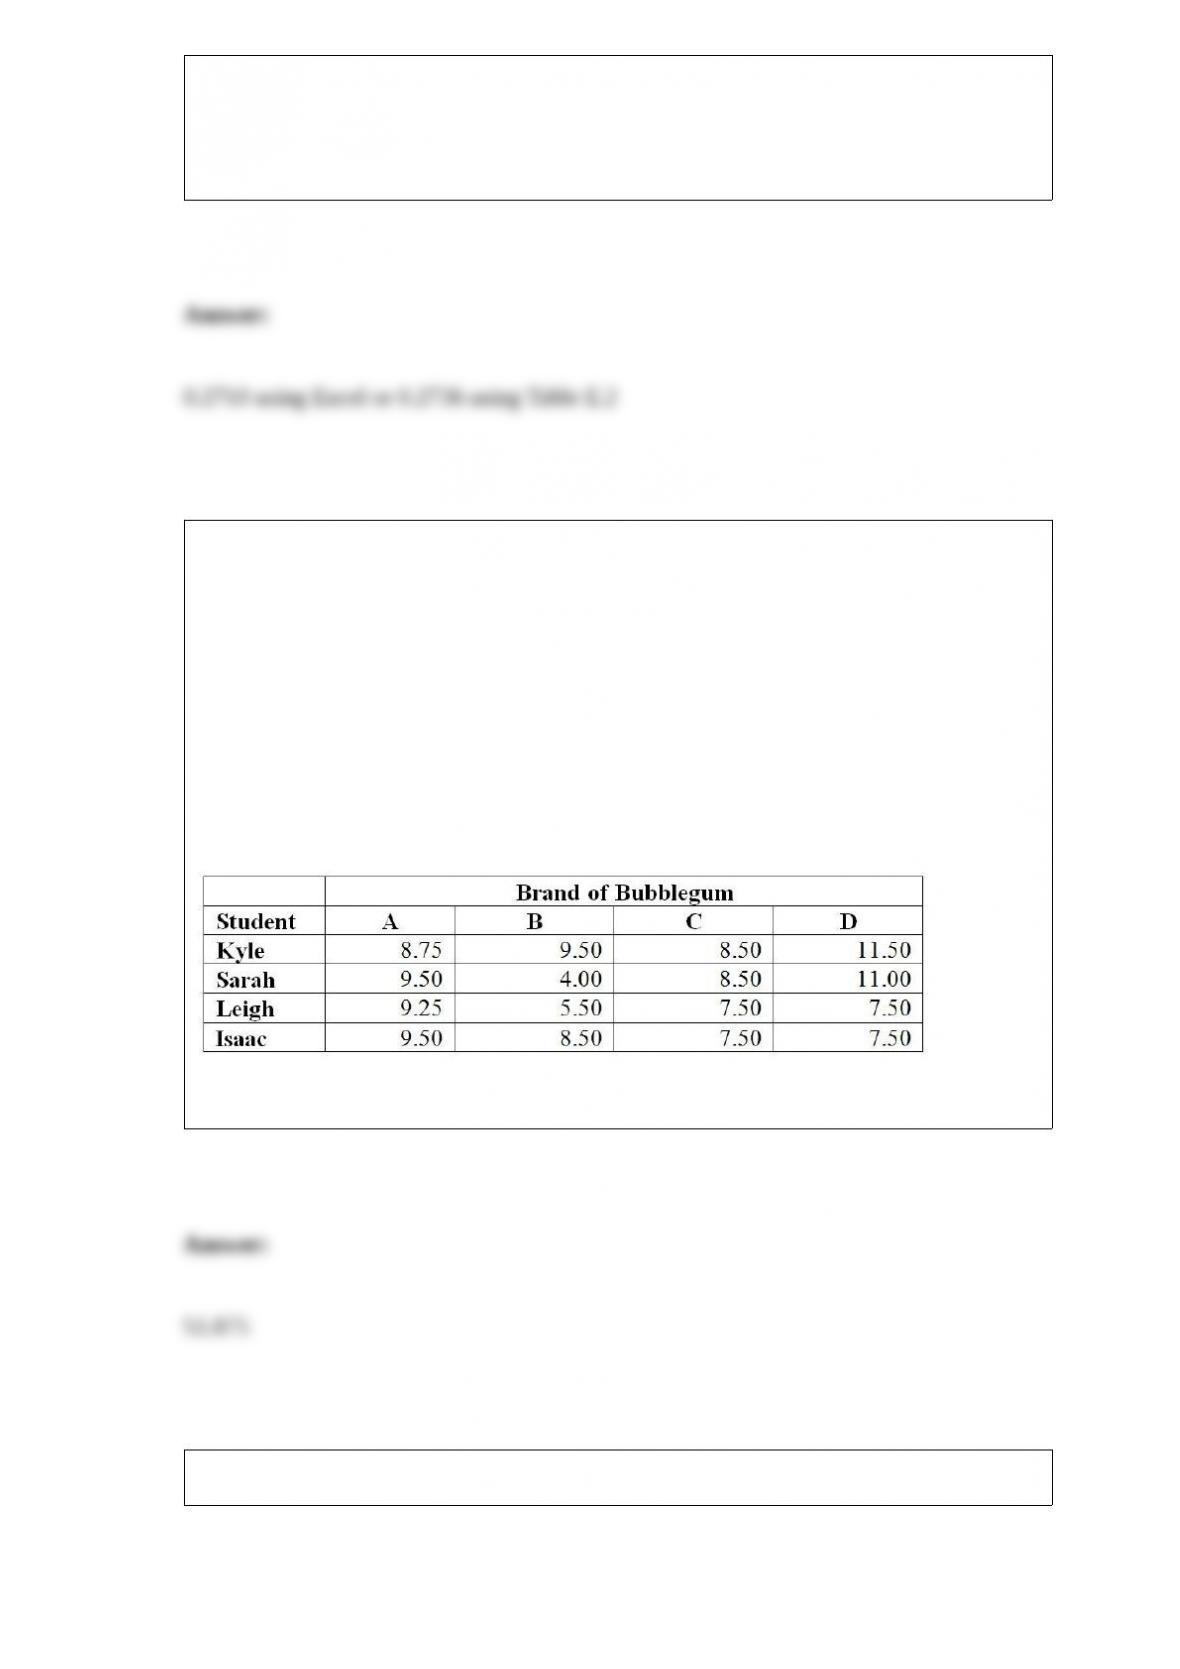
A student team in a business statistics course designed an experiment to investigate
whether the brand of bubblegum used affected the size of bubbles they could blow. To
reduce the person-to-person variability, the students decided to use a randomized block
design using themselves as blocks.
Four brands of bubblegum were tested. A student chewed two pieces of a brand of gum
and then blew a bubble, attempting to make it as big as possible. Another student
measured the diameter of the bubble at its biggest point. The following table gives the
diameters of the bubbles (in inches) for the 16 observations.
Referring to Table 11-11, the amount of total variation or SST is ________.
Coverage error results in a ________.
TABLE 3-5
The rate of return of a Fortune 500 company over the past 15 years are: 3.17%, 4.43%,
5.93%, 5.43%, 7.29%, 8.21%, 6.23%, 5.23%, 4.34%, 6.68%, 7.14%, -5.56%, -5.23%,
-5.73%, -10.34%.
Referring to Table 3-5, compute the arithmetic mean rate of return per year.
The interval between patients arriving at an outpatient clinic follows an exponential
distribution with a mean of 15 minutes. What is the mean number of arrivals per
minute?
TABLE 13-4
The managers of a brokerage firm are interested in finding out if the number of new
clients a broker brings into the firm affects the sales generated by the broker. They
sample 12 brokers and determine the number of new clients they have enrolled in the
last year and their sales amounts in thousands of dollars. These data are presented in the
table that follows.
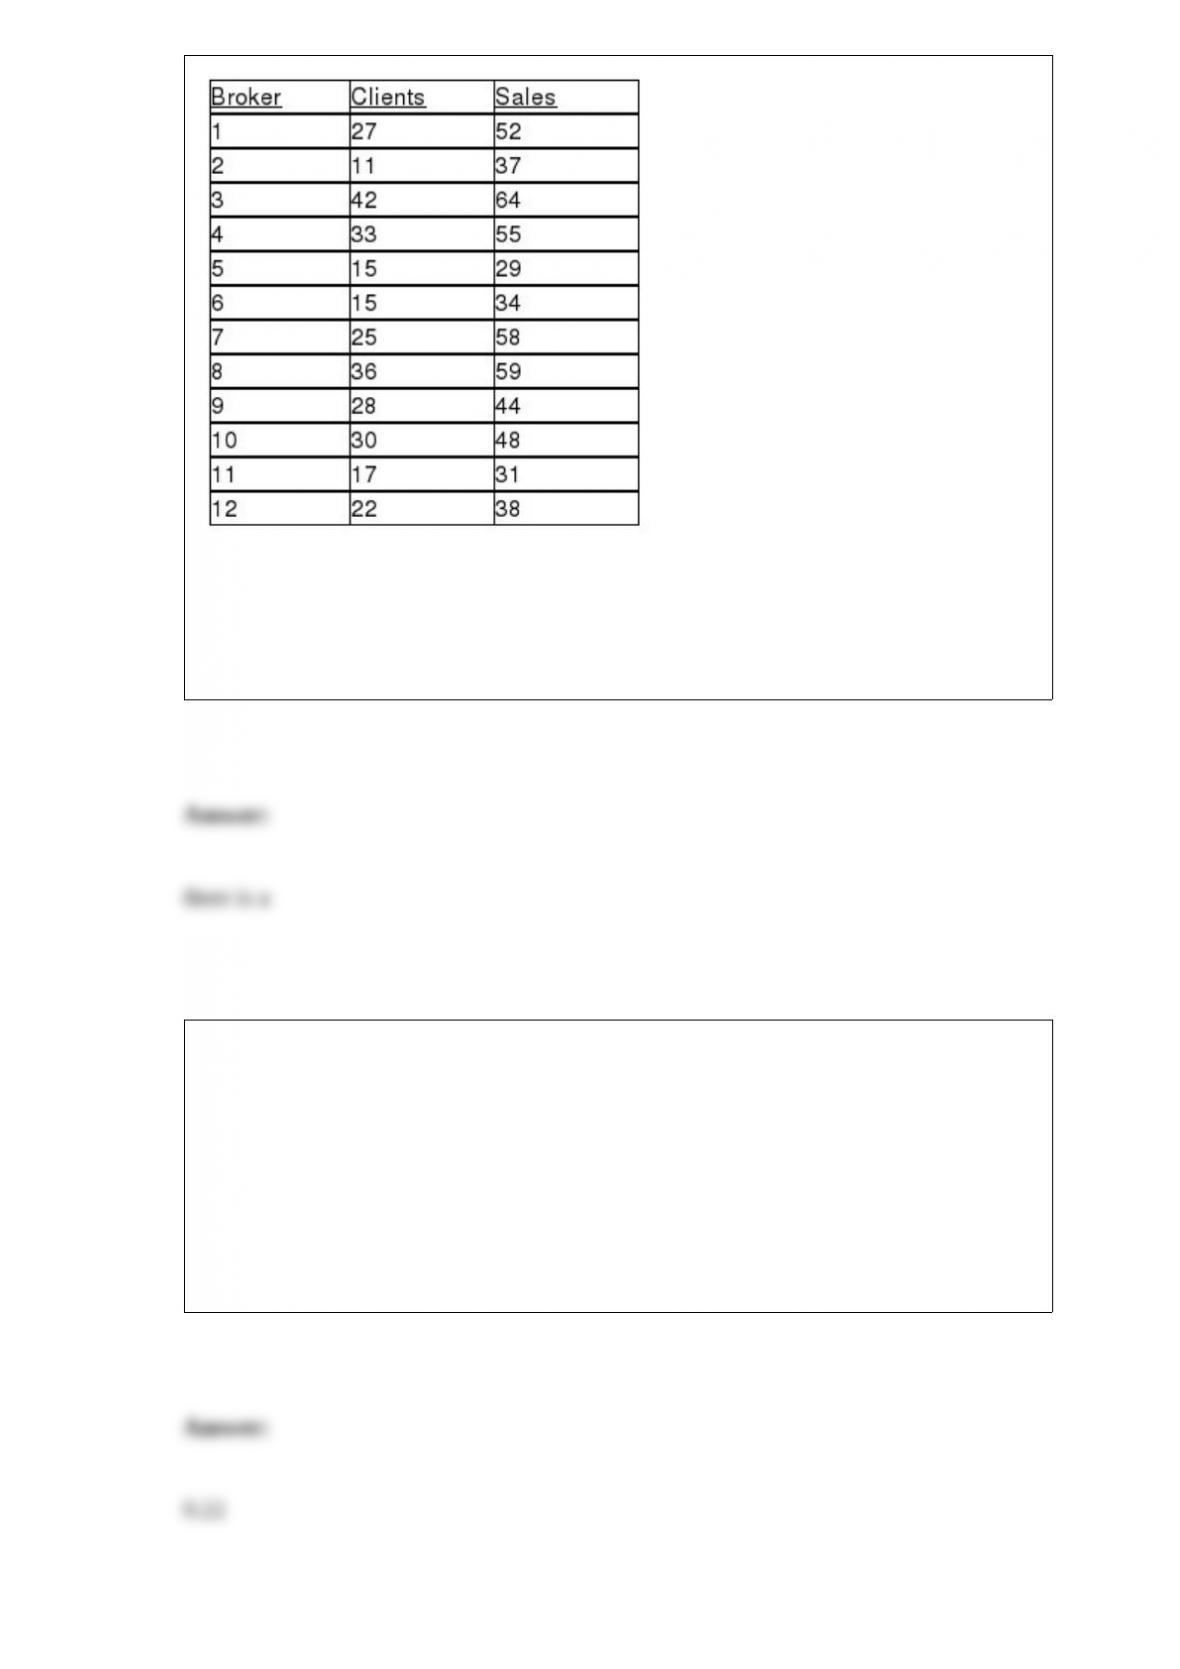
Referring to Table 13-4, the managers of the brokerage firm wanted to test the
hypothesis that the population slope was equal to 0. At a level of significance of 0.01,
the decision that should be made implies that ________ (‘there is a’ or ‘there is no’)
linear dependent relationship between the independent and dependent variables.
TABLE 3-7
In a recent academic year, many public universities in the United States raised tuition
and fees due to a decrease in state subsidies. The change in the cost of tuition, a shared
dormitory room, and the most popular meal plan from the previous academic year for a
sample of 10 public universities were as follows: $1,589, $593, $1,223, $869, $423,
$1,720, $708, $1,425, $922 and $308.
Referring to Table 3-7, what is the skewness statistic of the change in the cost?
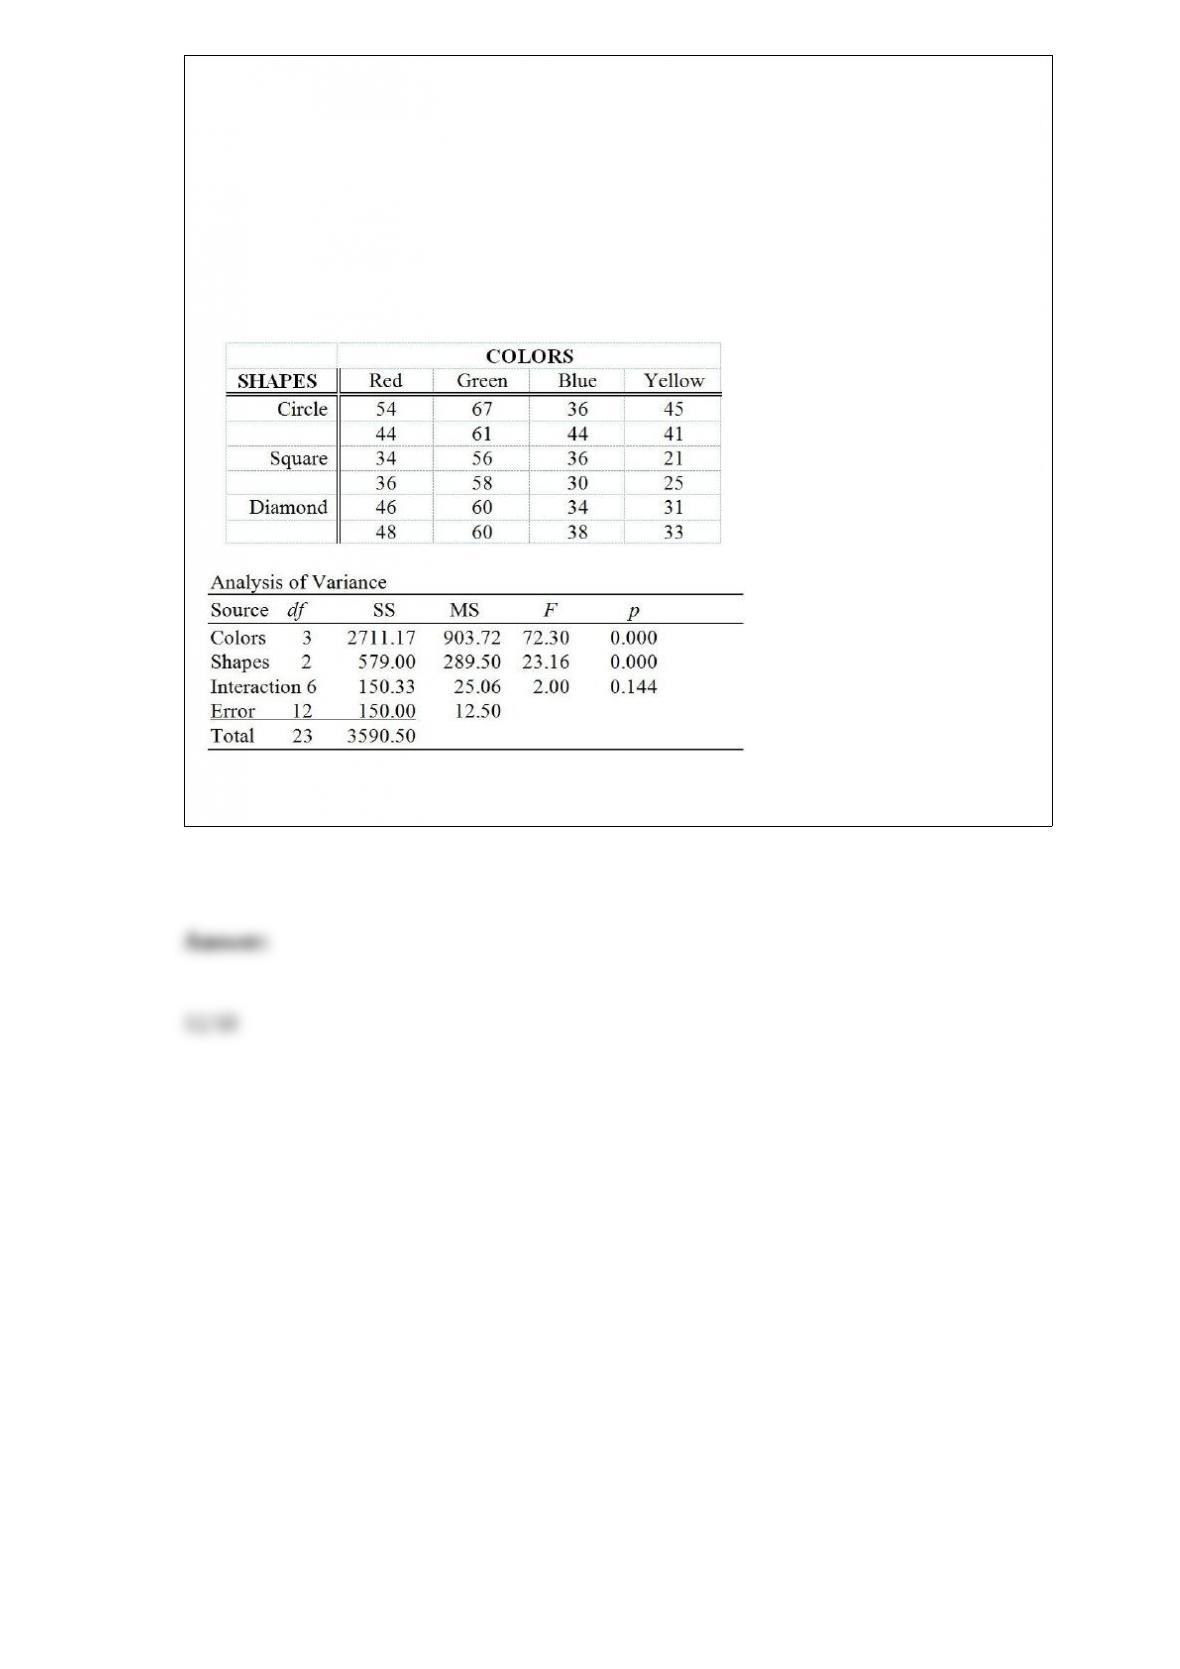
TABLE 11-9
The marketing manager of a company producing a new cereal aimed for children wants
to examine the effect of the color and shape of the box’s logo on the approval rating of
the cereal. He combined 4 colors and 3 shapes to produce a total of 12 designs. Each
logo was presented to 2 different groups (a total of 24 groups) and the approval rating
for each was recorded and is shown below. The manager analyzed these data using the
α = 0.05 level of significance for all inferences.
Referring to Table 11-9, the mean square for error is ________.