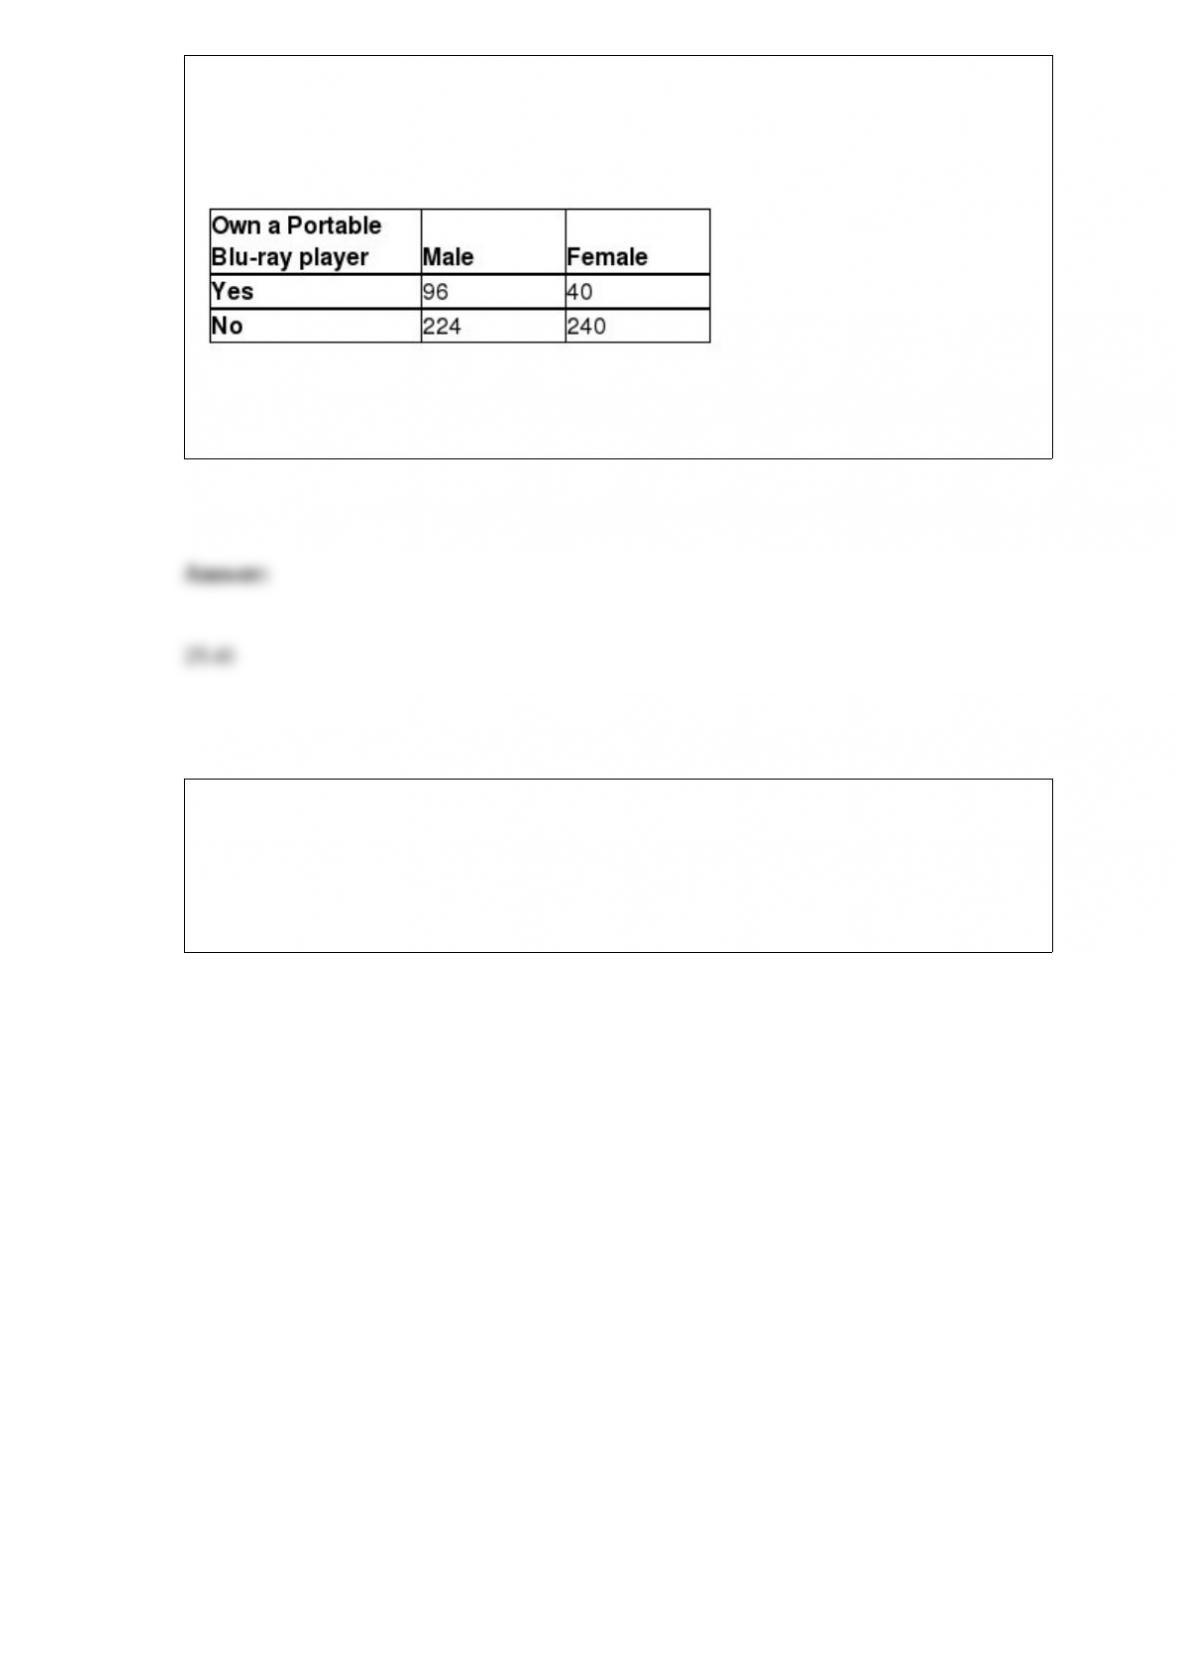
TABLE 2-14
The table below contains the number of people who own a portable Blu-ray player in a
sample of 600 broken down by gender.
Referring to Table 2-14, of those who owned a portable Blu-ray player in the sample,
________ percent were females.
TABLE 18-7
A supplier of silicone sheets for producers of computer chips wants to evaluate her
manufacturing process. She takes sample sizes of 5 from each day’s output and counts
the number of blemishes on each silicone sheet. The results from 20 days of such
evaluations are presented below.
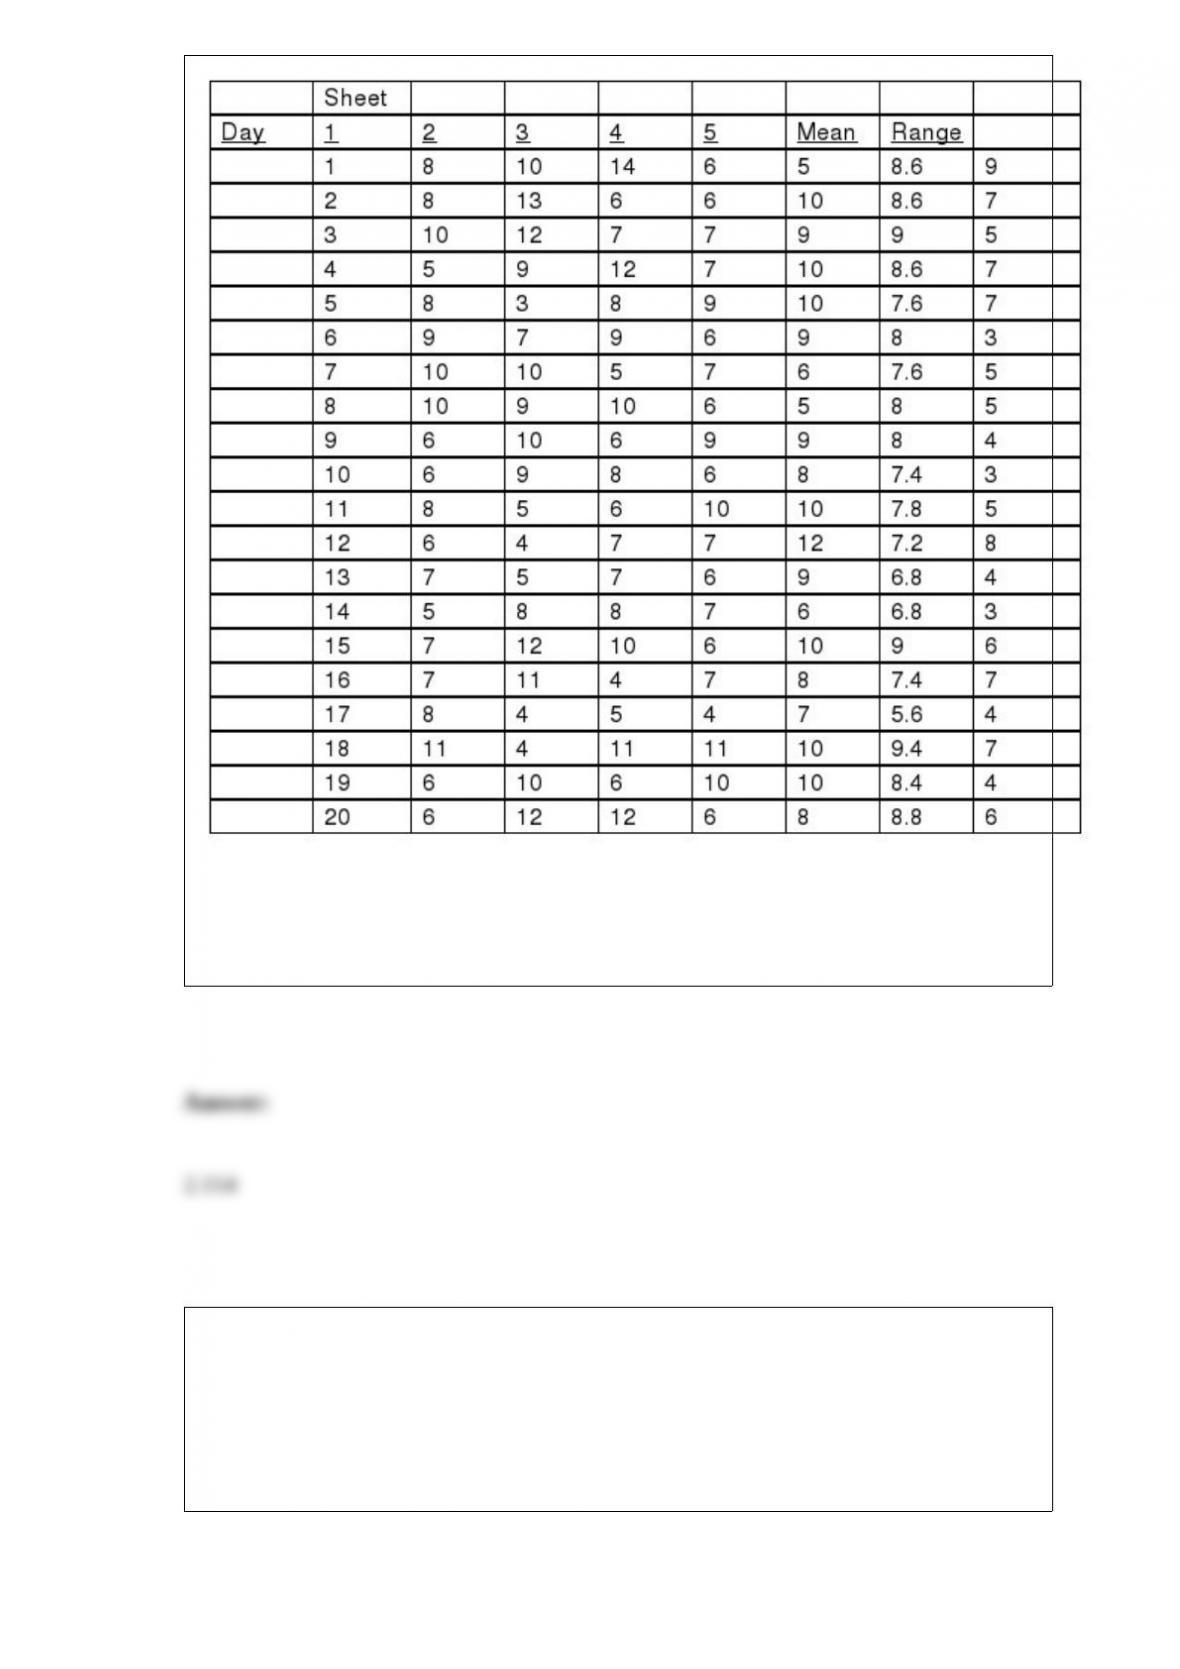
She also decides that the upper specification limit is 10 blemishes.
Referring to Table 18-7, an R chart is to be constructed for the number of blemishes.
One way to create the upper control limit involves multiplying the mean of the sample
ranges by D4. For this data set, the value of D4 is ________.
TABLE 5-7
There are two houses with almost identical characteristics available for investment in
two different neighborhoods with drastically different demographic composition. The
anticipated gain in value when the houses are sold in 10 years has the following
probability distribution:
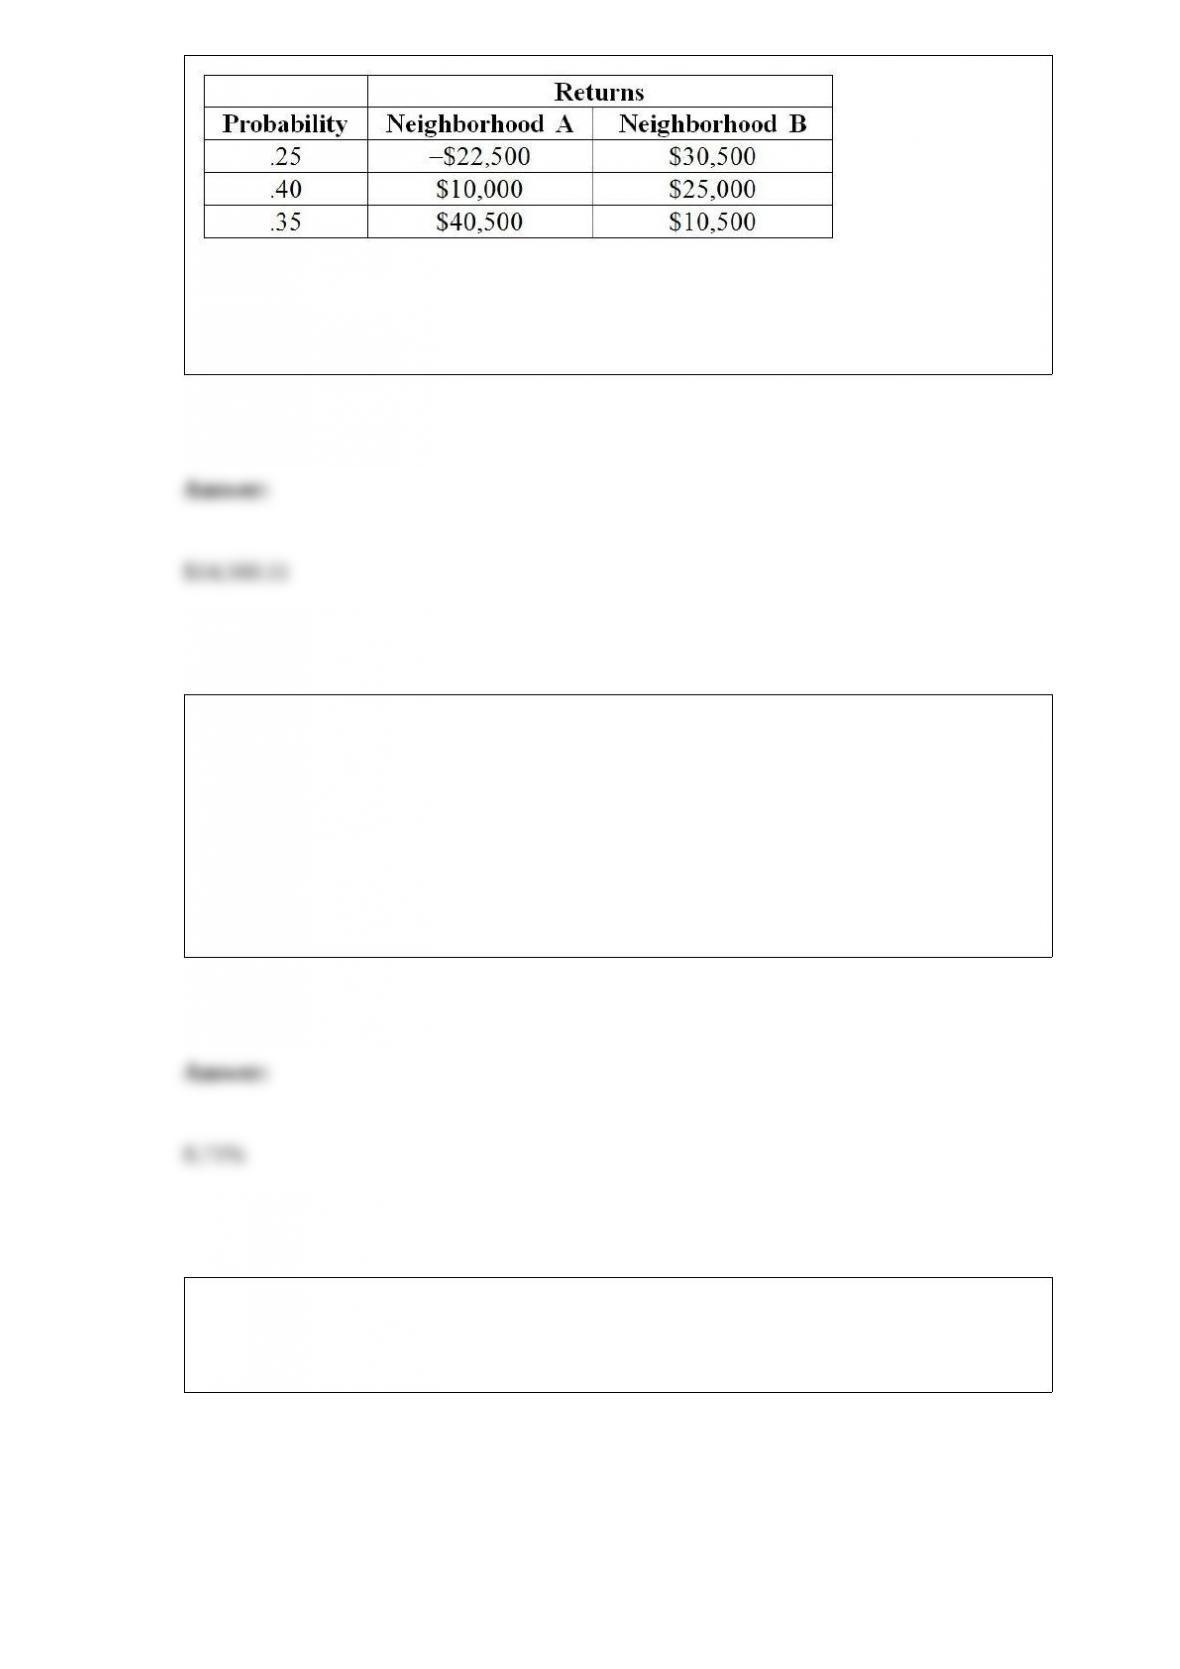
Referring to Table 5-7, if you can invest 70% of your money on the house in
neighborhood A and the remaining on the house in neighborhood B, what is the
portfolio risk of your investment?
TABLE 7-8
According to a survey, only 15% of customers who visited the website of a major retail
store made a purchase. Random samples of size 50 are selected from a population of
900. Use the finite population correction factor.
Referring to Table 7-8, 90% of the samples will have more than what percentage of
customers who will make a purchase after visiting the website?
TABLE 16-13
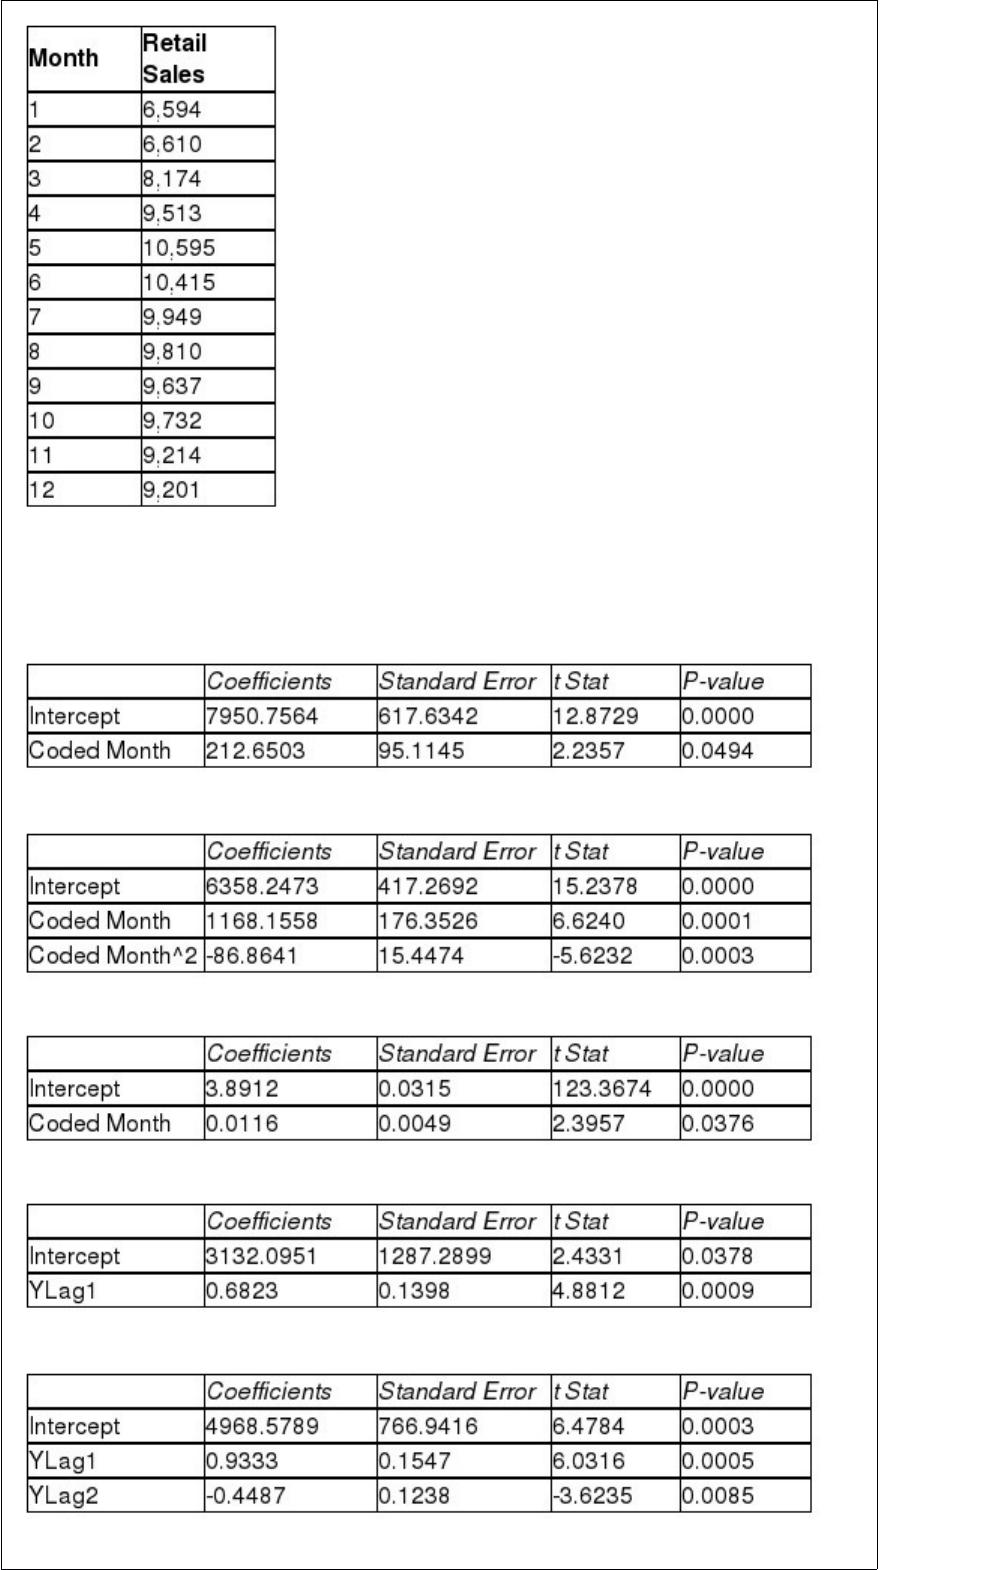
Given below is the monthly time-series data for U.S. retail sales of building materials
over a specific year.

The results of the linear trend, quadratic trend, exponential trend, first-order
autoregressive, second-order autoregressive and third-order autoregressive model are
presented below in which the coded month for the 1st month is 0:
Linear trend model:
Quadratic trend model:
Exponential trend model:
First-order autoregressive:
Second-order autoregressive:
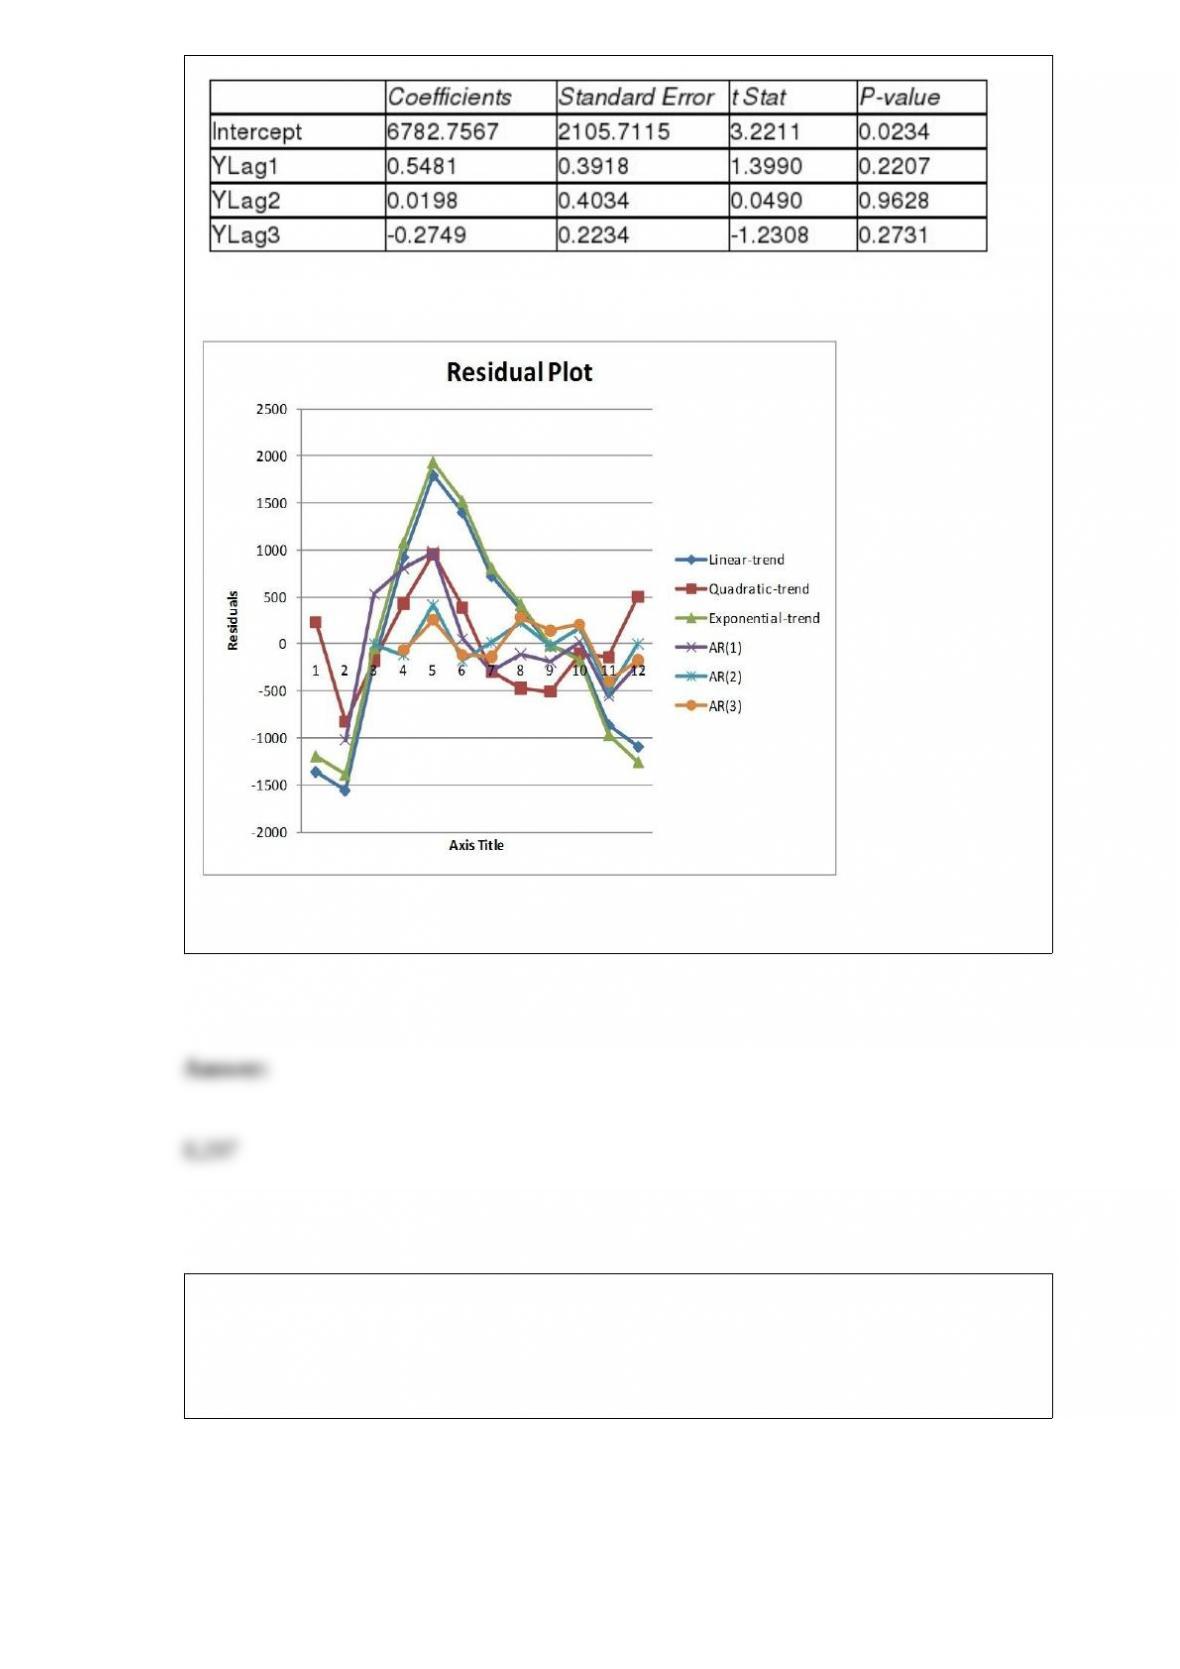
Third-order autoregressive:

Below is the residual plot of the various models:
Referring to Table 16-13, what is your forecast for the 13th month using the first-order
autoregressive model?
TABLE 11-10
An agronomist wants to compare the crop yield of 3 varieties of chickpea seeds. She
plants all 3 varieties of the seeds on each of 5 different patches of fields. She then
measures the crop yield in bushels per acre. Treating this as a randomized block design,
the results are presented in the table that follows.
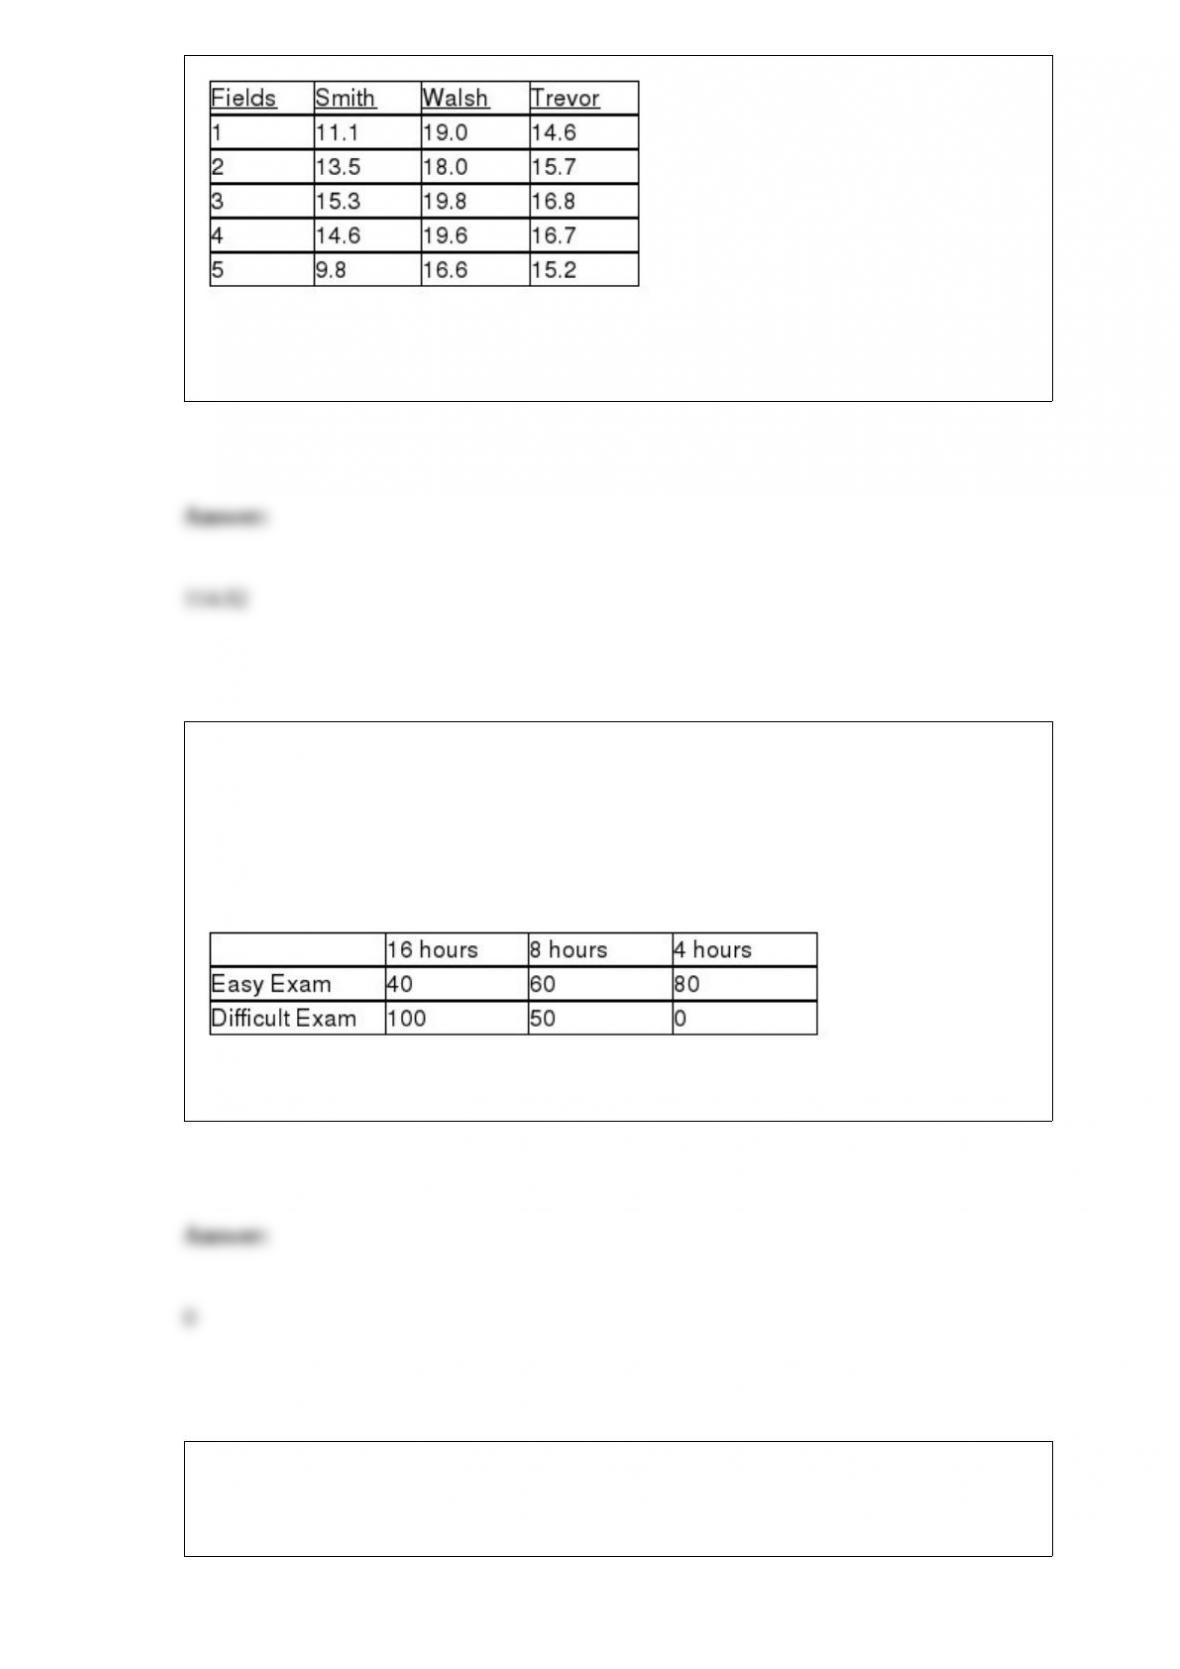
Referring to Table 11-10, the agronomist decided to perform a randomized block F test
for the difference in the means. The amount of total variation or SST is ________.
TABLE 19-6
A student wanted to find out the optimal strategy to study for a Business Statistics
exam. He constructed the following payoff table based on the mean amount of time he
needed to study every week for the course and the degree of difficulty of the exam.
From the information that he gathered from students who had taken the course, he
concluded that there was a 40% probability that the exam would be easy.
Referring to Table 19-6, what is the opportunity loss of spending 4 hours per week on
average studying for the exam when the exam turns out to be easy?
TABLE 16-13
Given below is the monthly time-series data for U.S. retail sales of building materials
over a specific year.
The results of the linear trend, quadratic trend, exponential trend, first-order
autoregressive, second-order autoregressive and third-order autoregressive model are
presented below in which the coded month for the 1st month is 0:
Linear trend model:
Quadratic trend model:
Exponential trend model:
First-order autoregressive:
Second-order autoregressive:
Third-order autoregressive:
Below is the residual plot of the various models:
Referring to Table 16-13, if a five-month moving average is used to smooth this series,
what would be the first calculated value?
TABLE 10-5
To test the effectiveness of a business school preparation course, 8 students took a
general business test before and after the course. The results are given below.
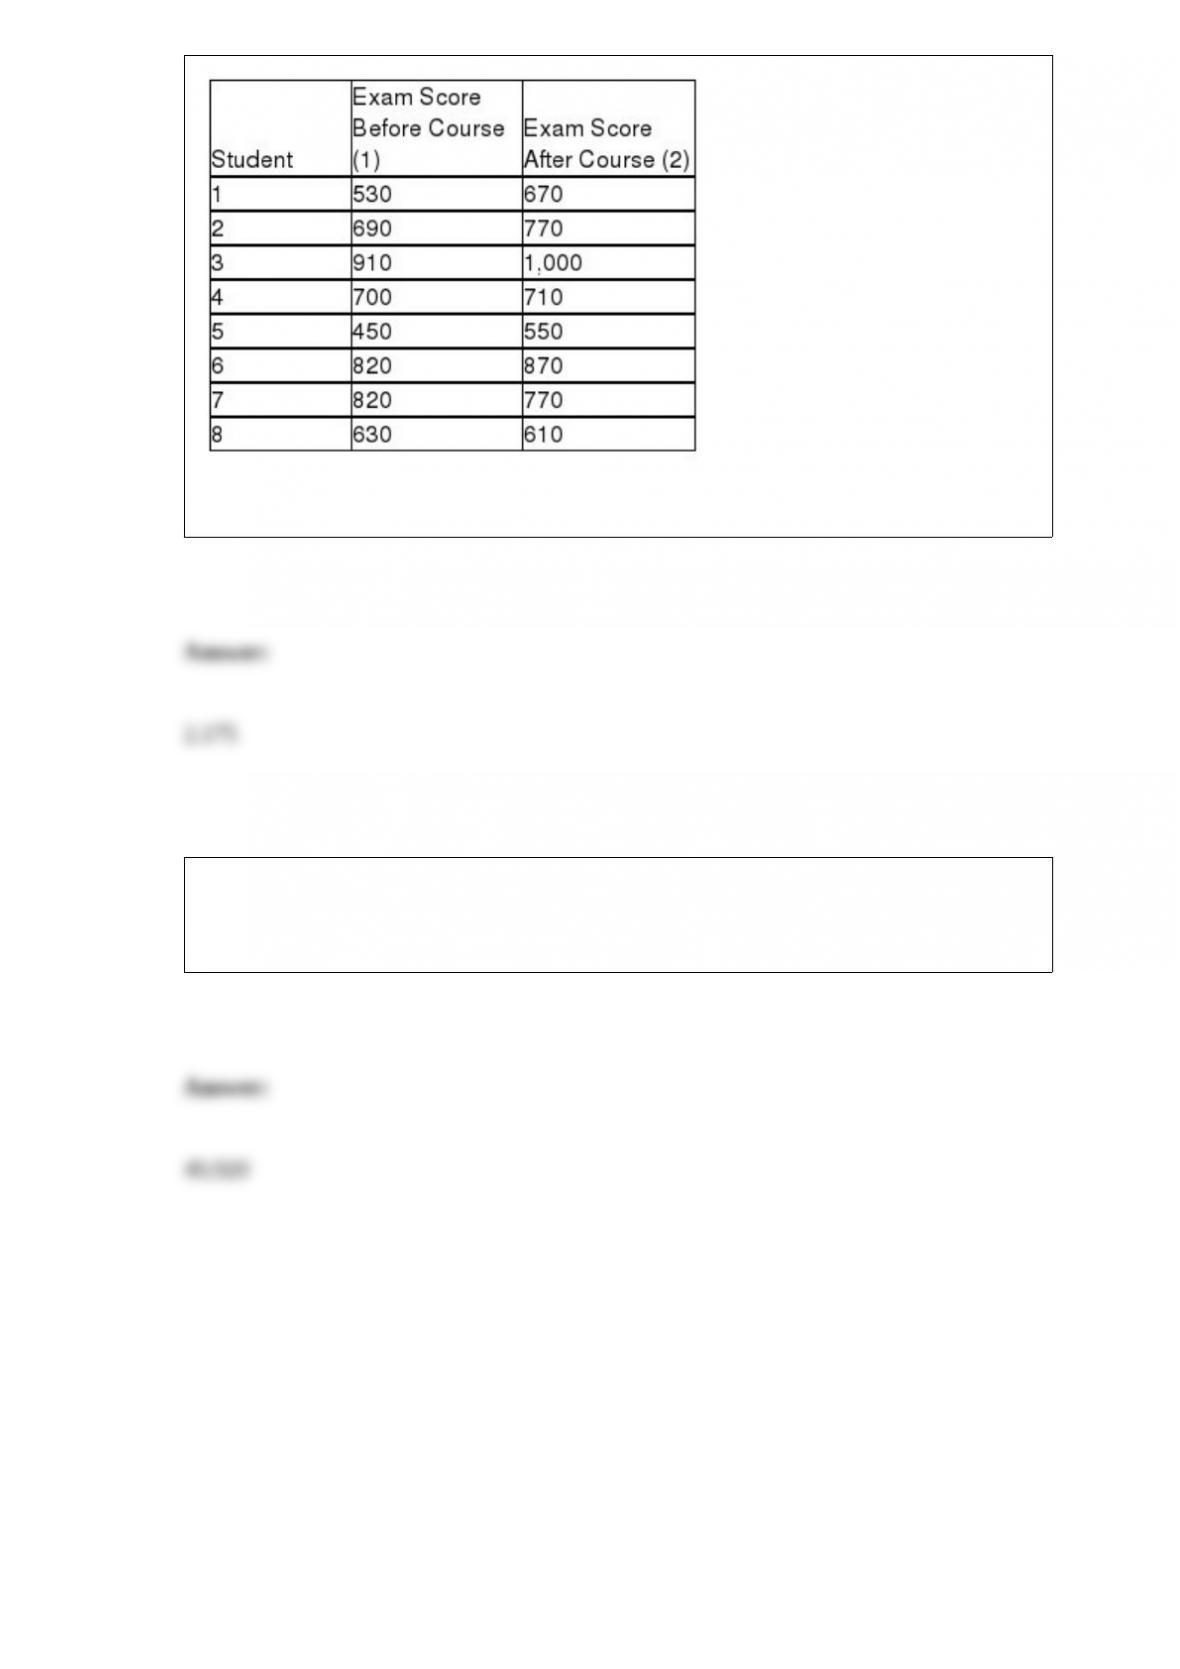
Referring to Table 10-5, the calculated value of the test statistic is ________.
A debate team of 4 is to be chosen from a class of 35. There are two twin brothers in the
class. How many possible ways can the team be formed which will not include any of
the twin brothers?