TABLE 17-3
A financial analyst wanted to examine the relationship between salary (in $1,000) and 4
variables: age (X1 = Age), experience in the field (X2 = Exper), number of degrees (X3 =
Degrees), and number of previous jobs in the field (X4 = Prevjobs). He took a sample of
20 employees and obtained the following Microsoft Excel output:
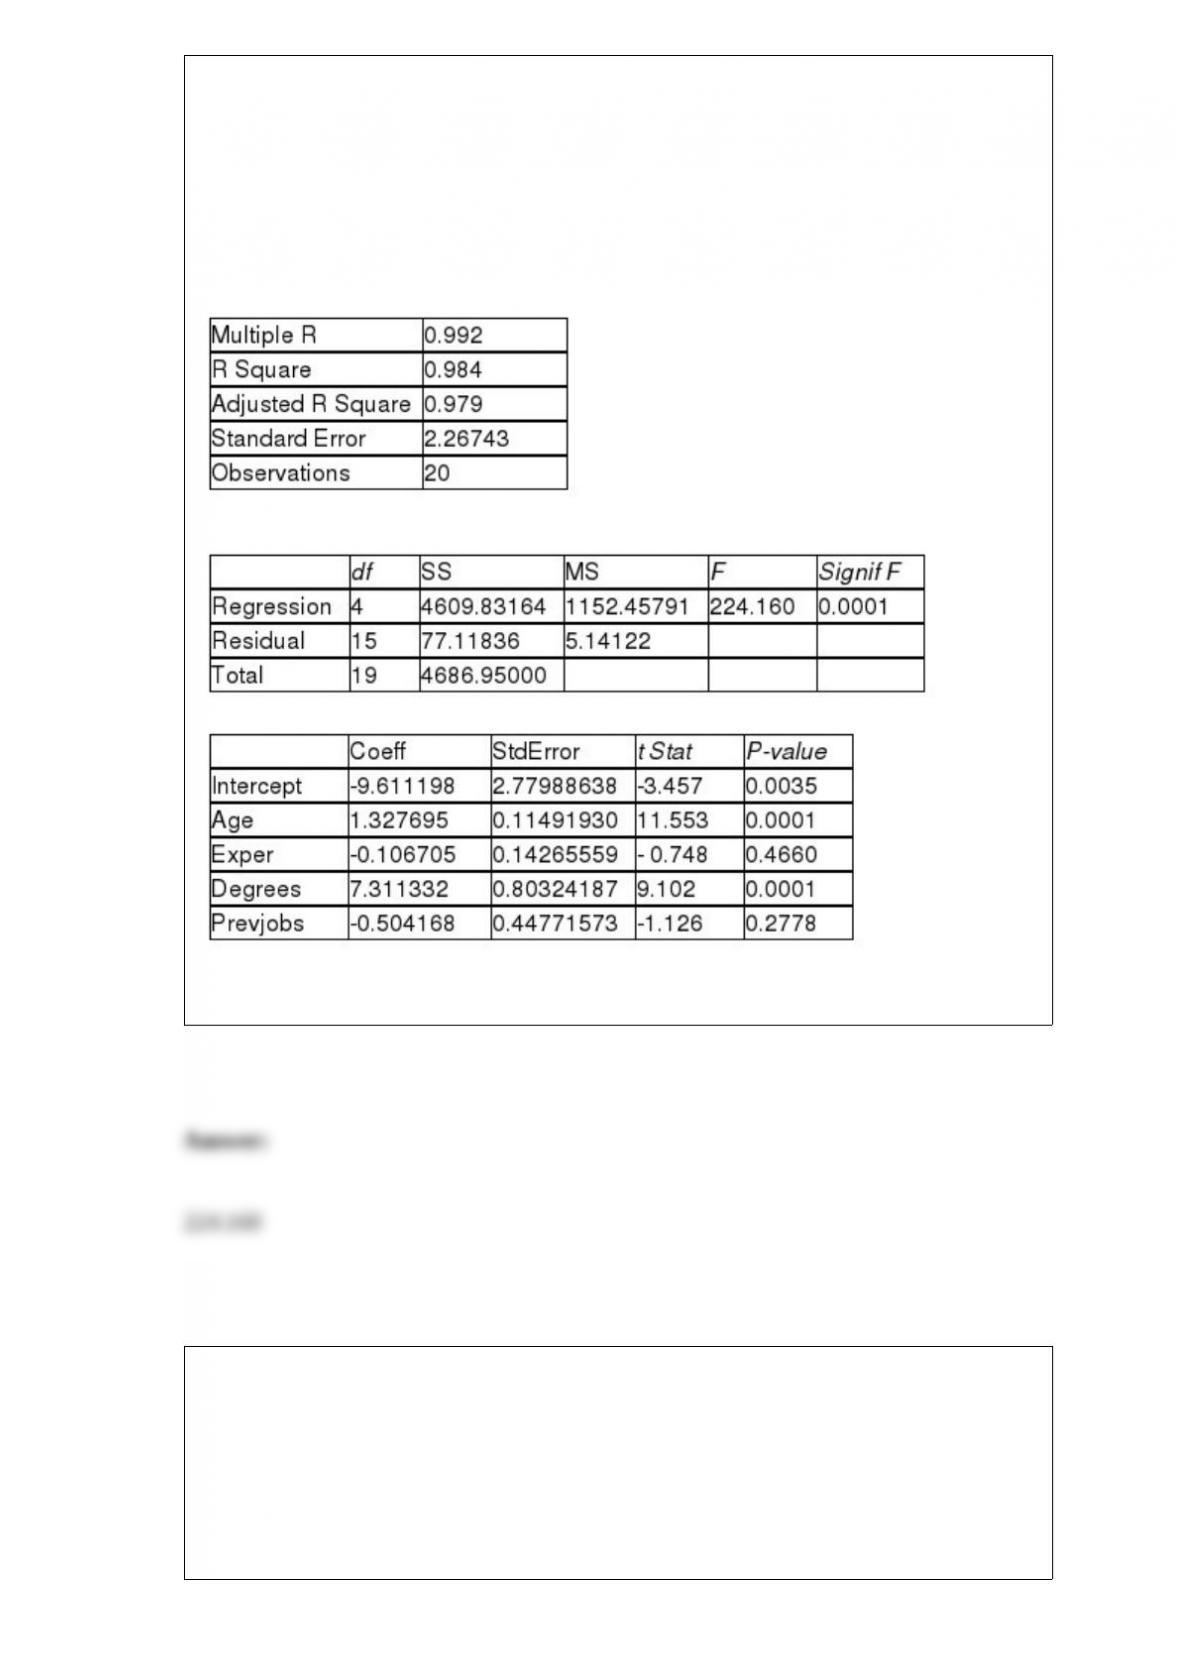
SUMMARY OUTPUT
Regression Statistics
ANOVA
Referring to Table 17-3, the value of the F-statistic for testing the significance of the
entire regression is ________.
TABLE 17-8
The superintendent of a school district wanted to predict the percentage of students
passing a sixth-grade proficiency test. She obtained the data on percentage of students
passing the proficiency test (% Passing), daily mean of the percentage of students
attending class (% Attendance), mean teacher salary in dollars (Salaries), and
instructional spending per pupil in dollars (Spending) of 47 schools in the state.
Following is the multiple regression output with Y = % Passing as the dependent
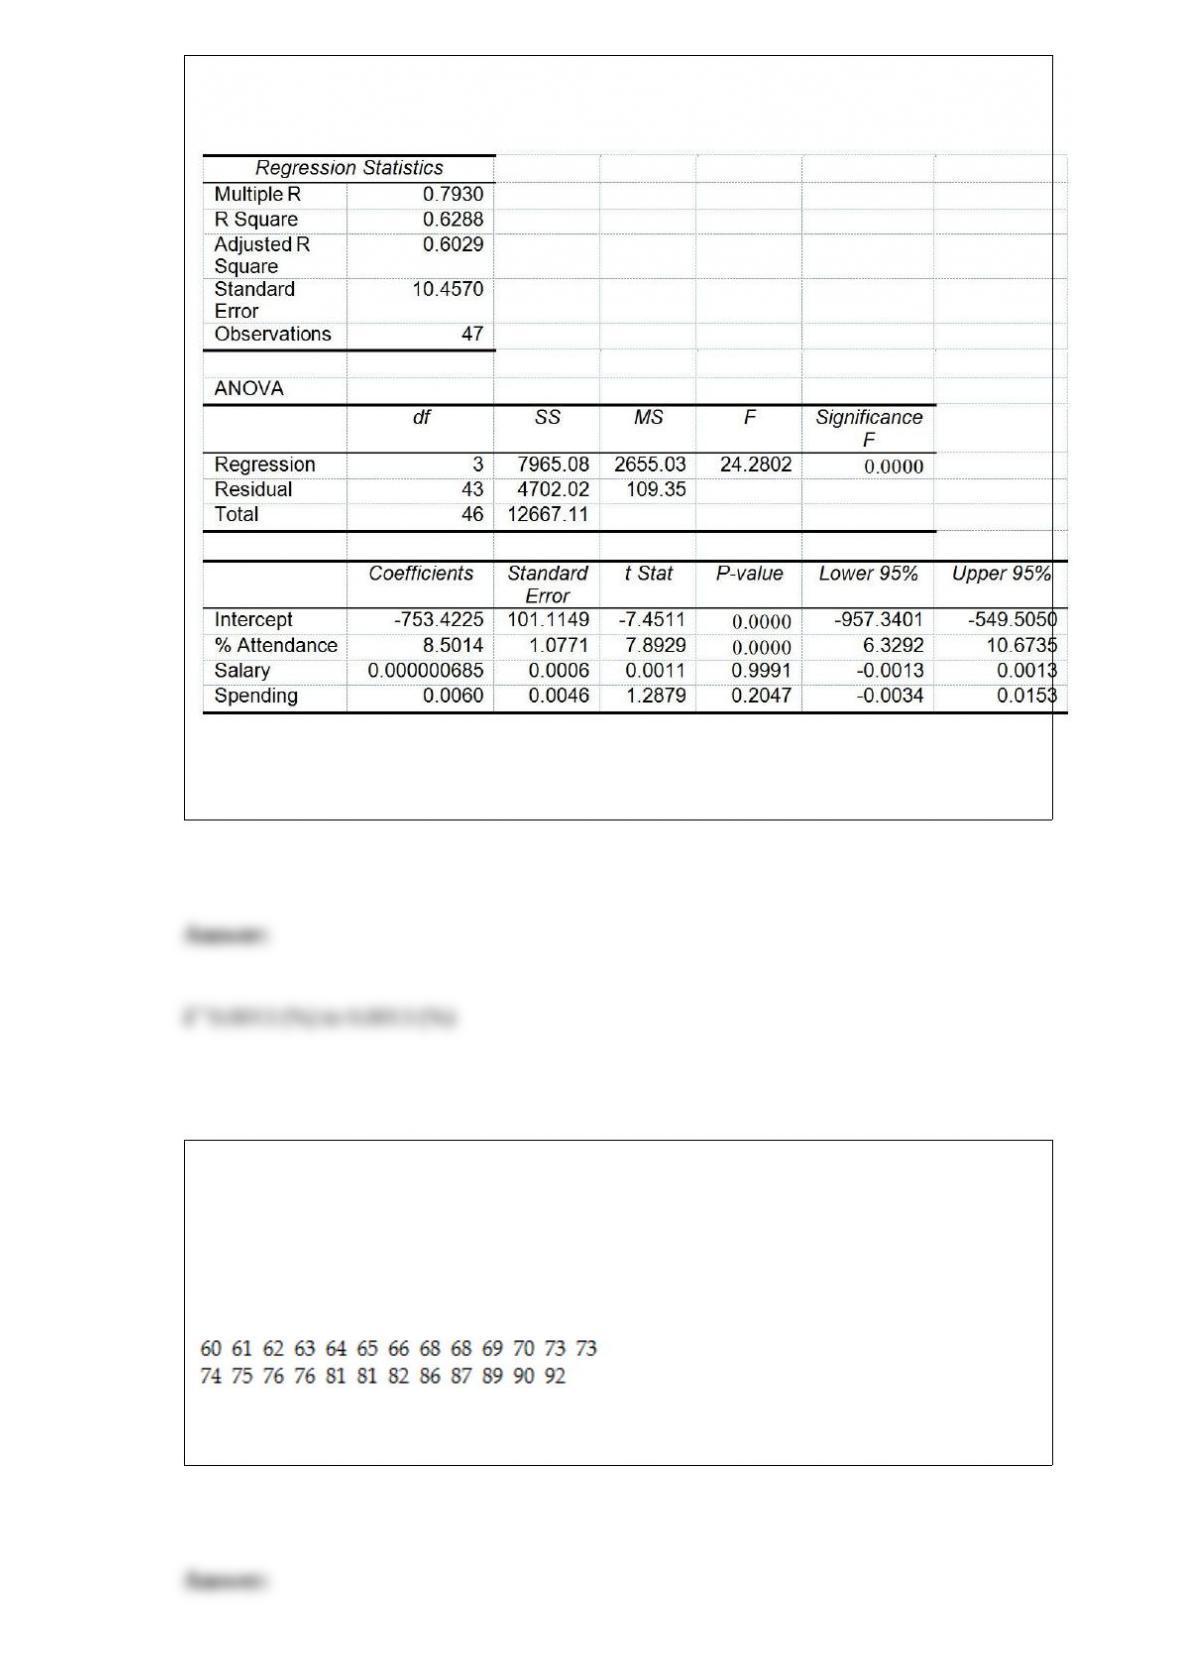
variable, X1 = % Attendance, X2 = Salaries and X3 = Spending:
Referring to Table 17-8, what are the lower and upper limits of the 95% confidence
interval estimate for the effect of a one dollar increase in mean teacher salary on the
mean percentage of students passing the proficiency test?
TABLE 3-1
Health care issues are receiving much attention in both academic and political arenas. A
sociologist recently conducted a survey of citizens over 60 years of age whose net
worth is too high to qualify for Medicaid. The ages of 25 senior citizens were as
follows:
Referring to Table 3-1, determine the third quartile of the ages of the senior citizens.

Referring to Table 14-15, what is the value of the test statistic when
testing whether instructional spending per pupil has any effect on
percentage of students passing the proficiency test, taking into
account the effect of mean teacher salary?
TABLE 14-15
The superintendent of a school district wanted to predict the
percentage of students passing a sixth-grade proficiency test. She
obtained the data on percentage of students passing the proficiency
test (% Passing), mean teacher salary in thousands of dollars
(Salaries), and instructional spending per pupil in thousands of dollars
(Spending) of 47 schools in the state.
Following is the multiple regression output with Y = % Passing as the
dependent variable, X1 = Salaries and X2 = Spending:
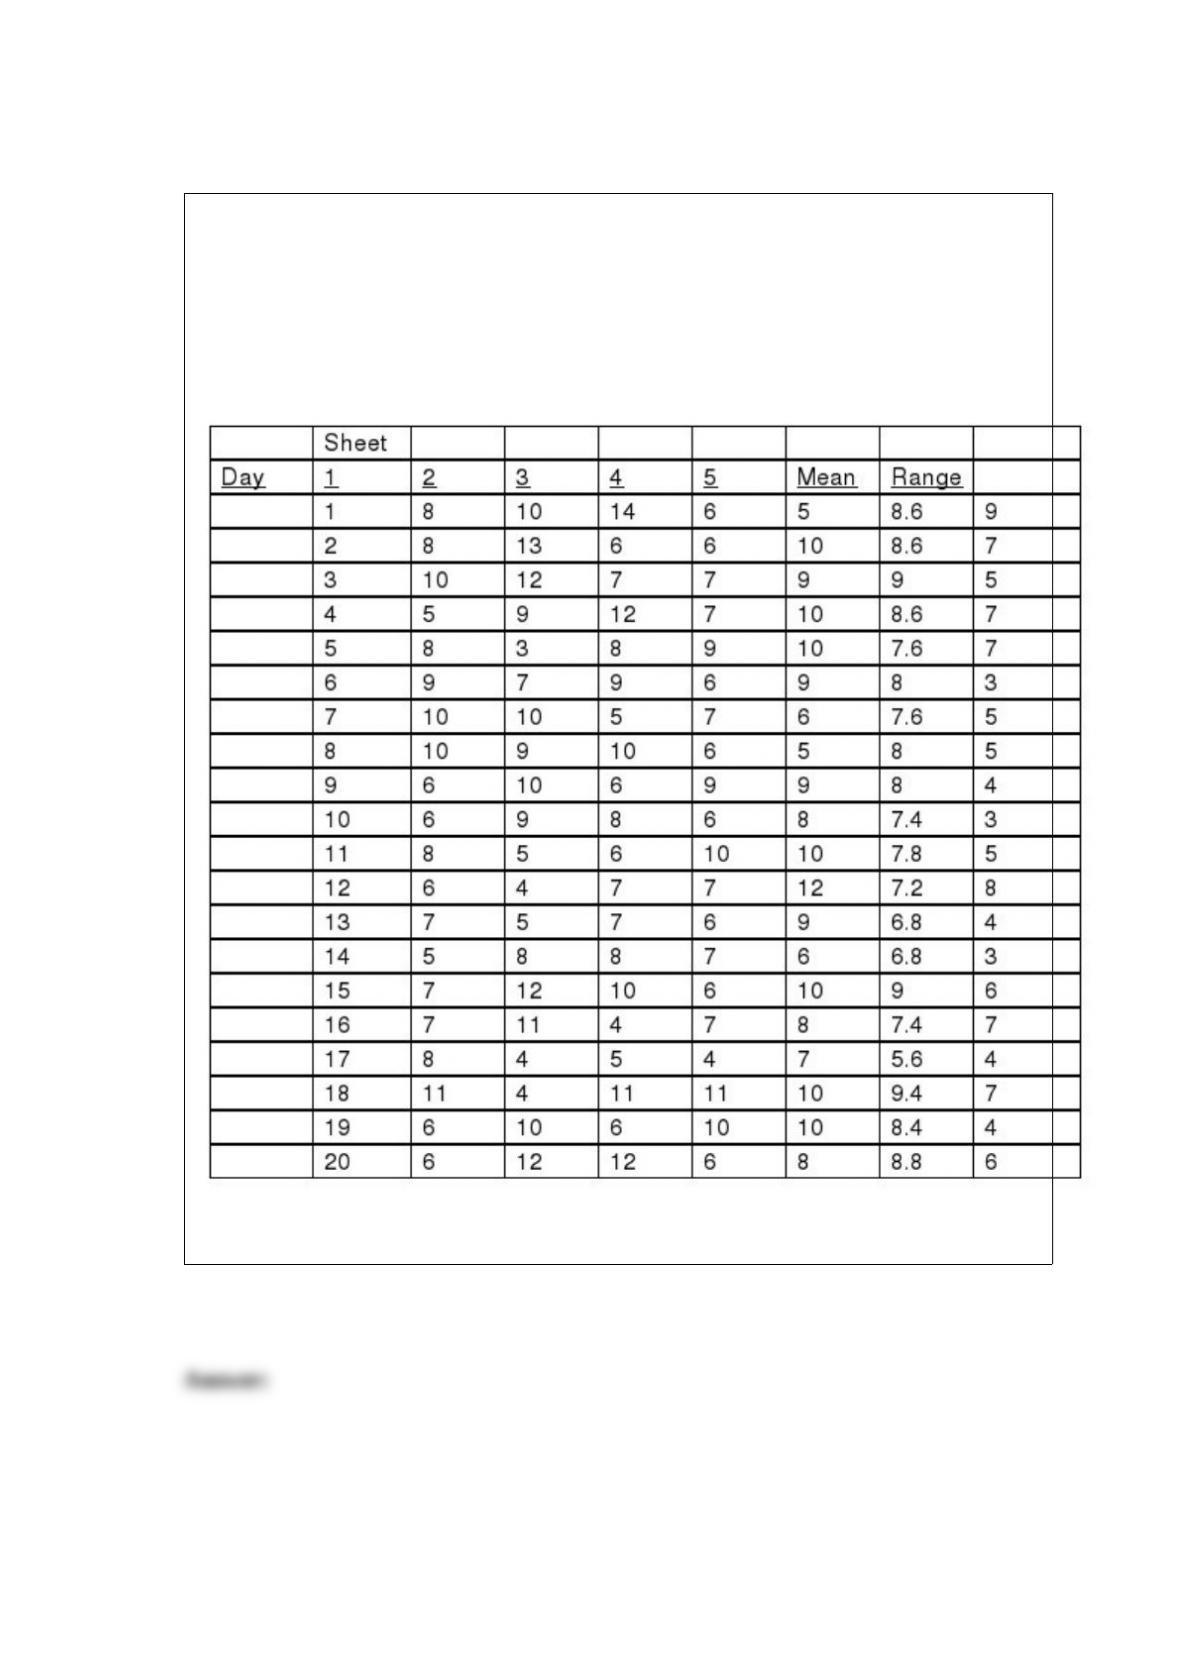
TABLE 18-7
A supplier of silicone sheets for producers of computer chips wants to evaluate her
manufacturing process. She takes sample sizes of 5 from each day’s output and counts
the number of blemishes on each silicone sheet. The results from 20 days of such
evaluations are presented below.
She also decides that the upper specification limit is 10 blemishes.
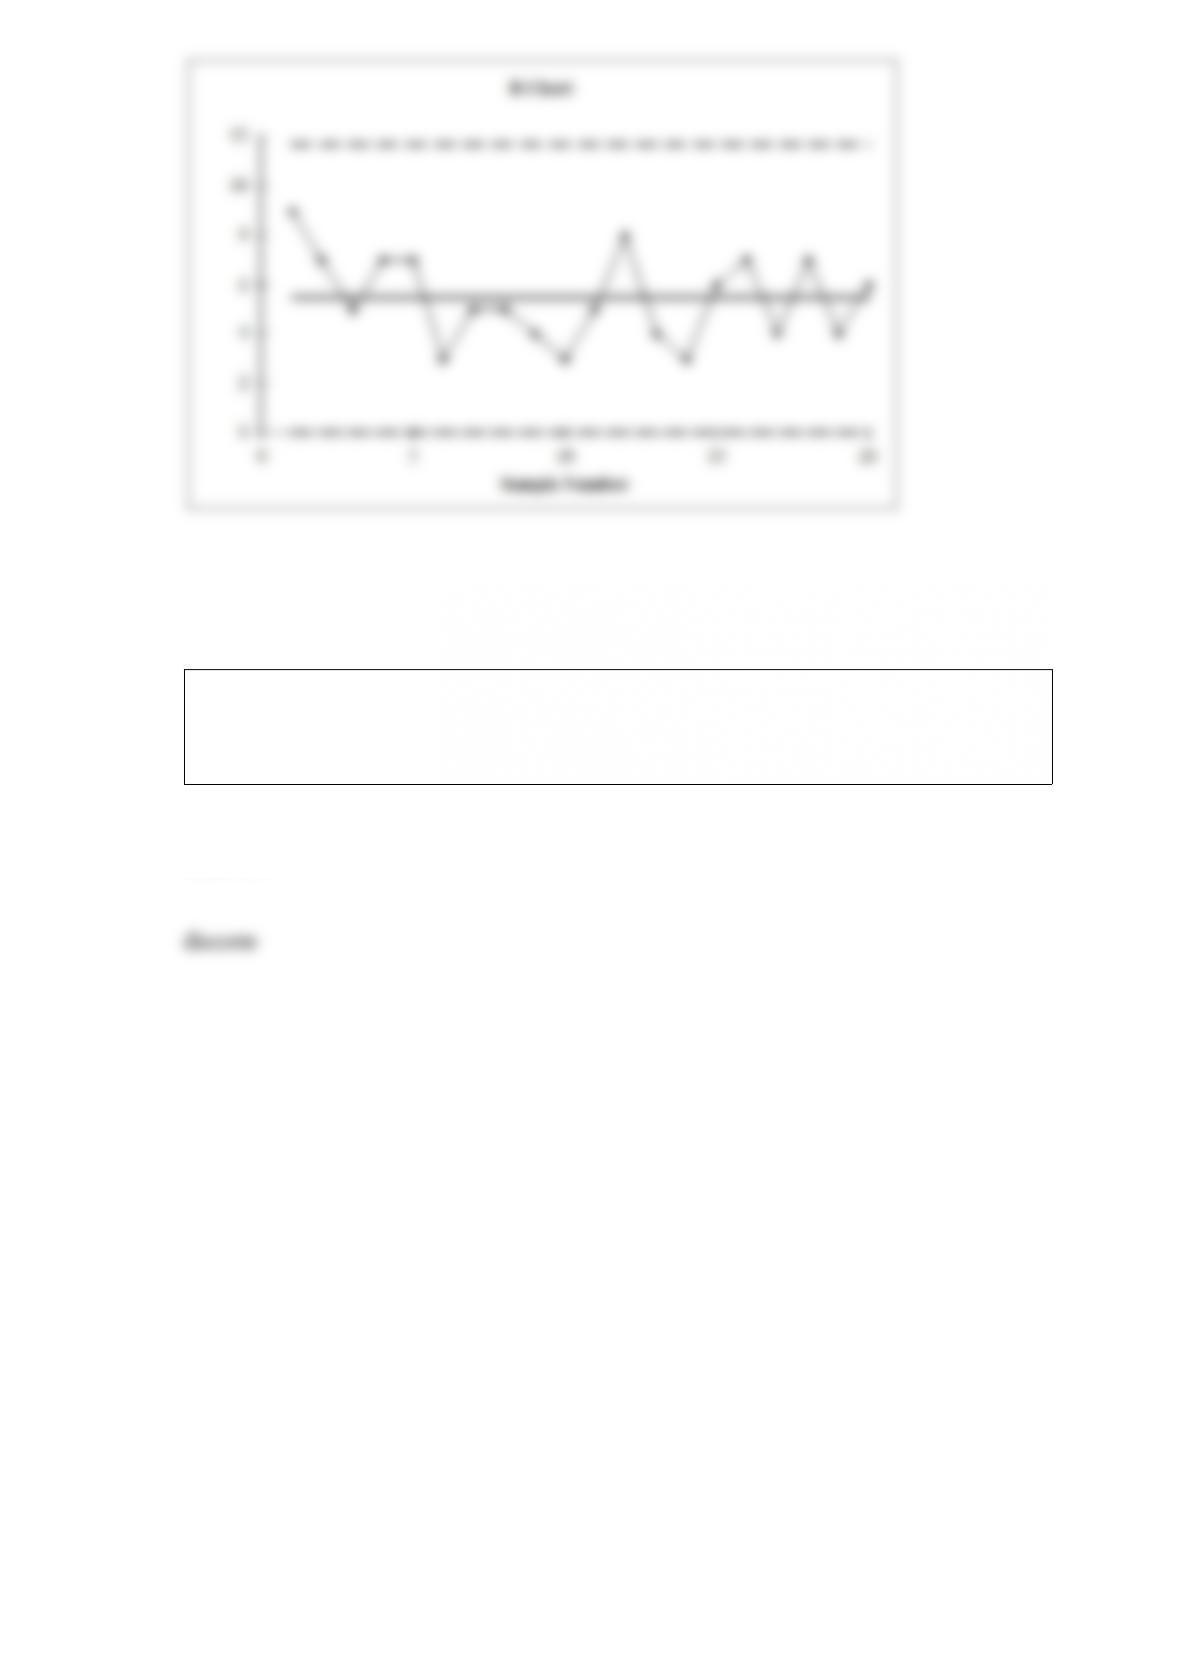
Referring to Table 18-7, construct an R chart for the number of blemishes.
An insurance company evaluates many numerical variables about a person before
deciding on an appropriate rate for automobile insurance. The number of claims a
person has made in the last 3 years is an example of a ________ numerical variable.