TABLE 6-3
Suppose the time interval between two consecutive defective light bulbs from a
production line has a uniform distribution over an interval from 0 to 90 minutes.
Referring to Table 6-3, the probability is 75% that the time interval between two
consecutive defective light bulbs will fall between which two values that are the same
distance from the mean?
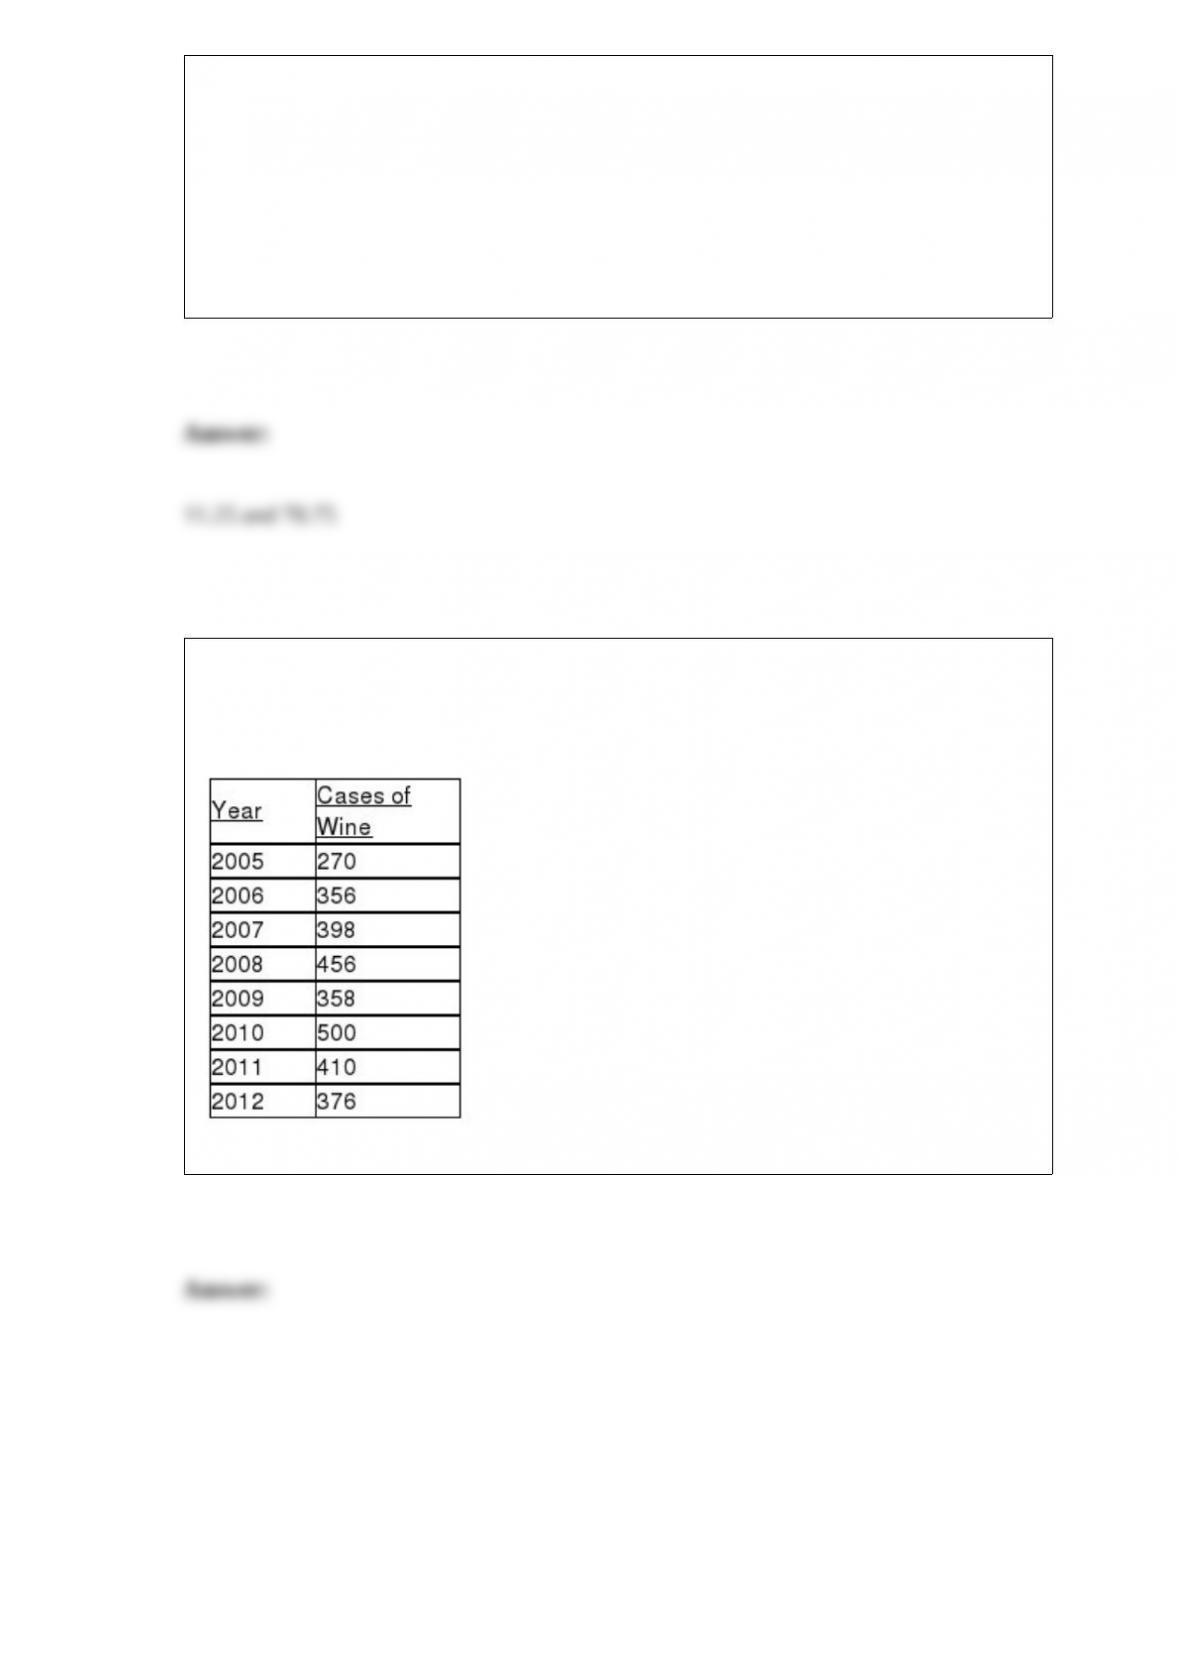
TABLE 16-4
The number of cases of merlot wine sold by a Paso Robles winery in an 8-year period
follows.
Referring to Table 16-4, construct a centered 5-year moving average for the wine sales.
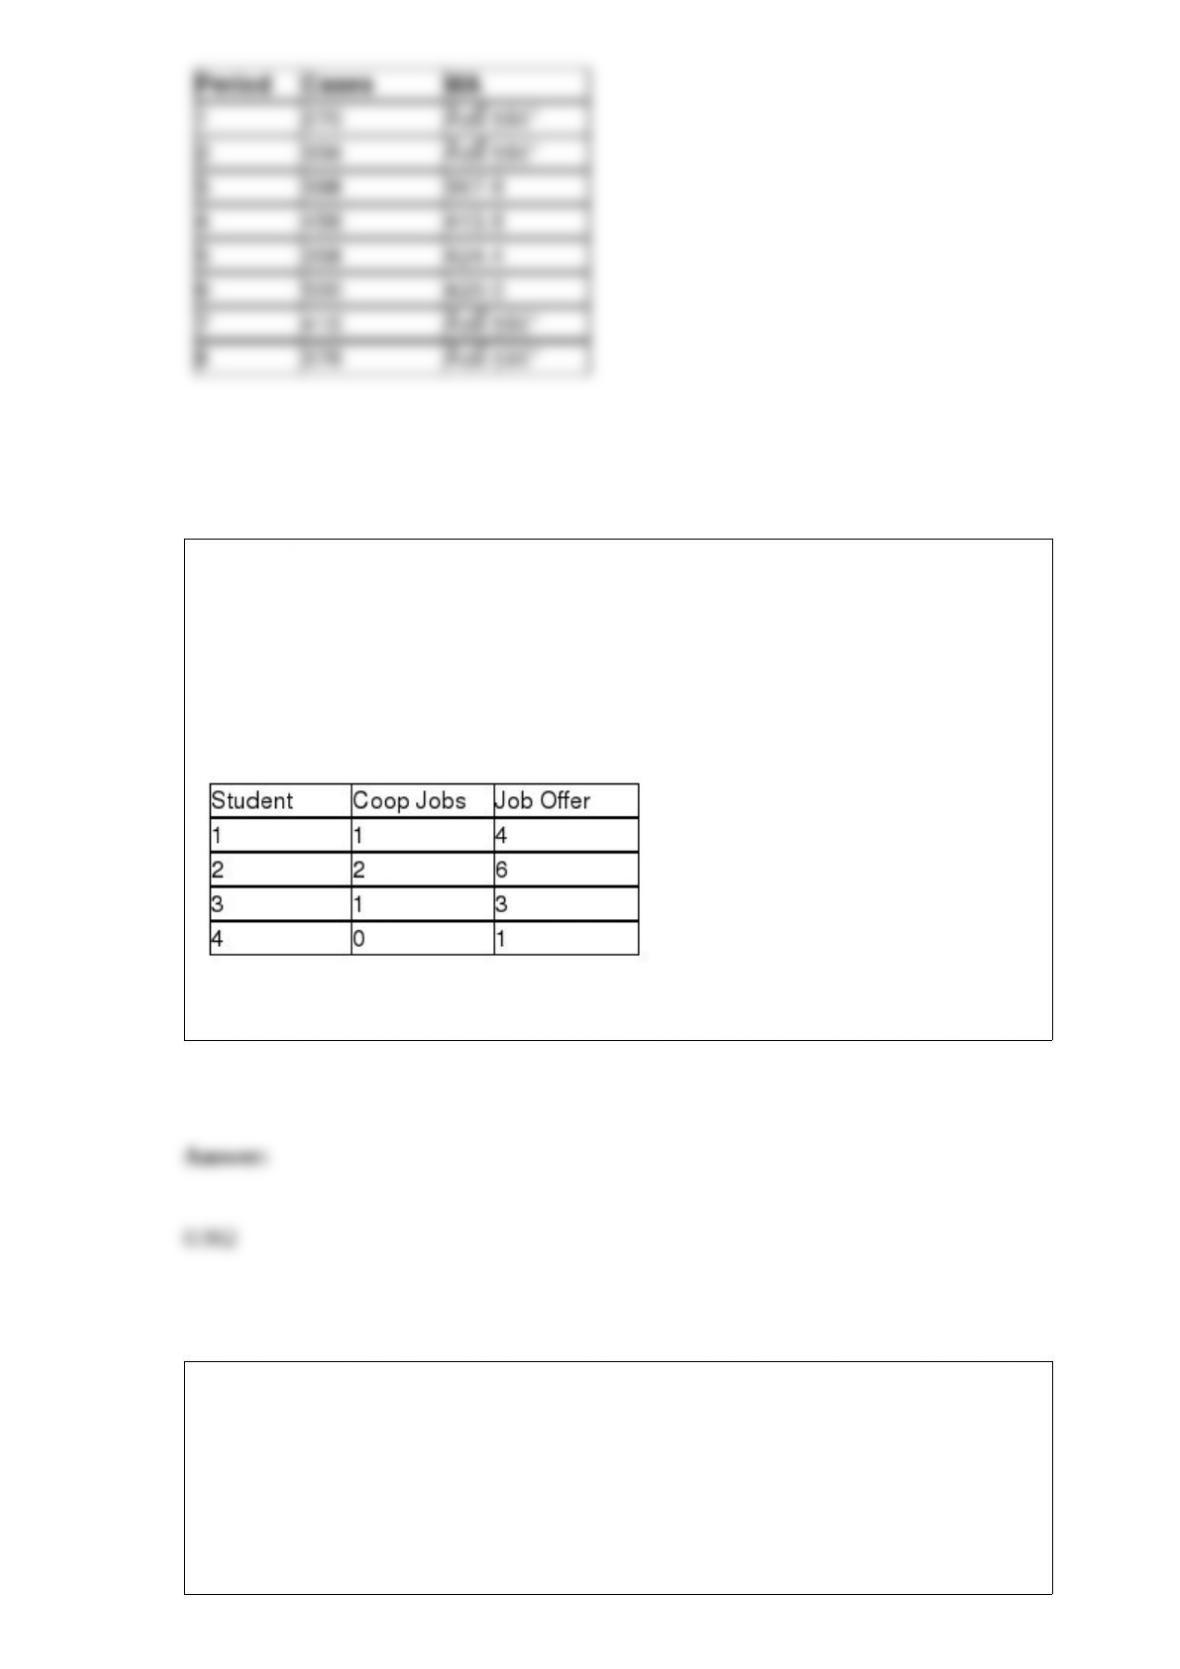
TABLE 13-3
The director of cooperative education at a state college wants to examine the effect of
cooperative education job experience on marketability in the work place. She takes a
random sample of 4 students. For these 4, she finds out how many times each had a
cooperative education job and how many job offers they received upon graduation.
These data are presented in the table below.
Referring to Table 13-3, the coefficient of determination is ________.
TABLE 15-5
What are the factors that determine the acceleration time (in sec.) from 0 to 60 miles per
hour of a car? Data on the following variables for 171 different vehicle models were
collected:
Accel Time: Acceleration time in sec.
Cargo Vol: Cargo volume in cu. ft.
HP: Horsepower
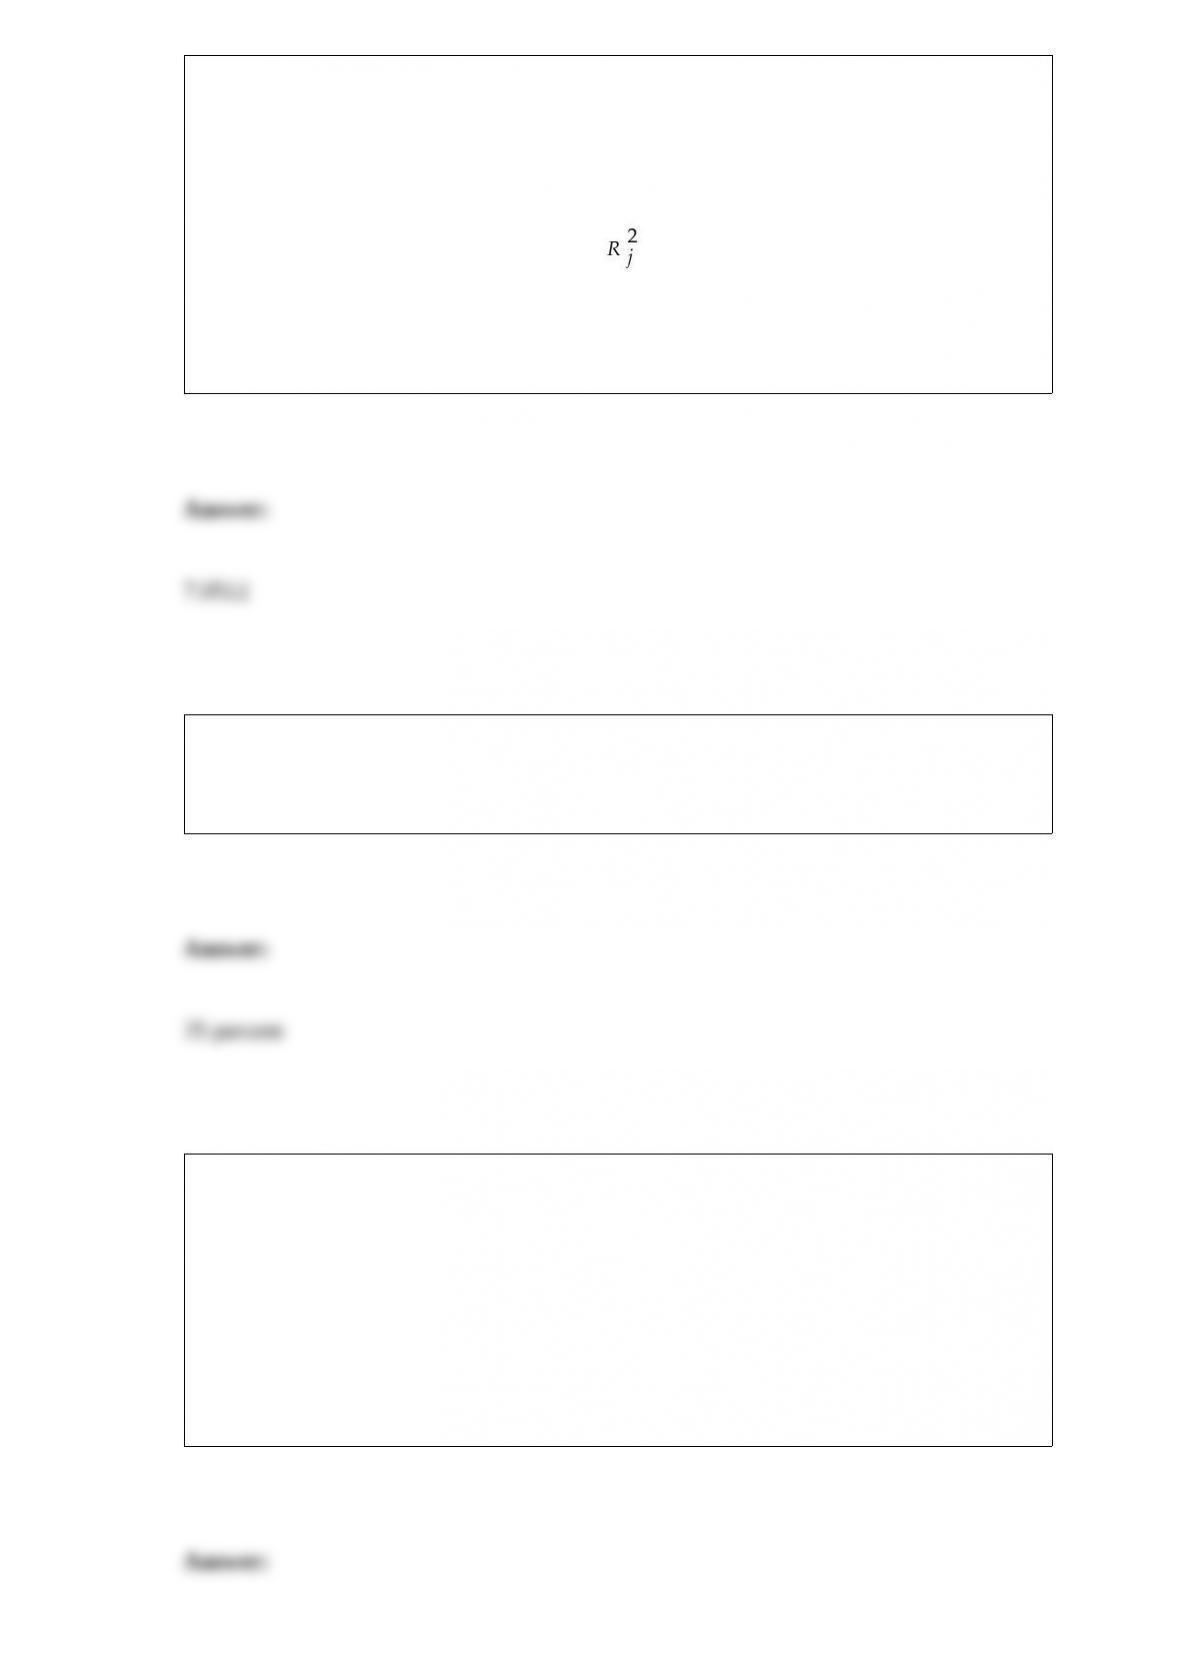
MPG: Miles per gallon
SUV: 1 if the vehicle model is an SUV with Coupe as the base when SUV and Sedan
are both 0
Sedan: 1 if the vehicle model is a sedan with Coupe as the base when SUV and Sedan
are both 0
The coefficient of multiple determination ( ) for the regression model using each of
the 5 variables Xj as the dependent variable and all other X variables as independent
variables are, respectively, 0.7461, 0.5676, 0.6764, 0.8582, 0.6632.
Referring to Table 15-5, what is the value of the variance inflationary factor of SUV?
You were told that the 1st, 2nd and 3rd quartiles of female students’ weight at a major
university are 95 lbs, 125 lbs, and 138 lbs. What percentage of the students weigh more
than 138 lbs?
TABLE 4-8
According to the record of the registrar’s office at a state university, 35% of the students
are freshman, 25% are sophomore, 16% are junior and the rest are senior. Among the
freshmen, sophomores, juniors and seniors, the portion of students who live in the
dormitory are, respectively, 80%, 60%, 30% and 20%.
Referring to Table 4-8, what is the probability that a randomly selected student is a
junior who does not live in a dormitory?
You were told that the amount of time lapsed between consecutive trades on the New
York Stock Exchange followed a normal distribution with a mean of 15 seconds. You
were also told that the probability that the time lapsed between two consecutive trades
to fall between 16 to 17 seconds was 13%. The probability that the time lapsed between
two consecutive trades would fall below 13 seconds was 7%. The probability is 80%
that the time lapsed will be longer than how many seconds?
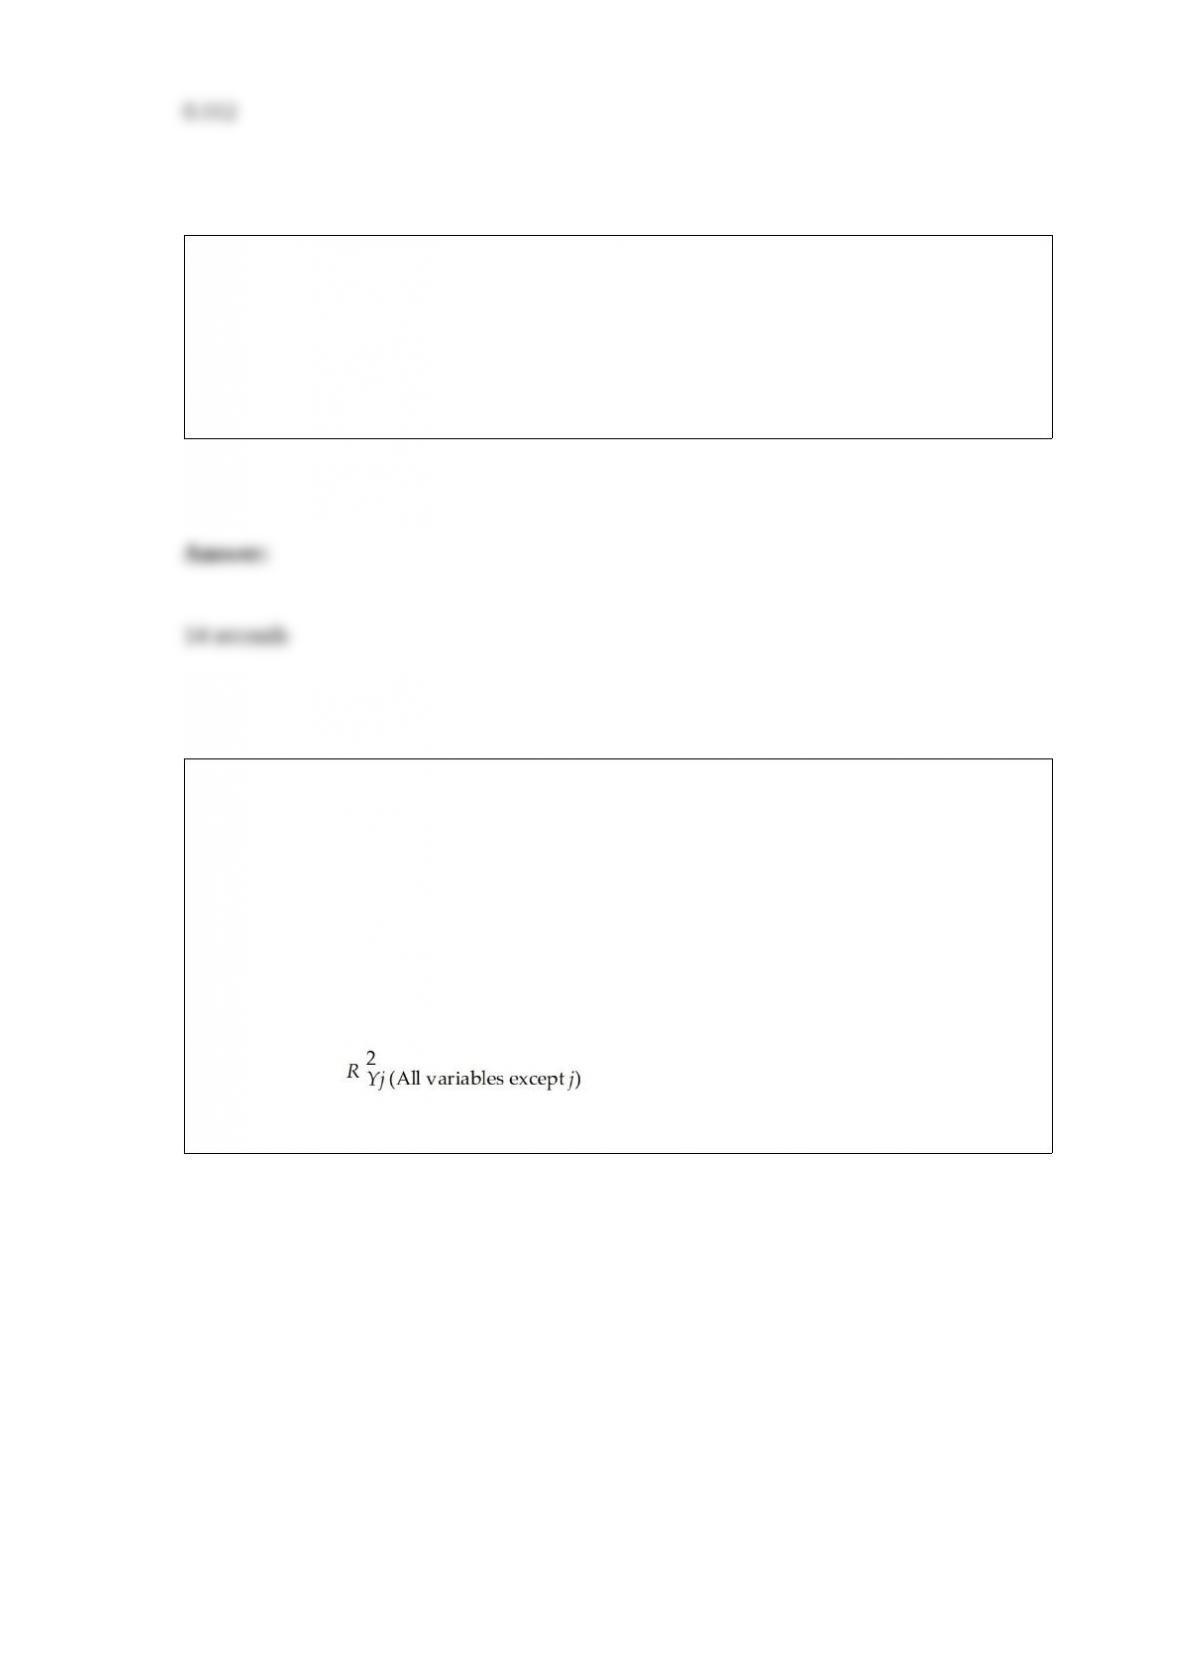
TABLE 17-10
Given below are results from the regression analysis where the dependent variable is
the number of weeks a worker is unemployed due to a layoff (Unemploy) and the
independent variables are the age of the worker (Age), the number of years of education
received (Edu), the number of years at the previous job (Job Yr), a dummy variable for
marital status (Married: 1 = married, 0 = otherwise), a dummy variable for head of
household (Head: 1 = yes, 0 = no) and a dummy variable for management position
(Manager: 1 = yes, 0 = no). We shall call this Model 1. The coefficient of partial
determination ( ) of each of the 6 predictors are, respectively,
0.2807, 0.0386, 0.0317, 0.0141, 0.0958, and 0.1201.
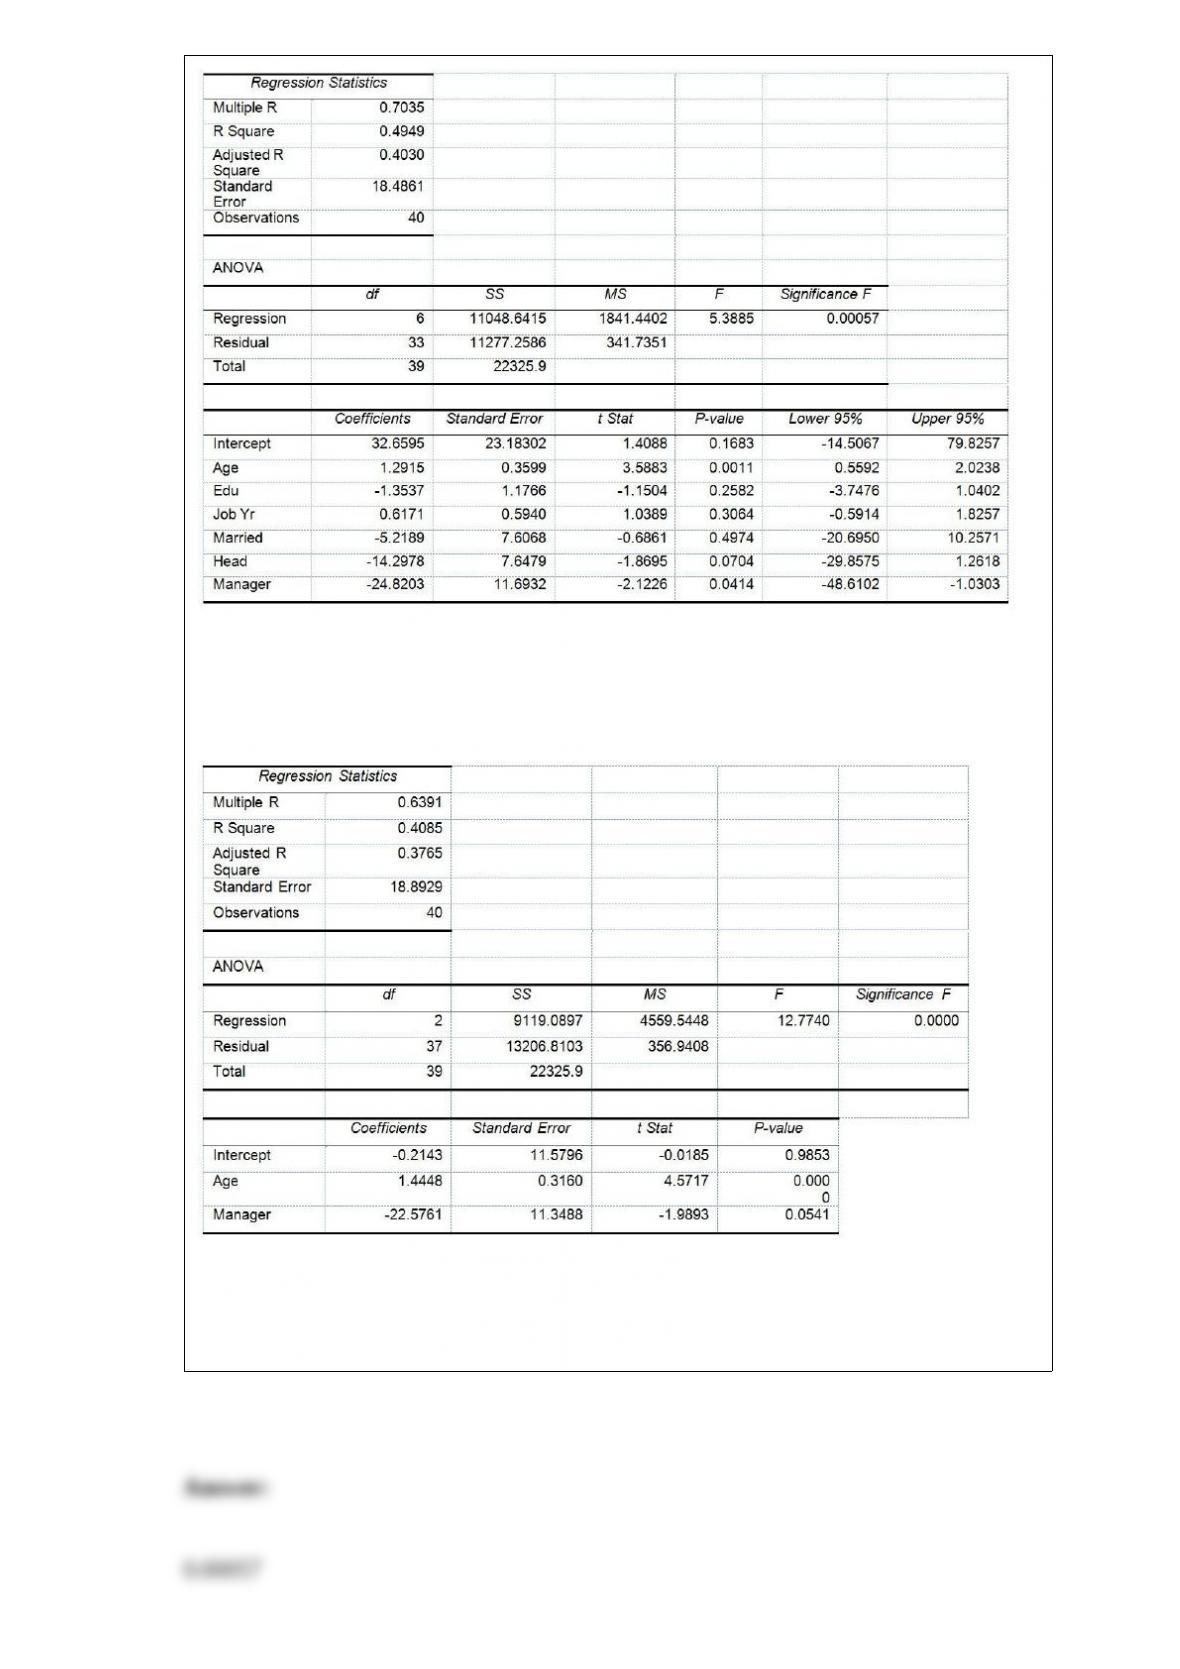
Model 2 is the regression analysis where the dependent variable is Unemploy and the
independent variables are Age and Manager. The results of the regression analysis are
given below:
Referring to Table 17-10, Model 1, what is the p-value of the test statistic to determine
whether there is a significant relationship between the number of weeks a worker is
unemployed due to a layoff and the entire set of explanatory variables?

TABLE 7-5
According to an article, 19% of the entire population in a developing country has
high-speed access to the Internet. Random sample sizes of 200 are selected from the
country’s population.
Referring to Table 7-5, the standard error of all the sample proportions is ________.