True or False: When dealing with human surveys, we are usually interested in sampling
with replacement.
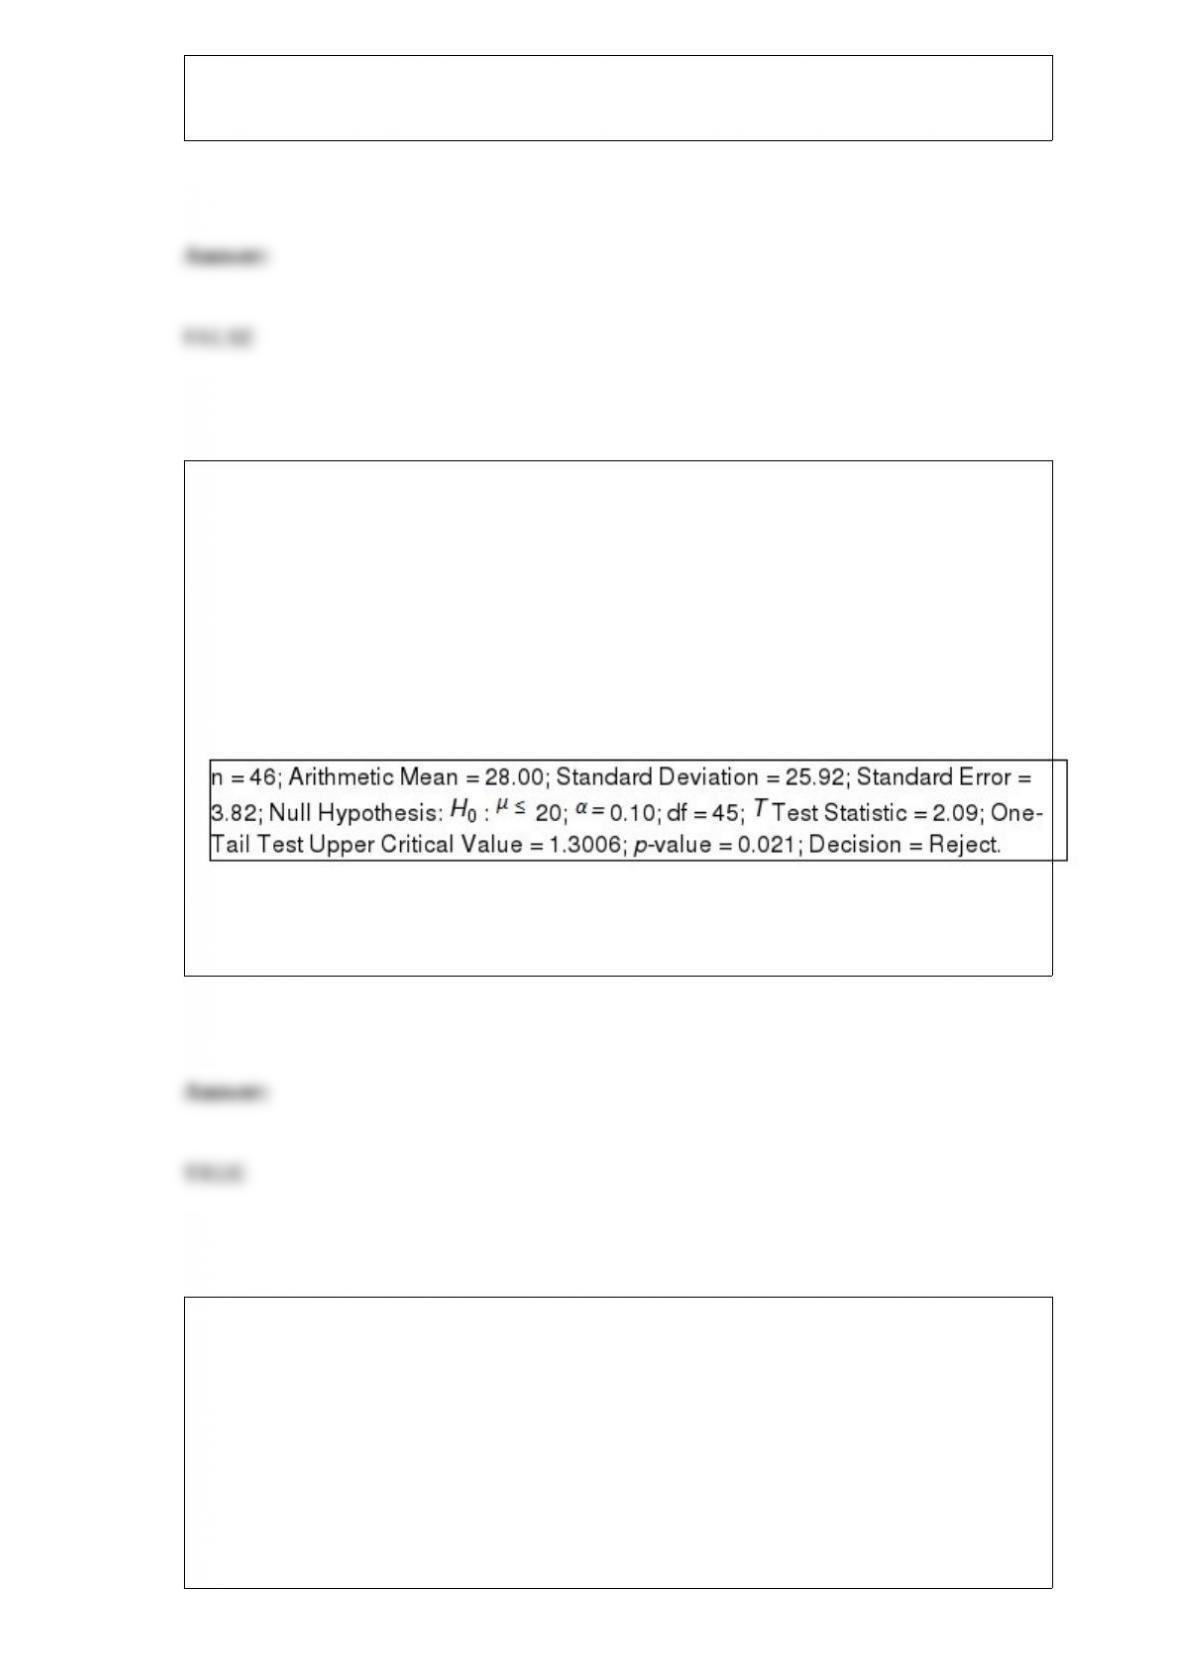
TABLE 9-1
Microsoft Excel was used on a set of data involving the number of defective items
found in a random sample of 46 cases of light bulbs produced during a morning shift at
a plant. A manager wants to know if the mean number of defective bulbs per case is
greater than 20 during the morning shift. She will make her decision using a test with a
level of significance of 0.10. The following information was extracted from the
Microsoft Excel output for the sample of 46 cases:
True or False: Referring to Table 9-1, if these data were used to perform a two-tail test,
the p-value would be 0.042.
TABLE 8-15
The president of a university is concerned that illicit drug use on campus is higher than
the 5% targeted level. A random sample of 250 students from a population of 2,000
revealed that 7 of them had used illicit drugs during the last 12 months.
True or False: Referring to Table 8-15, using the 90% one-sided confidence interval, the
president can be 85% confident that no more than 5% of the students at the university
had used illicit drugs during the last 12 months.

TABLE 9-6
The quality control engineer for a furniture manufacturer is interested in the mean
amount of force necessary to produce cracks in stressed oak furniture. She performs a
two-tail test of the null hypothesis that the mean for the stressed oak furniture is 650.
The calculated value of the Z test statistic is a positive number that leads to a p-value of
0.080 for the test.
True or False: Referring to Table 9-6, if the test is performed with a level of
significance of 0.10, the null hypothesis would be rejected.
True or False: In testing the difference between two proportions using the normal
distribution, we may use either a one-tail Chi-square test or two-tail Z test.

True or False: In instances in which there is insufficient evidence to reject the null
hypothesis, you must make it clear that this does not prove that the null hypothesis is
true.
True or False: The Guidelines for Developing Visualizations recommend using varying
scale to conserve precious space whenever possible.
TABLE 13-12
The manager of the purchasing department of a large saving and loan organization
would like to develop a model to predict the amount of time (measured in hours) it
takes to record a loan application. Data are collected from a sample of 30 days, and the
number of applications recorded and completion time in hours is recorded. Below is the
regression output:
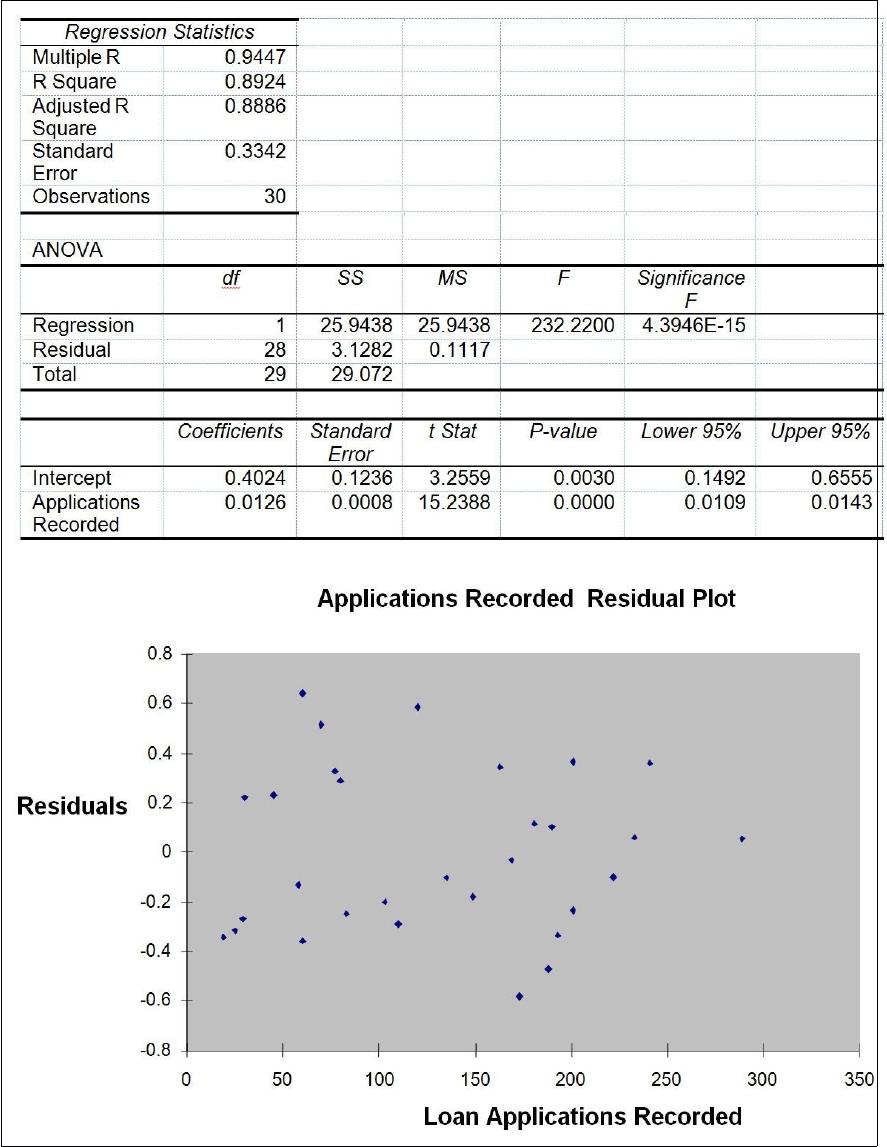
True or False: Referring to Table 13-12, there is sufficient evidence that the amount of
time needed linearly depends on the number of loan applications at a 5% level of
significance.
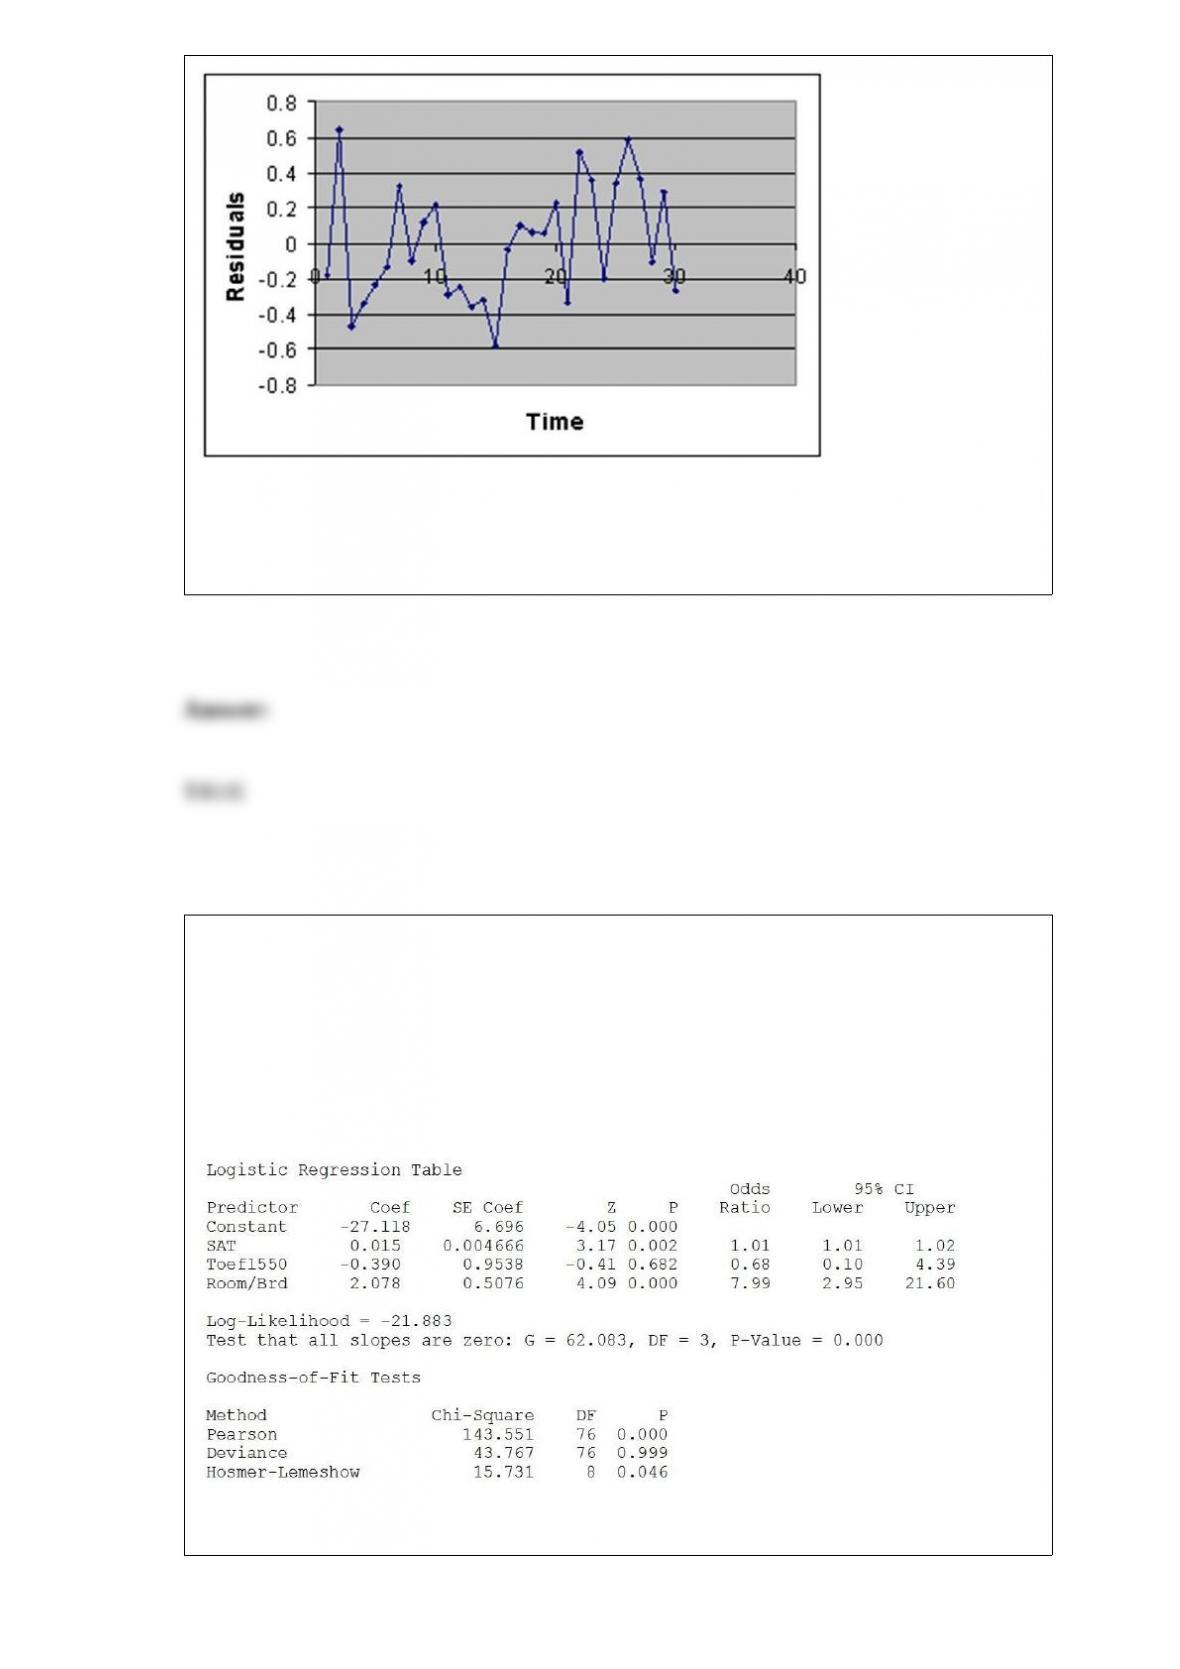
True or False: TABLE 17-11
A logistic regression model was estimated in order to predict the probability that a
randomly chosen university or college would be a private university using information
on mean total Scholastic Aptitude Test score (SAT) at the university or college, the
room and board expense measured in thousands of dollars (Room/Brd), and whether the
TOEFL criterion is at least 550 (Toefl550 = 1 if yes, 0 otherwise.) The dependent
variable, Y, is school type (Type = 1 if private and 0 otherwise).
Referring to Table 17-11, there is not enough evidence to conclude that the model is not
a good-fitting model at a 0.05 level of significance.
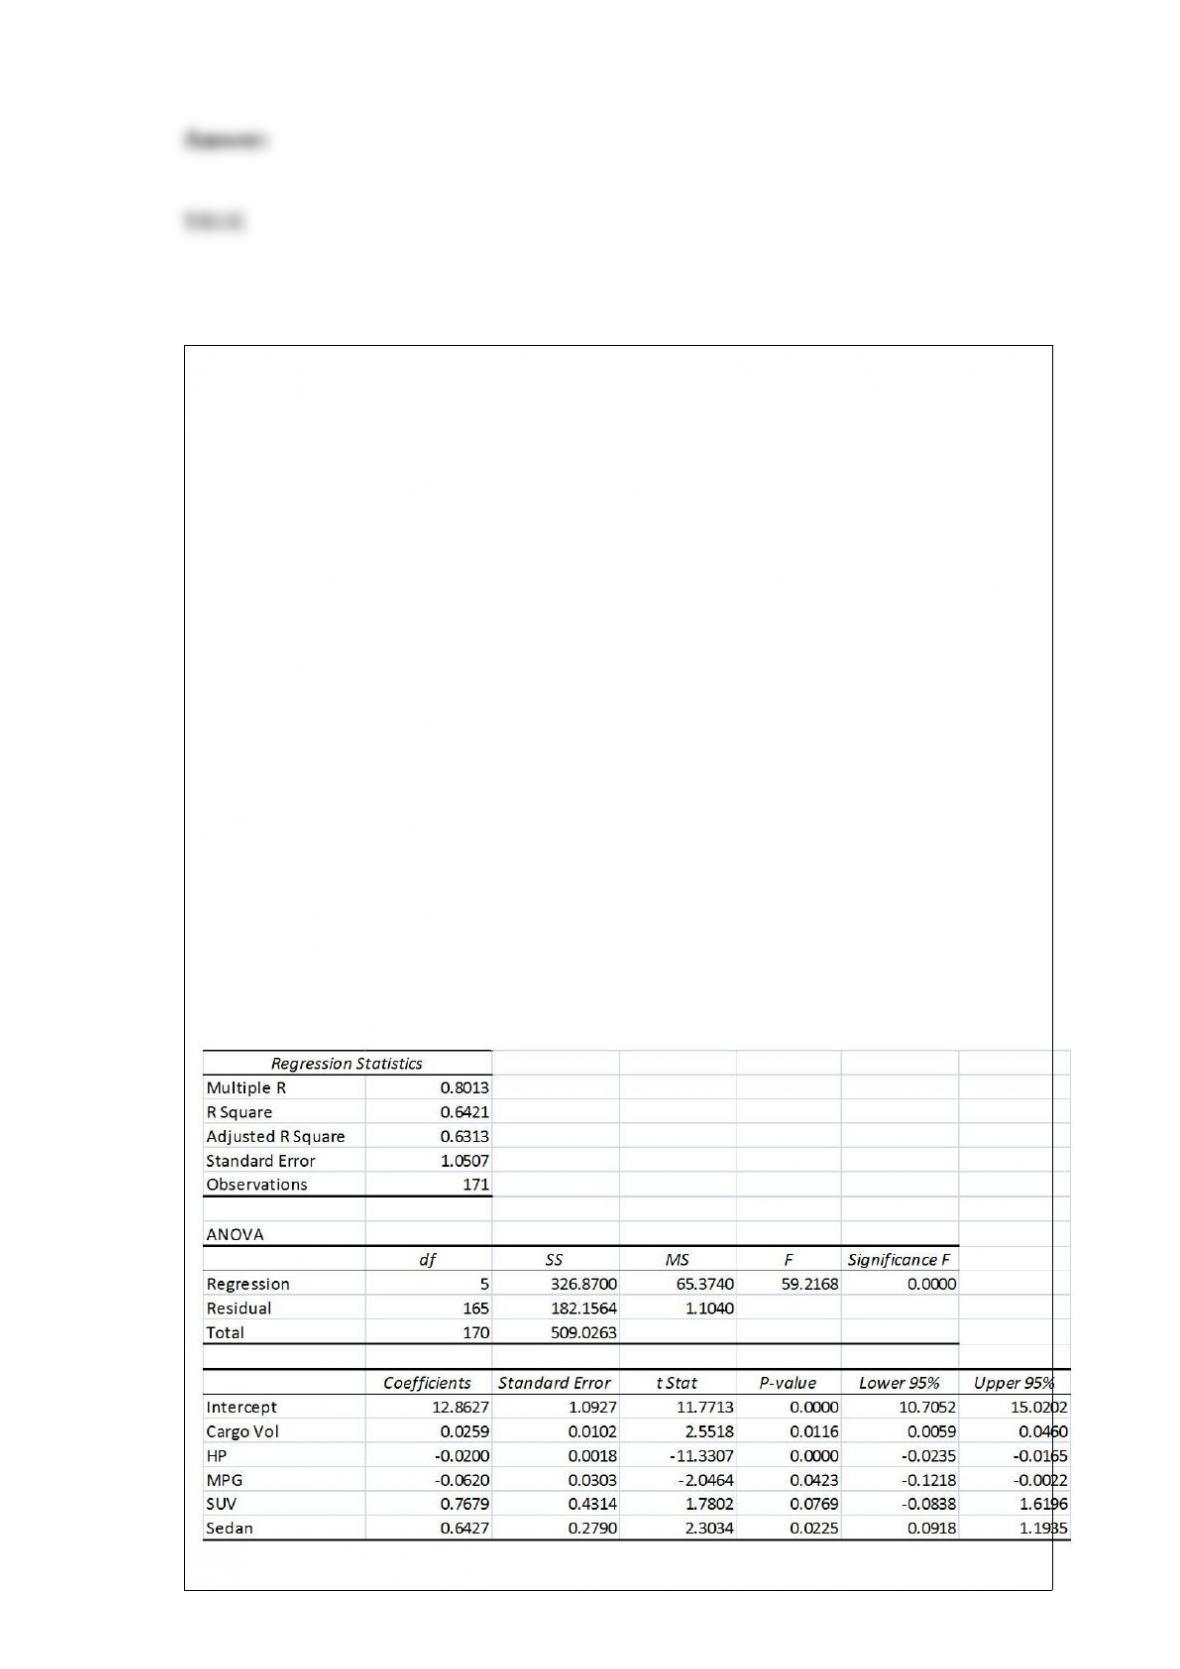
True or False: TABLE 17-9
What are the factors that determine the acceleration time (in sec.) from 0 to 60 miles per
hour of a car? Data on the following variables for 171 different vehicle models were
collected:
Accel Time: Acceleration time in sec.
Cargo Vol: Cargo volume in cu. ft.
HP: Horsepower
MPG: Miles per gallon
SUV: 1 if the vehicle model is an SUV with Coupe as the base when SUV and Sedan
are both 0
Sedan: 1 if the vehicle model is a sedan with Coupe as the base when SUV and Sedan
are both 0
The regression results using acceleration time as the dependent variable and the
remaining variables as the independent variables are presented below.
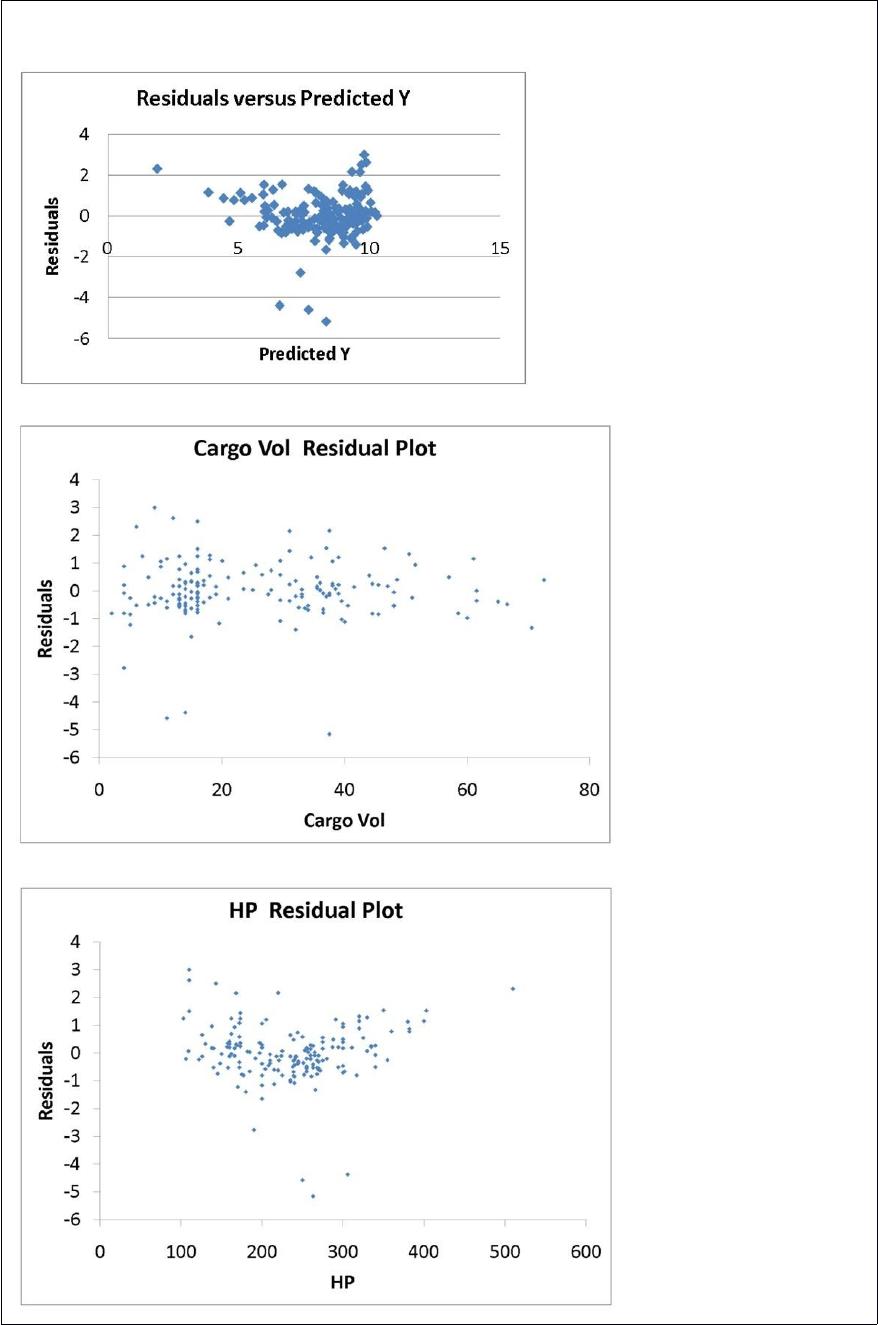
The various residual plots are as shown below.
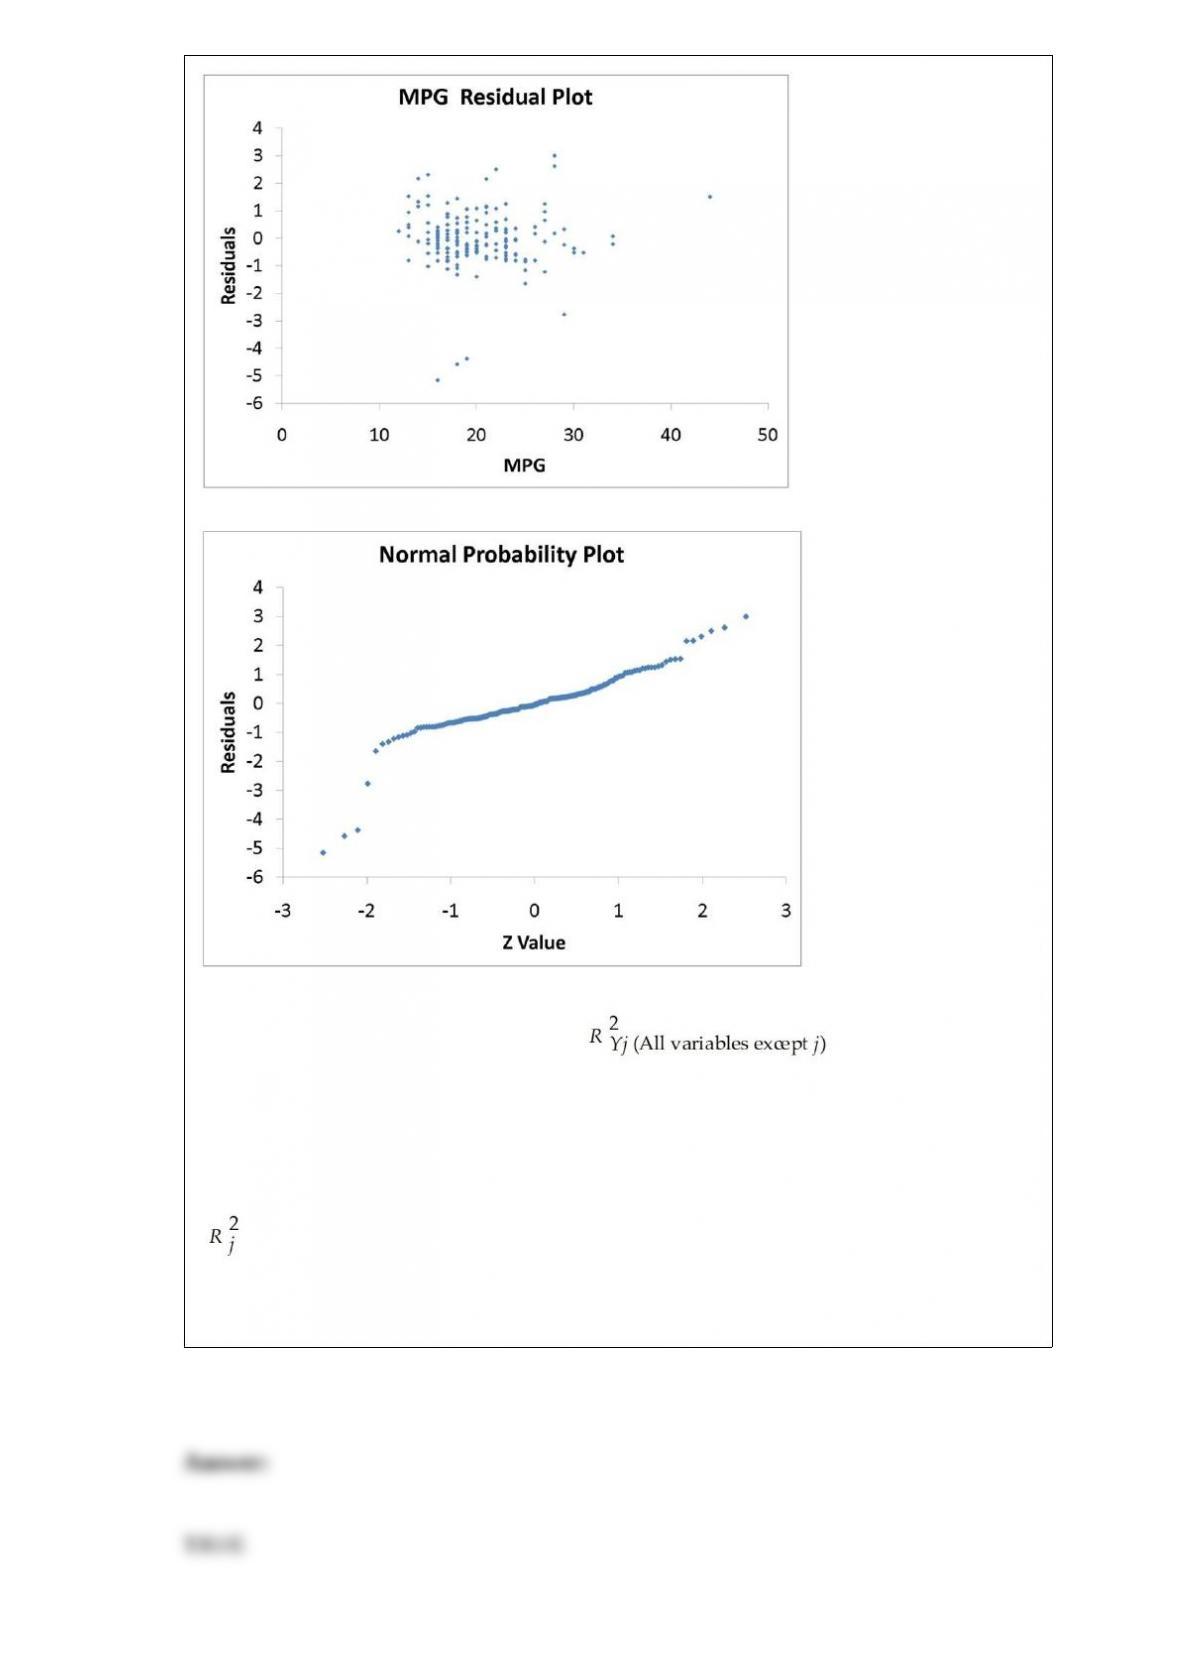
The coefficient of partial determination ( ) of each of the 5
predictors are, respectively, 0.0380, 0.4376, 0.0248, 0.0188, and 0.0312.
The coefficient of multiple determination for the regression model using each of the 5
variables Xj as the dependent variable and all other X variables as independent variables
( ) are, respectively, 0.7461, 0.5676, 0.6764, 0.8582, 0.6632.
Referring to Table 17-9, the error appears to be left-skewed.
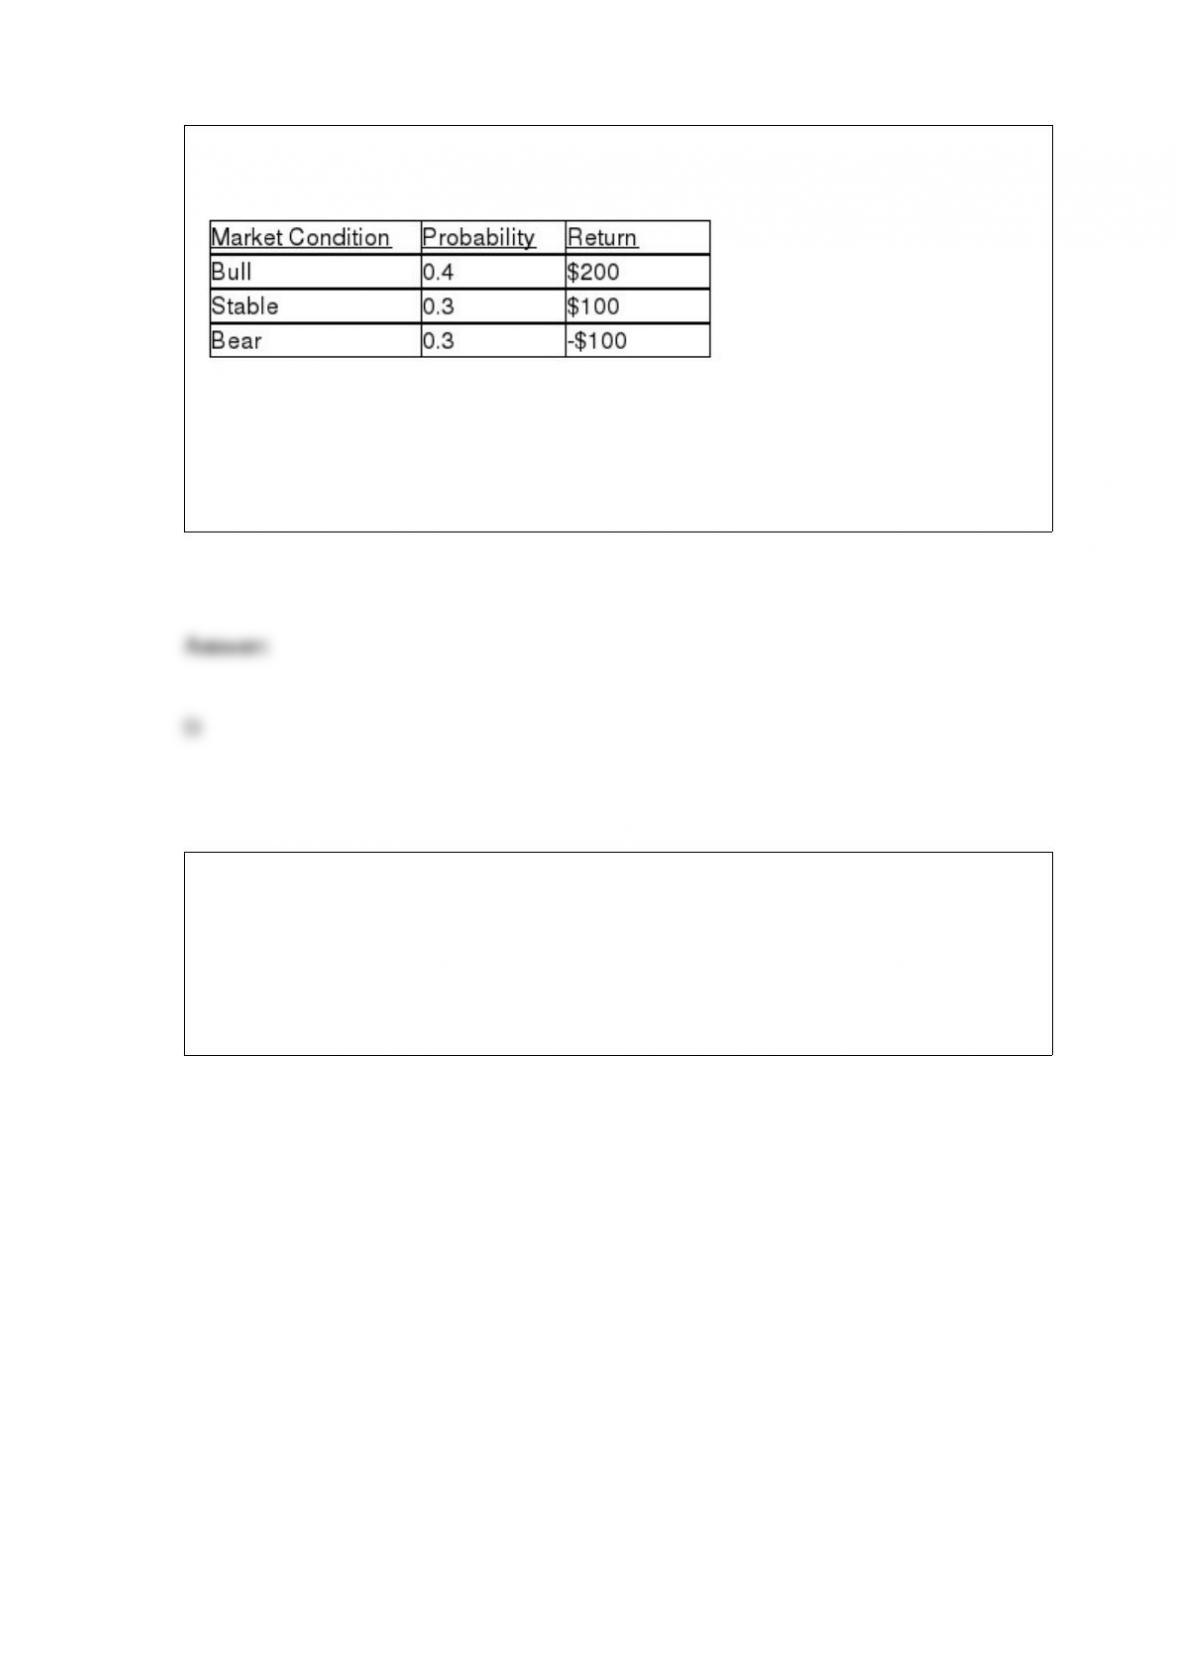
TABLE 19-4
A stock portfolio has the following returns under the market conditions listed below.
Referring to Table 19-4, what is the coefficient of variation?
A) 88.8%
B) 90.3%
C) 100%
D) 156.1%
TABLE 17-1
A real estate builder wishes to determine how house size (House) is influenced by
family income (Income), family size (Size), and education of the head of household
(School). House size is measured in hundreds of square feet, income is measured in
thousands of dollars, and education is in years. The builder randomly selected 50
families and ran the multiple regression. Microsoft Excel output is provided below:
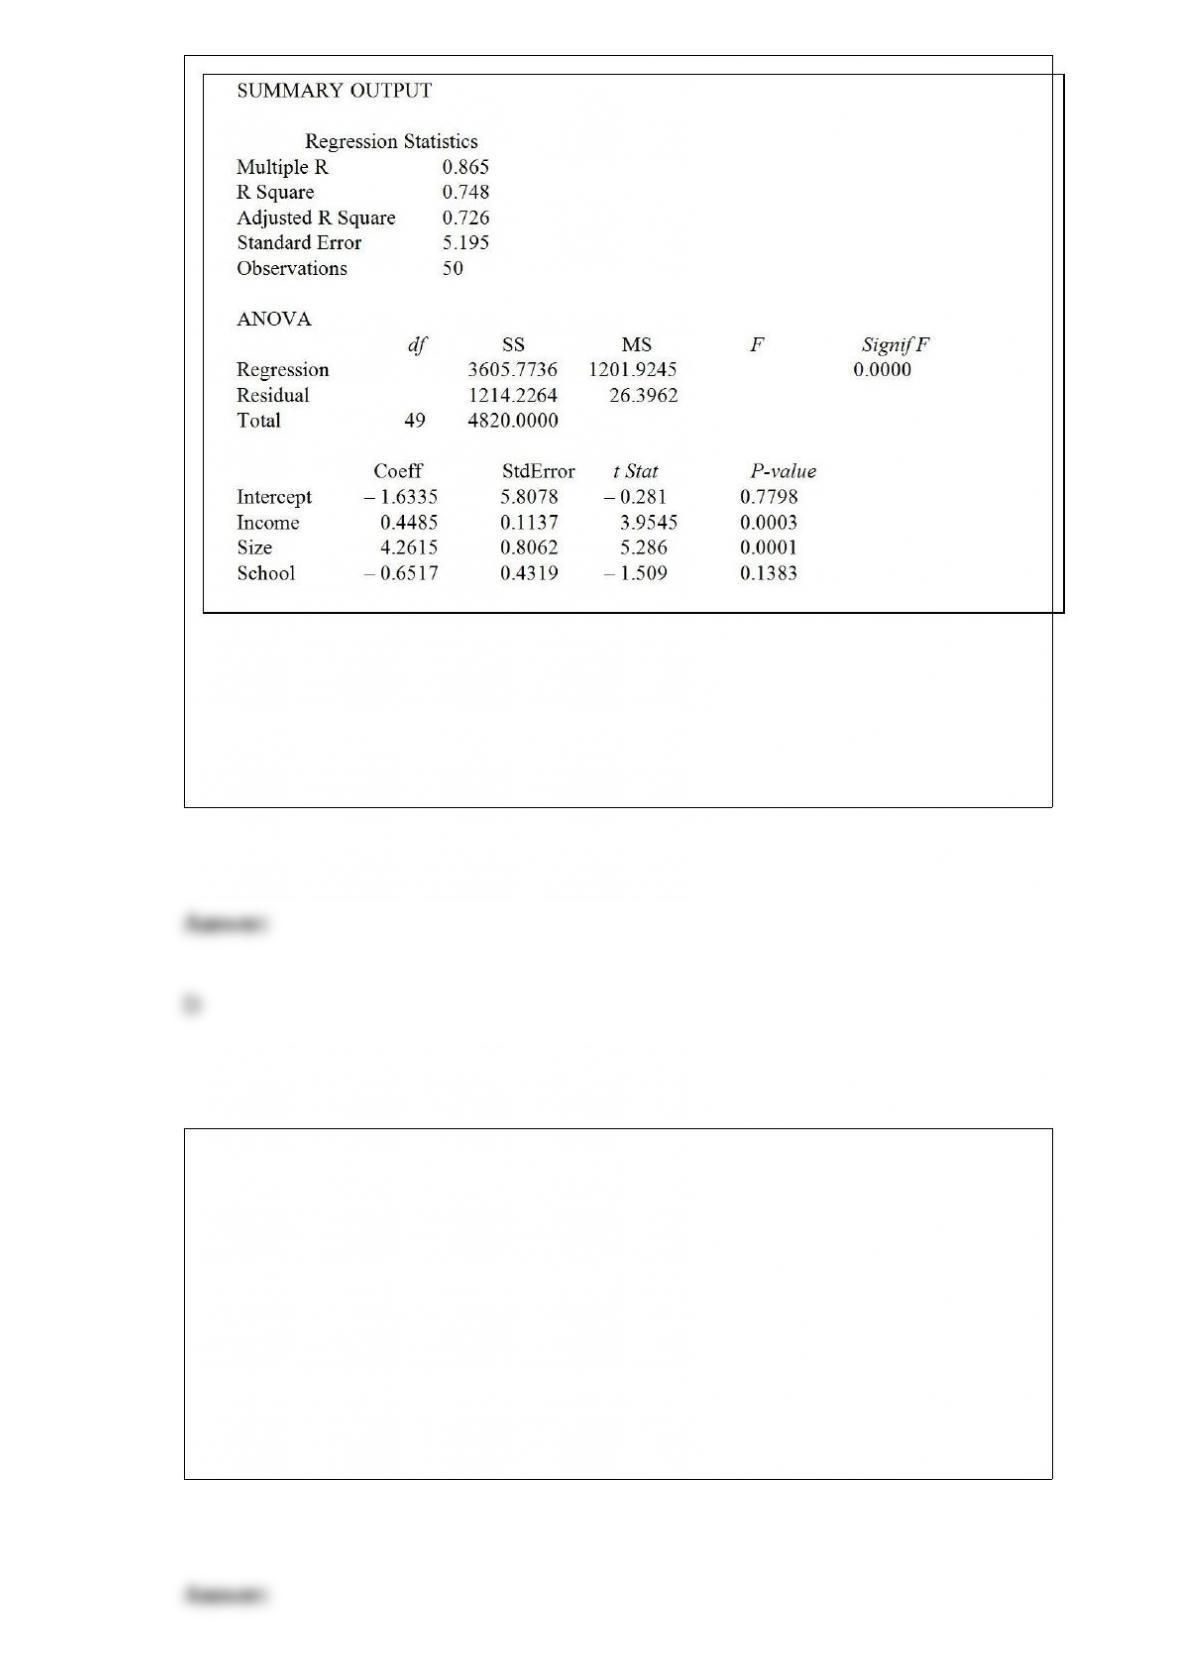
Referring to Table 17-1, which of the following values for the level of significance is
the smallest for which every explanatory variable is significant individually?
A) 0.01
B) 0.025
C) 0.05
D) 0.15
Suppose that past history shows that 60% of college students prefer Coca-Cola. A
sample of 10,000 students is to be selected. Which of the following distributions would
you use to figure out the probability that at least half of them will prefer Coca-Cola?
A) Exponential distribution
B) Poisson distribution
C) Normal distribution
D) Uniform distribution
The manager of the customer service division of a major consumer electronics company
is interested in determining whether the customers who have purchased a Blu-ray
player made by the company over the past 12 months are satisfied with their products.
Which of the following will be a good frame for drawing a sample?
A) telephone directory
B) voting registry
C) the list of customers who returned the registration card
D) a list of potential customers purchased from a database marketing company
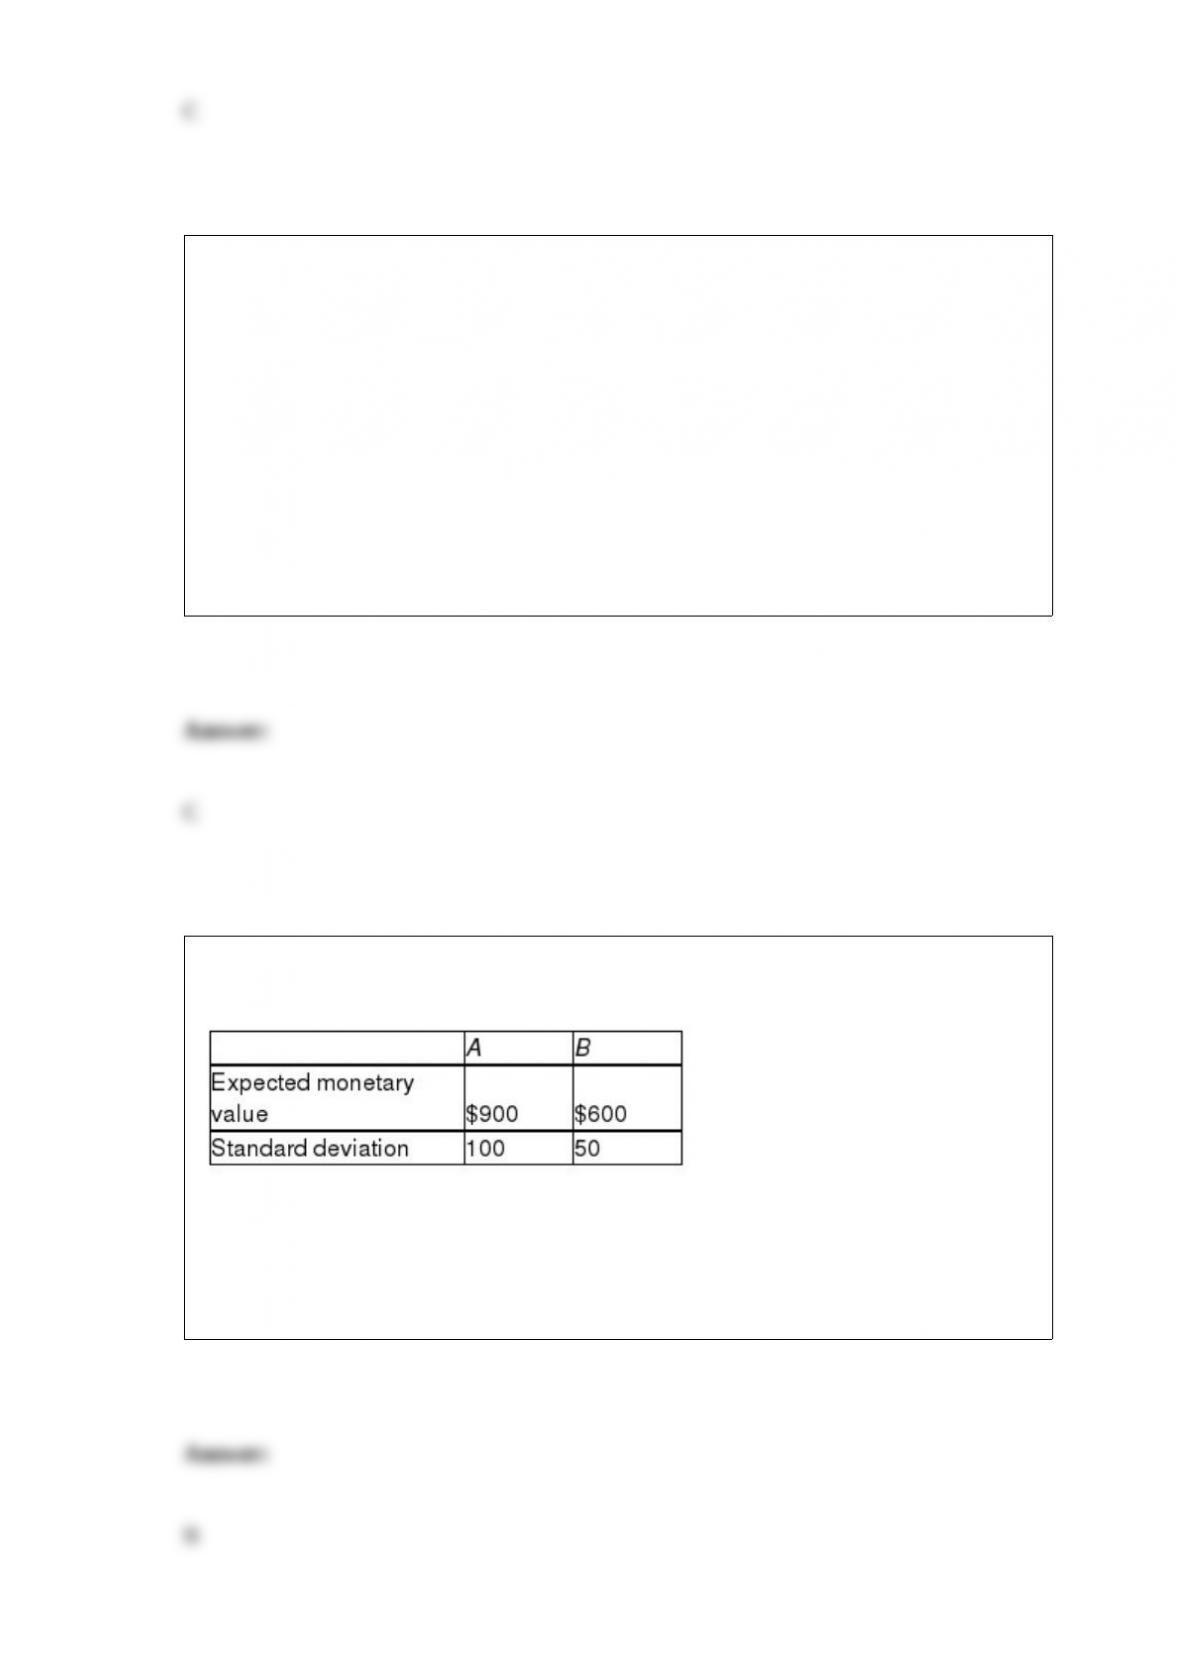
TABLE 19-3
The following information is from 2 investment opportunities.
Referring to Table 19-3, which investment has the optimal return to risk ratio?
A) Investment A
B) Investment B
C) The investments are equal.
D) It cannot be determined.

According to the Chebyshev rule, at least 93.75% of all observations in any data set are
contained within a distance of how many standard deviations around the mean?
A) 1
B) 2
C) 3
D) 4
If event A and event B cannot occur at the same time, then events A and B are said to be
A) mutually exclusive.
B) independent.
C) collectively exhaustive.
D) None of the above.
TABLE 15-3
A chemist employed by a pharmaceutical firm has developed a muscle relaxant. She
took a sample of 14 people suffering from extreme muscle constriction. She gave each a
vial containing a dose (X) of the drug and recorded the time to relief (Y) measured in
seconds for each. She fit a curvilinear model to this data. The results obtained by
Microsoft Excel follow
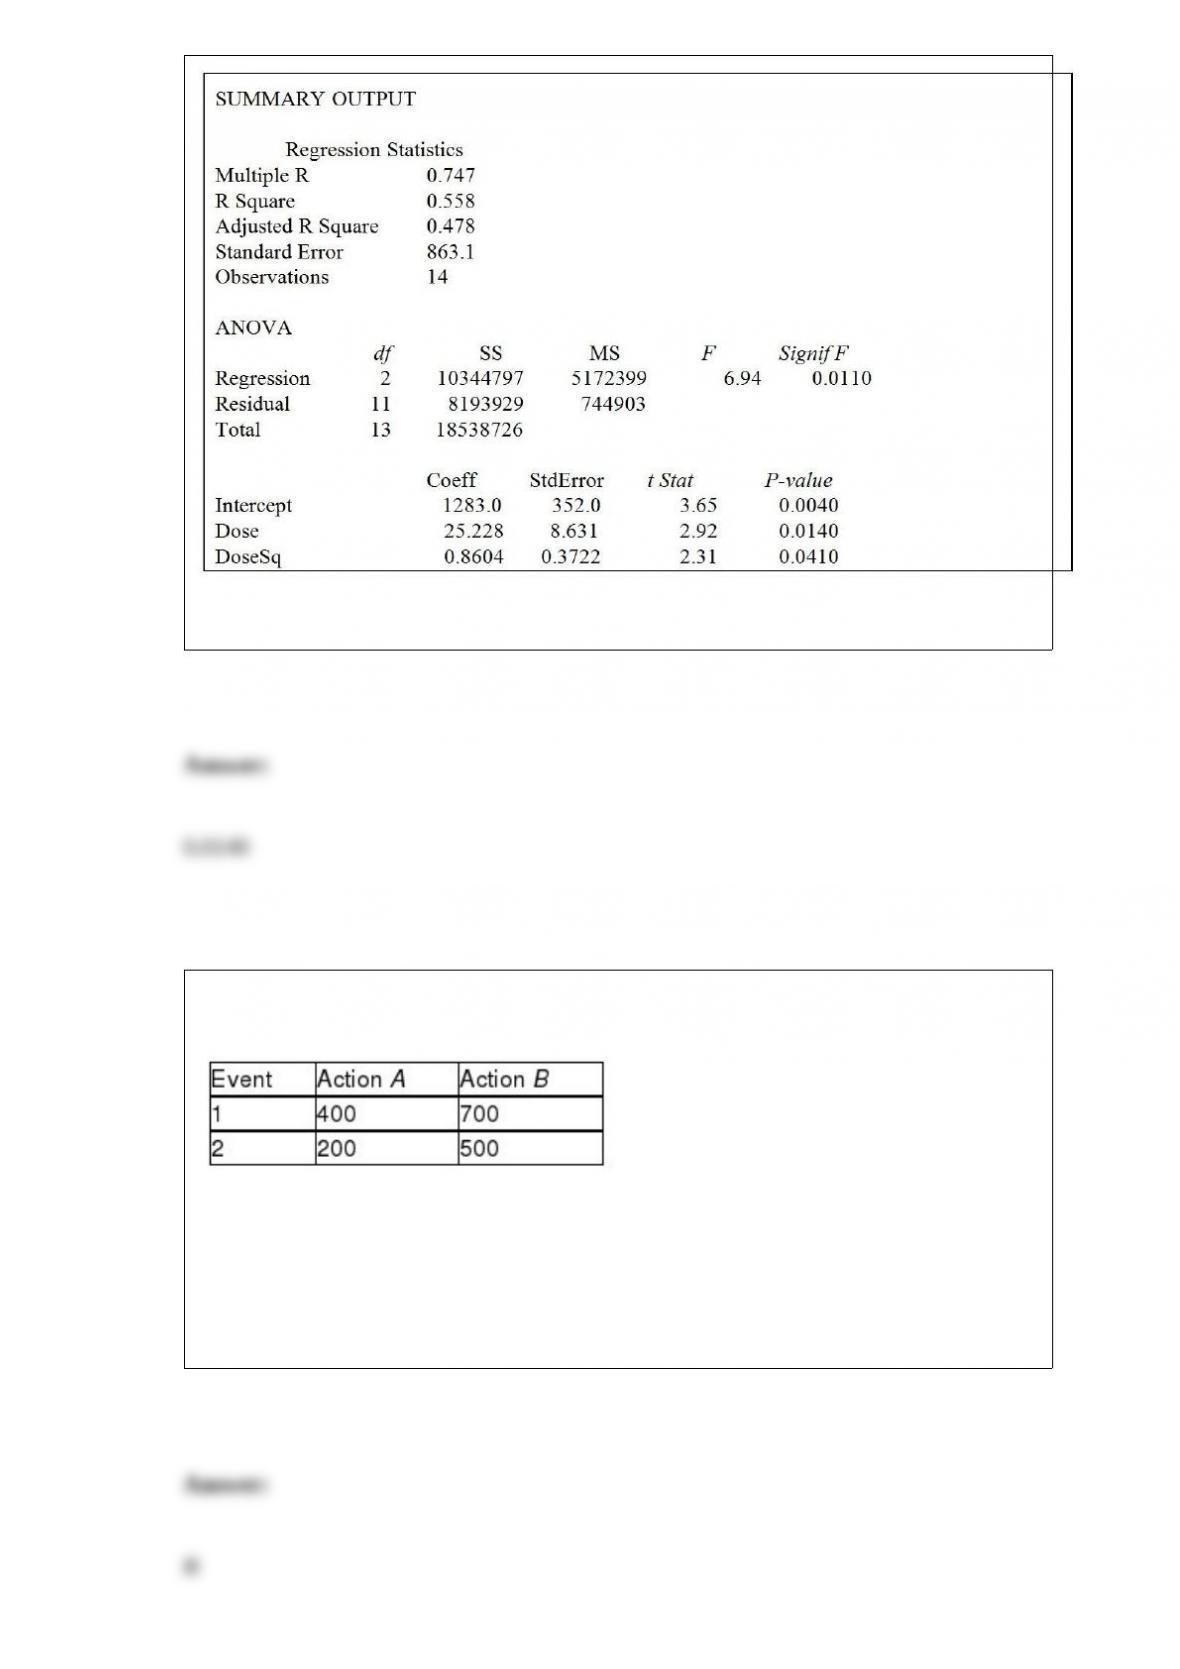
Referring to Table 15-3, suppose the chemist decides to use a t test to determine if the
linear term is significant. The p-value of the test is ________.
TABLE 19-2
The following payoff matrix is given in dollars.
Suppose the probability of Event 1 is 0.5 and Event 2 is 0.5.
Referring to Table 19-2, what is the optimal action using the EOL criterion?
A) Action A
B) Action B
C) Either Action A or Action B
D) It cannot be determined.

The closing price of a company’s stock tomorrow can be lower, higher or the same as
today’s closing price. Based on the closing price of the stock collected over the last
month, 25% of the days the closing price was higher than previous day’s closing price,
45% was lower than previous day’s and 30% was the same as previous day’s. Based on
this information, the probability that tomorrow’s closing price will be higher than
today’s is 25%. This is an example of using which of the following probability
approaches?
A) a priori probability
B) empirical probability
C) subjective probability
D) conditional probability
TABLE 9-2
A student claims that he can correctly identify whether a person is a business major or
an agriculture major by the way the person dresses. Suppose in actuality that if someone
is a business major, he can correctly identify that person as a business major 87% of the
time. When a person is an agriculture major, the student will incorrectly identify that
person as a business major 16% of the time. Presented with one person and asked to
identify the major of this person (who is either a business or an agriculture major), he
considers this to be a hypothesis test with the null hypothesis being that the person is a
business major and the alternative that the person is an agriculture major.
Referring to Table 9-2, what is the “actual level of significance” of the test?
A) 0.13
B) 0.16
C) 0.84
D) 0.87
Which of the following is not part of the Shewhart-Deming cycle?
A) Plan
B) Do
C) React
D) Act
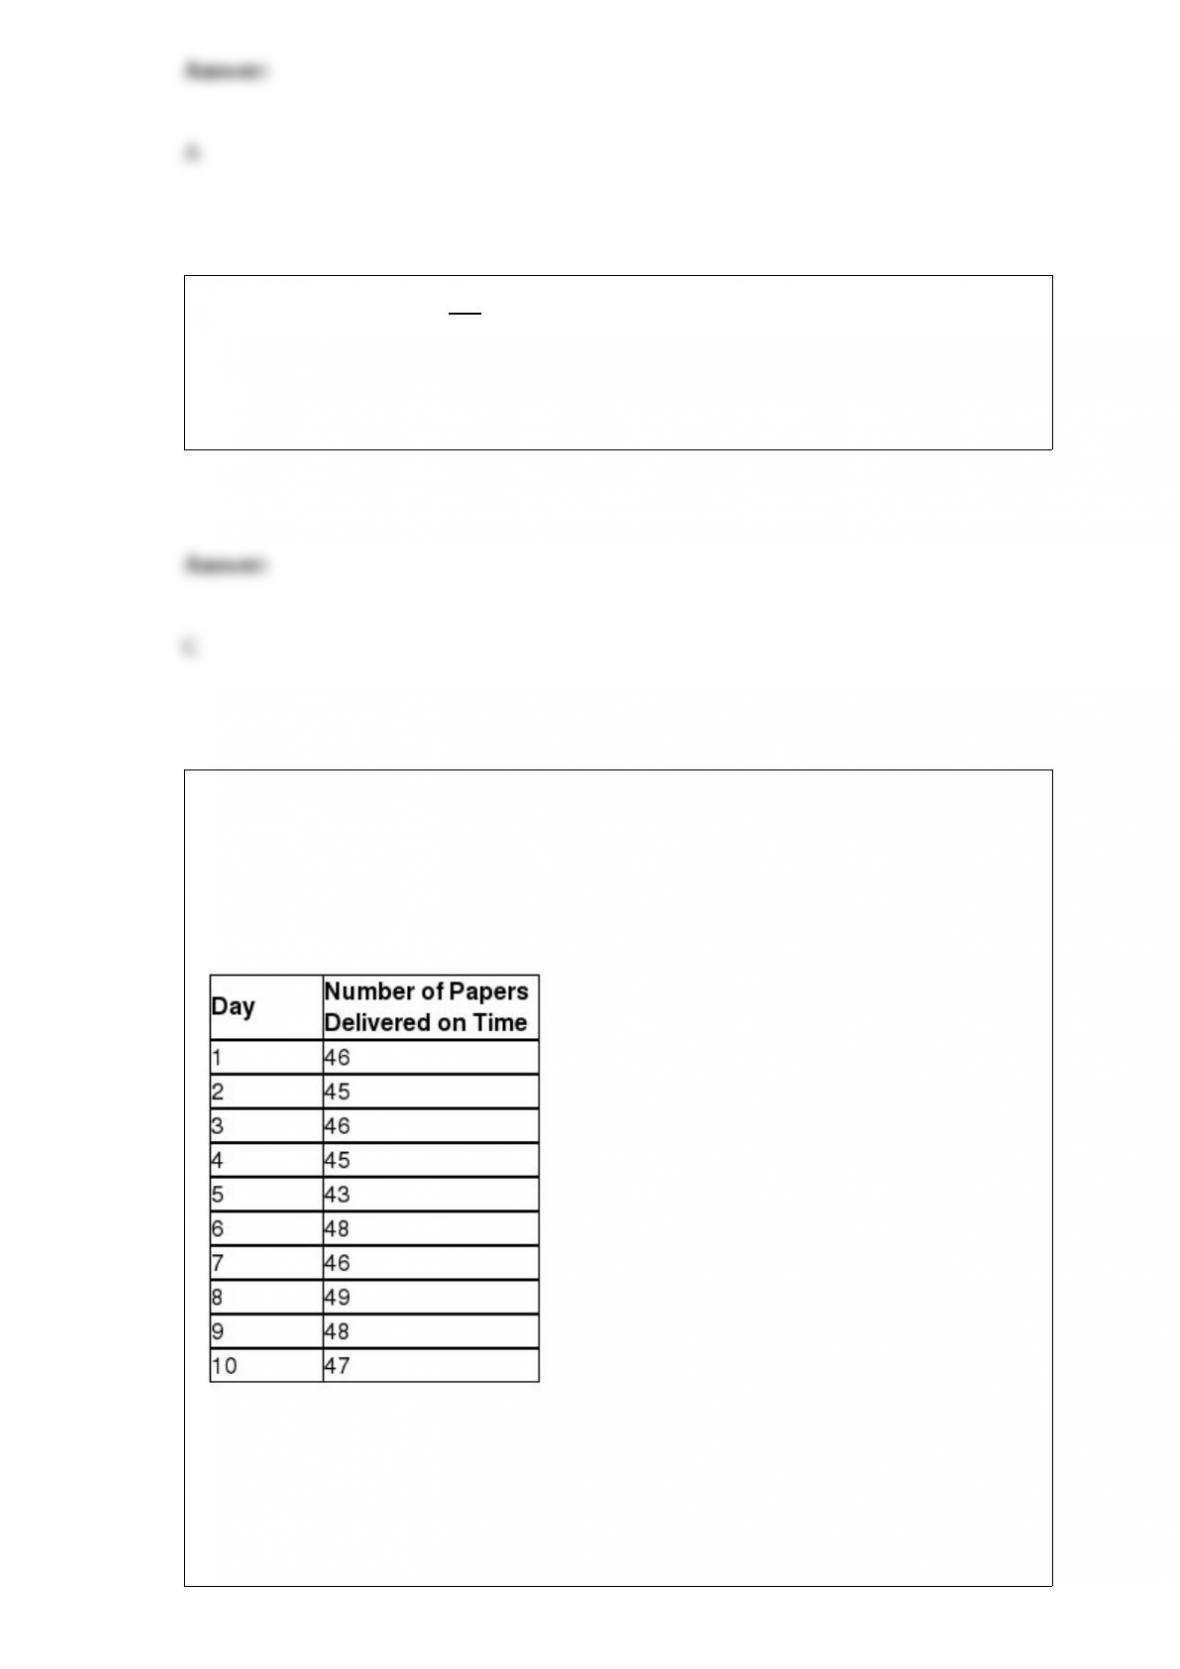
TABLE 18-1
A local newspaper has 10 delivery boys who each deliver the morning paper to 50
customers every day. The owner decides to record the number of papers delivered on
time for a 10-day period for one of the delivery boys and construct a p chart to see
whether the percentage is too erratic.
Referring to Table 18-1, what is the numerical value of the upper control limit for the p
chart?
A) 0.926
B) 0.961
C) 0.979
D) 1.037
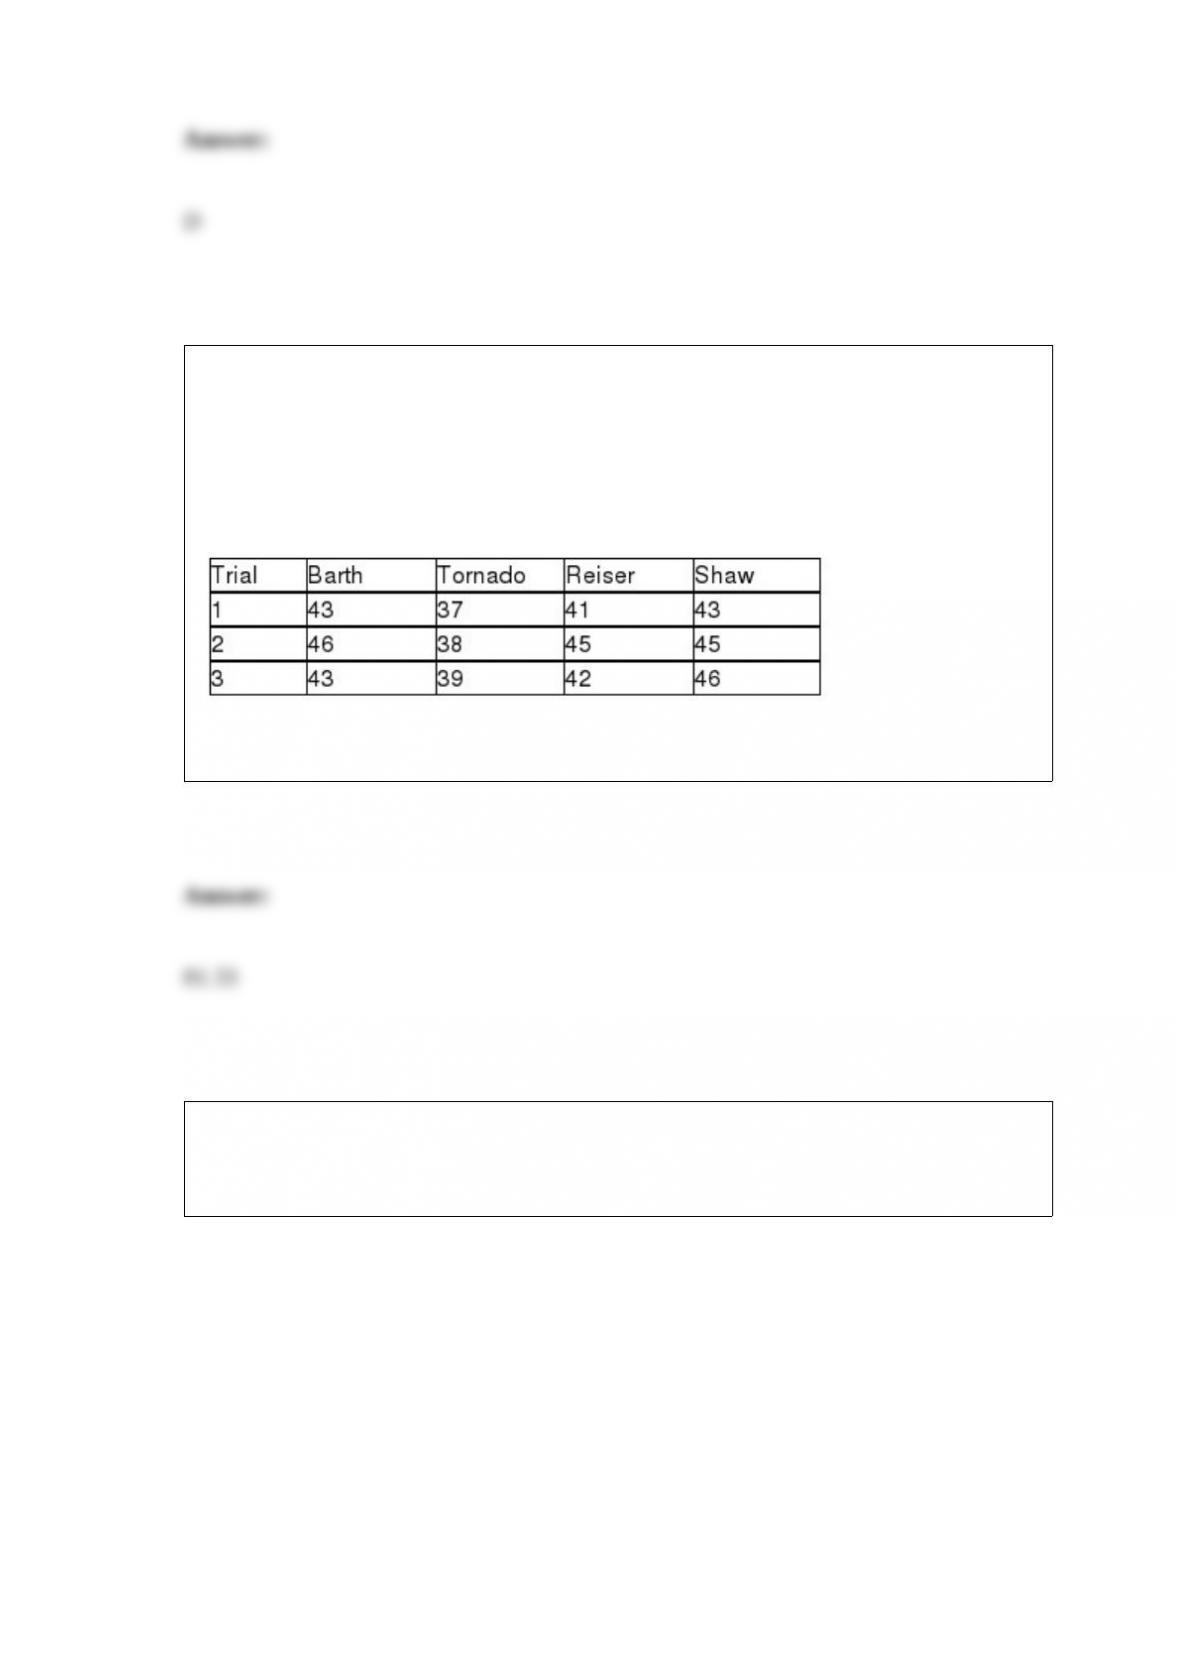
TABLE 11-3
As part of an evaluation program, a sporting goods retailer wanted to compare the
downhill coasting speeds of 4 brands of bicycles. She took 3 of each brand and
determined their maximum downhill speeds. The results are presented in miles per hour
in the table below.
Referring to Table 11-3, the among group variation or SSA is ________.
TABLE 16-13
Given below is the monthly time-series data for U.S. retail sales of building materials
over a specific year.
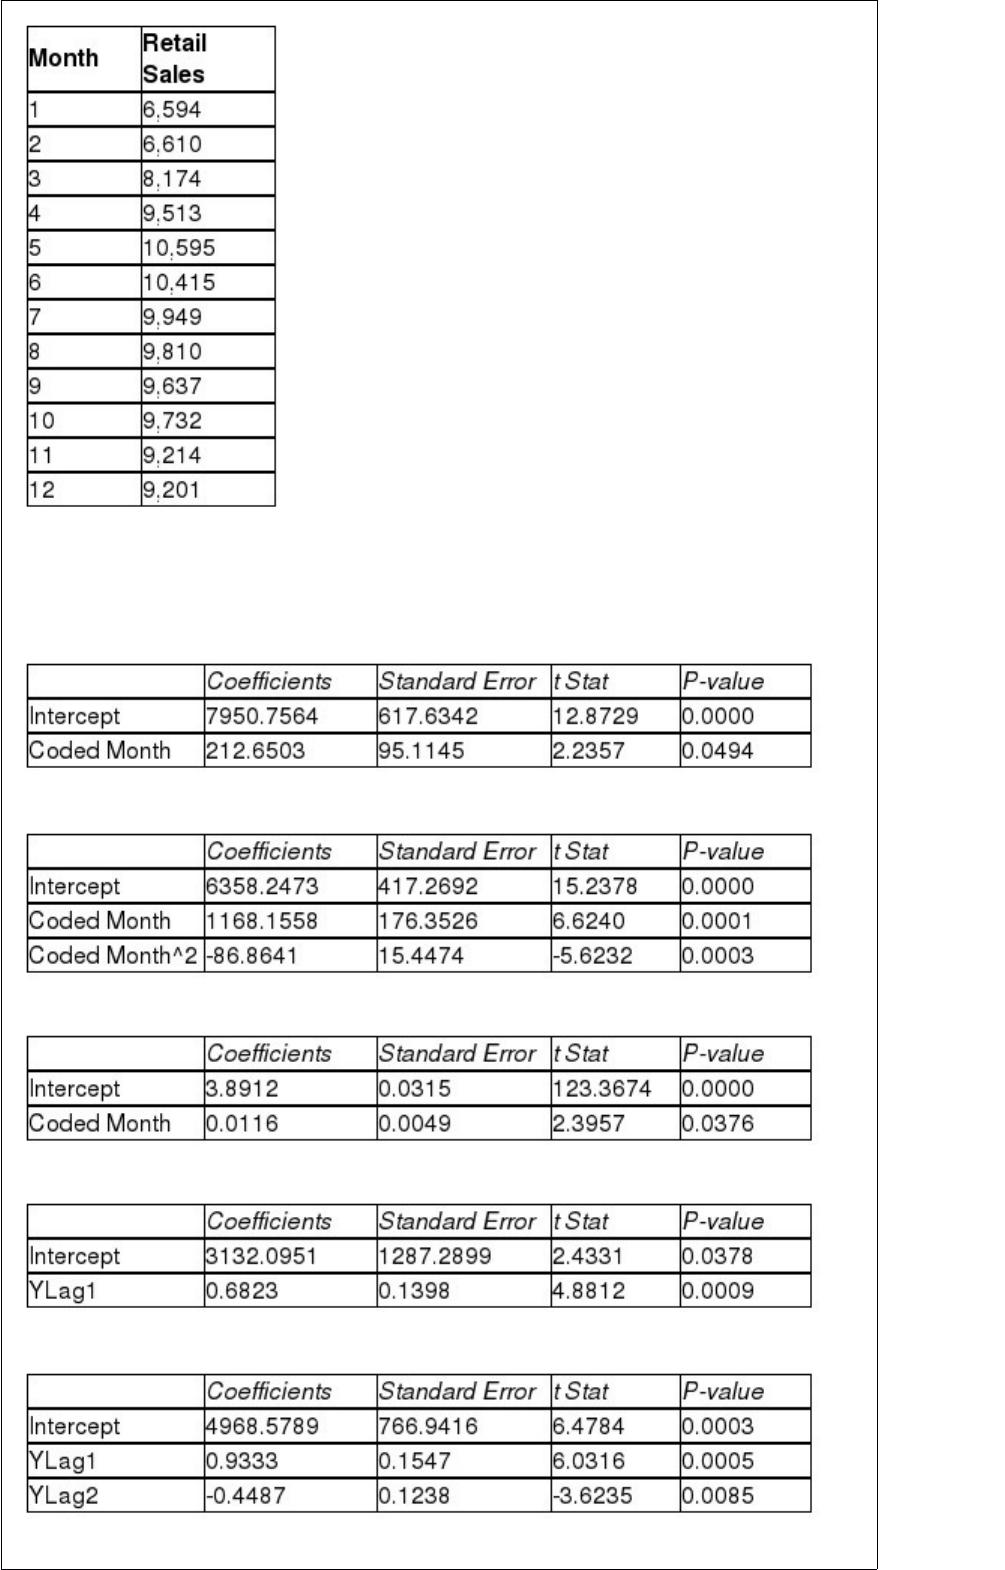
The results of the linear trend, quadratic trend, exponential trend, first-order
autoregressive, second-order autoregressive and third-order autoregressive model are
presented below in which the coded month for the 1st month is 0:
Linear trend model:
Quadratic trend model:
Exponential trend model:
First-order autoregressive:
Second-order autoregressive:
Third-order autoregressive:
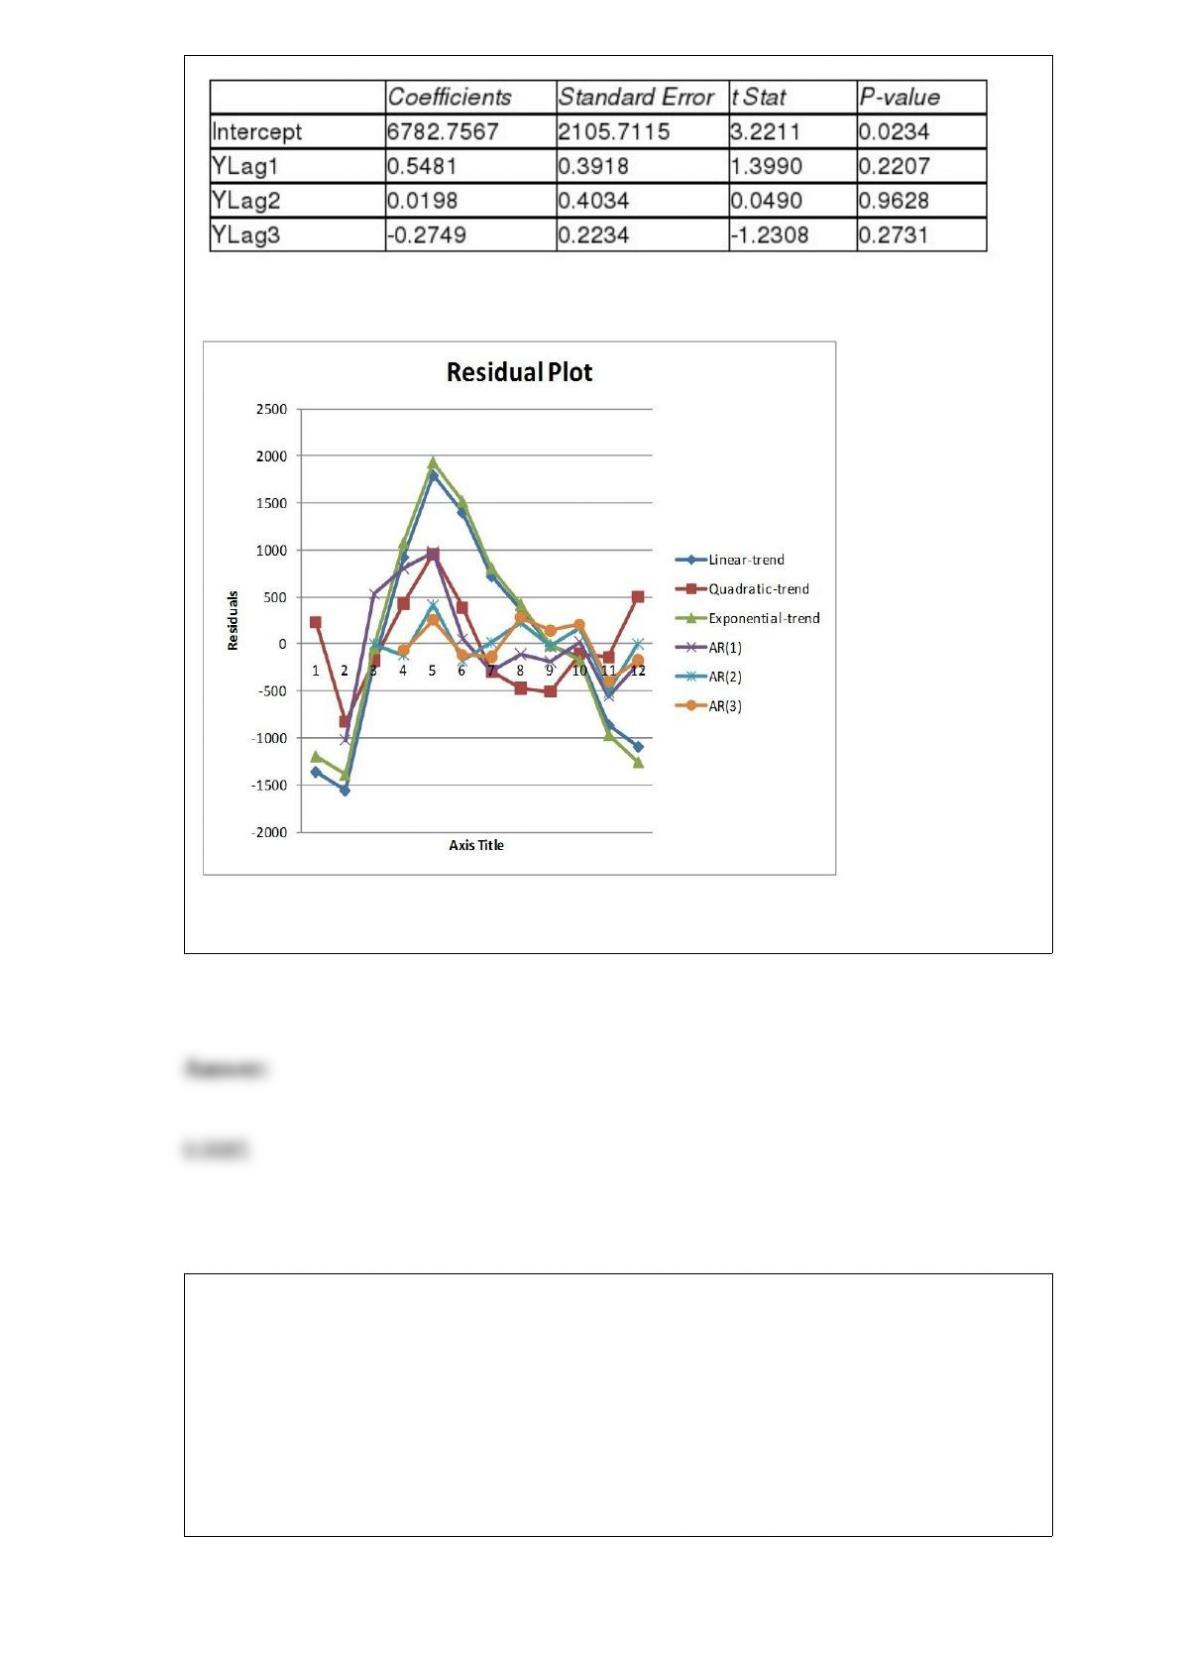
Below is the residual plot of the various models:
Referring to Table 16-13, what is the p-value of the t test statistic for testing the
appropriateness of the second-order autoregressive model?
TABLE 13-11
A computer software developer would like to use the number of downloads (in
thousands) for the trial version of his new shareware to predict the amount of revenue
(in thousands of dollars) he can make on the full version of the new shareware.
Following is the output from a simple linear regression along with the residual plot and
normal probability plot obtained from a data set of 30 different sharewares that he has
developed:
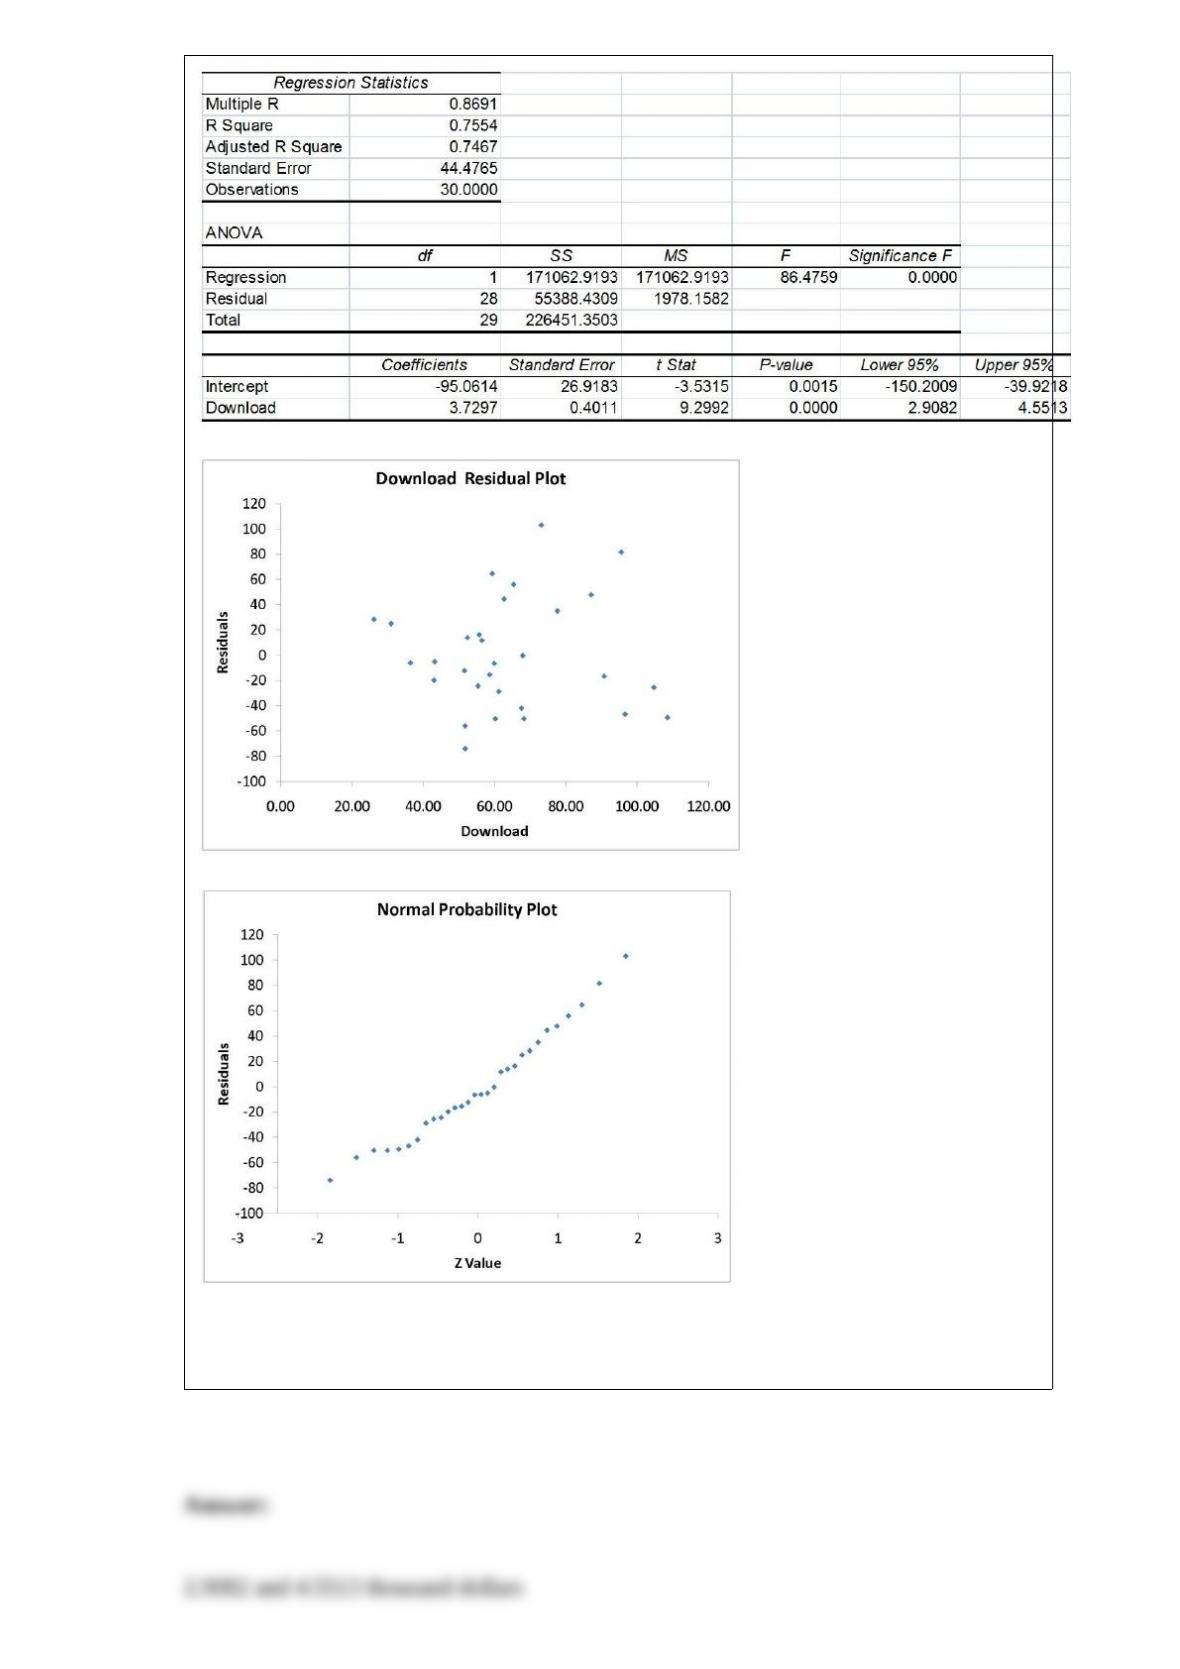
Referring to Table 13-11, what are the lower and upper limits of the 95% confidence
interval estimate for population slope?
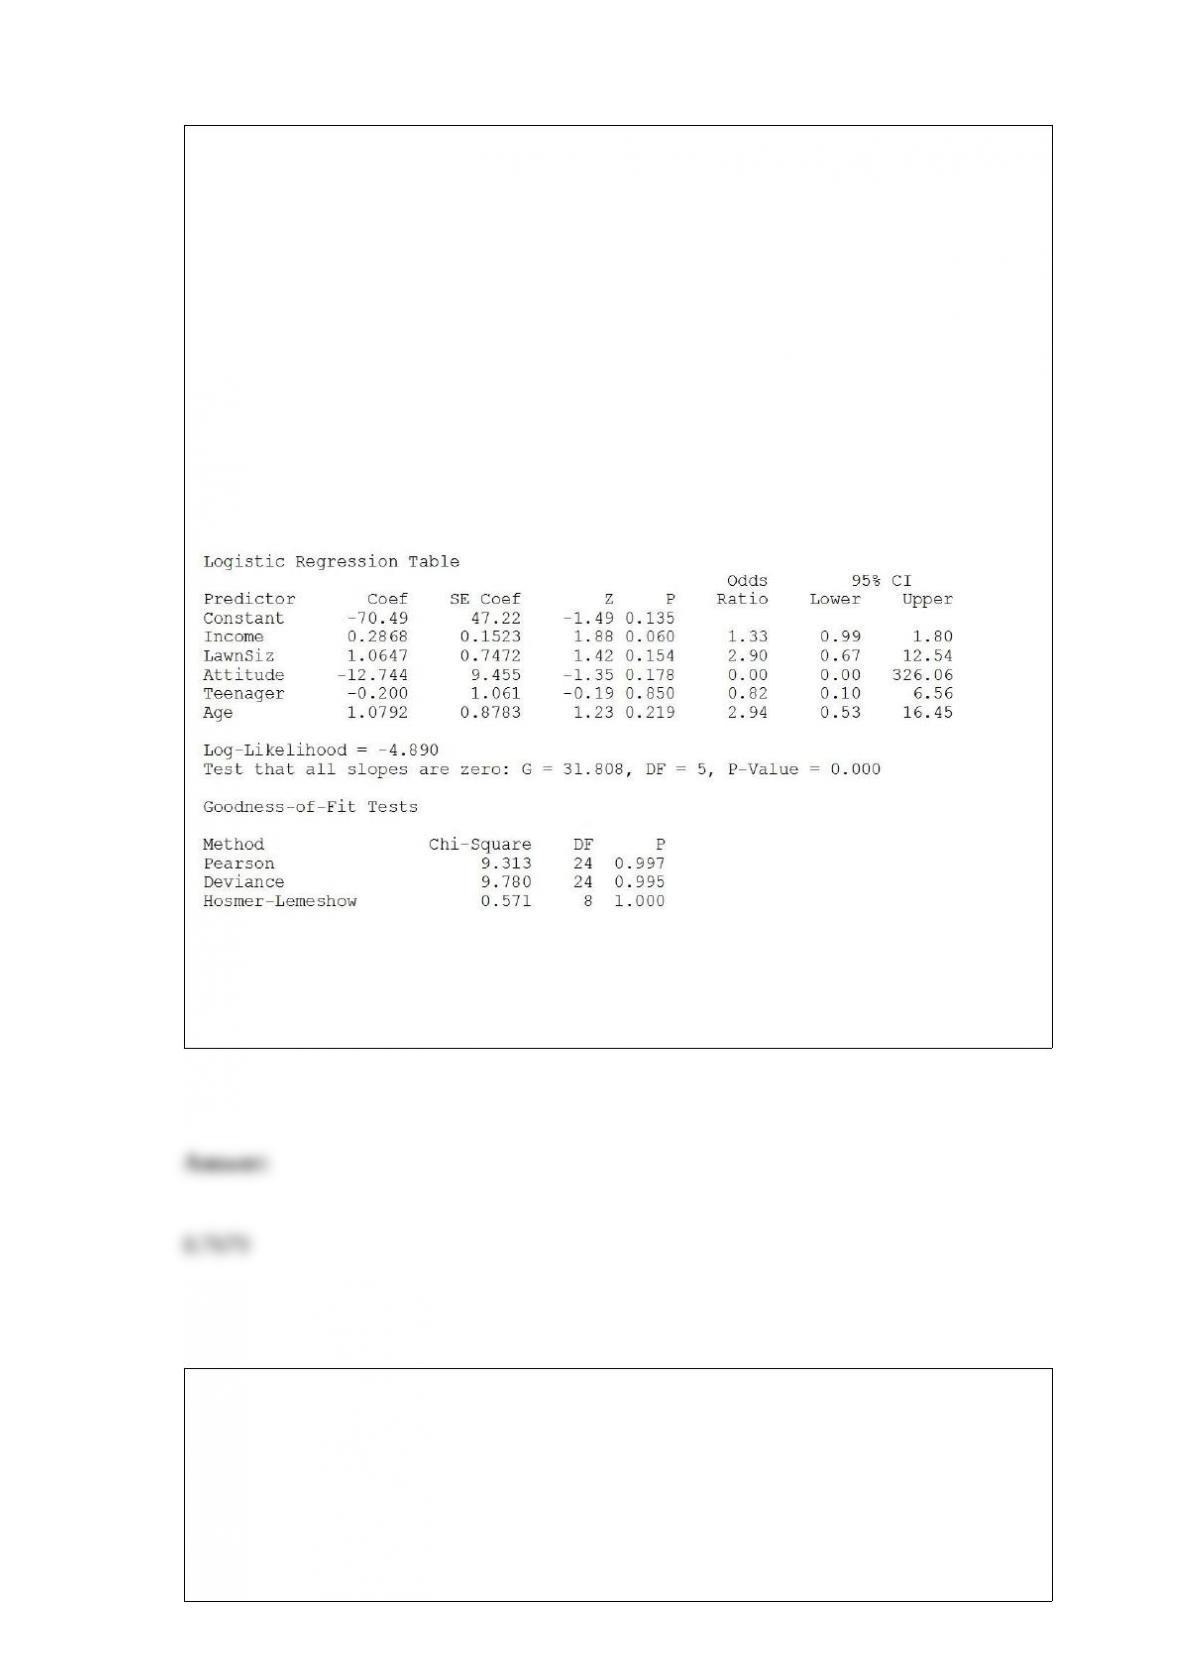
TABLE 17-12
The marketing manager for a nationally franchised lawn service company would like to
study the characteristics that differentiate home owners who do and do not have a lawn
service. A random sample of 30 home owners located in a suburban area near a large
city was selected; 15 did not have a lawn service (code 0) and 15 had a lawn service
(code 1). Additional information available concerning these 30 home owners includes
family income (Income, in thousands of dollars), lawn size (Lawn Size, in thousands of
square feet), attitude toward outdoor recreational activities (Attitude 0 = unfavorable, 1
= favorable), number of teenagers in the household (Teenager), and age of the head of
the household (Age).
The Minitab output is given below:
Referring to Table 17-12, what is the estimated odds ratio for a 48-year-old home owner
with a family income of $100,000, a lawn size of 5,000 square feet, a positive attitude
toward outdoor recreation, and two teenagers in the household?
TABLE 8-3
To become an actuary, it is necessary to pass a series of 10 exams, including the most
important one, an exam in probability and statistics. An insurance company wants to
estimate the mean score on this exam for actuarial students who have enrolled in a
special study program. They take a sample of 8 actuarial students in this program and
determine that their scores are: 2, 5, 8, 8, 7, 6, 5, and 7. This sample will be used to

calculate a 90% confidence interval for the mean score for actuarial students in the
special study program.
Referring to Table 8-3, the mean of the sample is ________, while the standard
deviation of the sample is ________.
TABLE 6-6
According to Investment Digest, the arithmetic mean of the annual return for common
stocks over an 85-year period was 9.5%, but the value of the variance was not
mentioned. Also 25% of the annual returns were below 8%, while 65% of the annual
returns were between 8% and 11.5%. The article claimed that the distribution of annual
return for common stocks was bell-shaped and approximately symmetric. Assume that
this distribution is normal with the mean given above. Answer the following questions
without the help of a calculator, statistical software or statistical table.
Referring to Table 6-6, find the probability that the annual return of a random year will
be more than 7.5%.
TABLE 9-10
A manufacturer produces light bulbs that have a mean life of at least 500 hours when
the production process is working properly. Based on past experience, the population
standard deviation is 50 hours and the light bulb life is normally distributed. The
operations manager stops the production process if there is evidence that the population
mean light bulb life is below 500 hours.
Referring to Table 9-10, if you select a sample of 100 light bulbs and are willing to have
a level of significance of 0.10, the confidence coefficient of the test is ________ if the
population mean bulb life is 510 hours.

Referring to Table 14-12, predict the cost per hour if one parks o
campus and 3 blocks from the quad.
TABLE 14-12
As a project for his business statistics class, a student examined the
factors that determined parking meter rates throughout the campus
area. Data were collected for the price ($) per hour of parking, blocks
to the quadrangle, and whether the parking is on or o campus. The
population regression model hypothesized is Yi = α + β1X1i + β2X2i
+ ε
where
Y is the meter price per hour.
X1 is the number of blocks to the quad.
X2 is a dummy variable that takes the value 1 if the meter is located
on campus and 0 otherwise.
The following Excel results are obtained.

TABLE 8-18
A wealthy real estate investor wants to decide whether it is a good investment to build a
high-end shopping complex in a suburban county in Chicago. His main concern is the
total market value of the 3,605 houses in the suburban county. He commissioned a
statistical consulting group to take a sample of 200 houses and obtained a sample mean
market price of $225,000 and a sample standard deviation of $38,700. The consulting
group also found out that the mean differences between market prices and appraised
prices was $125,000 with a standard deviation of $3,400. Also the proportion of houses
in the sample that are appraised for higher than the market prices is 0.24.
Referring to Table 8-18, what will be the 90% confidence interval for the population
proportion of houses that will be appraised for higher than the market prices?
TABLE 3-3
The ordered array below represents the number of vitamin supplements sold by a health
food store in a sample of 16 days.
19, 19, 20, 20, 22, 23, 25, 26, 27, 30, 33, 34, 35, 36, 38, 41
Note: For this sample, the sum of the values is 448, and the sum of the squared
differences between each value and the mean is 812.
Referring to Table 3-3, the first quartile of the number of vitamin supplements sold in
this sample is ________.