TABLE 8-4
The actual voltages of power packs labeled as 12 volts are as follows: 11.77, 11.90,
11.64, 11.84, 12.13, 11.99, and 11.77.
True or False: Referring to Table 8-4, a 95% confidence interval for the mean voltage of
the power pack is wider than a 99% confidence interval.
True or False: TABLE 17-10
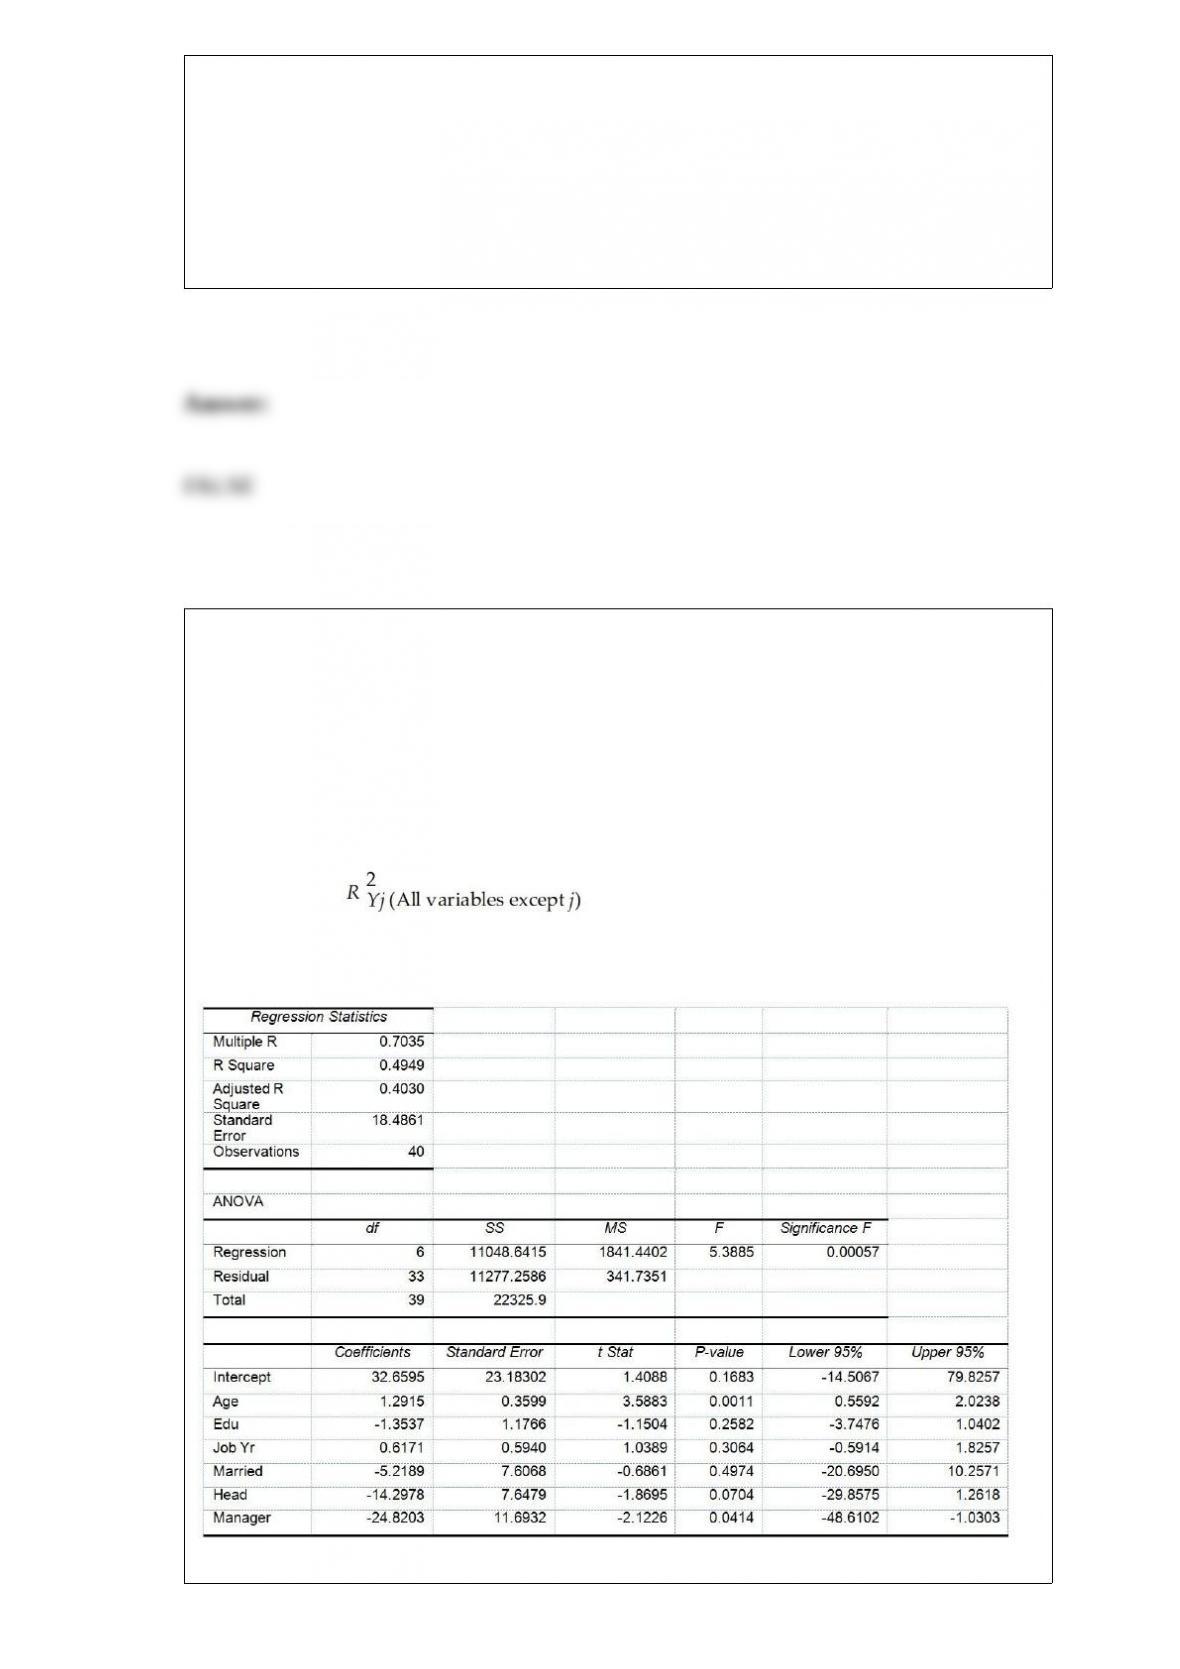
Given below are results from the regression analysis where the dependent variable is
the number of weeks a worker is unemployed due to a layoff (Unemploy) and the
independent variables are the age of the worker (Age), the number of years of education
received (Edu), the number of years at the previous job (Job Yr), a dummy variable for
marital status (Married: 1 = married, 0 = otherwise), a dummy variable for head of
household (Head: 1 = yes, 0 = no) and a dummy variable for management position
(Manager: 1 = yes, 0 = no). We shall call this Model 1. The coefficient of partial
determination ( ) of each of the 6 predictors are, respectively,
0.2807, 0.0386, 0.0317, 0.0141, 0.0958, and 0.1201.
Model 2 is the regression analysis where the dependent variable is Unemploy and the
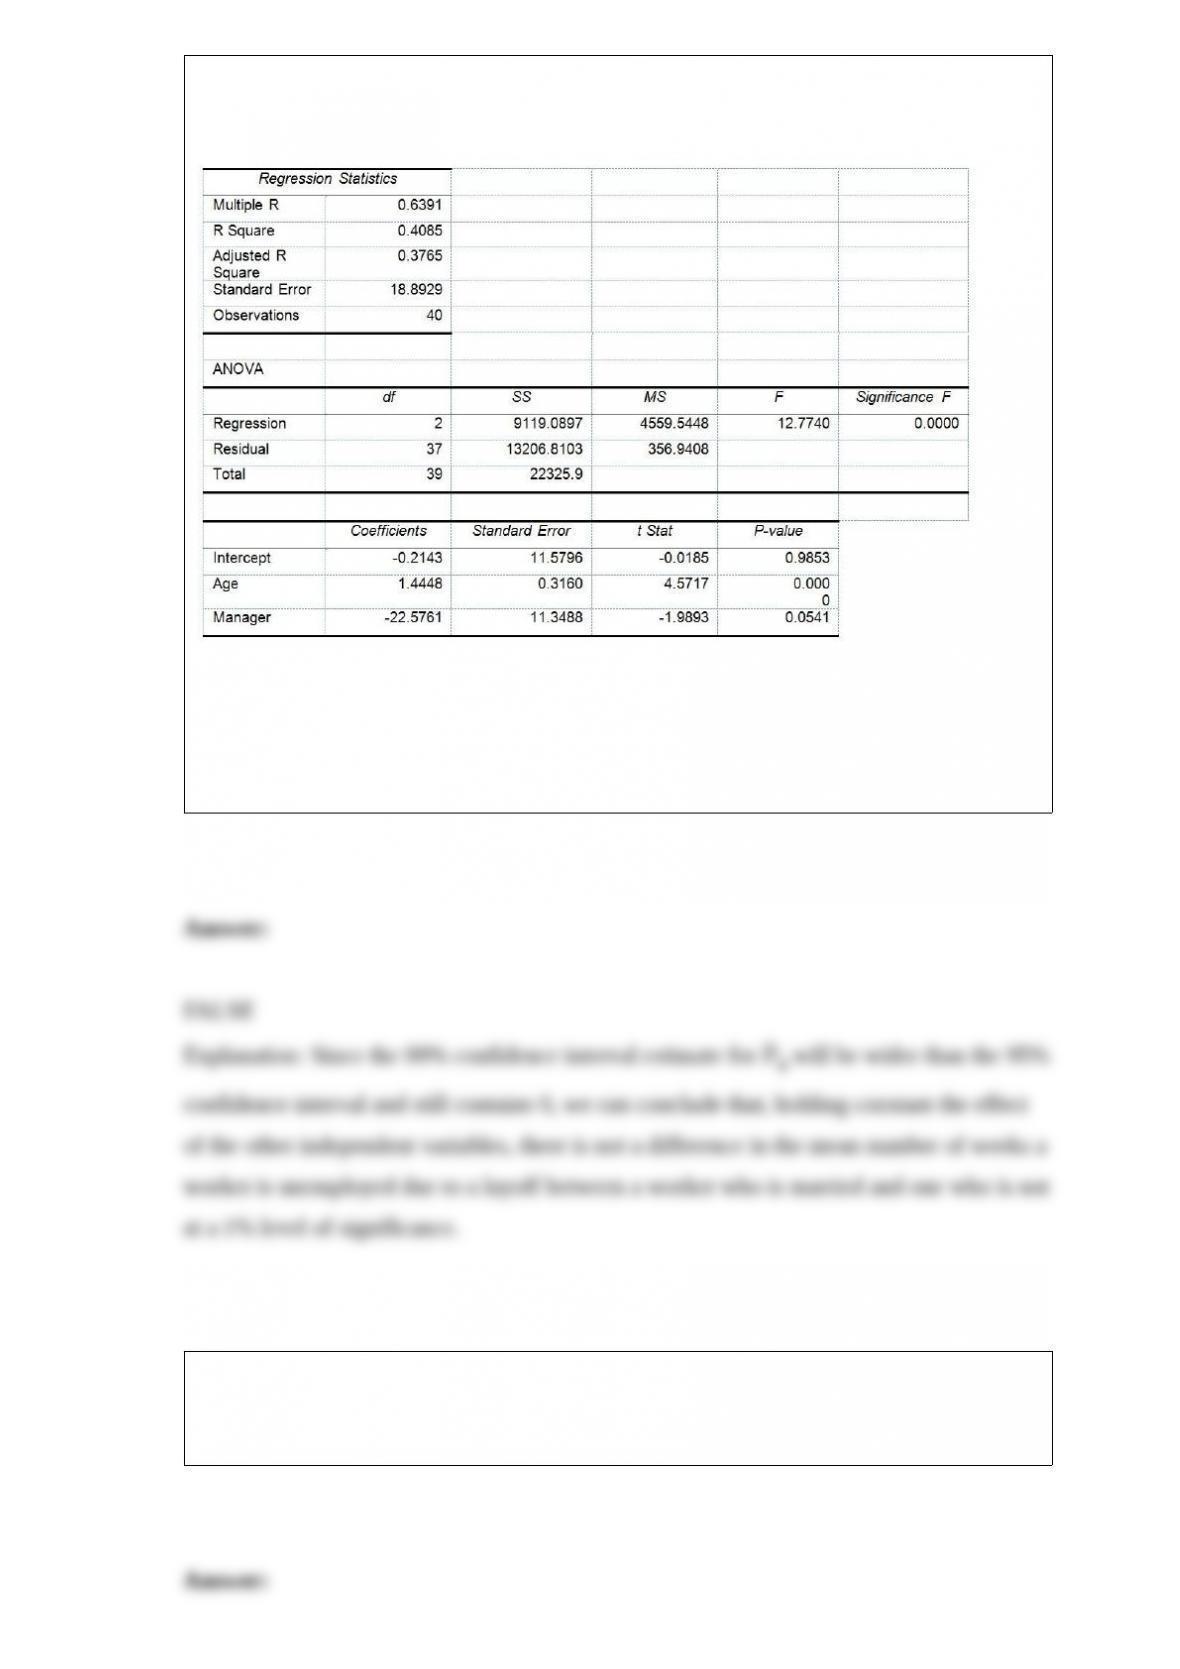
independent variables are Age and Manager. The results of the regression analysis are
given below:
Referring to Table 17-10, Model 1, we can conclude that, holding constant the effect of
the other independent variables, there is a difference in the mean number of weeks a
worker is unemployed due to a layoff between a worker who is married and one who is
not at a 1% level of significance if all we have is the information of the 95% confidence
interval estimate forβ4.
True or False: In data mining where huge data sets are being explored to discover
relationships among a large number of variables, the best-subsets approach is more
practical than the stepwise regression approach.
True or False: The standard error of the mean is also known as the standard deviation of
the sampling distribution of the sample mean.
TABLE 15-6
Given below are results from the regression analysis on 40 observations where the
dependent variable is the number of weeks a worker is unemployed due to a layoff (Y)
and the independent variables are the age of the worker (X1), the number of years of
education received (X2), the number of years at the previous job (X3), a dummy variable
for marital status (X4: 1 = married, 0 = otherwise), a dummy variable for head of
household (X5: 1 = yes, 0 = no) and a dummy variable for management position (X6: 1
= yes, 0 = no).
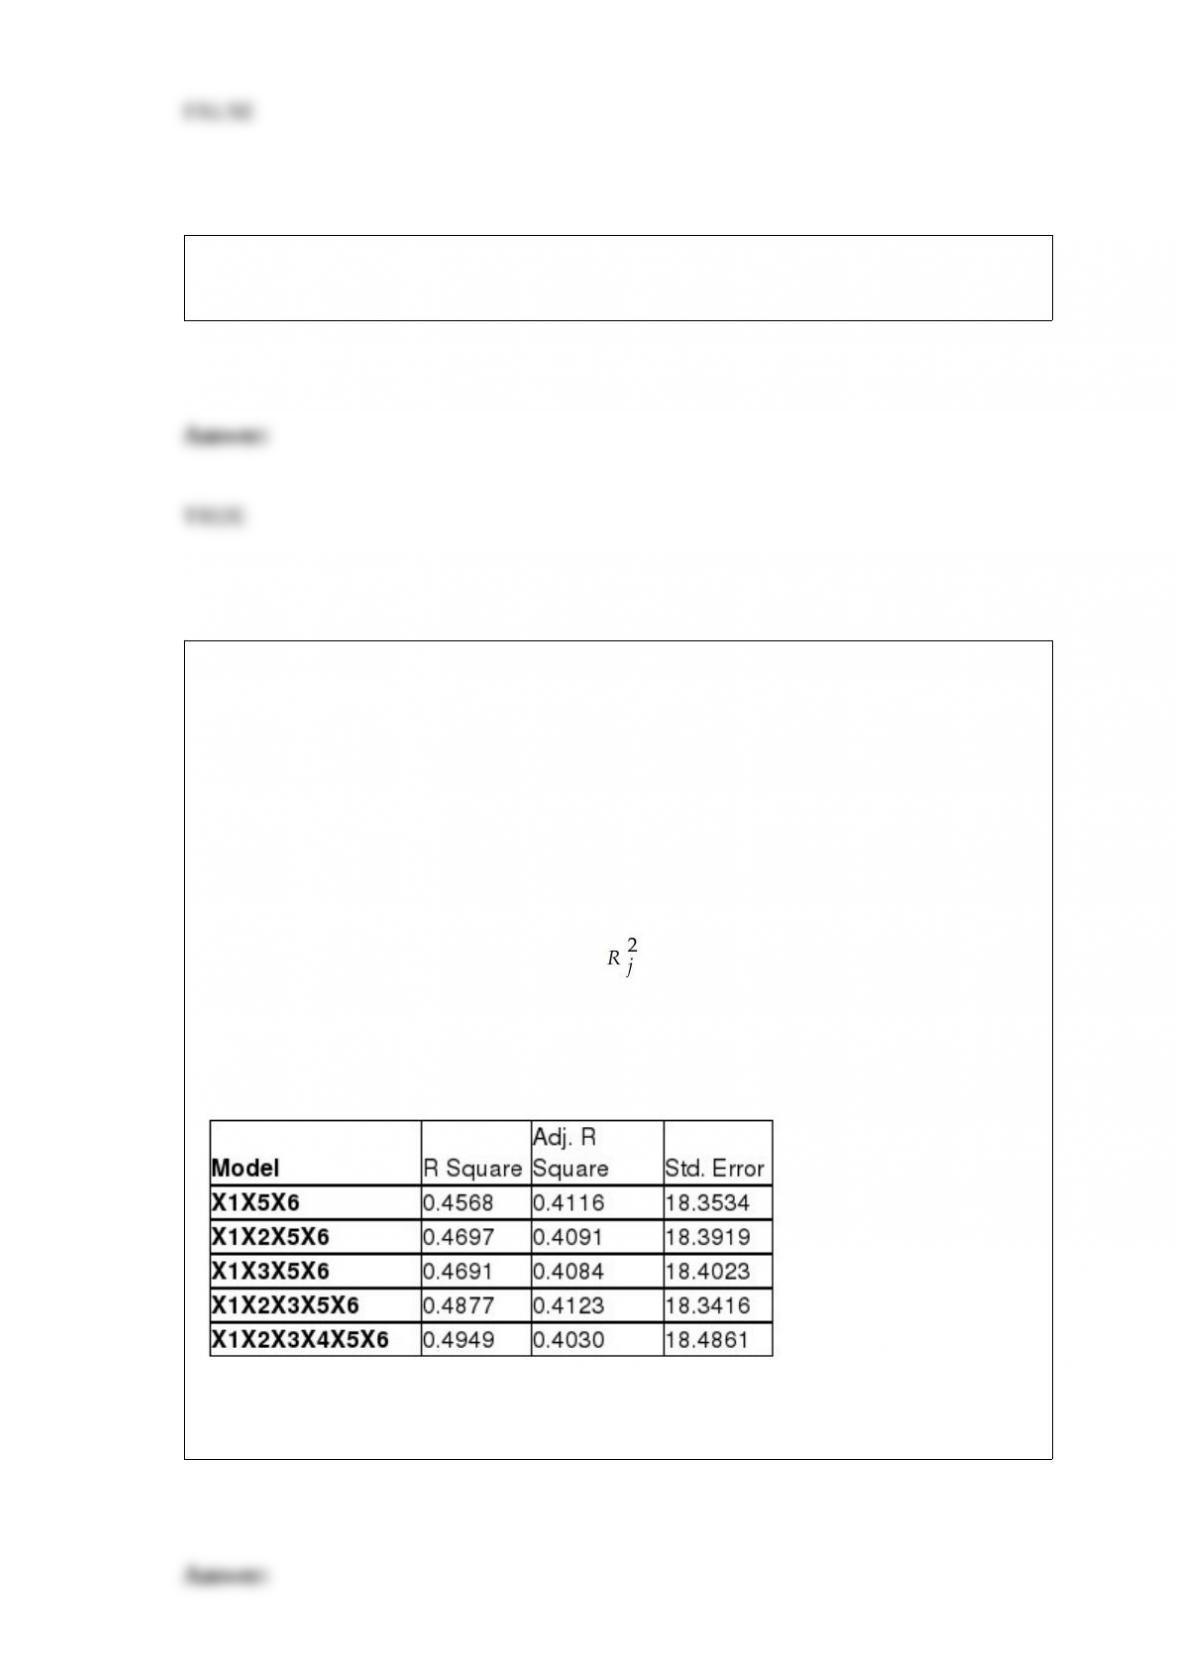
The coefficient of multiple determination ( ) for the regression model using each of
the 6 variables Xj as the dependent variable and all other X variables as independent
variables are, respectively, 0.2628, 0.1240, 0.2404, 0.3510, 0.3342 and 0.0993.
The partial results from best-subset regression are given below:
True or False: Referring to Table 15-6, the model that includes X1, X2, X5 and X6 should
be among the appropriate models using the Mallow’s Cp statistic.
True or False: Measurement error can become an ethical issue when an interviewer
purposely guides the responses in a particular direction.
True or False: TABLE 17-12
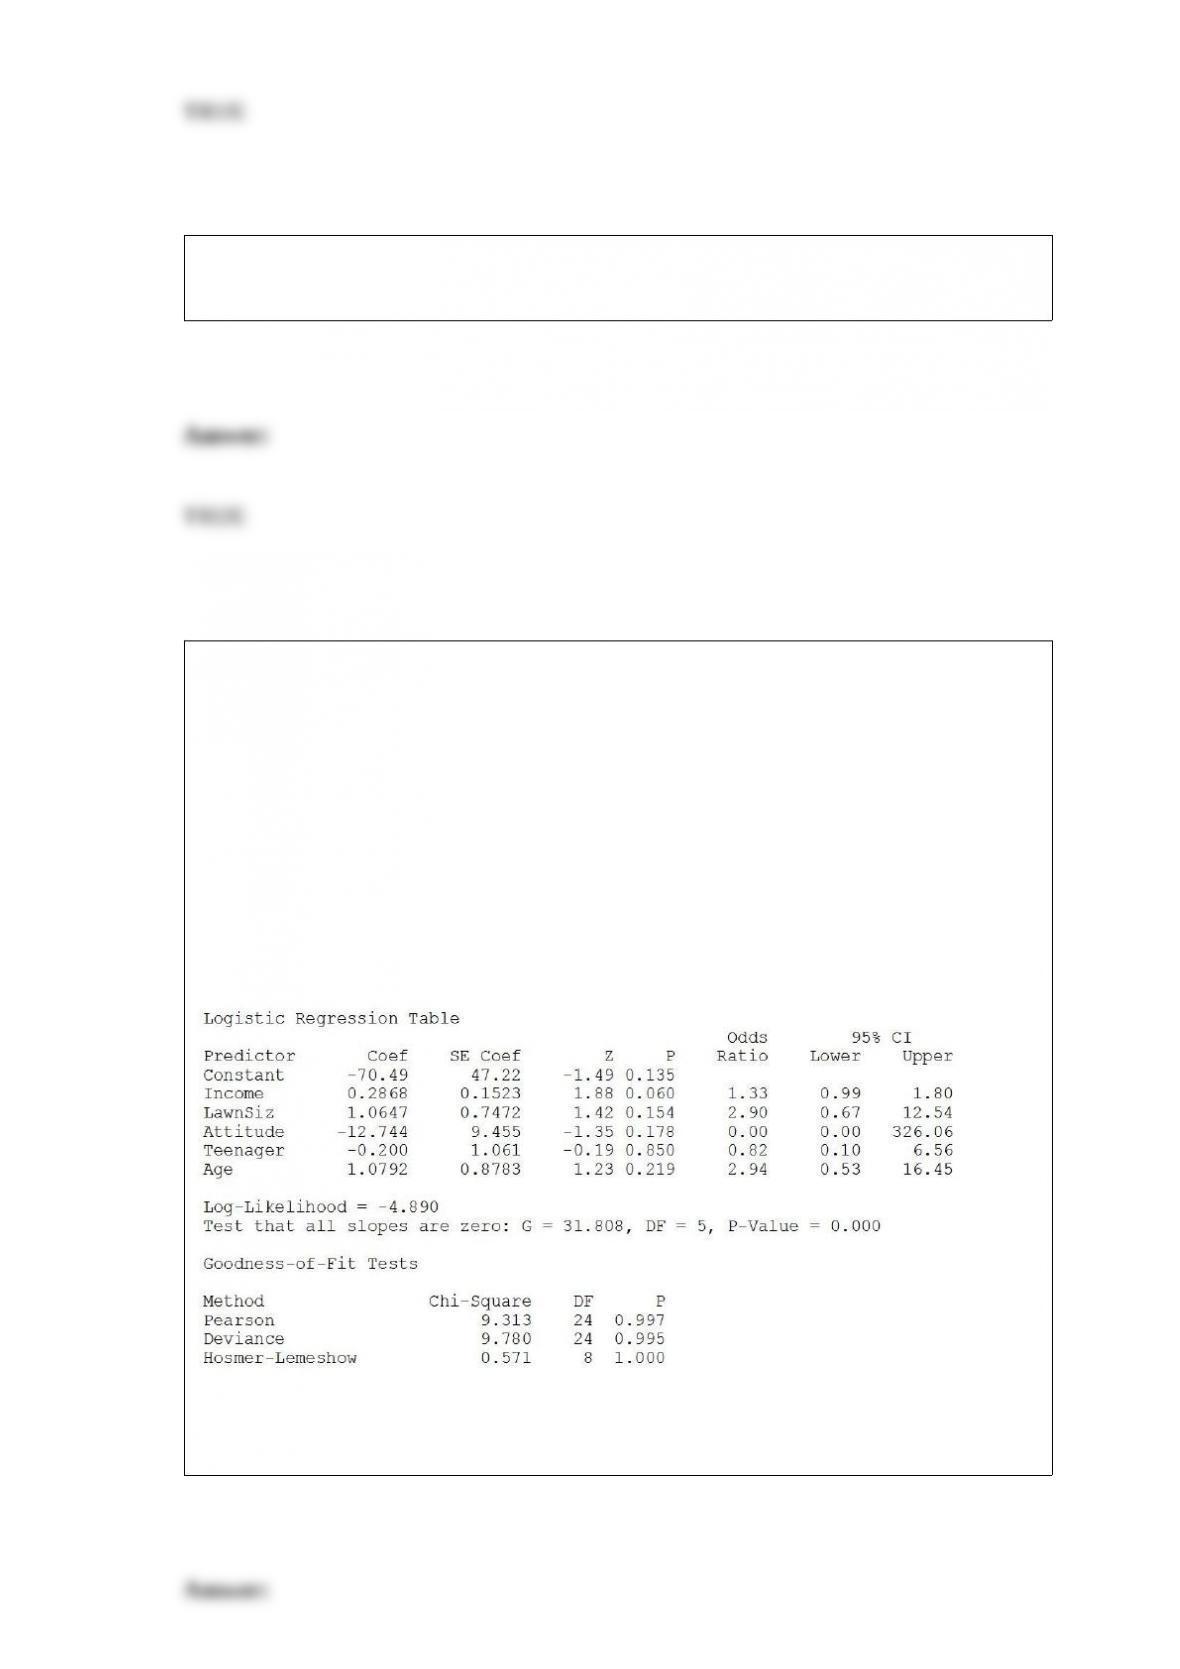
The marketing manager for a nationally franchised lawn service company would like to
study the characteristics that differentiate home owners who do and do not have a lawn
service. A random sample of 30 home owners located in a suburban area near a large
city was selected; 15 did not have a lawn service (code 0) and 15 had a lawn service
(code 1). Additional information available concerning these 30 home owners includes
family income (Income, in thousands of dollars), lawn size (Lawn Size, in thousands of
square feet), attitude toward outdoor recreational activities (Attitude 0 = unfavorable, 1
= favorable), number of teenagers in the household (Teenager), and age of the head of
the household (Age).
The Minitab output is given below:
Referring to Table 17-12, there is not enough evidence to conclude that Teenager makes
a significant contribution to the model in the presence of the other independent
variables at a 0.05 level of significance.
True or False: The difference between the sample proportion and the population
proportion is called the sampling error.
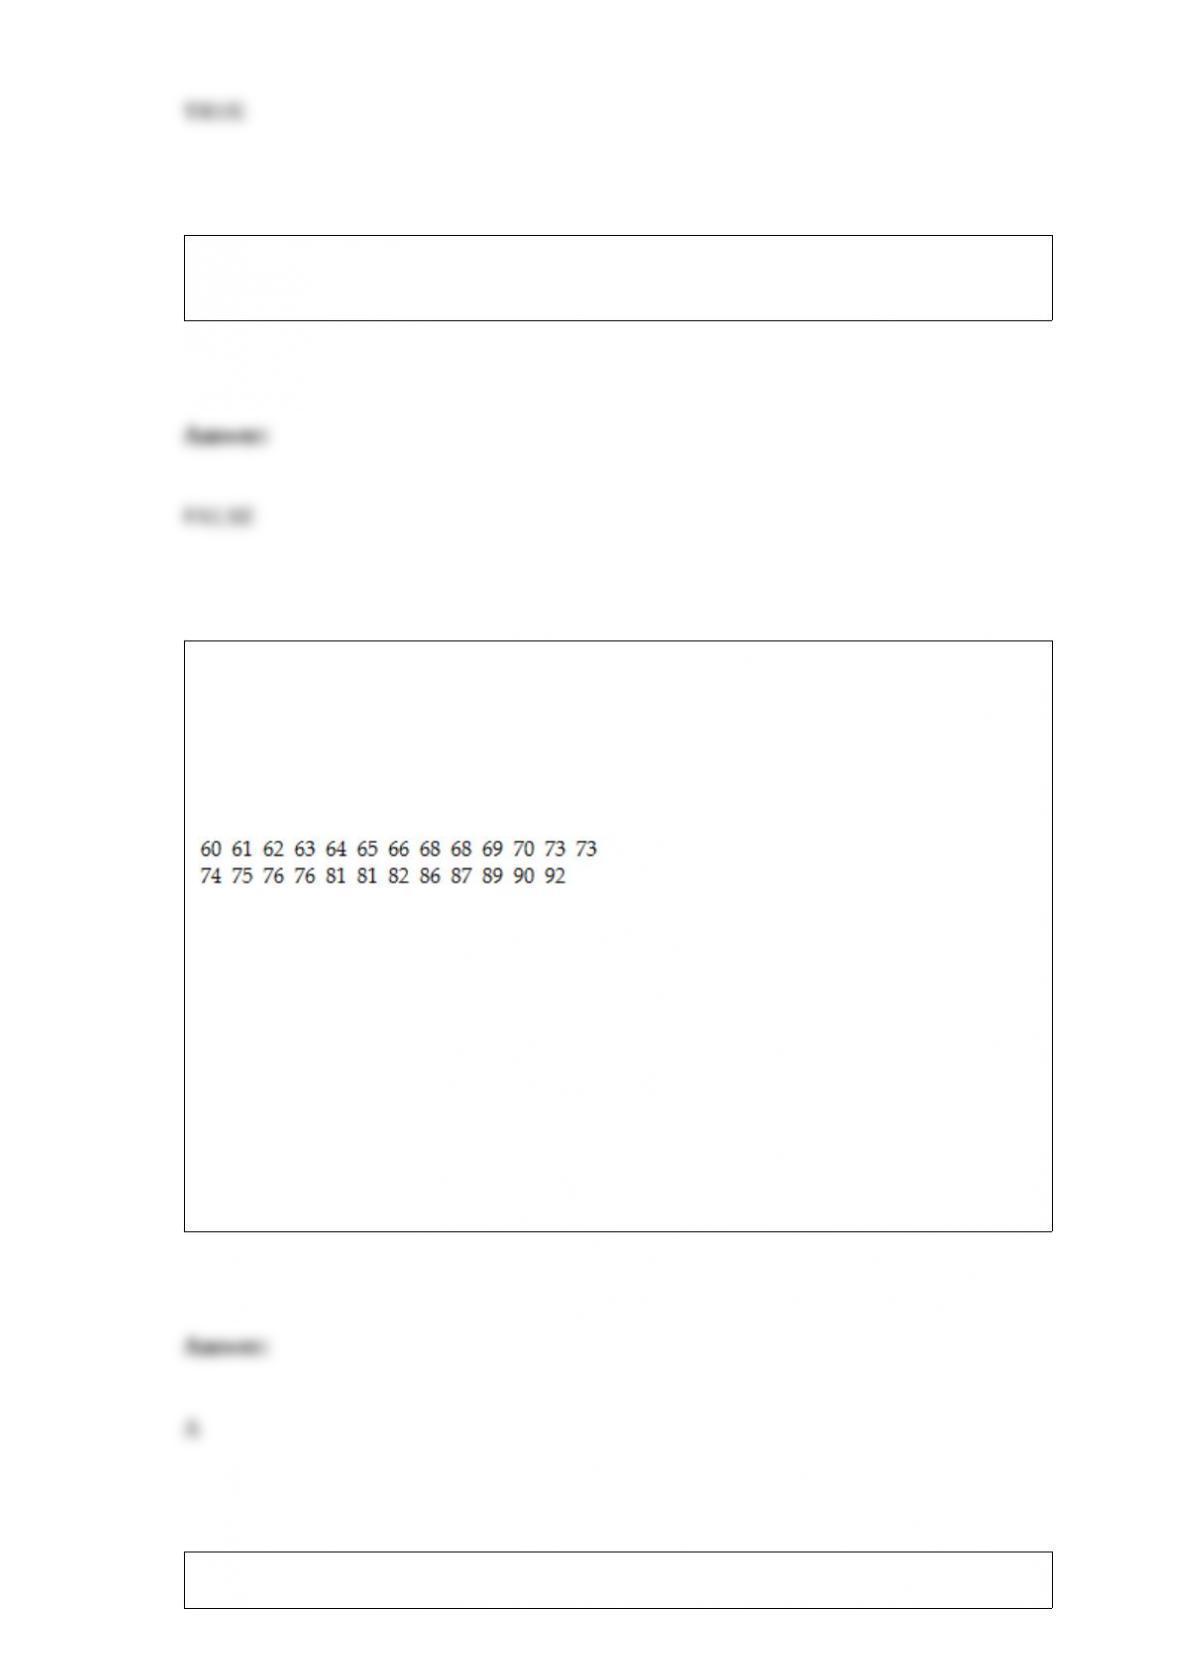
TABLE 3-1
Health care issues are receiving much attention in both academic and political arenas. A
sociologist recently conducted a survey of citizens over 60 years of age whose net
worth is too high to qualify for Medicaid. The ages of 25 senior citizens were as
follows:
Referring to Table 3-1, determine which of the following is the correct statement.
A) One fourth of the senior citizens sampled are below 65.5 years of age.
B) The middle 50% of the senior citizens sampled are between 65.5 and 73.0 years of
age.
C) The mean age of senior citizens sampled is 73.5 years of age.
D) All of the above are correct.
A realtor wants to compare the variability of sales-to-appraisal ratios of residential
properties sold in four neighborhoods (A, B, C, and D). Four properties are randomly
selected from each neighborhood and the ratios recorded for each were collected.
Which of the following tests will be the most appropriate?
A) McNemar test
B) Tukey-Kramer multiple comparisons procedure for one-way ANOVA
C) Levene’s test
D) Wilcoxon rank sum test
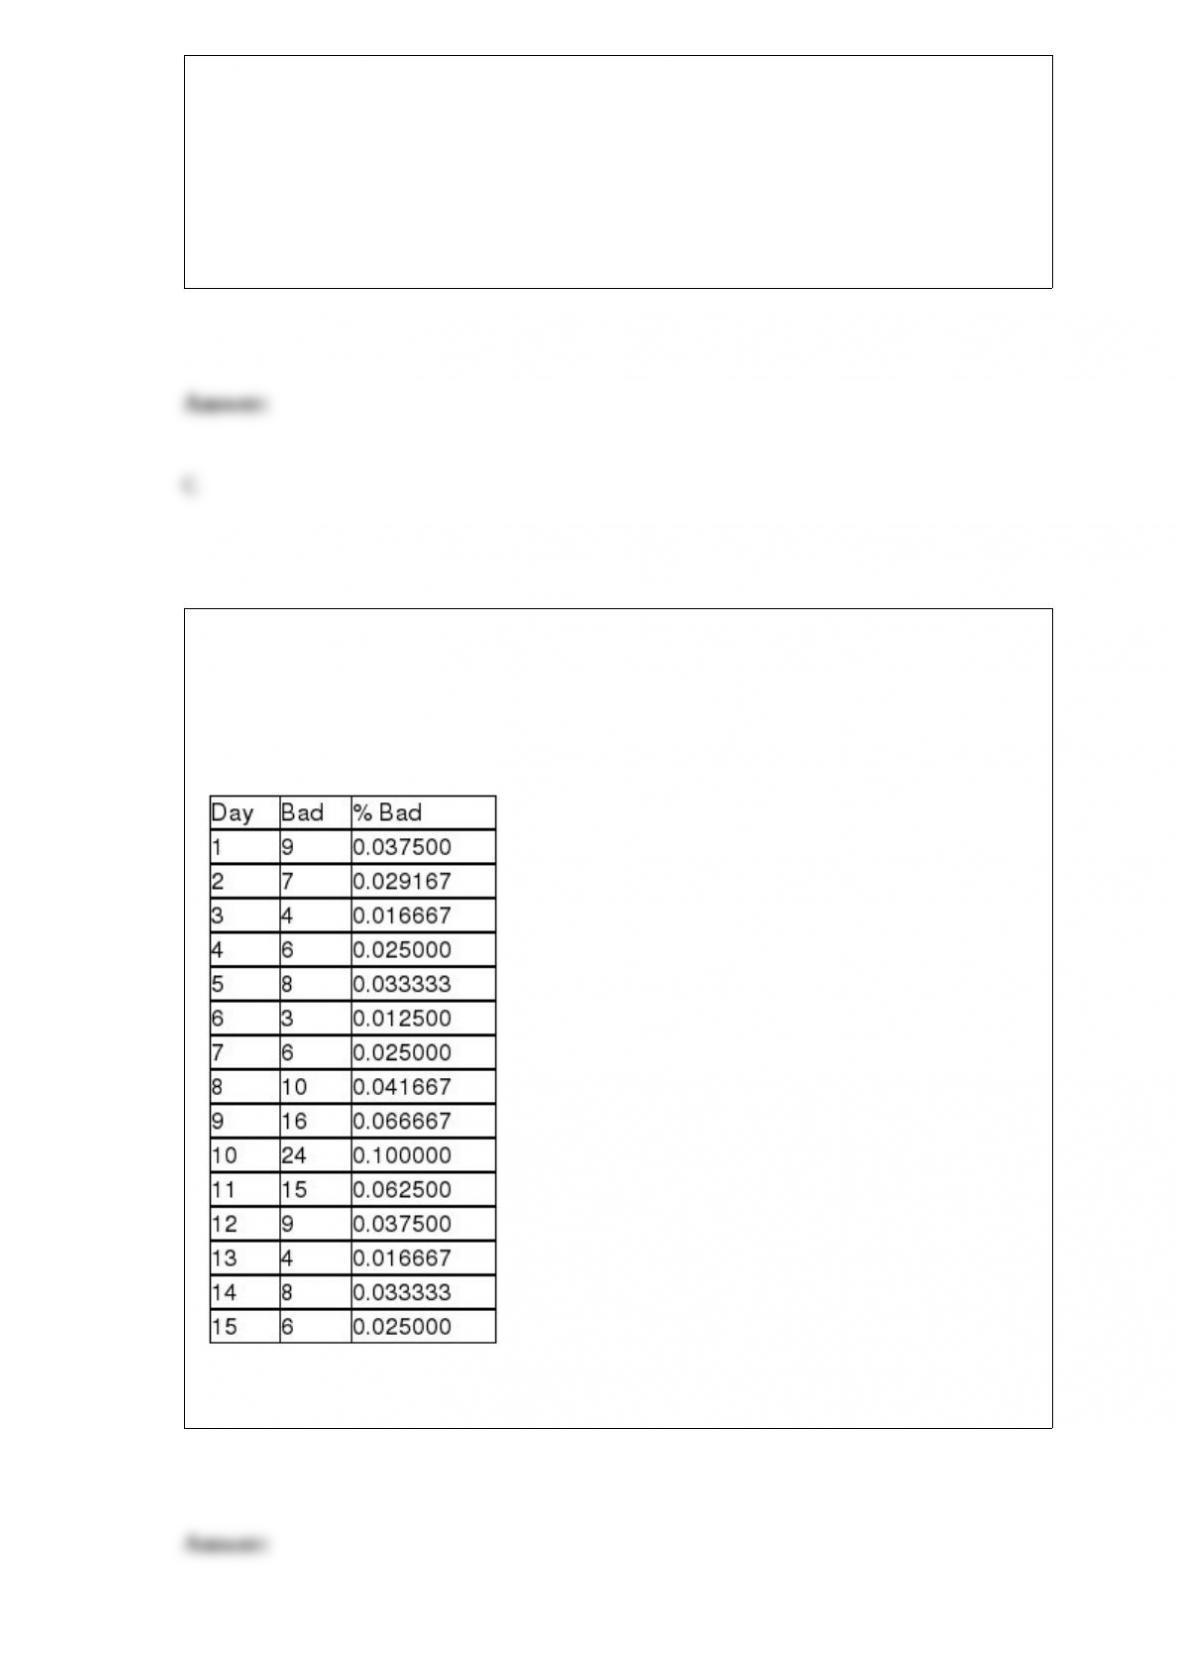
TABLE 18-5
A manufacturer of computer disks took samples of 240 disks on 15 consecutive days.
The number of disks with bad sectors was determined for each of these samples. The
results are in the table that follows.
Referring to Table 18-5, a p control chart is to be made for these data. The center line of
the control chart is ________.
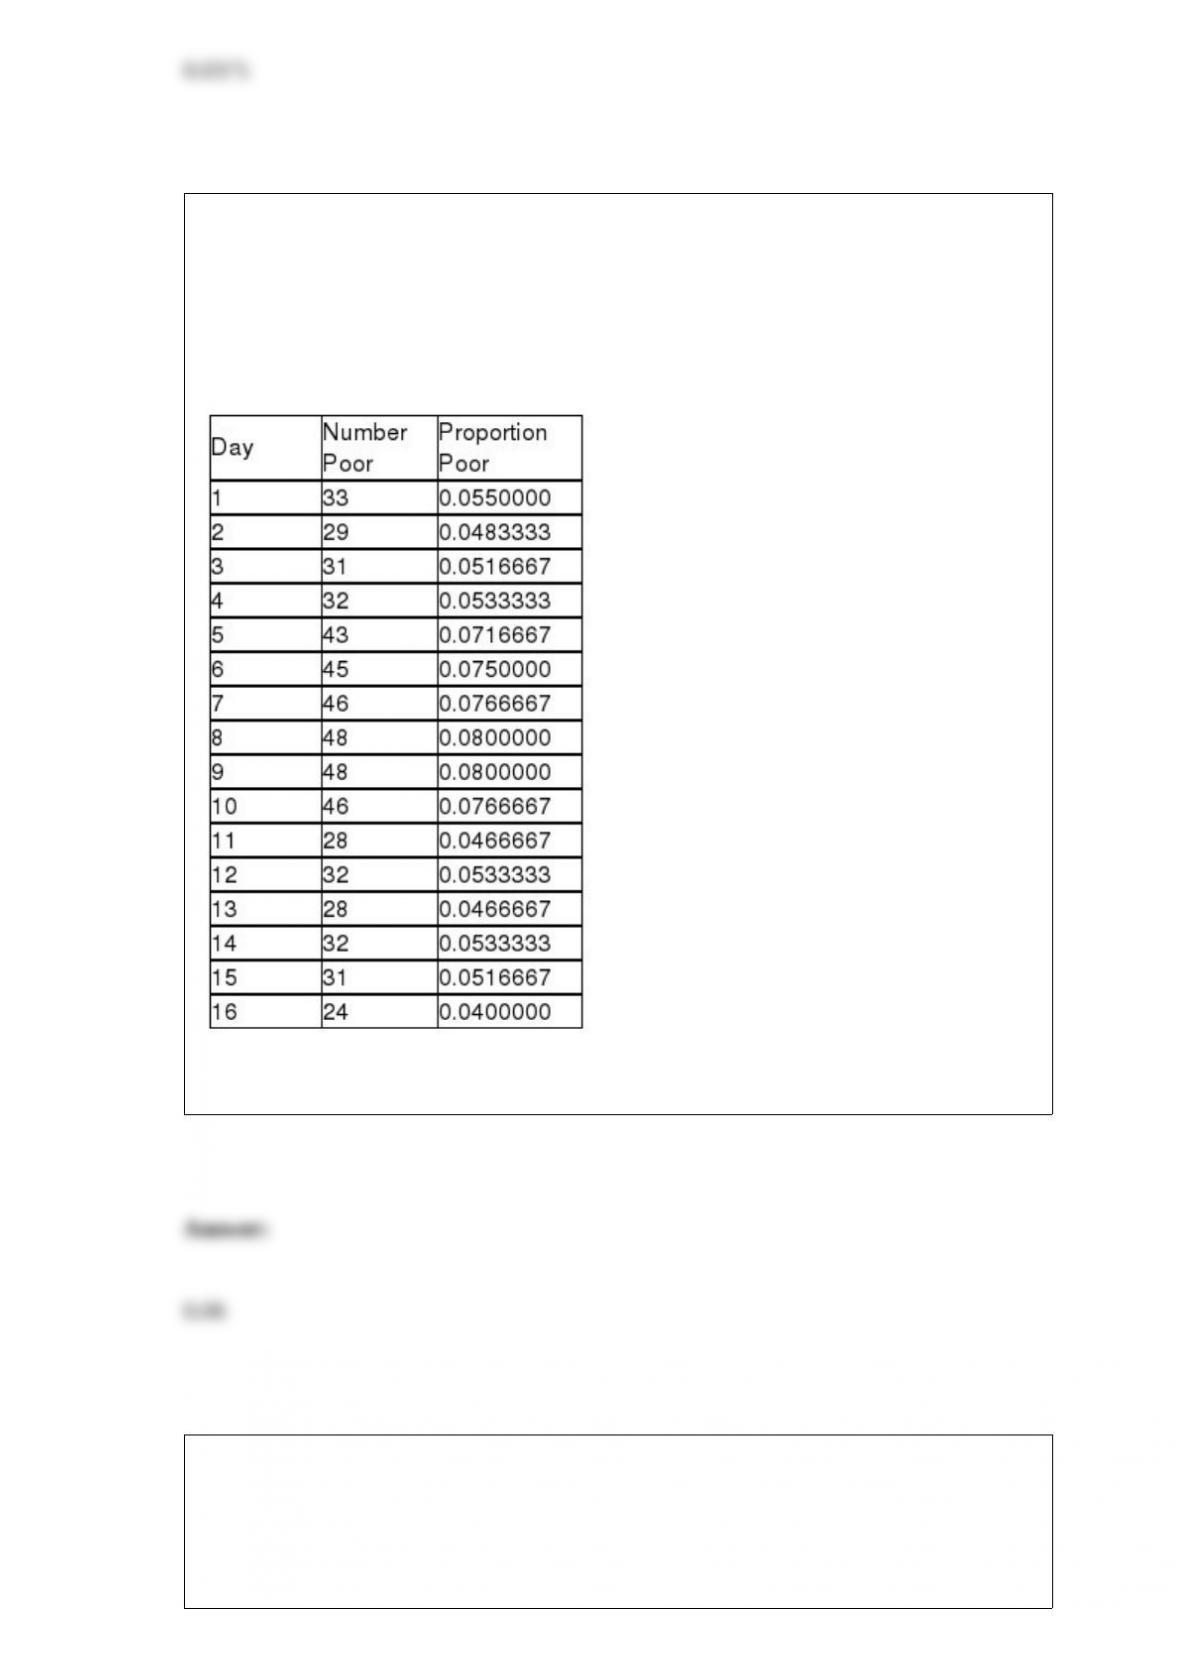
TABLE 18-6
The maker of a packaged candy wants to evaluate the quality of her production process.
On each of 16 consecutive days, she samples 600 bags of candy and determines the
number in each day’s sample that she considers to be of poor quality. The data that she
developed follow.
Referring to Table 18-6, a p control chart is to be constructed for these data. The center
line for the chart should be located at ________.
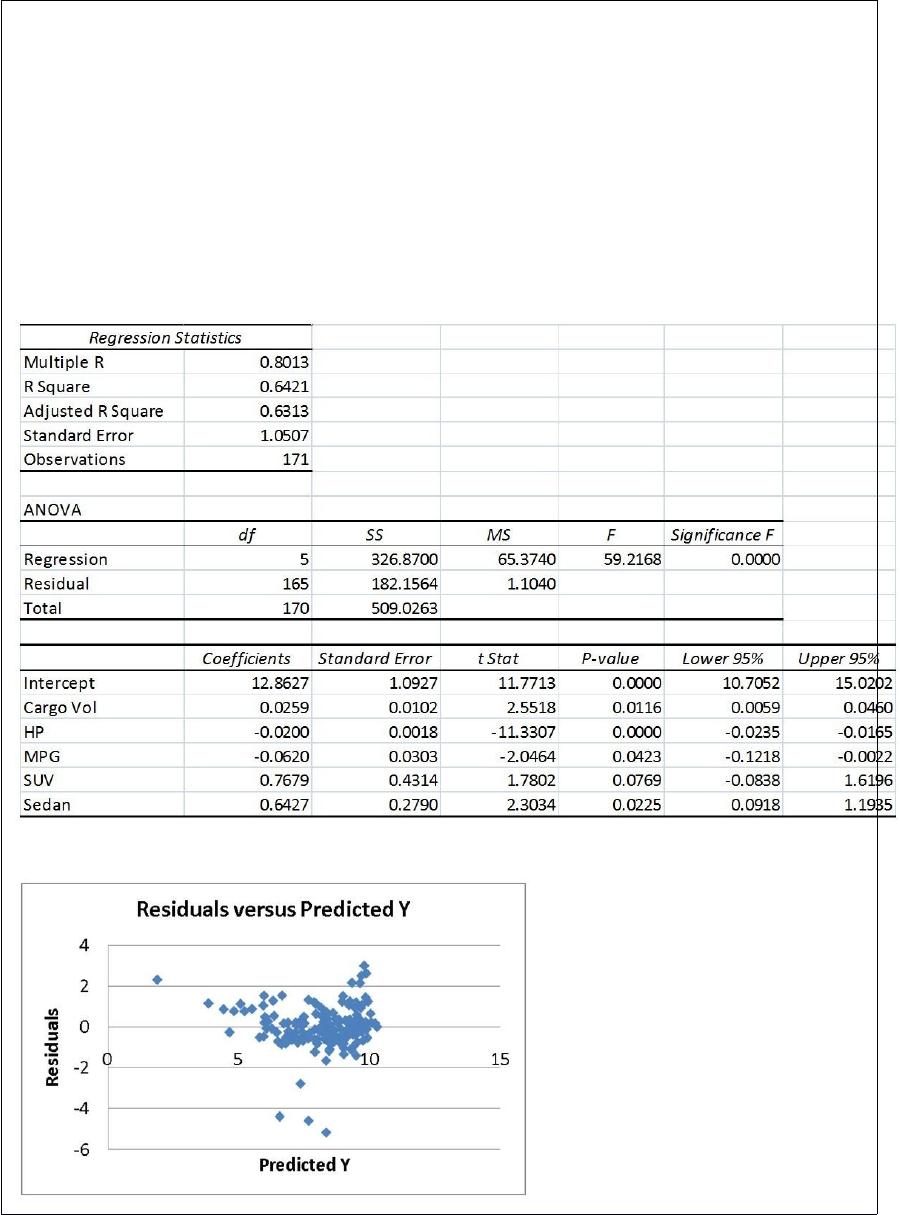
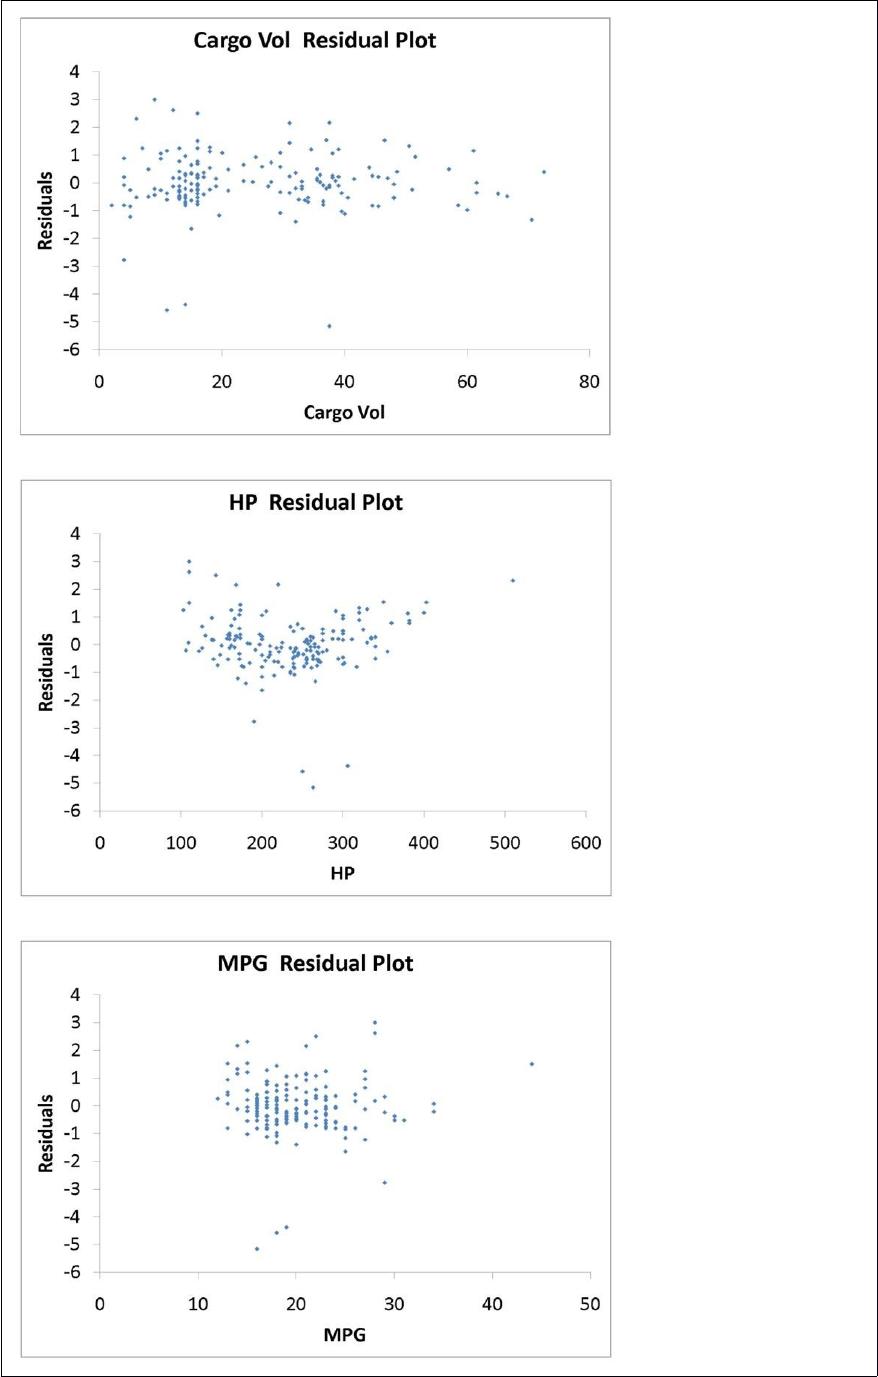
TABLE 17-9
What are the factors that determine the acceleration time (in sec.) from 0 to 60 miles per
hour of a car? Data on the following variables for 171 different vehicle models were
collected:
Accel Time: Acceleration time in sec.
Cargo Vol: Cargo volume in cu. ft.
HP: Horsepower
MPG: Miles per gallon
SUV: 1 if the vehicle model is an SUV with Coupe as the base when SUV and Sedan
are both 0
Sedan: 1 if the vehicle model is a sedan with Coupe as the base when SUV and Sedan
are both 0
The regression results using acceleration time as the dependent variable and the
remaining variables as the independent variables are presented below.
The various residual plots are as shown below.
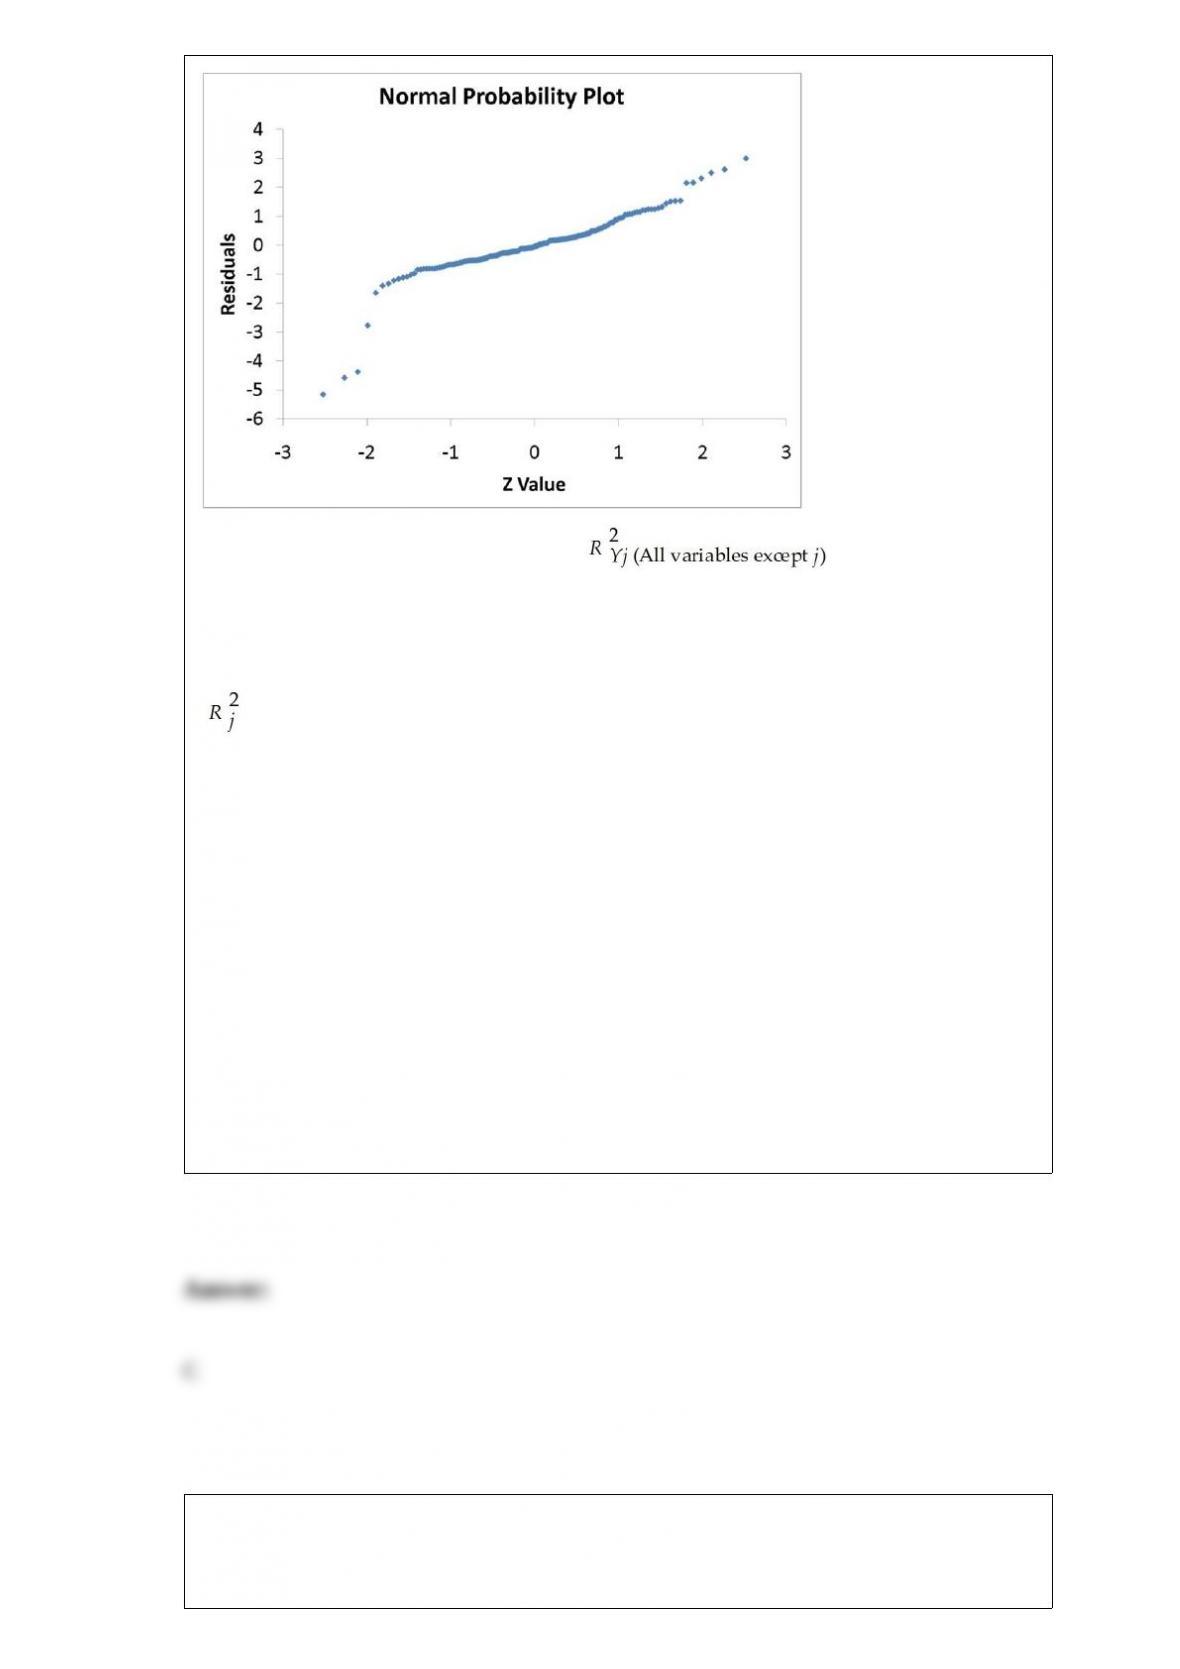
The coefficient of partial determination ( ) of each of the 5
predictors are, respectively, 0.0380, 0.4376, 0.0248, 0.0188, and 0.0312.
The coefficient of multiple determination for the regression model using each of the 5
variables Xj as the dependent variable and all other X variables as independent variables
( ) are, respectively, 0.7461, 0.5676, 0.6764, 0.8582, 0.6632.
Referring to Table 17-9, what is the correct interpretation for the estimated coefficient
for HP?
A) As the horsepower increases by one unit, the mean 0 to 60 miles per hour
acceleration time will decrease by an estimated 0.0200 seconds without taking into
consideration all the other independent variables included in the model.
B) As the 0 to 60 miles per hour acceleration time increases by one second, the mean
horsepower will decrease by an estimated 0.0200 unit without taking into consideration
all the other independent variables included in the model.
C) As the horsepower increases by one unit, the mean 0 to 60 miles per hour
acceleration time will decrease by an estimated 0.0200 seconds taking into
consideration all the other independent variables included in the model.
D) As the 0 to 60 miles per hour acceleration time increases by one second, the mean
horsepower will decrease by an estimated 0.0200 unit taking into consideration all the
other independent variables included in the model.
TABLE 16-11
The manager of a health club has recorded mean attendance in newly introduced step
classes over the last 15 months: 32.1, 39.5, 40.3, 46.0, 65.2, 73.1, 83.7, 106.8, 118.0,
133.1, 163.3, 182.8, 205.6, 249.1, and 263.5. She then used Microsoft Excel to obtain
the following partial output for both a first- and second-order autoregressive model.
SUMMARY OUTPUT – 2nd Order Model
SUMMARY OUTPUT – 1st Order Model
Referring to Table 16-11, using the first-order model, the forecast of mean attendance
for month 17 is ________.
In a local cellular phone area, company A accounts for 60% of the cellular phone
market, while company B accounts for the remaining 40% of the market. Of the cellular
calls made with company A, 1% of the calls will have some sort of interference, while
2% of the cellular calls with company B will have interference. If a cellular call is
selected at random, the probability that it will not have interference is
A) 0.014.
B) 0.028.
C) 0.14.
D) 0.986.

Using the best-subsets approach to model building, models are being considered when
their
A) Cp > k.
B) Cpk.
C) Cp > (k + 1).
D) Cp (k + 1).
You have collected data on the number of complaints for 6 different brands of
automobiles sold in the United States over a 10-year period. Which of the following is
the best for presenting the data?
A) a contingency table
B) a stem-and-leaf display
C) a time-series plot
D) a side-by-side bar chart
A manager of a product sales group believes the number of sales made by an employee
depends on how many years that employee has been with the company and how he/she
scored on a business aptitude test. A random sample of 38 employees was selected to
collect data on their number of sales, number of years with the company and scores on a

business aptitude test. Which of the following would you perform to draw a conclusion
on the belief?
A) One-way ANOVA
B) Simple linear regression
C) Two-way ANOVA
D) Multiple linear regression
Simple probability is also called
A) marginal probability.
B) joint probability.
C) conditional probability.
D) Bayes’ theorem.
TABLE 11-7
A campus researcher wanted to investigate the factors that affect visitor travel time in a
complex, multilevel building on campus. Specifically, he wanted to determine whether
different building signs (building maps versus wall signage) affect the total amount of
time visitors require to reach their destination and whether that time depends on
whether the starting location is inside or outside the building. Three subjects were
assigned to each of the combinations of signs and starting locations, and travel time in
seconds from beginning to destination was recorded. An Excel output of the appropriate
analysis is given below:
ANOVA
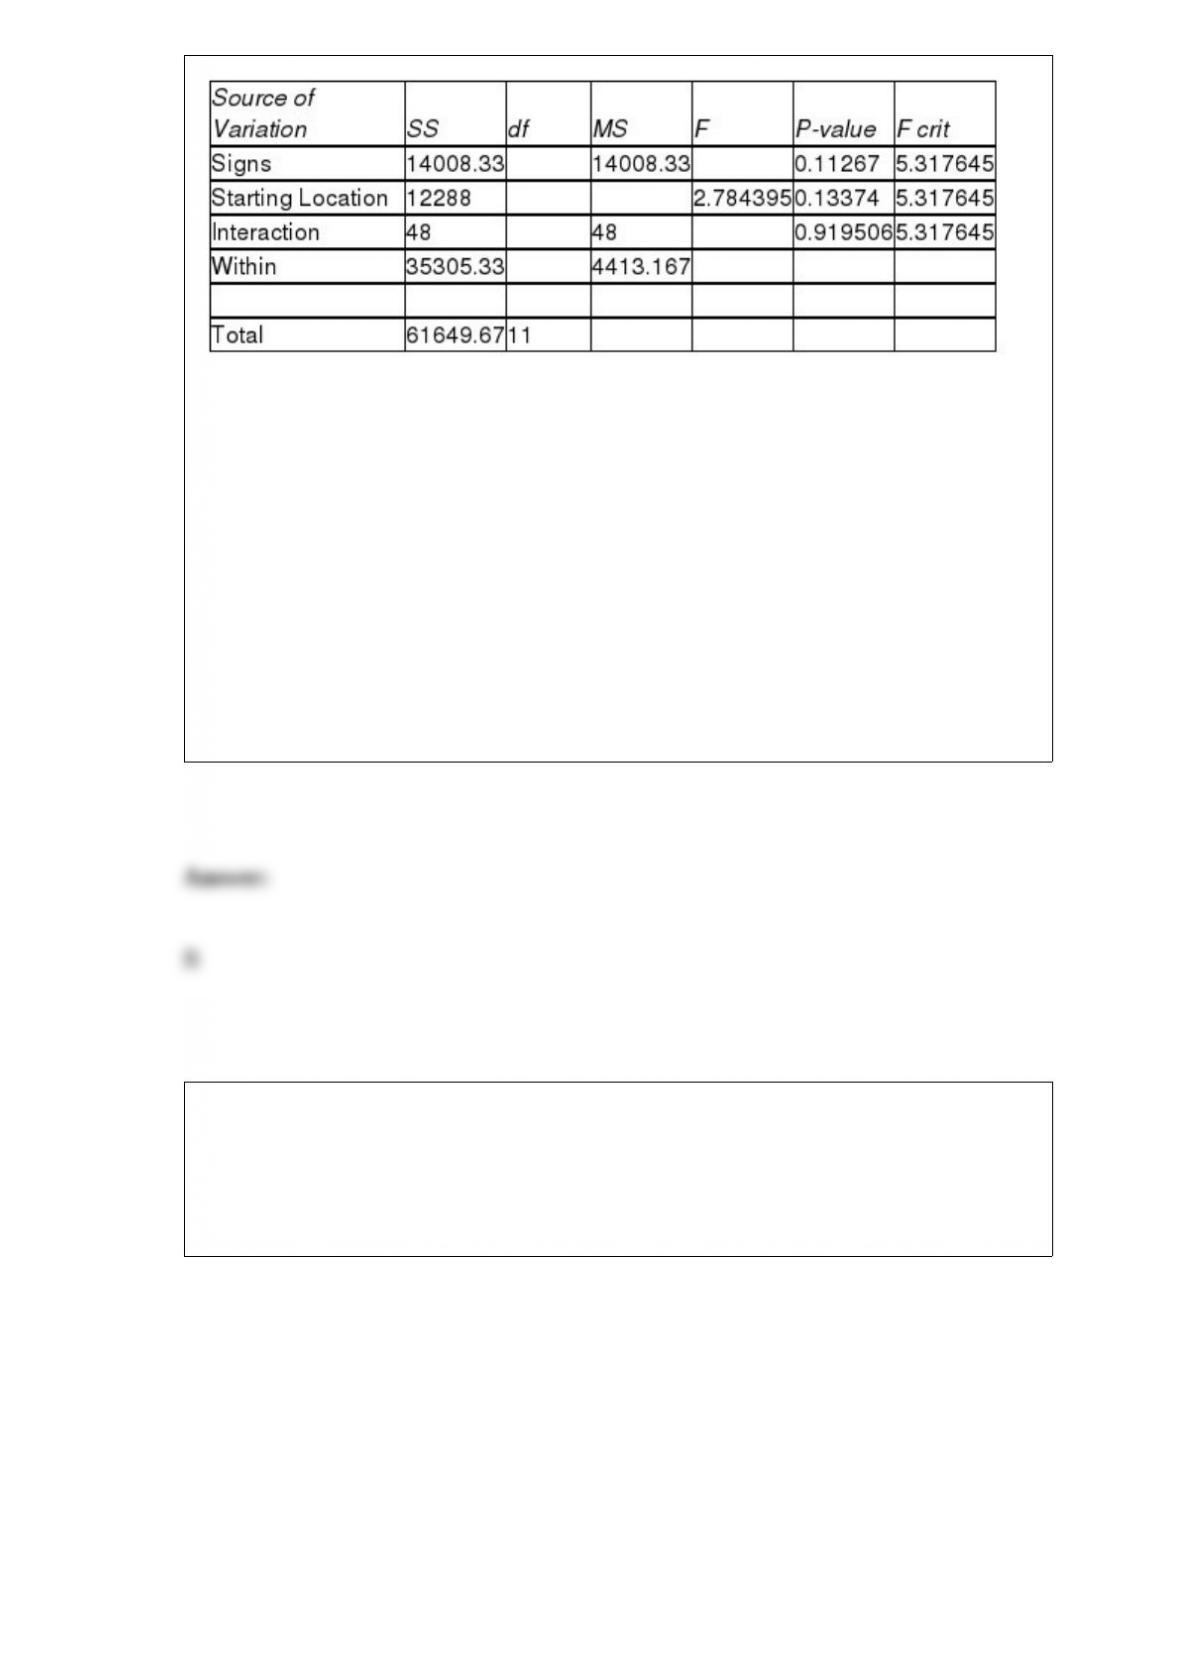
Referring to Table 11-7, at 10% level of significance,
A) there is sufficient evidence to conclude that the difference between the mean
traveling time for the different starting locations depends on the types of signs.
B) there is insufficient evidence to conclude that the difference between the mean
traveling time for the different types of signs depends on the starting locations.
C) there is sufficient evidence to conclude that the difference between the mean
traveling time for the different starting locations does not depend on the types of signs.
D) None of the above.
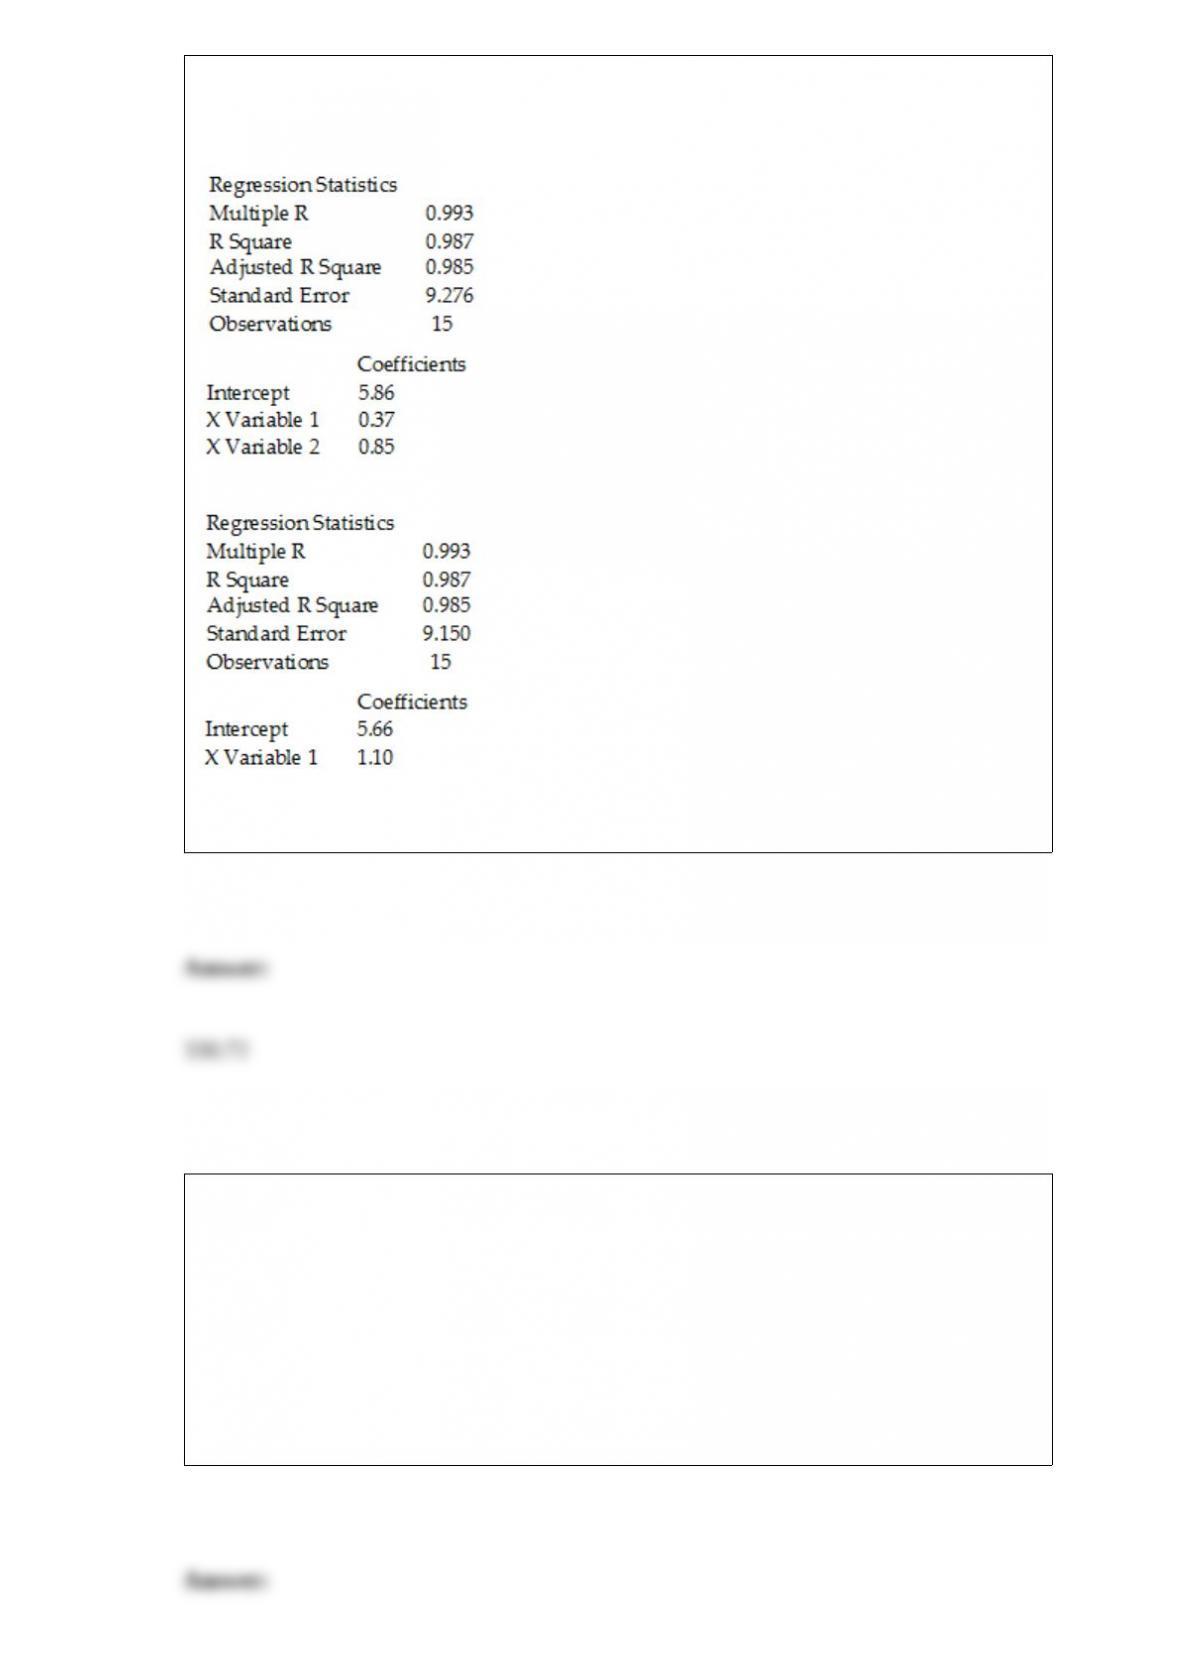
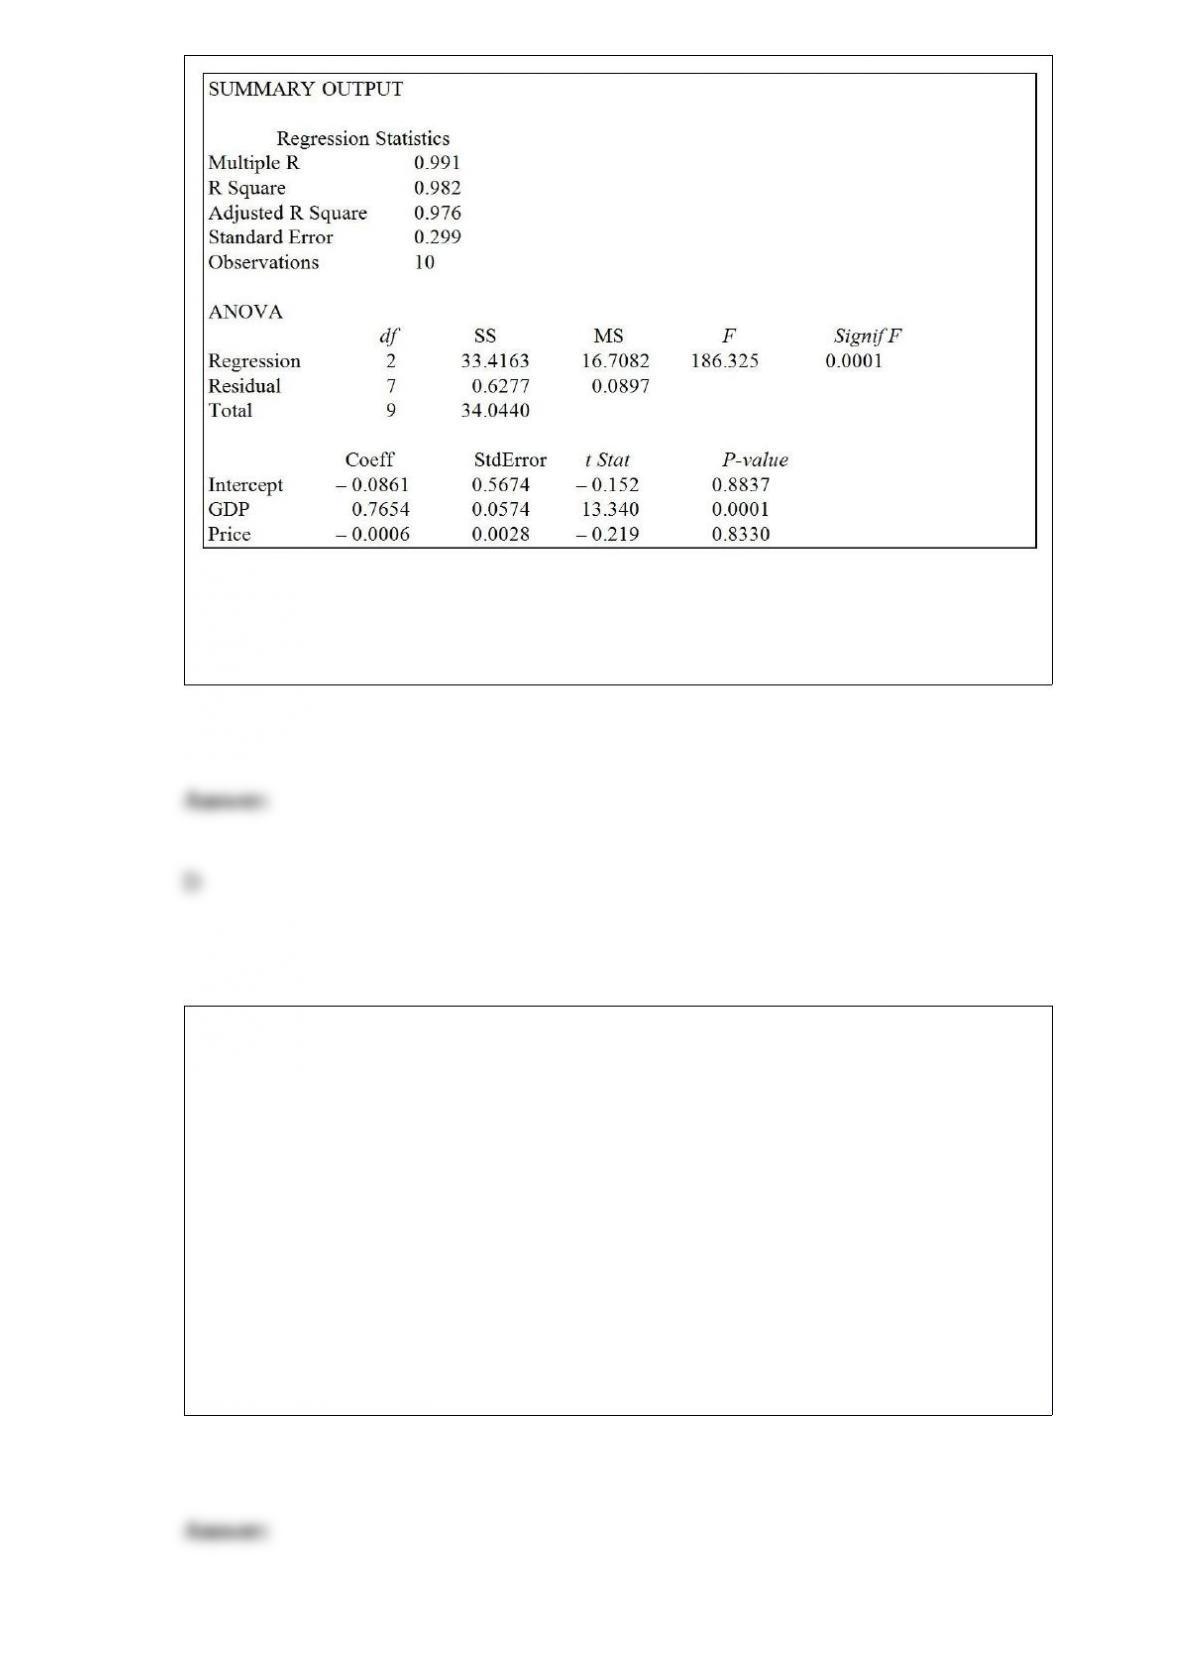
Referring to Table 14-3, the p-value for the aggregated price index is
TABLE 14-3
An economist is interested to see how consumption for an economy (in $ billions) is
influenced by gross domestic product ($ billions) and aggregate price (consumer price
index). The Microsoft Excel output of this regression is partially reproduced below.
A) 0.05.
B) 0.01.
C) 0.001.
D) None of the above.
The chancellor of a major university was concerned about alcohol abuse on her campus
and wanted to find out the proportion of students at her university who visited campus
bars on the weekend before the final exam week. Her assistant took a random sample of
250 students. The portion of students in the sample who visited campus bars on the
weekend before the final exam week is an example of
A) a summary table.
B) an ogive.
C) a parameter.
D) a statistic
A buyer for a manufacturing plant suspects that his primary supplier of raw materials is
overcharging. In order to determine if his suspicion is correct, he contacts a second
supplier and asks for the prices on various identical materials. He wants to compare
these prices with those of his primary supplier. He collected data on 6 different
materials from both suppliers. He believes that the differences are normally distributed.
Which of the following tests will be the most appropriate?
A) Pooled-variance t test
B) Paired t test
C) Wilcoxon rank sum test
D) McNemar test
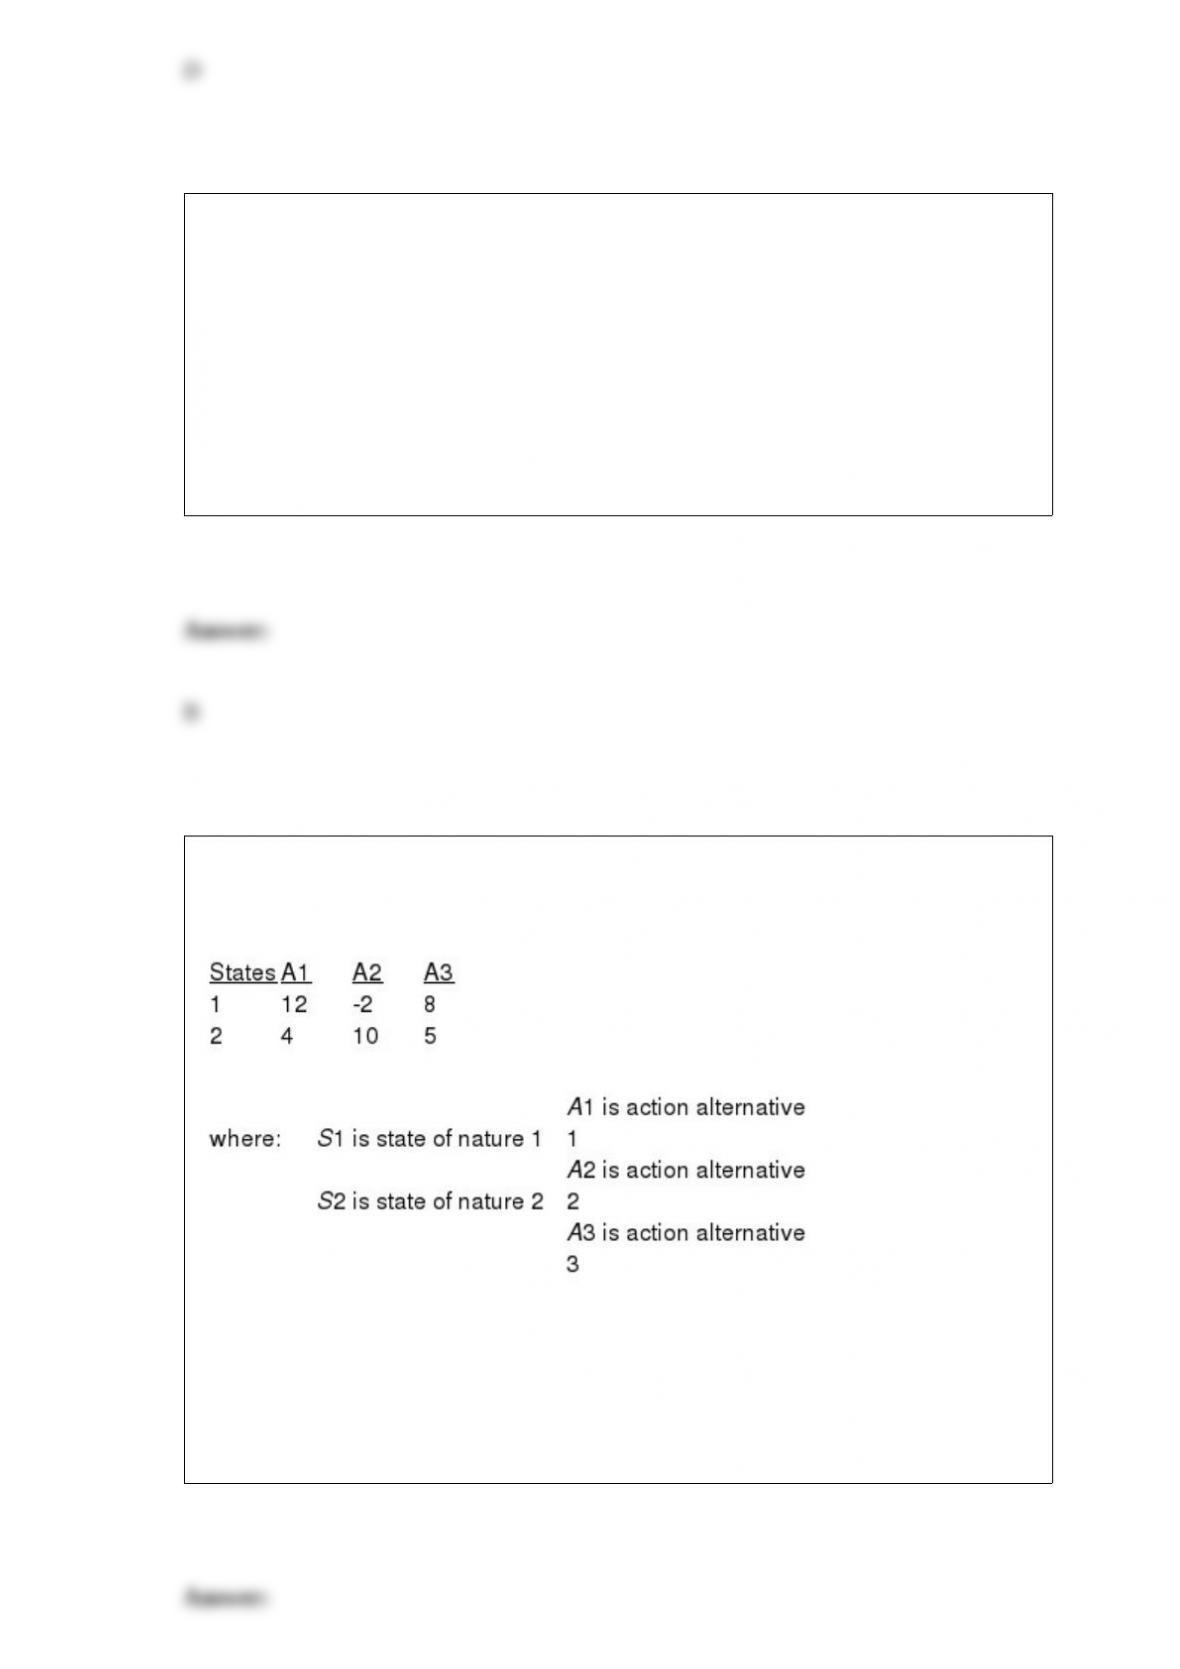
TABLE 19-1
The following payoff table shows profits associated with a set of 3 alternatives under 2
possible states of nature
Referring to Table 19-1, if the probability of S1 is 0.5, then the EVPI for the payoff
table is
A) -3.
B) 3.
C) 8.
D) 11.
The manager of the customer service division of a major consumer electronics company
is interested in determining whether the customers who have purchased a Blu-ray
player made by the company over the past 12 months are satisfied with their products.
The population of interest is
A) all the customers who have bought a Blu-ray player made by the company over the
past 12 months.
B) all the customers who have bought a Blu-ray player made by the company and
brought it in for repair over the past 12 months.
C) all the customers who have used a Blu-ray player over the past 12 months.
D) all the customers who have ever bought a Blu-ray player made by the company.
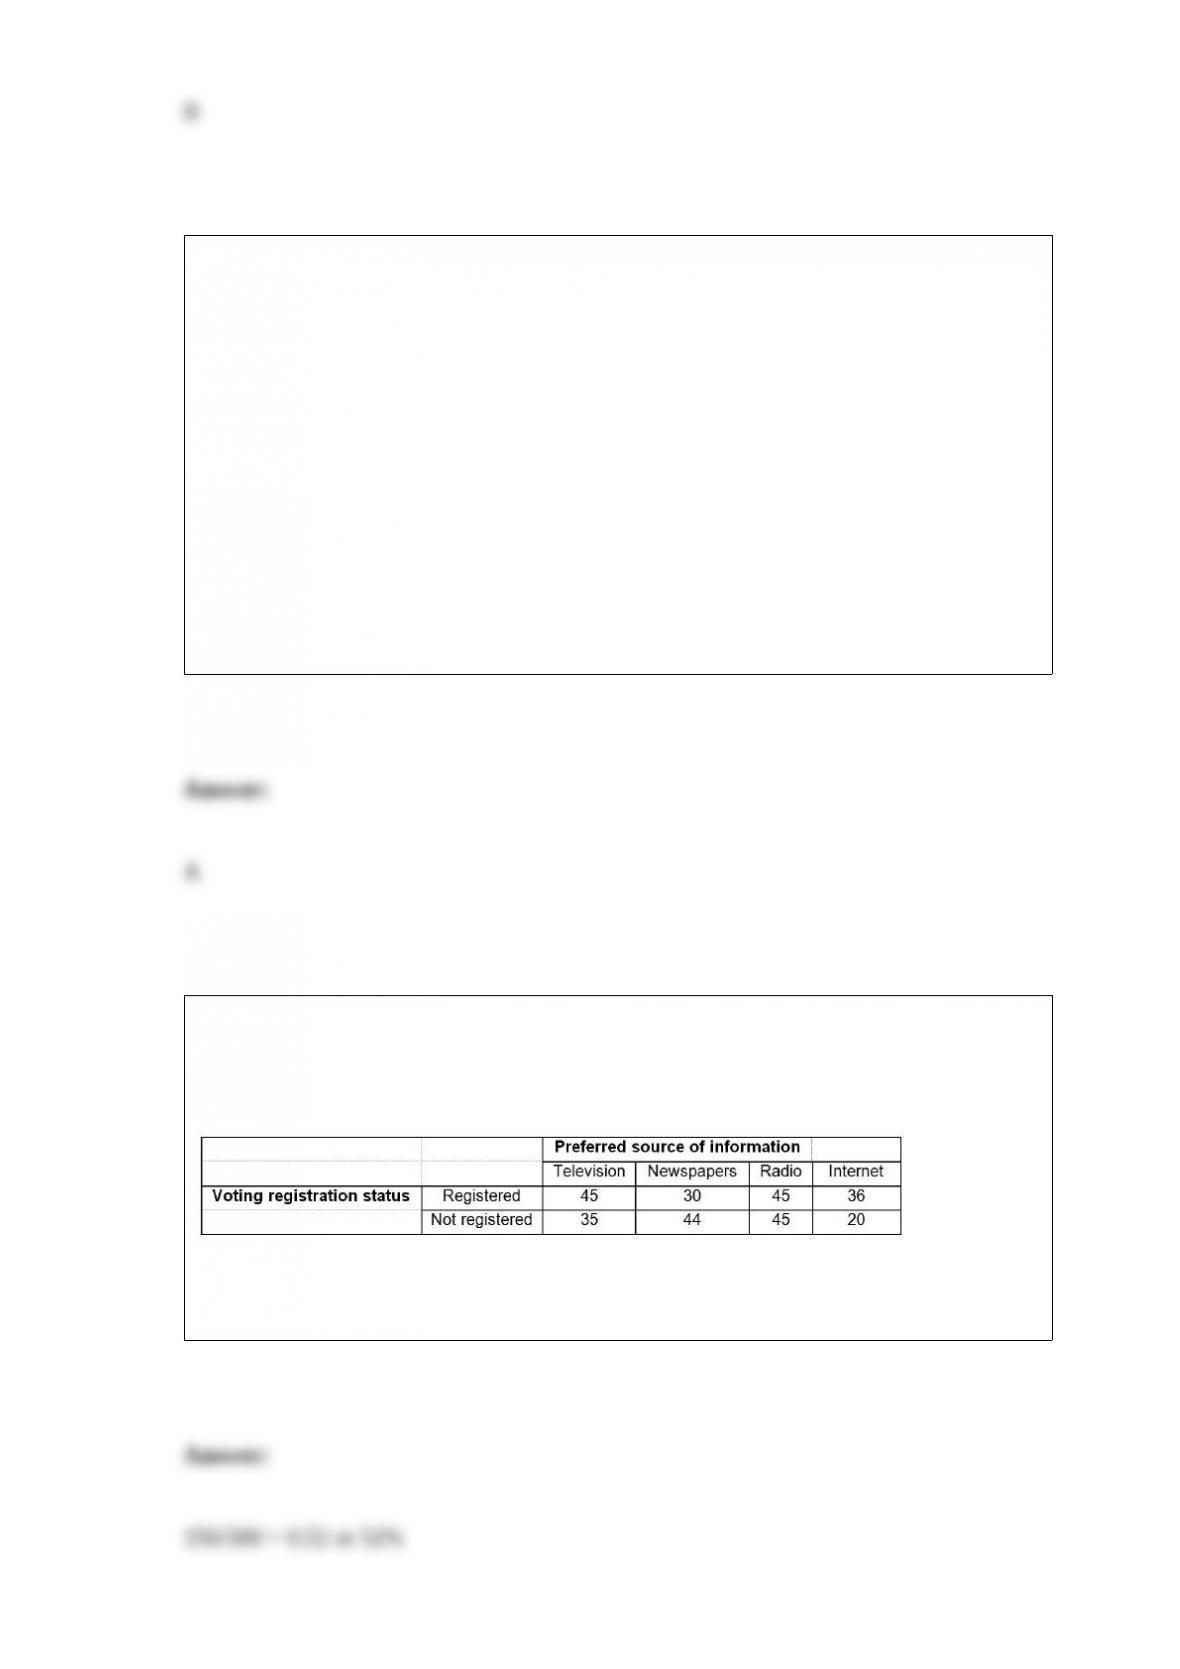
TABLE 4-11
A sample of 300 adults is selected. The contingency table below shows their registration
status and their preferred source of information on current events.
Referring to Table 4-11, if an adult is selected at random, what is the probability that
he/she is a registered voter?
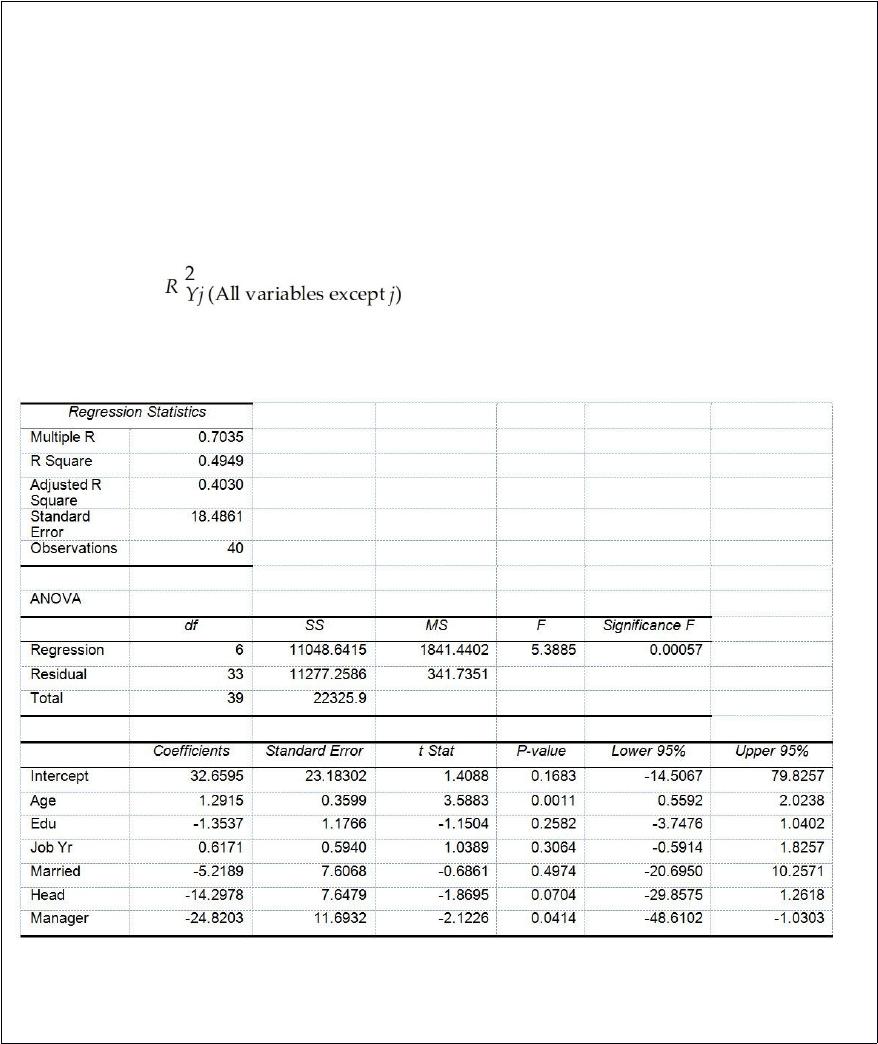
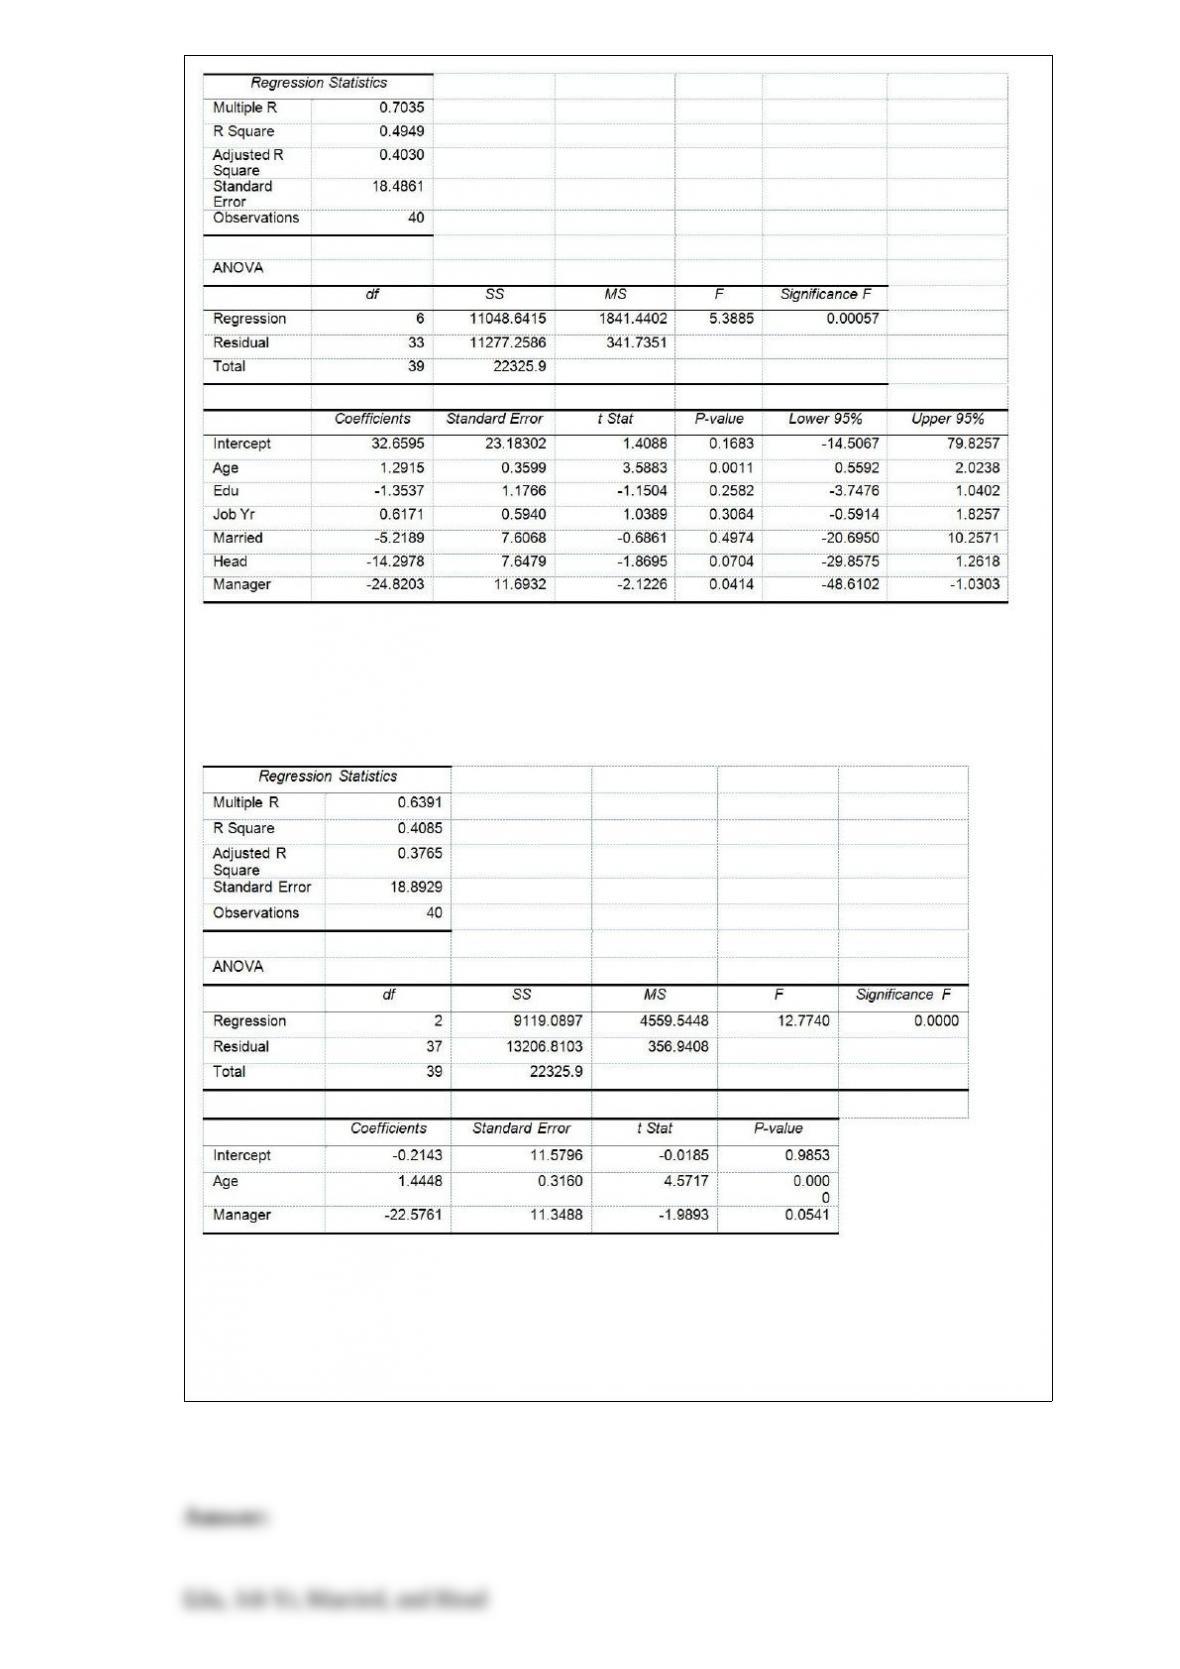
TABLE 17-10
Given below are results from the regression analysis where the dependent variable is
the number of weeks a worker is unemployed due to a layoff (Unemploy) and the
independent variables are the age of the worker (Age), the number of years of education
received (Edu), the number of years at the previous job (Job Yr), a dummy variable for
marital status (Married: 1 = married, 0 = otherwise), a dummy variable for head of
household (Head: 1 = yes, 0 = no) and a dummy variable for management position
(Manager: 1 = yes, 0 = no). We shall call this Model 1. The coefficient of partial
determination ( ) of each of the 6 predictors are, respectively,
0.2807, 0.0386, 0.0317, 0.0141, 0.0958, and 0.1201.
Model 2 is the regression analysis where the dependent variable is Unemploy and the
independent variables are Age and Manager. The results of the regression analysis are
given below:
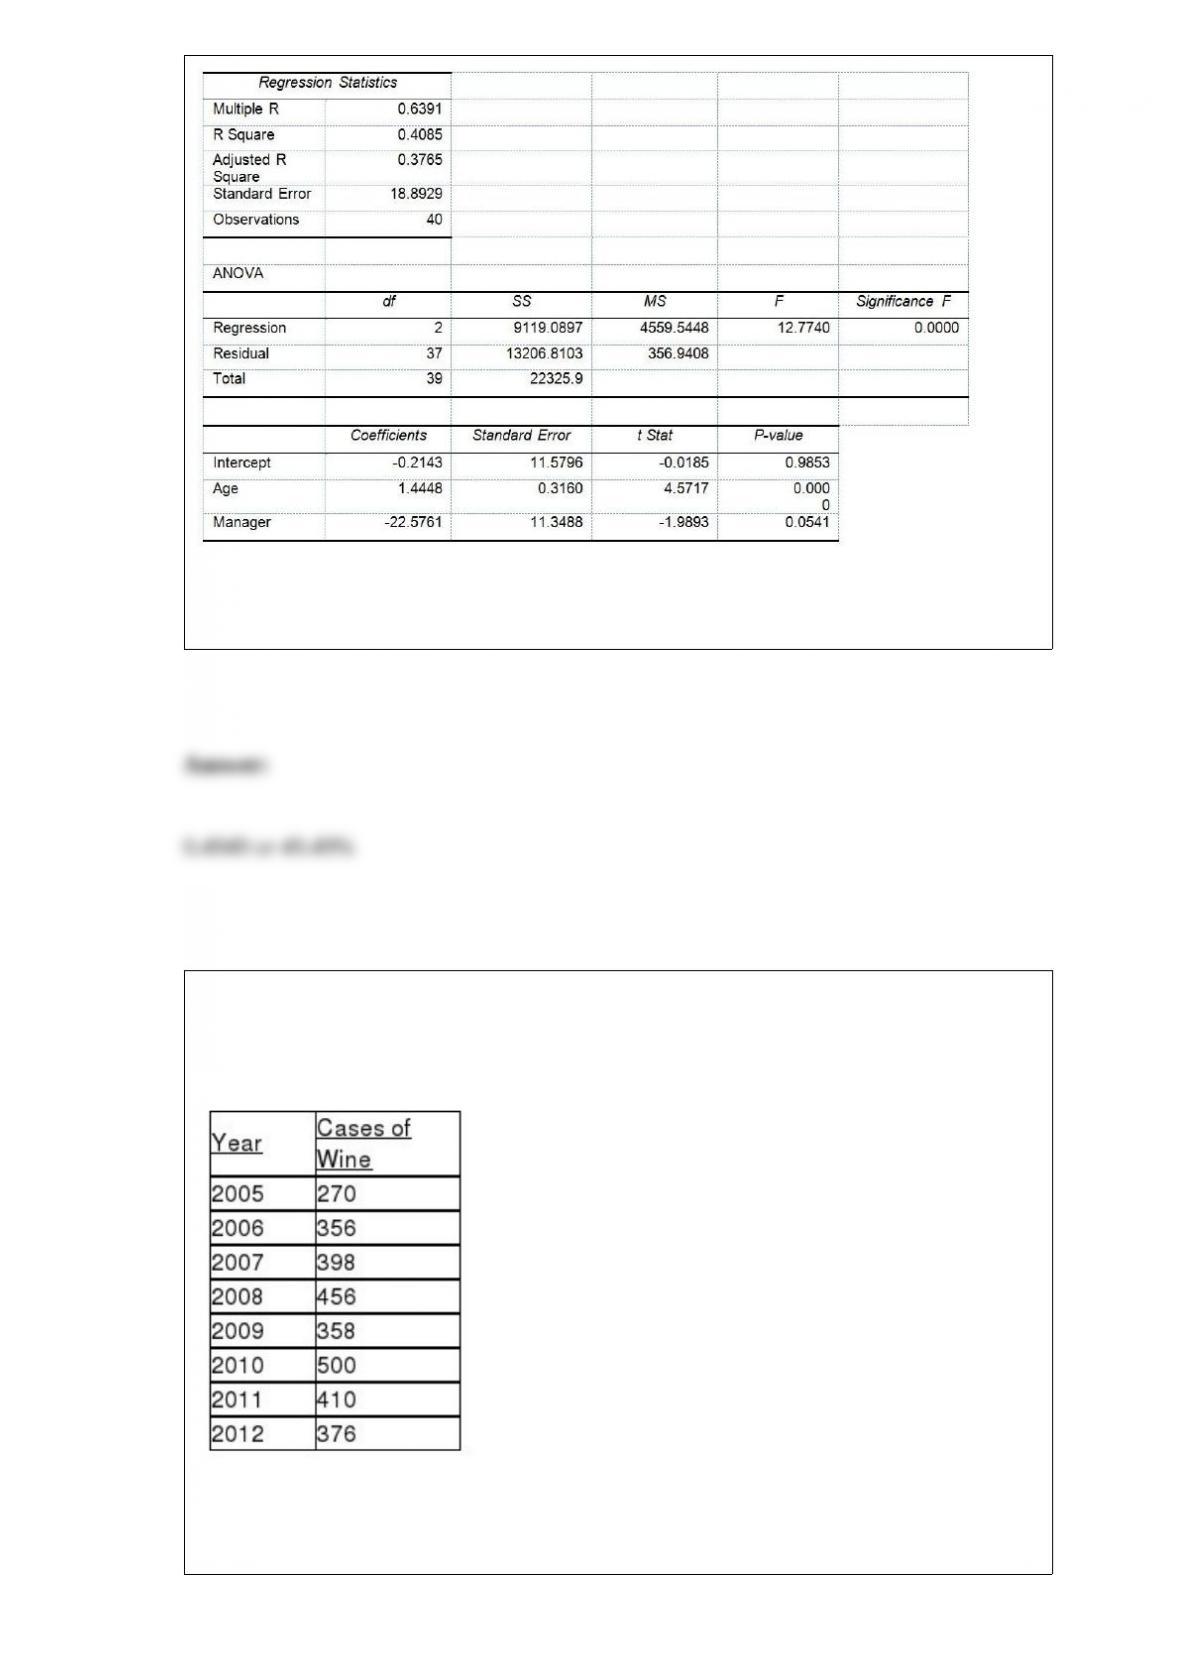
Referring to Table 17-10, Model 1, ________ of the variation in the number of weeks a
worker is unemployed due to a layoff can be explained by the six independent
variables.
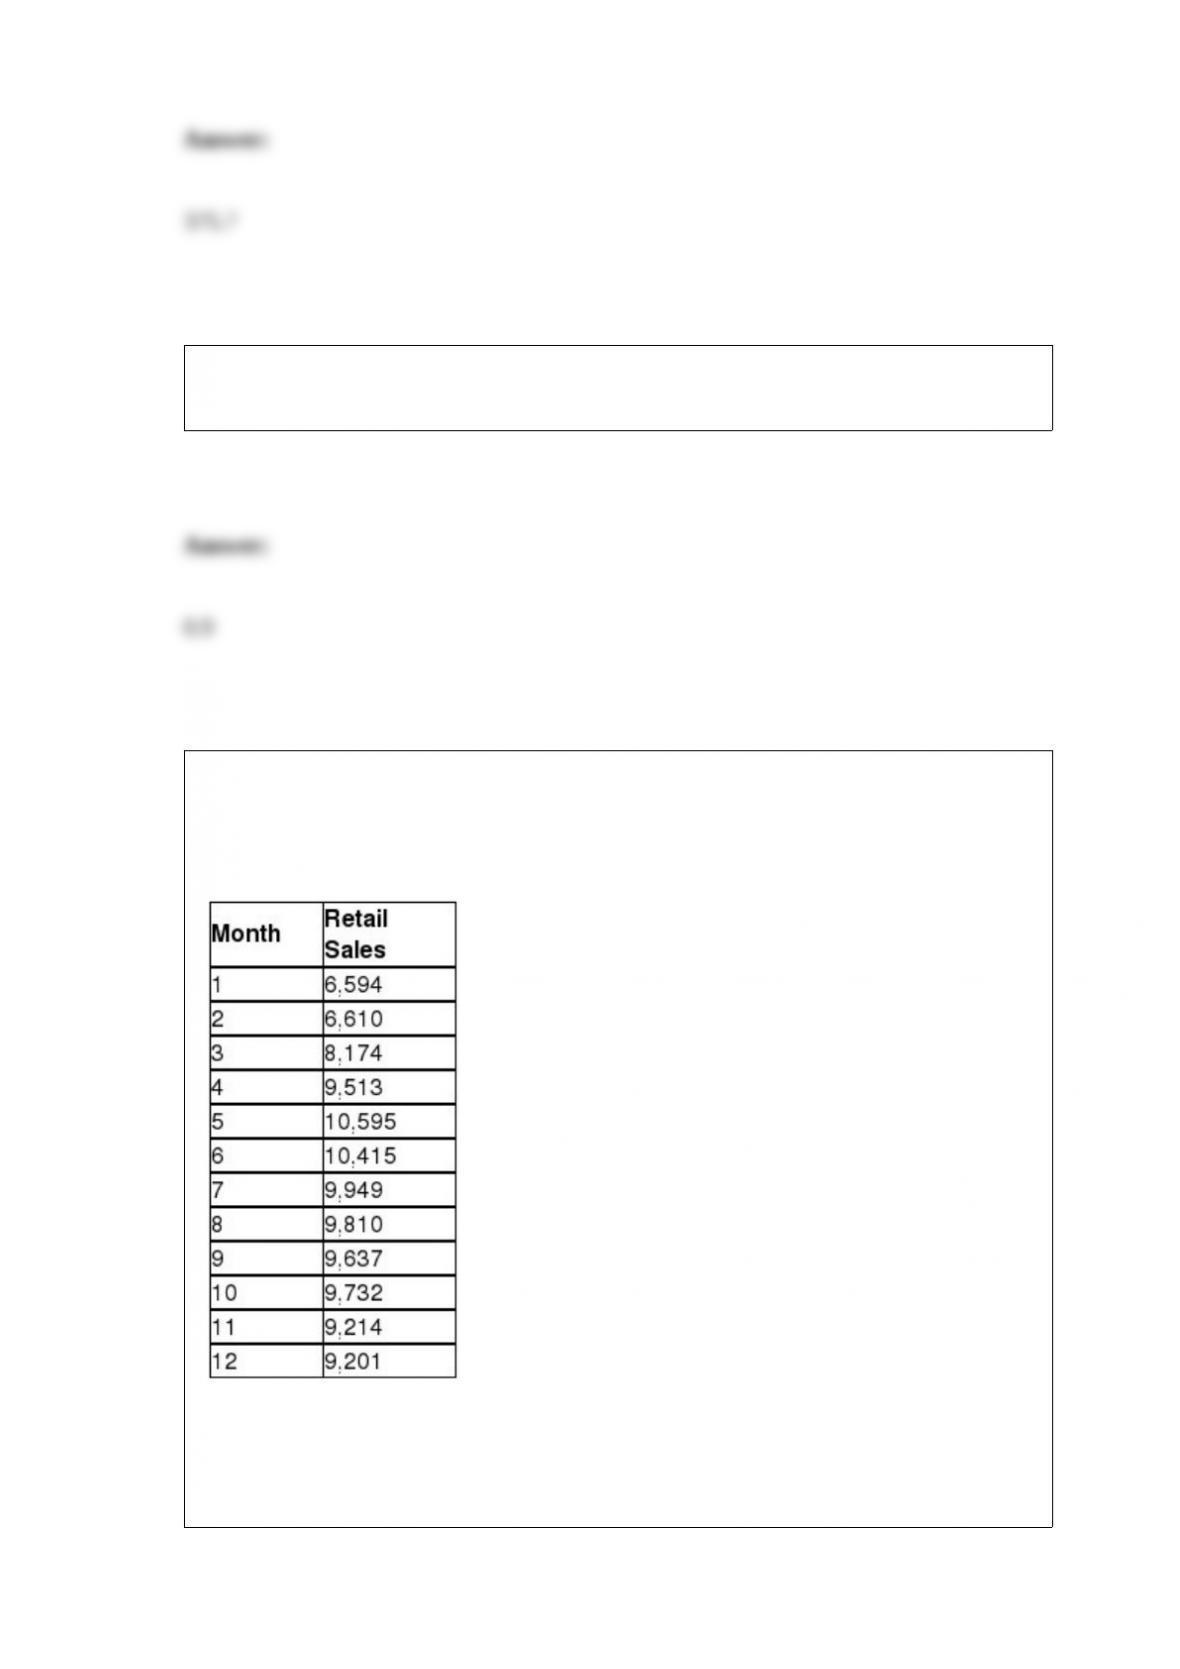
TABLE 16-4
The number of cases of merlot wine sold by a Paso Robles winery in an 8-year period
follows.
Referring to Table 16-4, exponential smoothing with a weight or smoothing constant of
0.4 will be used to smooth the wine sales. The value of E5, the smoothed value for 2009
is ________.
Suppose A and B are mutually exclusive events where P(A) = 0.4 and P(B) = 0.5. Then
P(A or B) = ________.
TABLE 16-13
Given below is the monthly time-series data for U.S. retail sales of building materials
over a specific year.
The results of the linear trend, quadratic trend, exponential trend, first-order
autoregressive, second-order autoregressive and third-order autoregressive model are
presented below in which the coded month for the 1st month is 0:
Linear trend model:
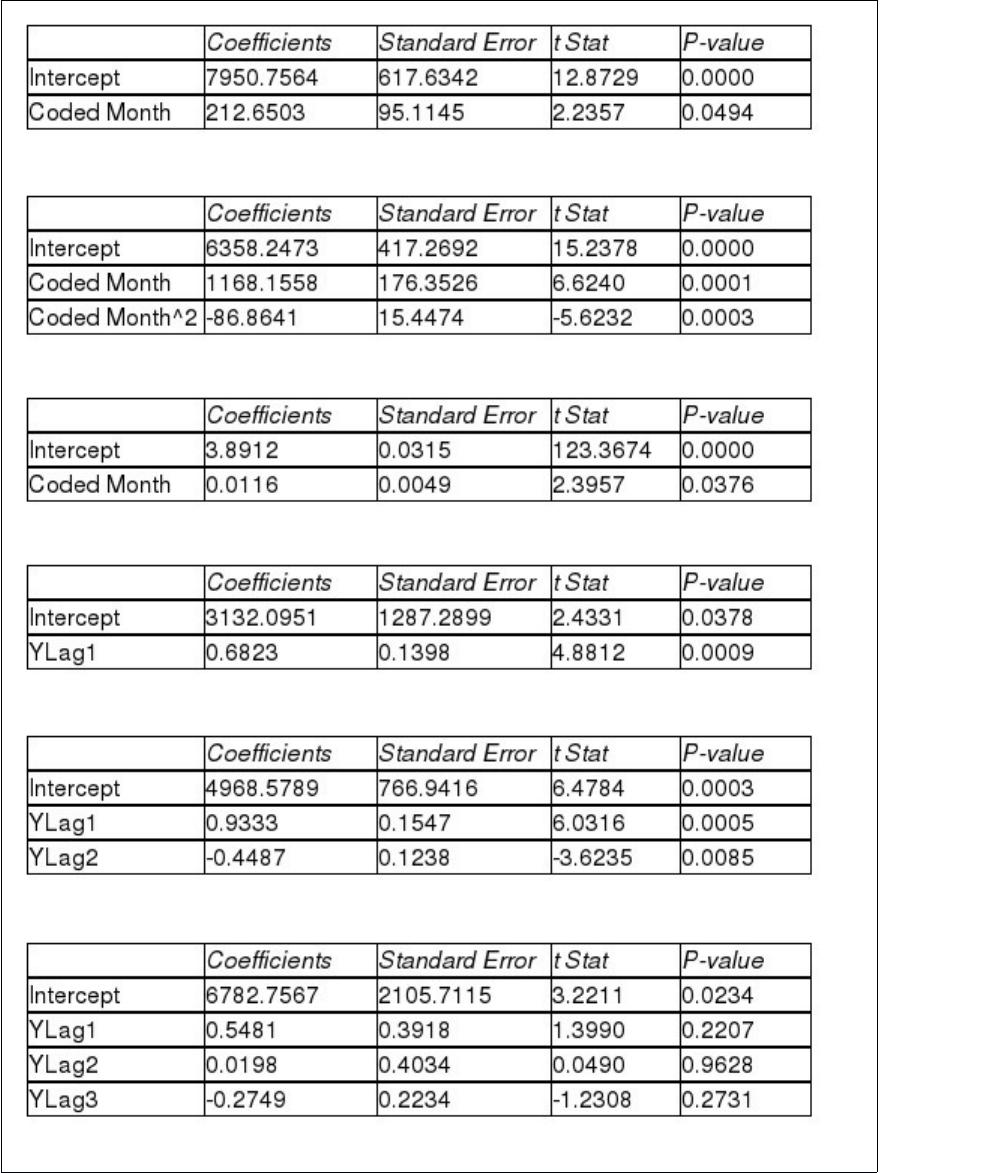
Quadratic trend model:
Exponential trend model:
First-order autoregressive:
Second-order autoregressive:
Third-order autoregressive:
Below is the residual plot of the various models:
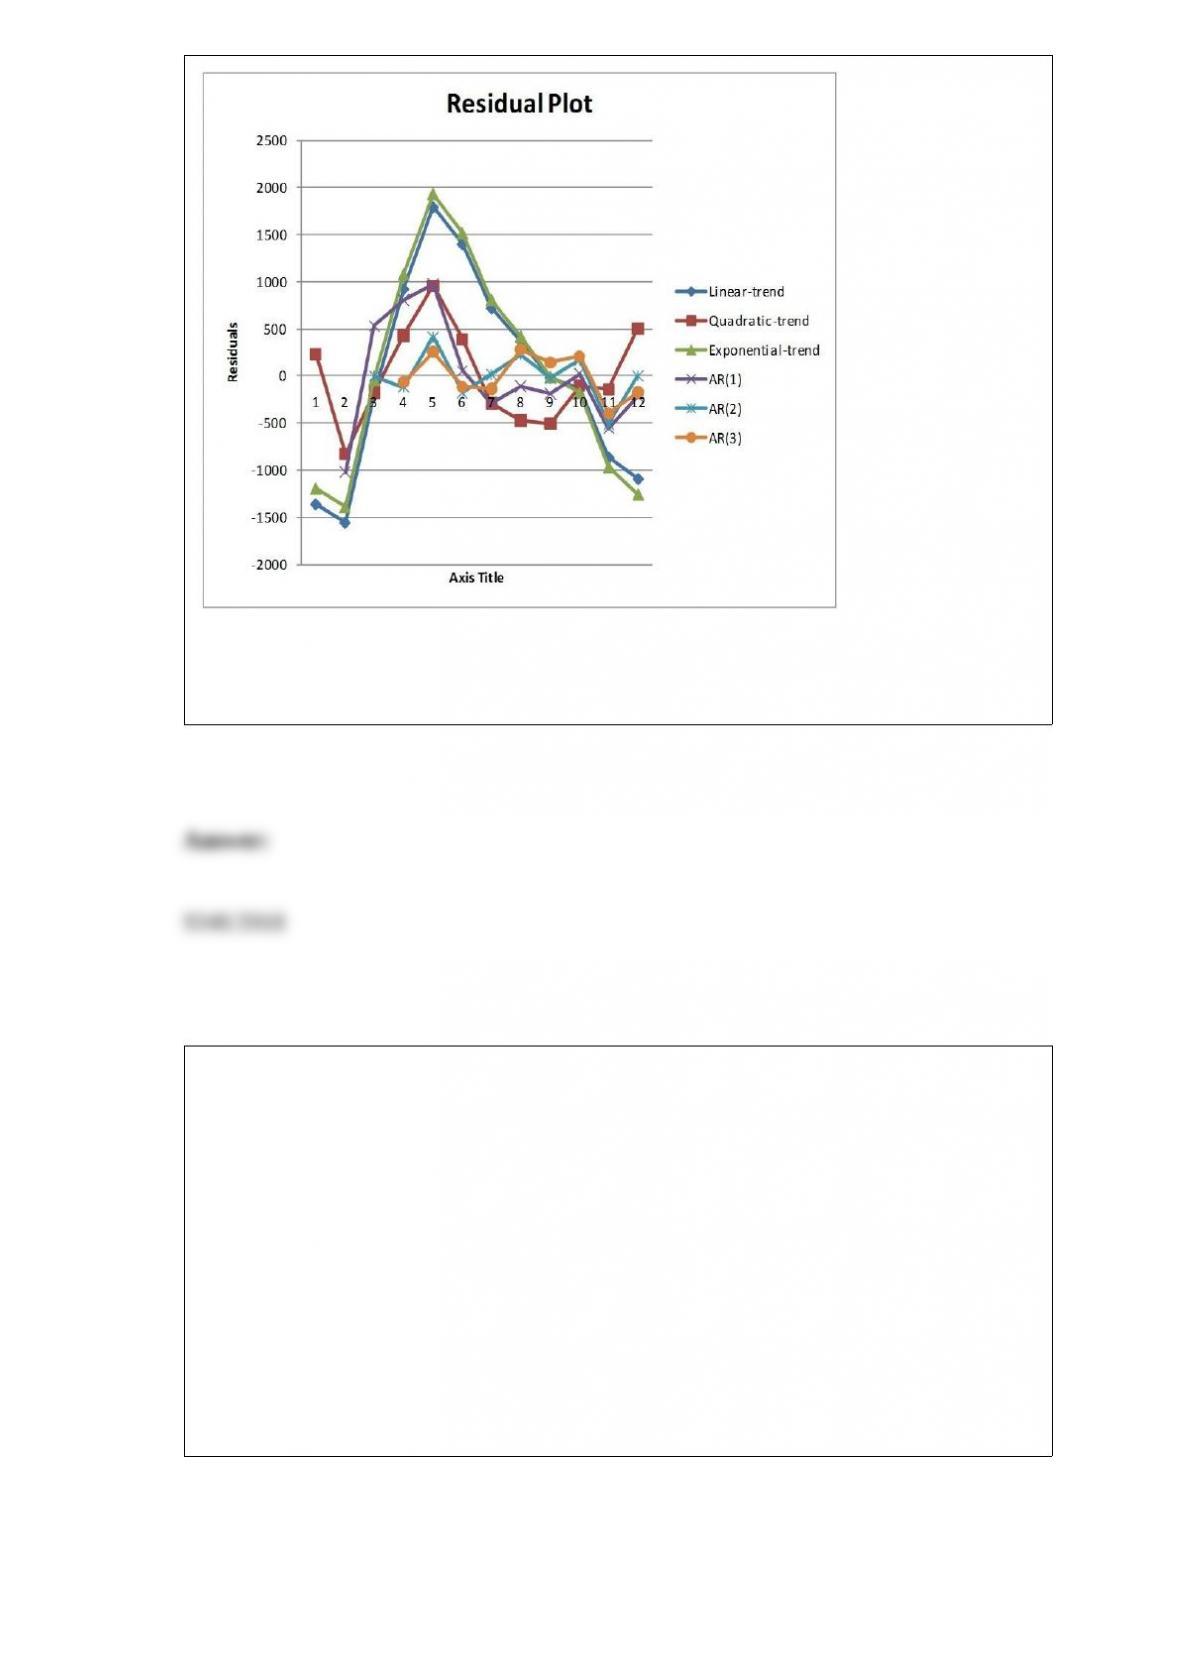
Referring to Table 16-13, what is the exponentially smoothed forecast for the 13th
month using a smoothing coefficient of W = 0.5 if the exponentially smooth value for
the 10th and 11th month are 9,746.3672 and 9,480.1836, respectively?
TABLE 17-12
The marketing manager for a nationally franchised lawn service company would like to
study the characteristics that differentiate home owners who do and do not have a lawn
service. A random sample of 30 home owners located in a suburban area near a large
city was selected; 15 did not have a lawn service (code 0) and 15 had a lawn service
(code 1). Additional information available concerning these 30 home owners includes
family income (Income, in thousands of dollars), lawn size (Lawn Size, in thousands of
square feet), attitude toward outdoor recreational activities (Attitude 0 = unfavorable, 1
= favorable), number of teenagers in the household (Teenager), and age of the head of
the household (Age).
The Minitab output is given below:
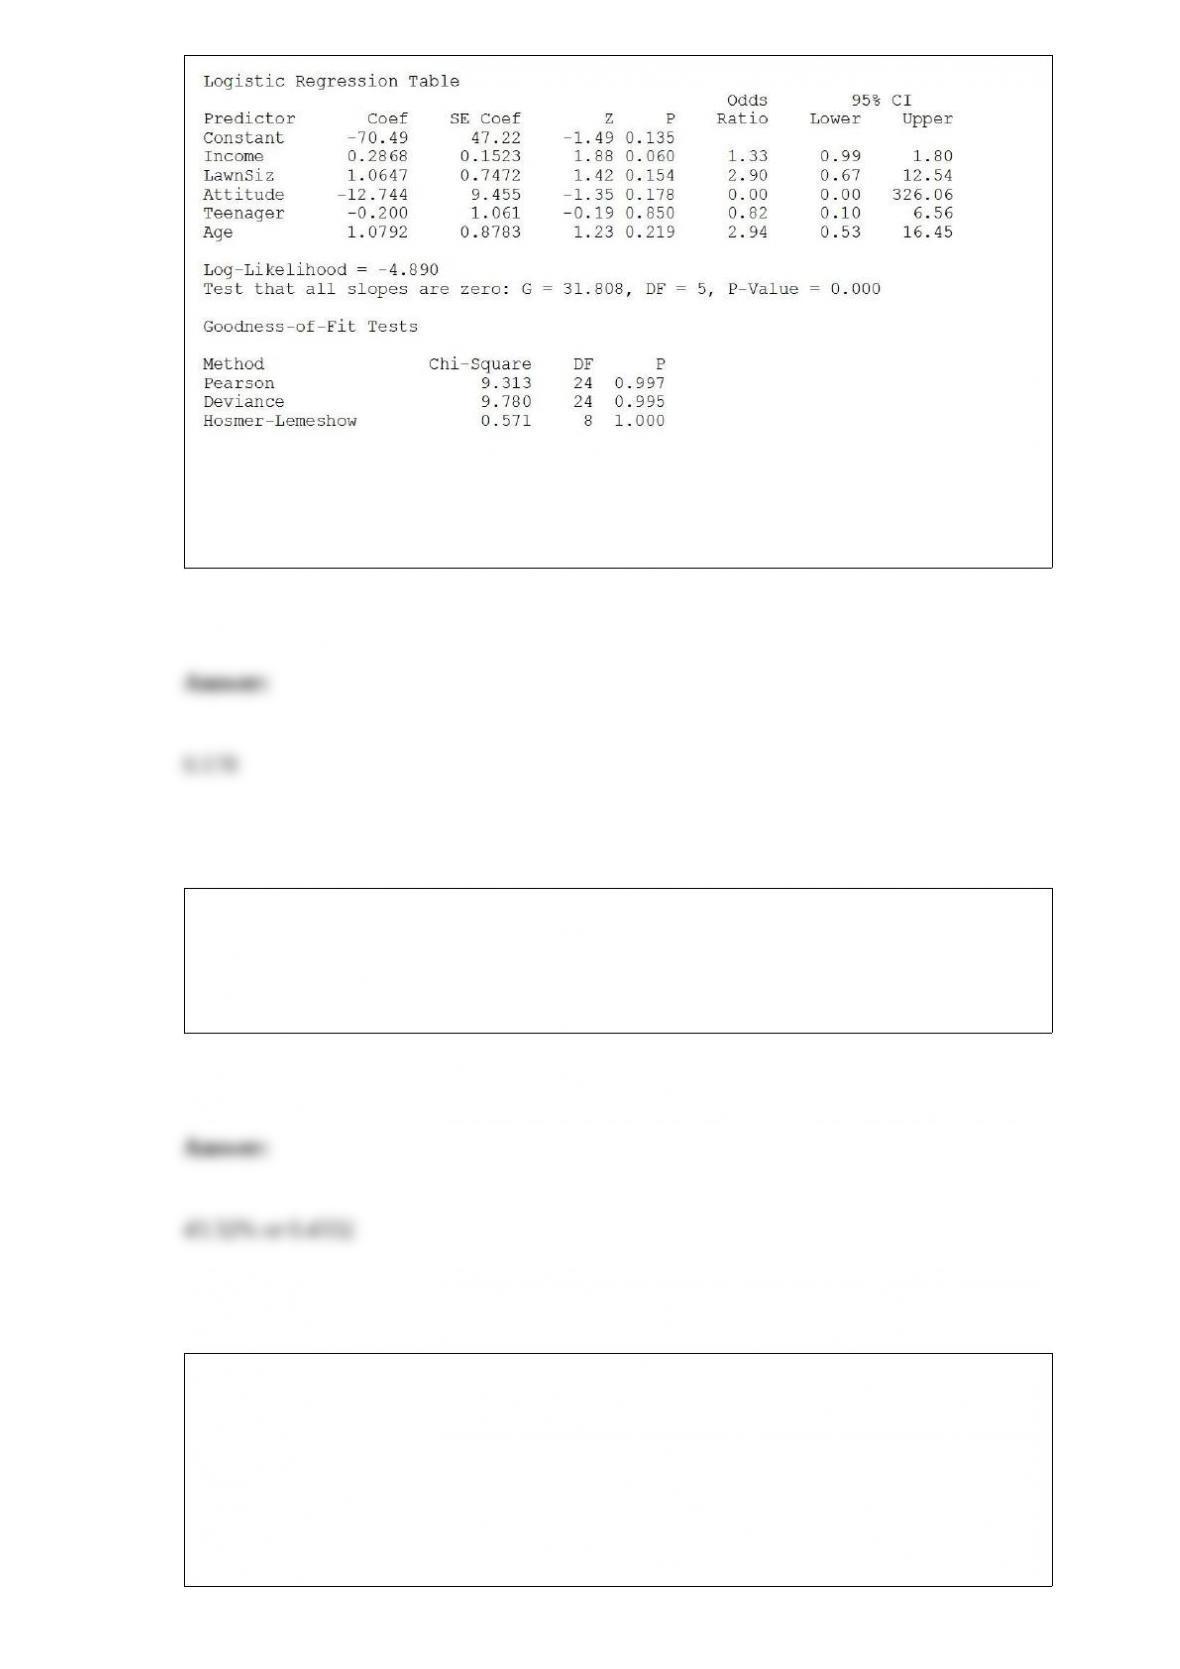
Referring to Table 17-12, what is the p-value of the test statistic when testing whether
Attitude makes a significant contribution to the model in the presence of the other
independent variables?
You were told that the mean score on a statistics exam is 75 with the scores normally
distributed. In addition, you know the probability of a score between 55 and 60 is
4.41% and that the probability of a score greater than 90 is 6.68%. What is the
probability of a score between 75 and 90?
TABLE 11-8
An important factor in selecting database software is the time required for a user to
learn how to use the system. To evaluate three potential brands (A, B and C) of database
software, a company designed a test involving five different employees. To reduce
variability due to differences among employees, each of the five employees is trained
on each of the three different brands. The amount of time (in hours) needed to learn
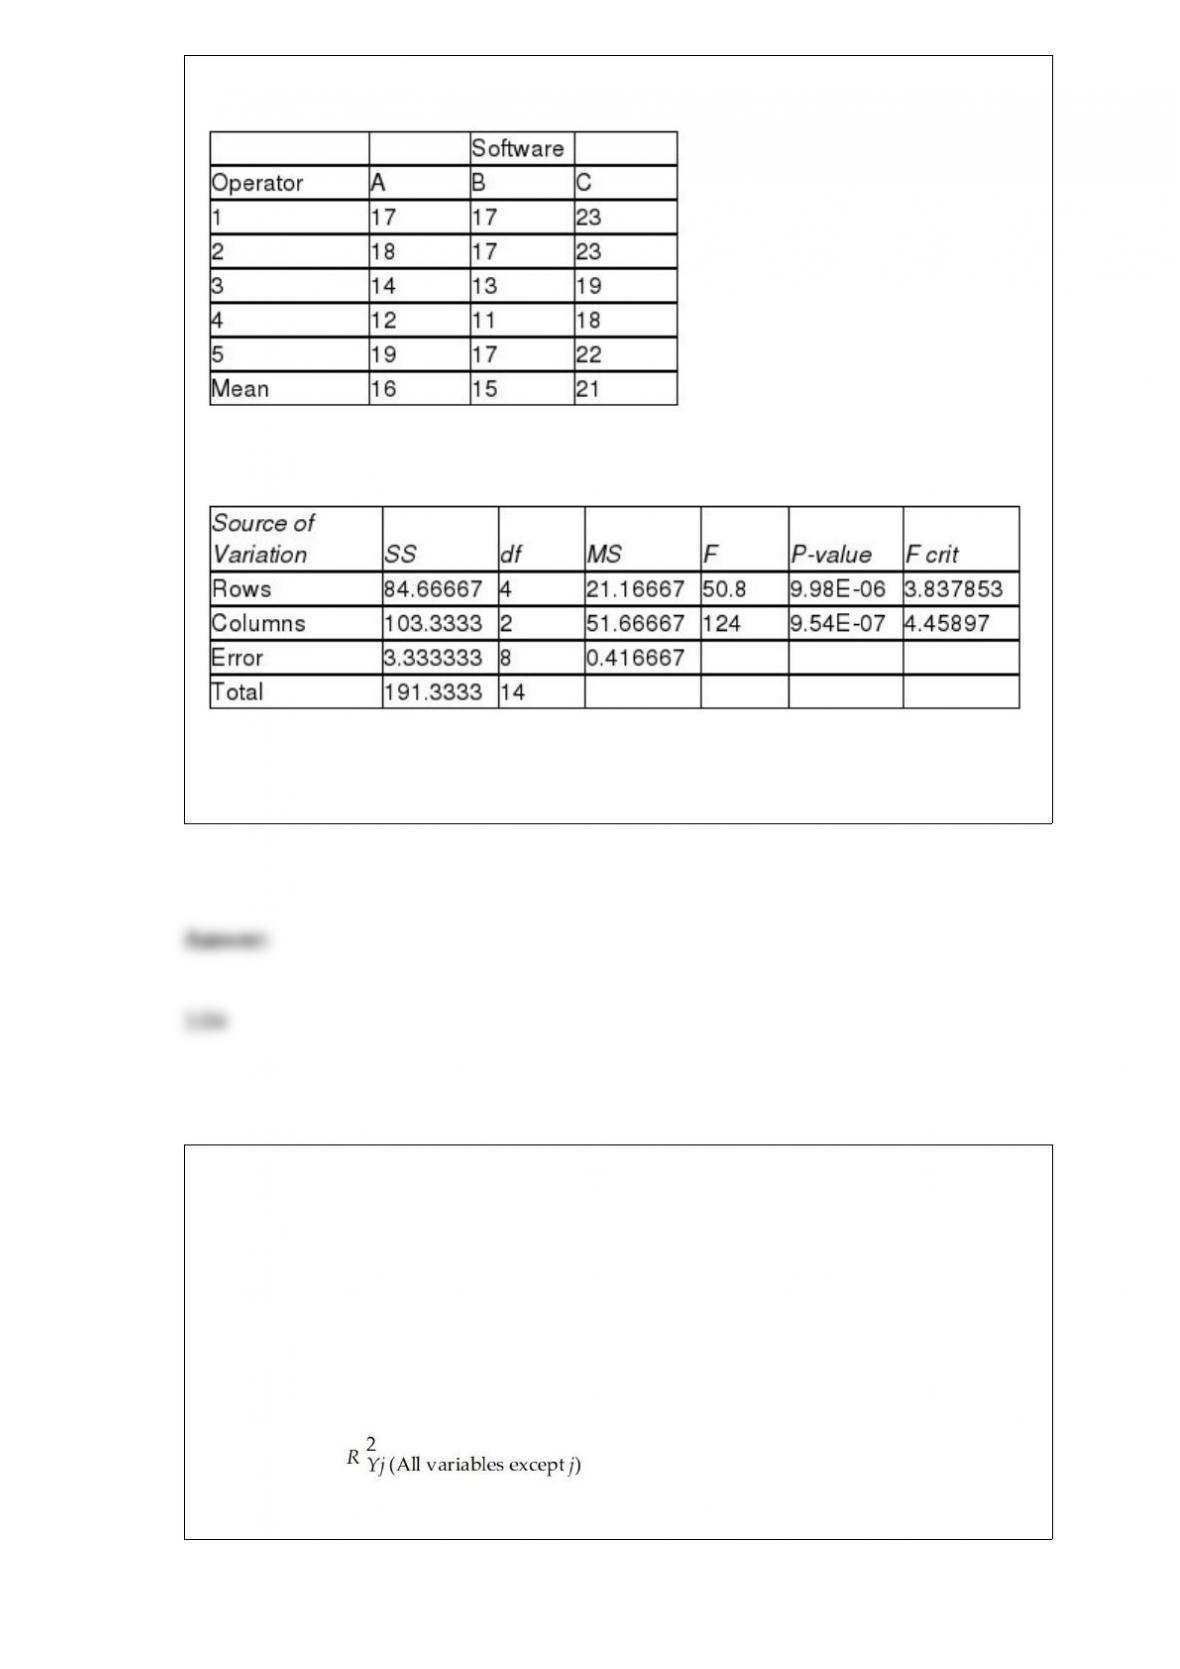
each of the three different brands is given below:
Below is the Excel output for the randomized block design:
Referring to Table 11-8, what is the critical value for testing the block effects at a 0.05
level of significance?
TABLE 17-10
Given below are results from the regression analysis where the dependent variable is
the number of weeks a worker is unemployed due to a layoff (Unemploy) and the
independent variables are the age of the worker (Age), the number of years of education
received (Edu), the number of years at the previous job (Job Yr), a dummy variable for
marital status (Married: 1 = married, 0 = otherwise), a dummy variable for head of
household (Head: 1 = yes, 0 = no) and a dummy variable for management position
(Manager: 1 = yes, 0 = no). We shall call this Model 1. The coefficient of partial
determination ( ) of each of the 6 predictors are, respectively,
0.2807, 0.0386, 0.0317, 0.0141, 0.0958, and 0.1201.
Model 2 is the regression analysis where the dependent variable is Unemploy and the
independent variables are Age and Manager. The results of the regression analysis are
given below:
Referring to Table 17-10, Model 1, which of the six independent variables (Age, Edu,
Job Yr, Married, Head and Manager) is (are) insignificant in affecting the dependent
variable using a 5% level of significance after taking into account the effect of the
remaining independent variables?

TABLE 16-5
The number of passengers arriving at San Francisco on the Amtrak cross-country
express on 6 successive Mondays were: 60, 72, 96, 84, 36, and 48.
Referring to Table 16-5, the number of arrivals will be smoothed with a 3-term moving
average. There will be a total of ________ smoothed values.