TABLE 10-6
To investigate the efficacy of a diet, a random sample of 16 male patients is selected
from a population of adult males using the diet. The weight of each individual in the
sample is taken at the start of the diet and at a medical follow-up 4 weeks later.
Assuming that the population of differences in weight before versus after the diet
follow a normal distribution, the t-test for related samples can be used to determine if
there was a significant decrease in the mean weight during this period. Suppose the
mean decrease in weights over all 16 subjects in the study is 3.0 pounds with the
standard deviation of differences computed as 6.0 pounds.
Referring to Table 10-6, the p-value for a two-tail is ________.
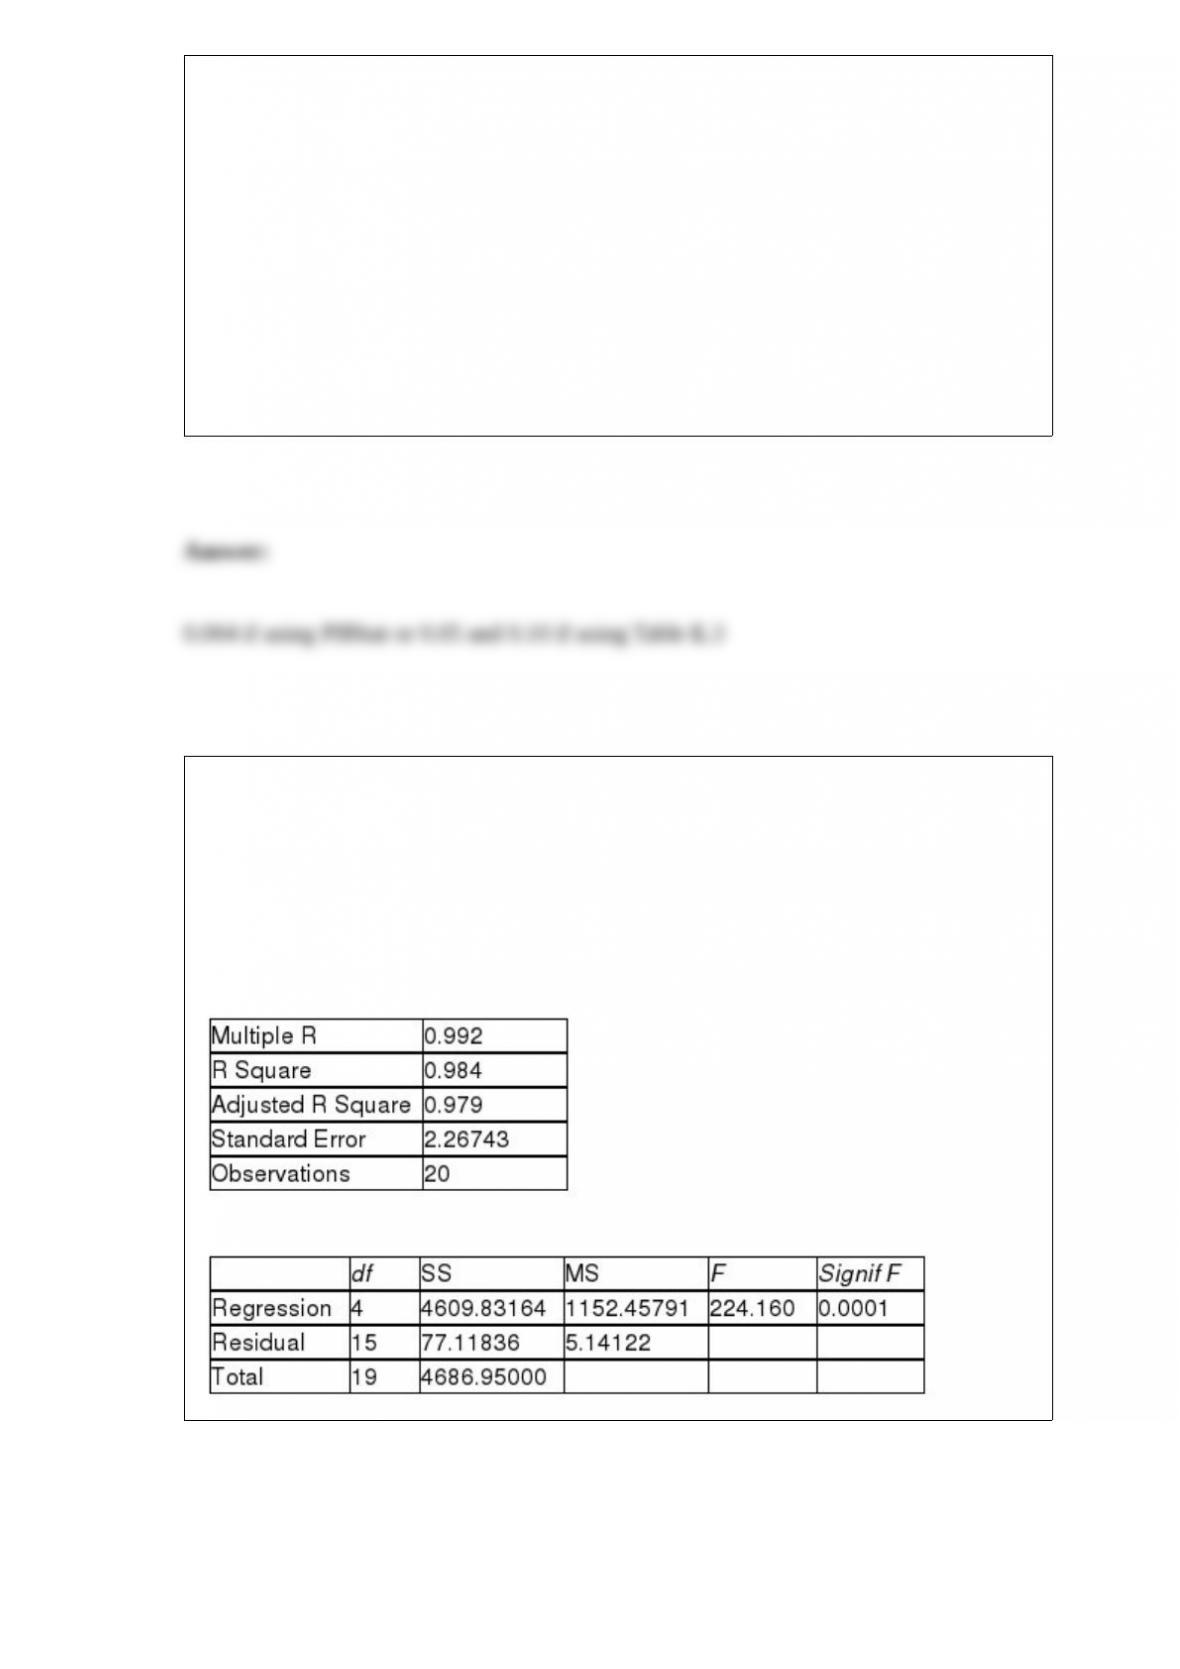
TABLE 17-3
A financial analyst wanted to examine the relationship between salary (in $1,000) and 4
variables: age (X1 = Age), experience in the field (X2 = Exper), number of degrees (X3 =
Degrees), and number of previous jobs in the field (X4 = Prevjobs). He took a sample of
20 employees and obtained the following Microsoft Excel output:
SUMMARY OUTPUT
Regression Statistics
ANOVA
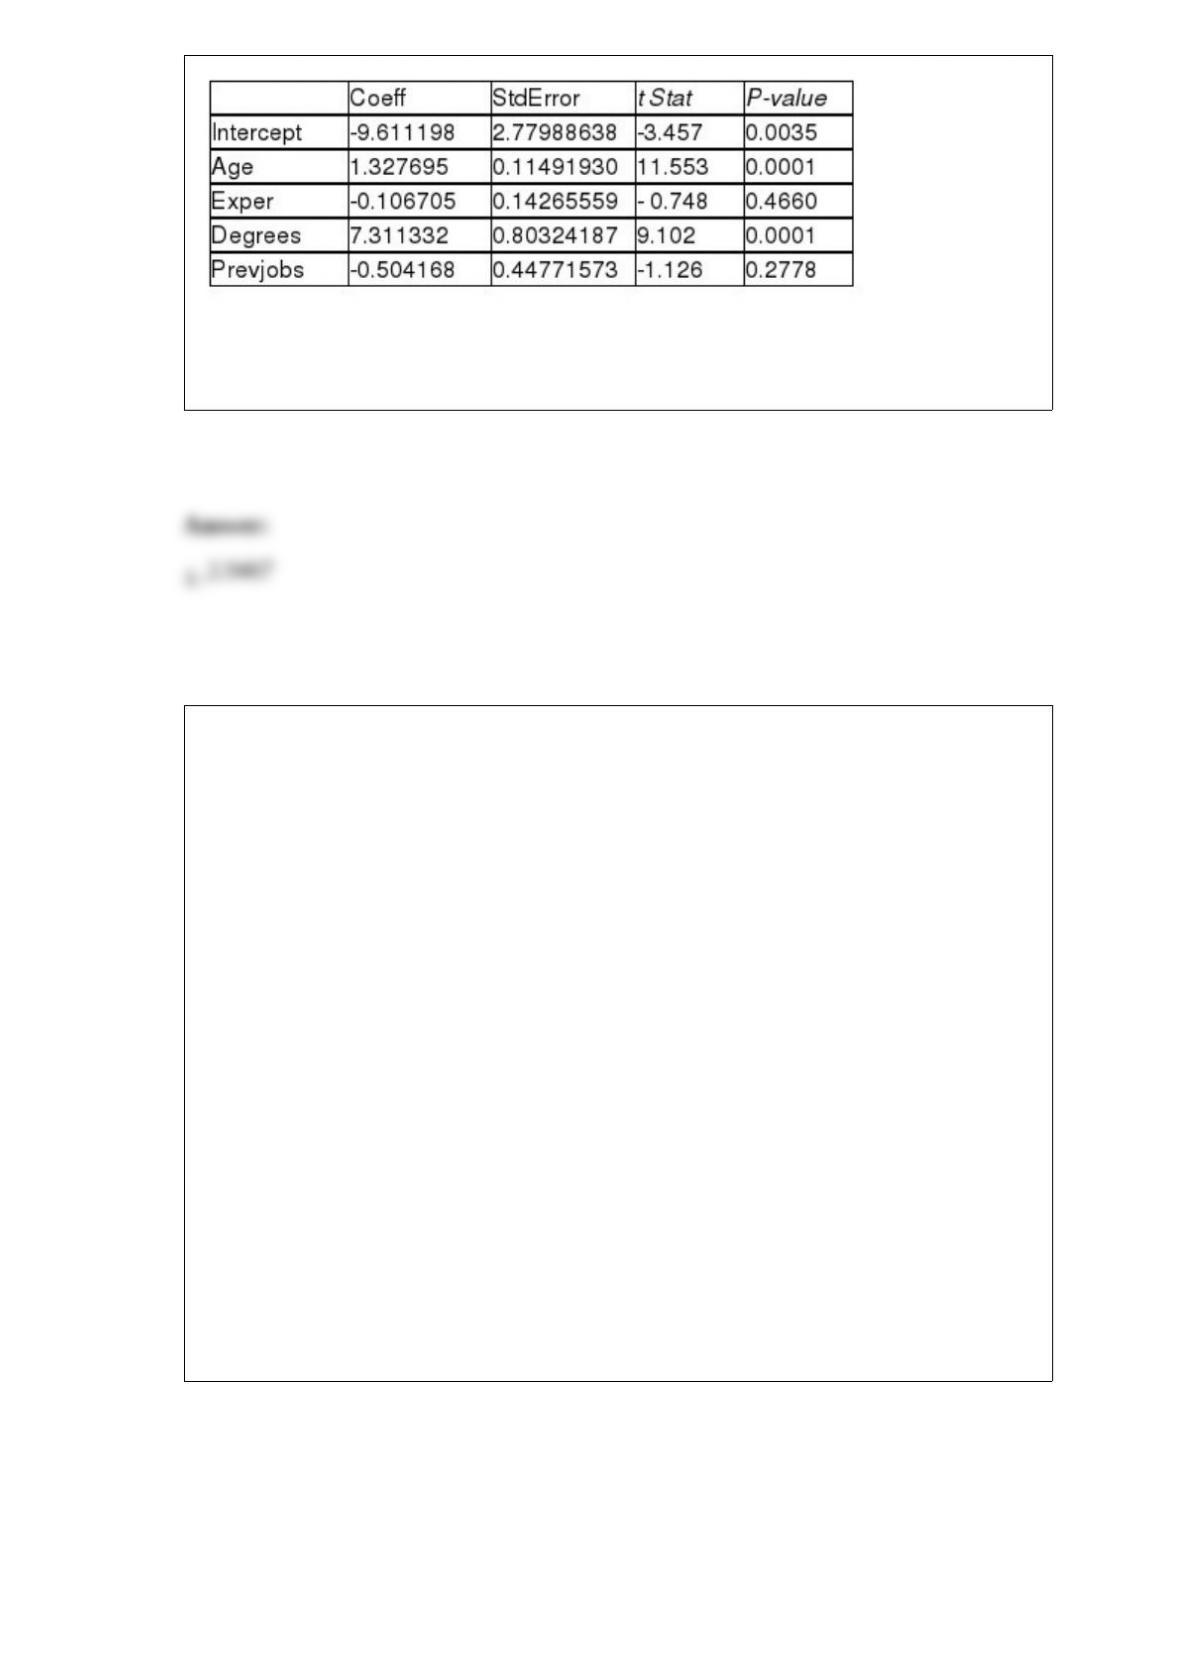
Referring to Table 17-3, the analyst wants to use a t test to test for the significance of
the coefficient of X3. For a level of significance of 0.01, the critical values of the test are
________.
TABLE 17-9
What are the factors that determine the acceleration time (in sec.) from 0 to 60 miles per
hour of a car? Data on the following variables for 171 different vehicle models were
collected:
Accel Time: Acceleration time in sec.
Cargo Vol: Cargo volume in cu. ft.
HP: Horsepower
MPG: Miles per gallon
SUV: 1 if the vehicle model is an SUV with Coupe as the base when SUV and Sedan
are both 0
Sedan: 1 if the vehicle model is a sedan with Coupe as the base when SUV and Sedan
are both 0
The regression results using acceleration time as the dependent variable and the
remaining variables as the independent variables are presented below.
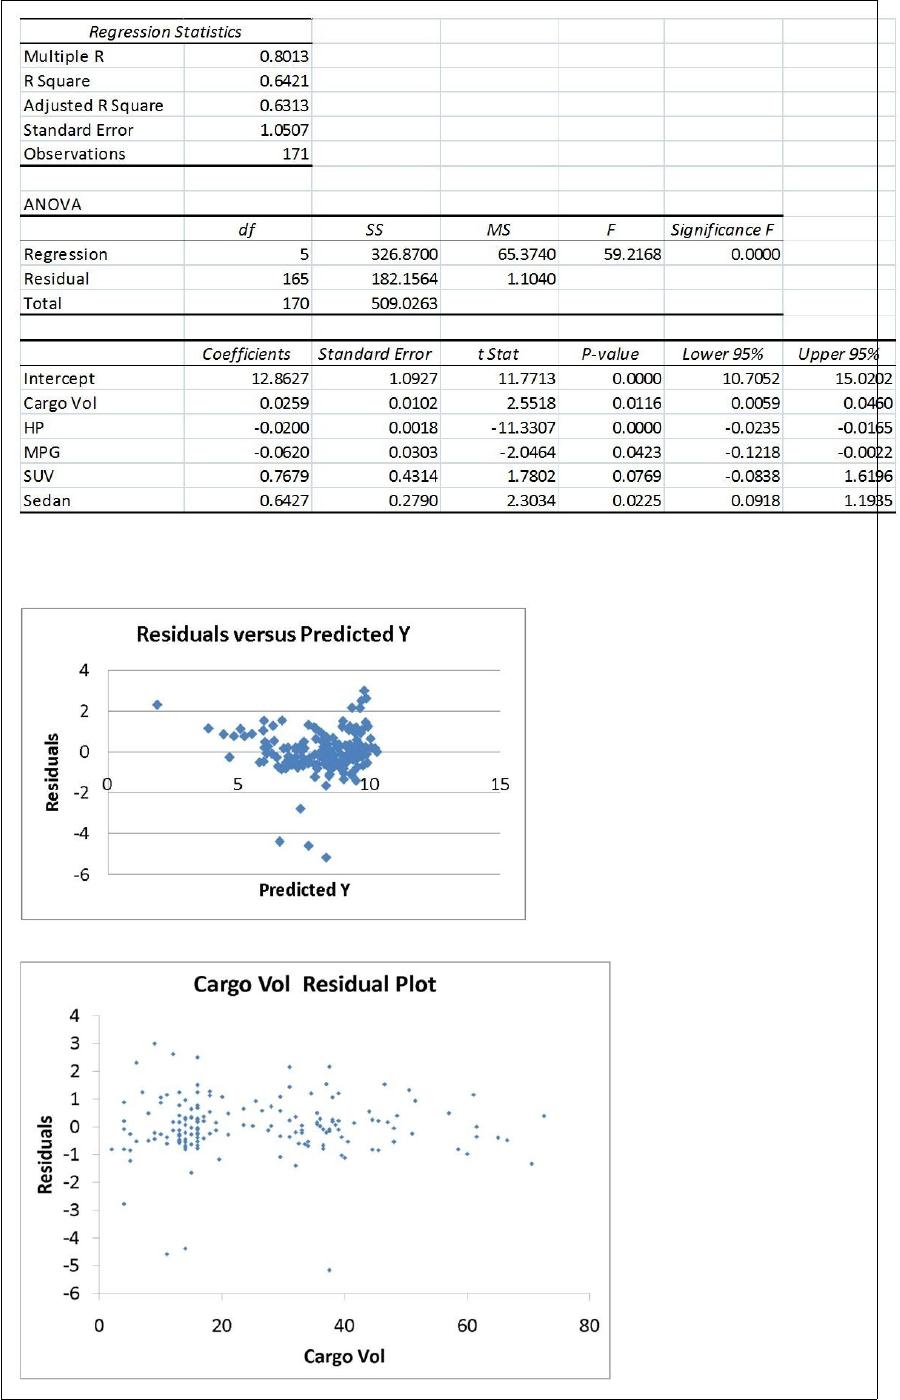
The various residual plots are as shown below.
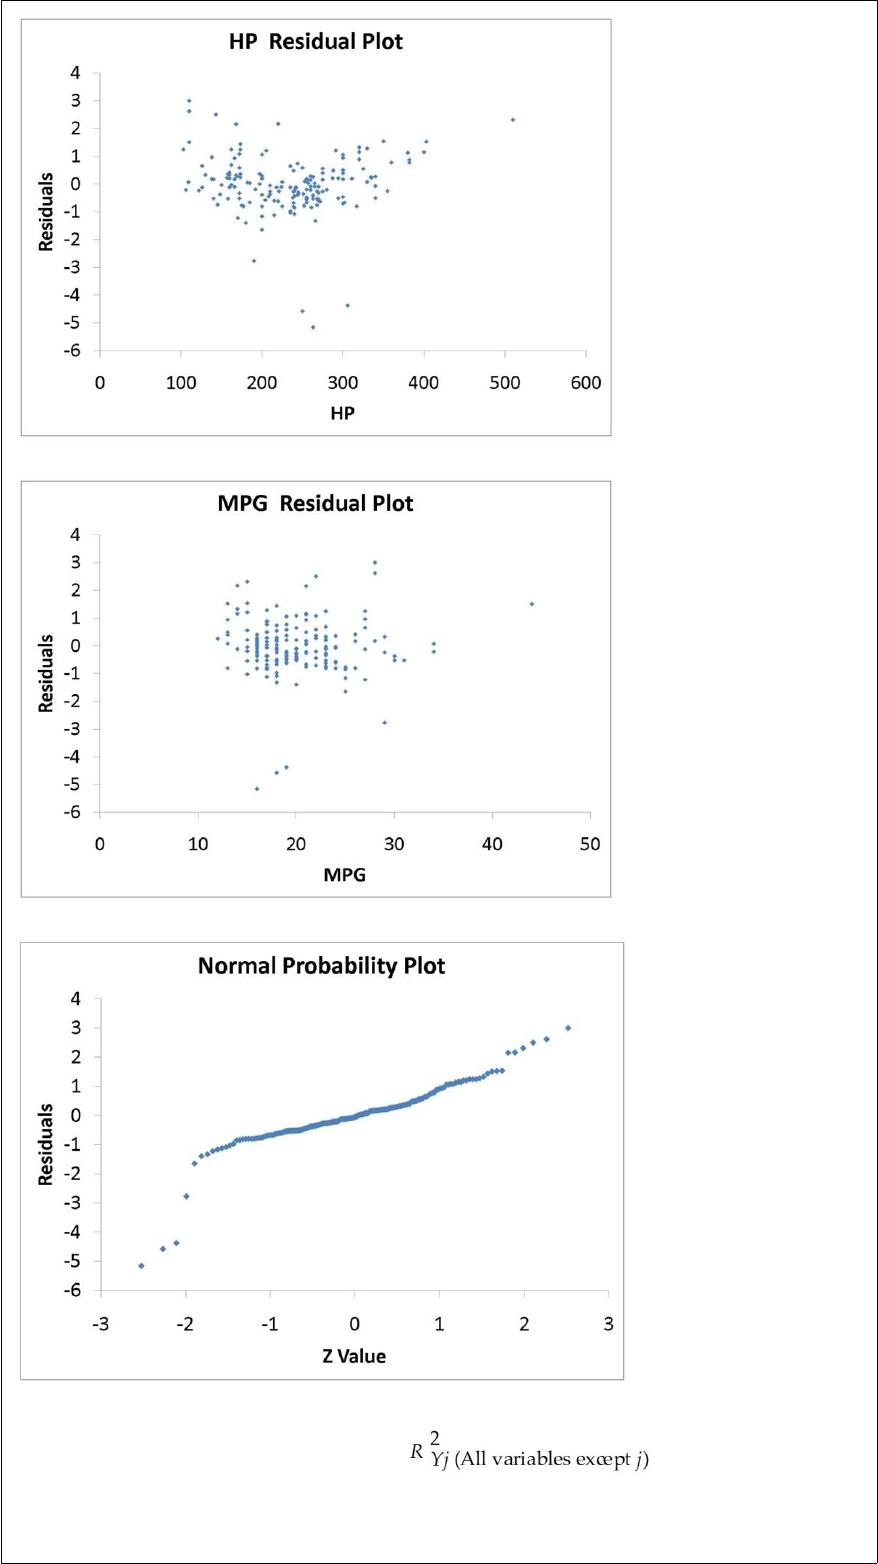
The coefficient of partial determination ( ) of each of the 5
predictors are, respectively, 0.0380, 0.4376, 0.0248, 0.0188, and 0.0312.
The coefficient of multiple determination for the regression model using each of the 5
variables Xj as the dependent variable and all other X variables as independent variables
( ) are, respectively, 0.7461, 0.5676, 0.6764, 0.8582, 0.6632.
Referring to Table 17-9, ________ of the variation in Accel Time can be explained by
the five independent variables after taking into consideration the number of independent
variables and the number of observations.
TABLE 6-5
A company producing orange juice buys all of its oranges from a large orange orchard.
The amount of juice that can be squeezed from each of these oranges is approximately
normally distributed with a mean of 4.7 ounces and some unknown standard deviation.
The company’s production manager knows that the probability is 30.85% that a
randomly selected orange will contain less than 4.5 ounces of juice. Also, the
probability is 10.56% that a randomly selected orange will contain more than 5.2
ounces of juice. Answer the following questions without the help of a calculator,
statistical software or statistical table.
Referring to Table 6-5, what is the probability that a randomly selected orange will
contain no more than 4.2 ounces of juice?
TABLE 12-20
A filling machine at a local soft drinks company is calibrated to fill the cans at a mean
amount of 12 fluid ounces and a standard deviation of 0.5 ounces. The company wants
to test whether the standard deviation of the amount filled by the machine is 0.5 ounces.
A random sample of 15 cans filled by the machine reveals a standard deviation of 0.67
ounces.
Referring to Table 12-20, the parameter of interest in the test is ________.
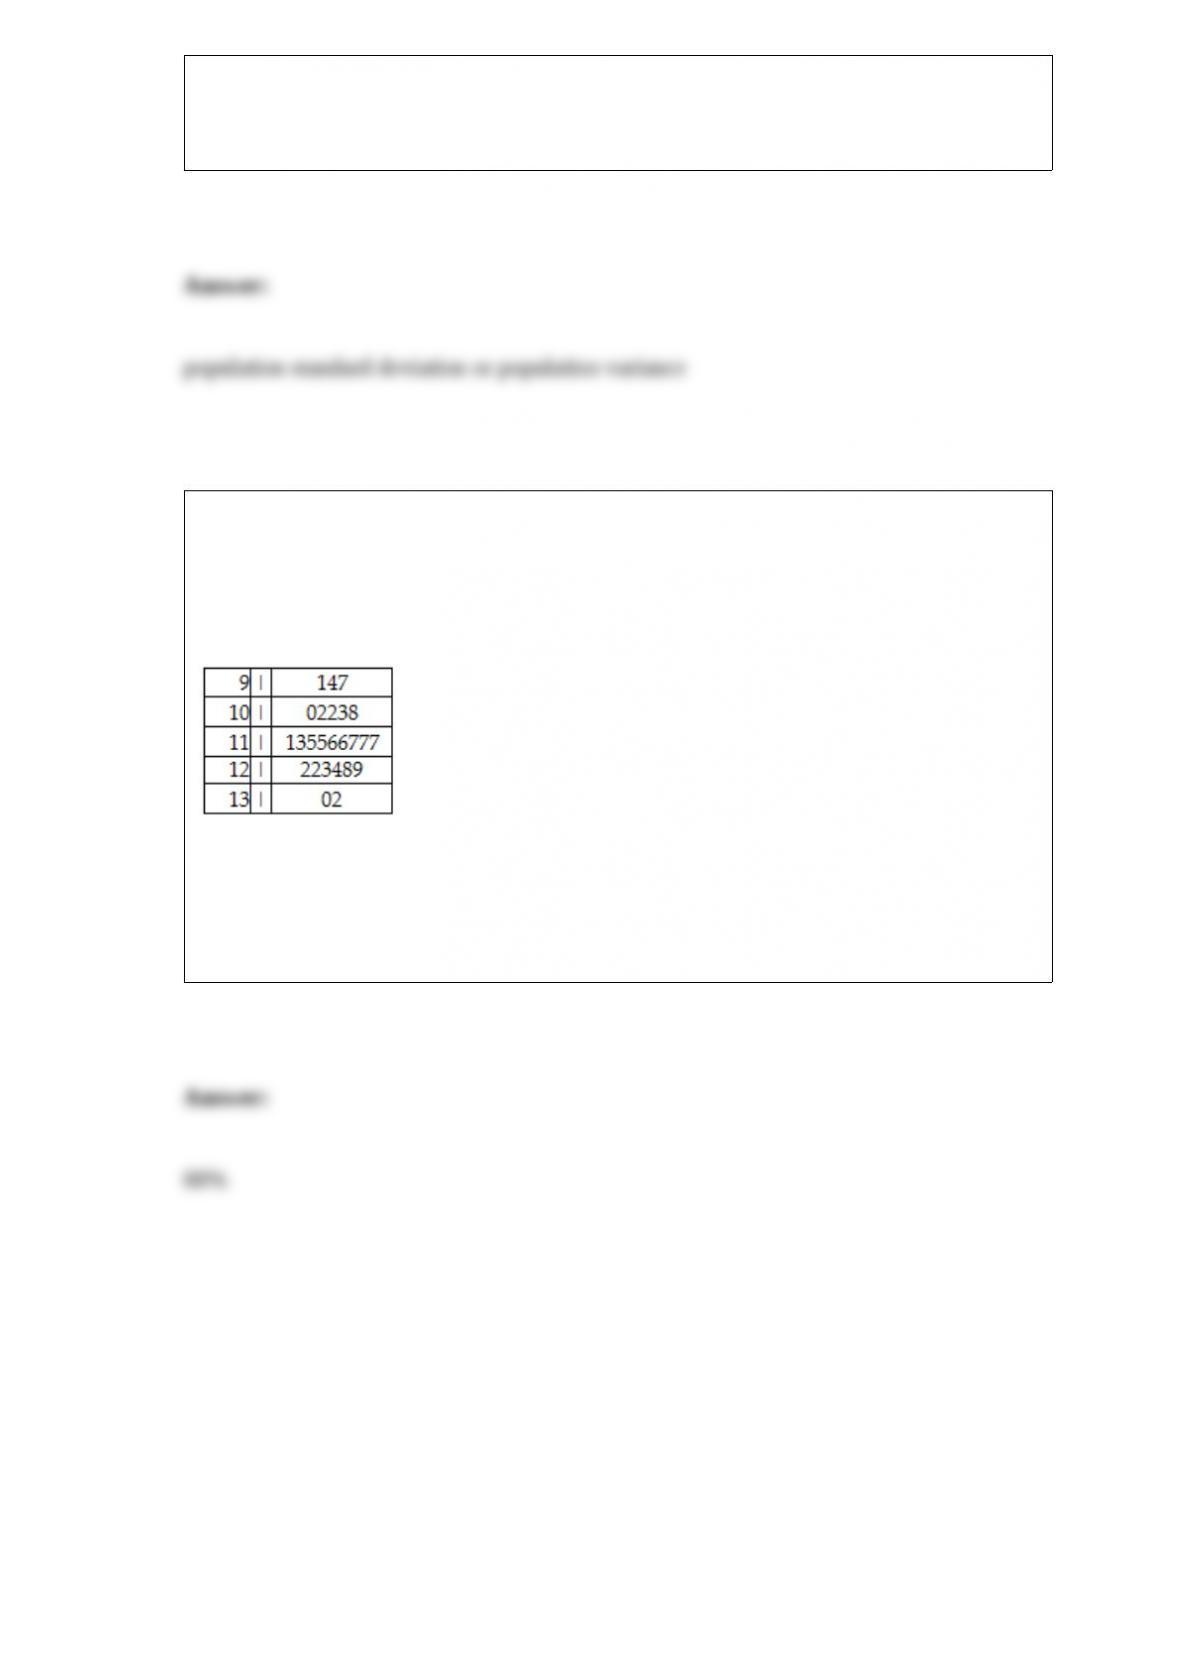
TABLE 2-13
Given below is the stem-and-leaf display representing the amount of detergent used in
gallons (with leaves in 10ths of gallons) in a day by 25 drive-through car wash
operations in Phoenix.
Referring to Table 2-13, if a relative frequency or percentage distribution for the
detergent data is constructed, using “9.0 but less than 10.0 gallons” as the first class,
what percentage of drive-through car wash operations use at least 10 gallons of
detergent in a day?