Unlock document.
This document is partially blurred.
Unlock all pages and 1 million more documents.
Get Access
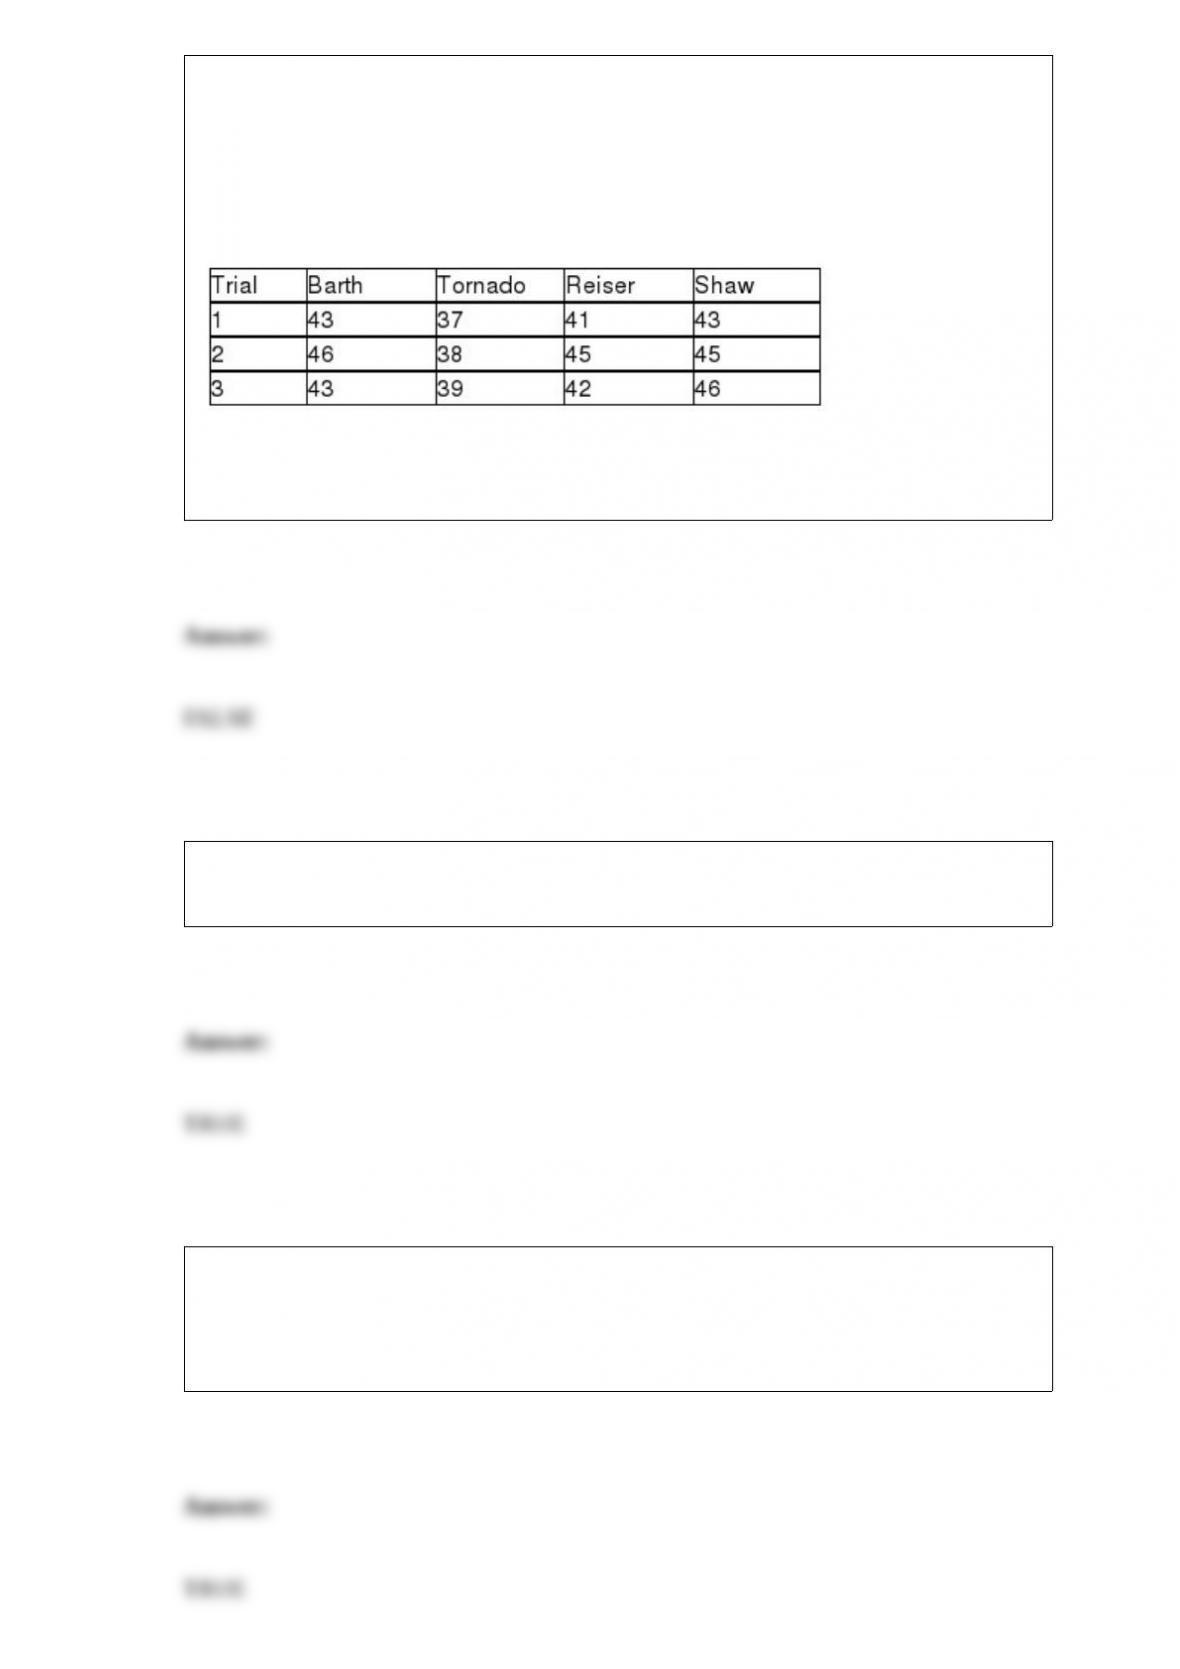
TABLE 11-3
As part of an evaluation program, a sporting goods retailer wanted to compare the
downhill coasting speeds of 4 brands of bicycles. She took 3 of each brand and
determined their maximum downhill speeds. The results are presented in miles per hour
in the table below.
True or False: Referring to Table 11-3, the decision made implies that all 4 means are
significantly different.
True or False: To test whether one proportion is higher than the other in two related
samples, you can use the McNemar test.
True or False: A sample of 200 students at a Big-Ten university was taken after the
midterm to ask whether they went bar hopping the weekend before the midterm or
spent the weekend studying, and whether they did well or poorly on the midterm. You
can use a contingency table to present this information.

True or False: The statement of the null hypothesis always contains an equality.
TABLE 9-9
The president of a university claimed that the entering class this year appeared to be
larger than the entering class from previous years but their mean SAT score is lower
than previous years. He took a sample of 20 of this year's entering students and found
that their mean SAT score is 1,501 with a standard deviation of 53. The university's
record indicates that the mean SAT score for entering students from previous years is
1,520. He wants to find out if his claim is supported by the evidence at a 5% level of
significance.
True or False: Referring to Table 9-9, the president can conclude that the mean SAT
score of the entering class this year is lower than previous years using a level of
significance of 0.10.
True or False: The amount of bleach a machine pours into bottles has a mean of 36 oz.
with a standard deviation of 0.15 oz. Suppose we take a random sample of 36 bottles
filled by this machine. The sampling distribution of the sample mean will be
approximately normal only if the population sampled is normal.
True or False: You stand at the main entrance to a departmental store and pick the first
20 customers that enter the store after it has opened its door for business on a single
day. This is an example of a systematic sample.
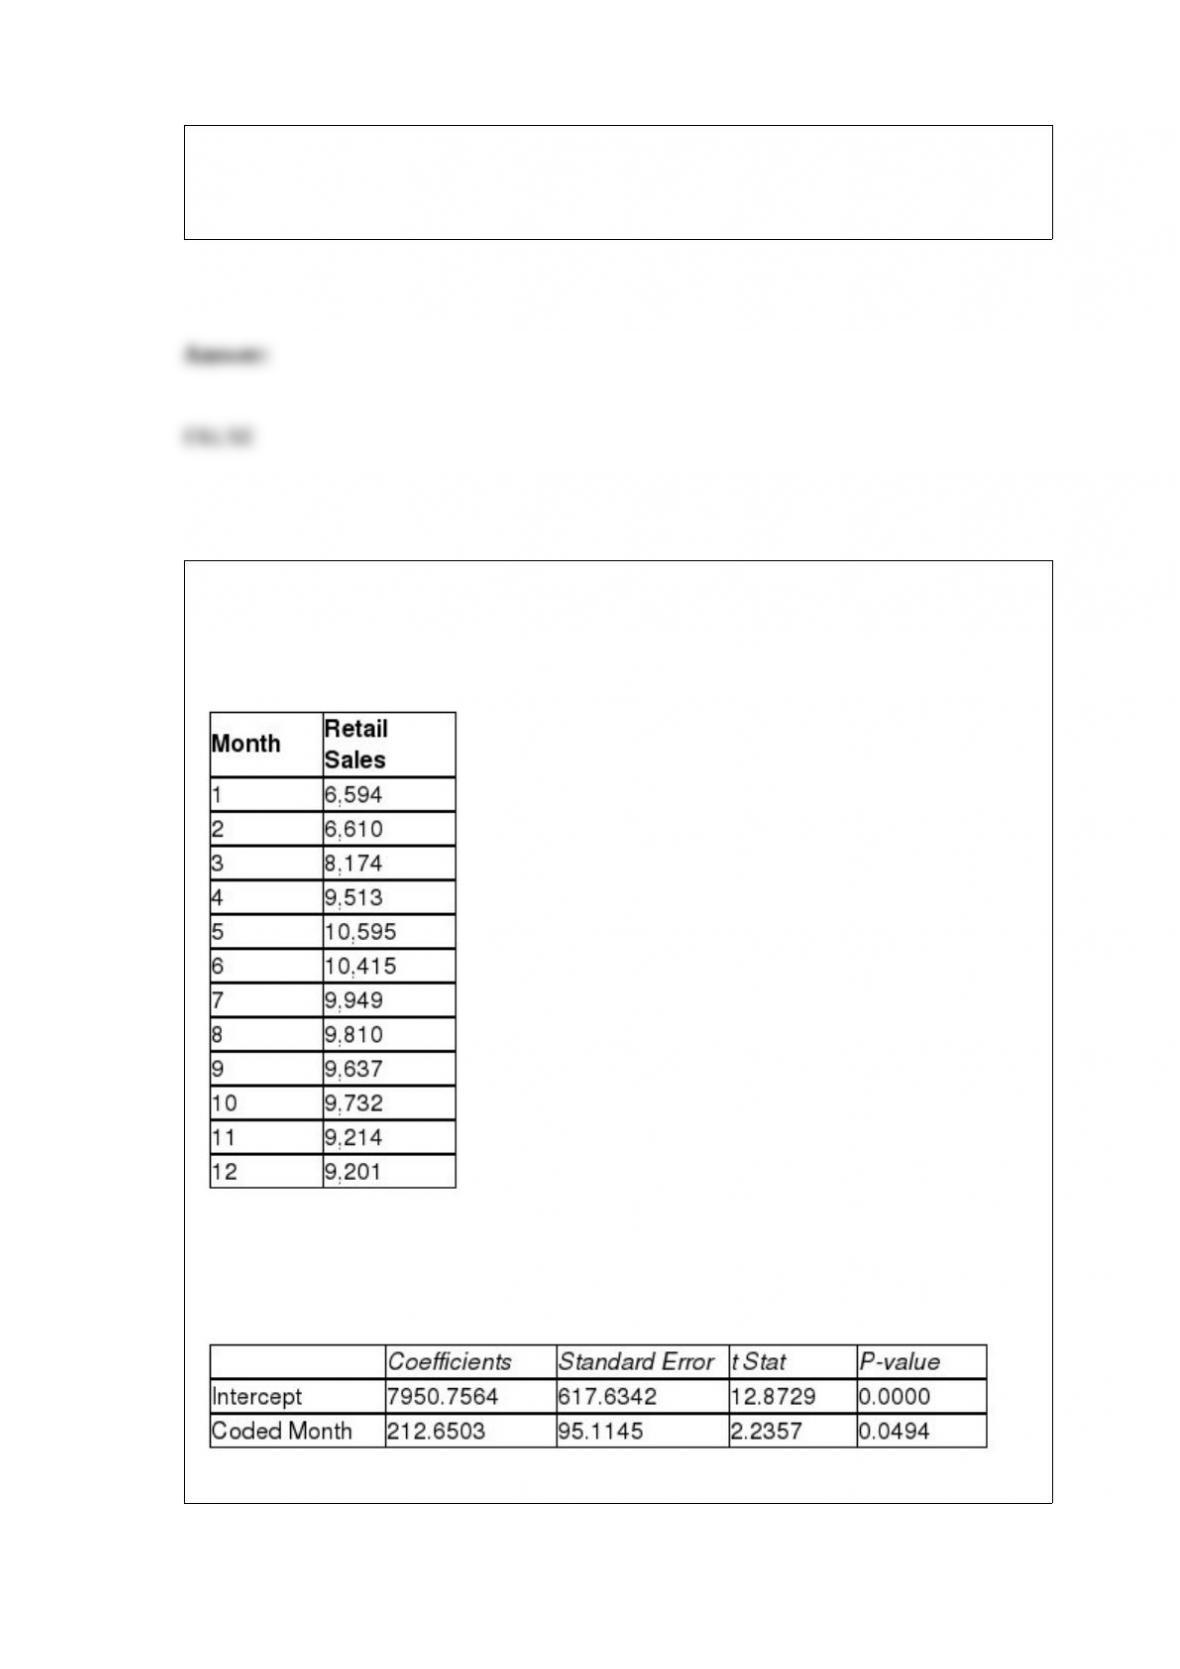
TABLE 16-13
Given below is the monthly time-series data for U.S. retail sales of building materials
over a specific year.
The results of the linear trend, quadratic trend, exponential trend, first-order
autoregressive, second-order autoregressive and third-order autoregressive model are
presented below in which the coded month for the 1st month is 0:
Linear trend model:
Quadratic trend model:
Exponential trend model:
First-order autoregressive:
Second-order autoregressive:
Third-order autoregressive:
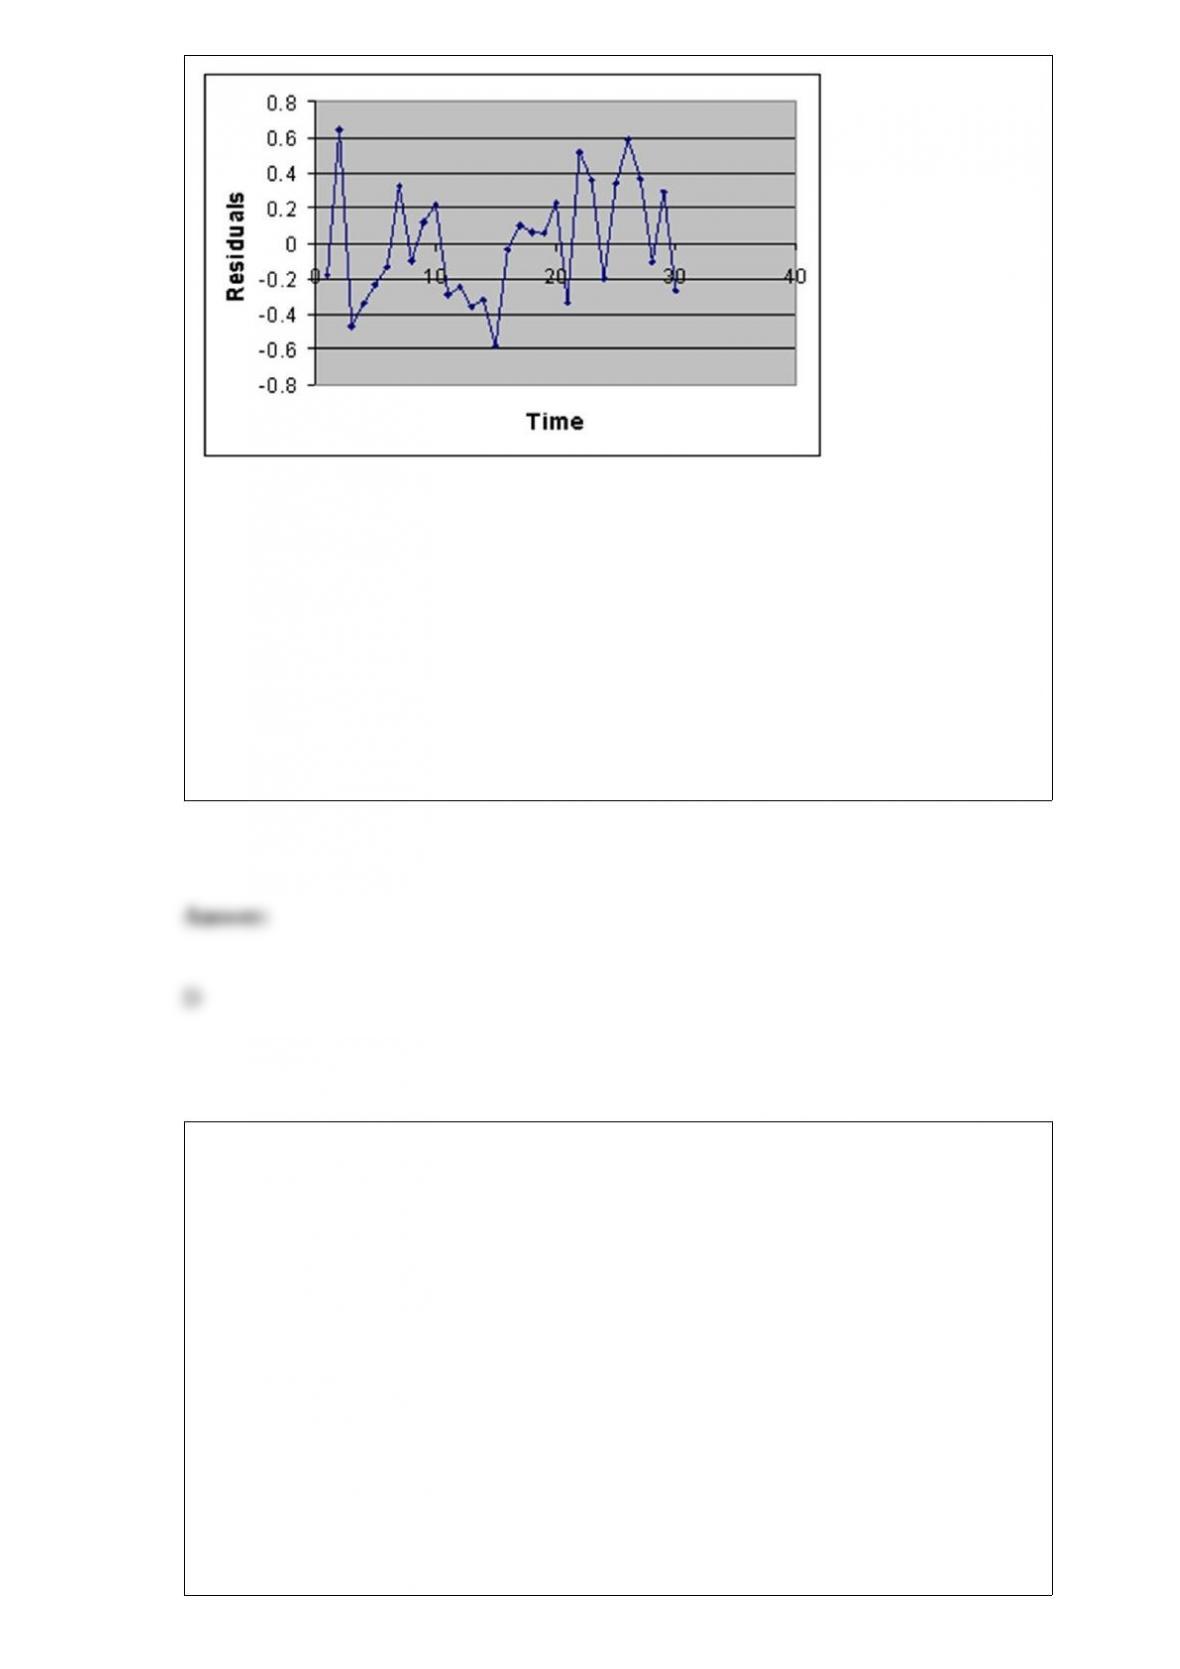
Below is the residual plot of the various models:
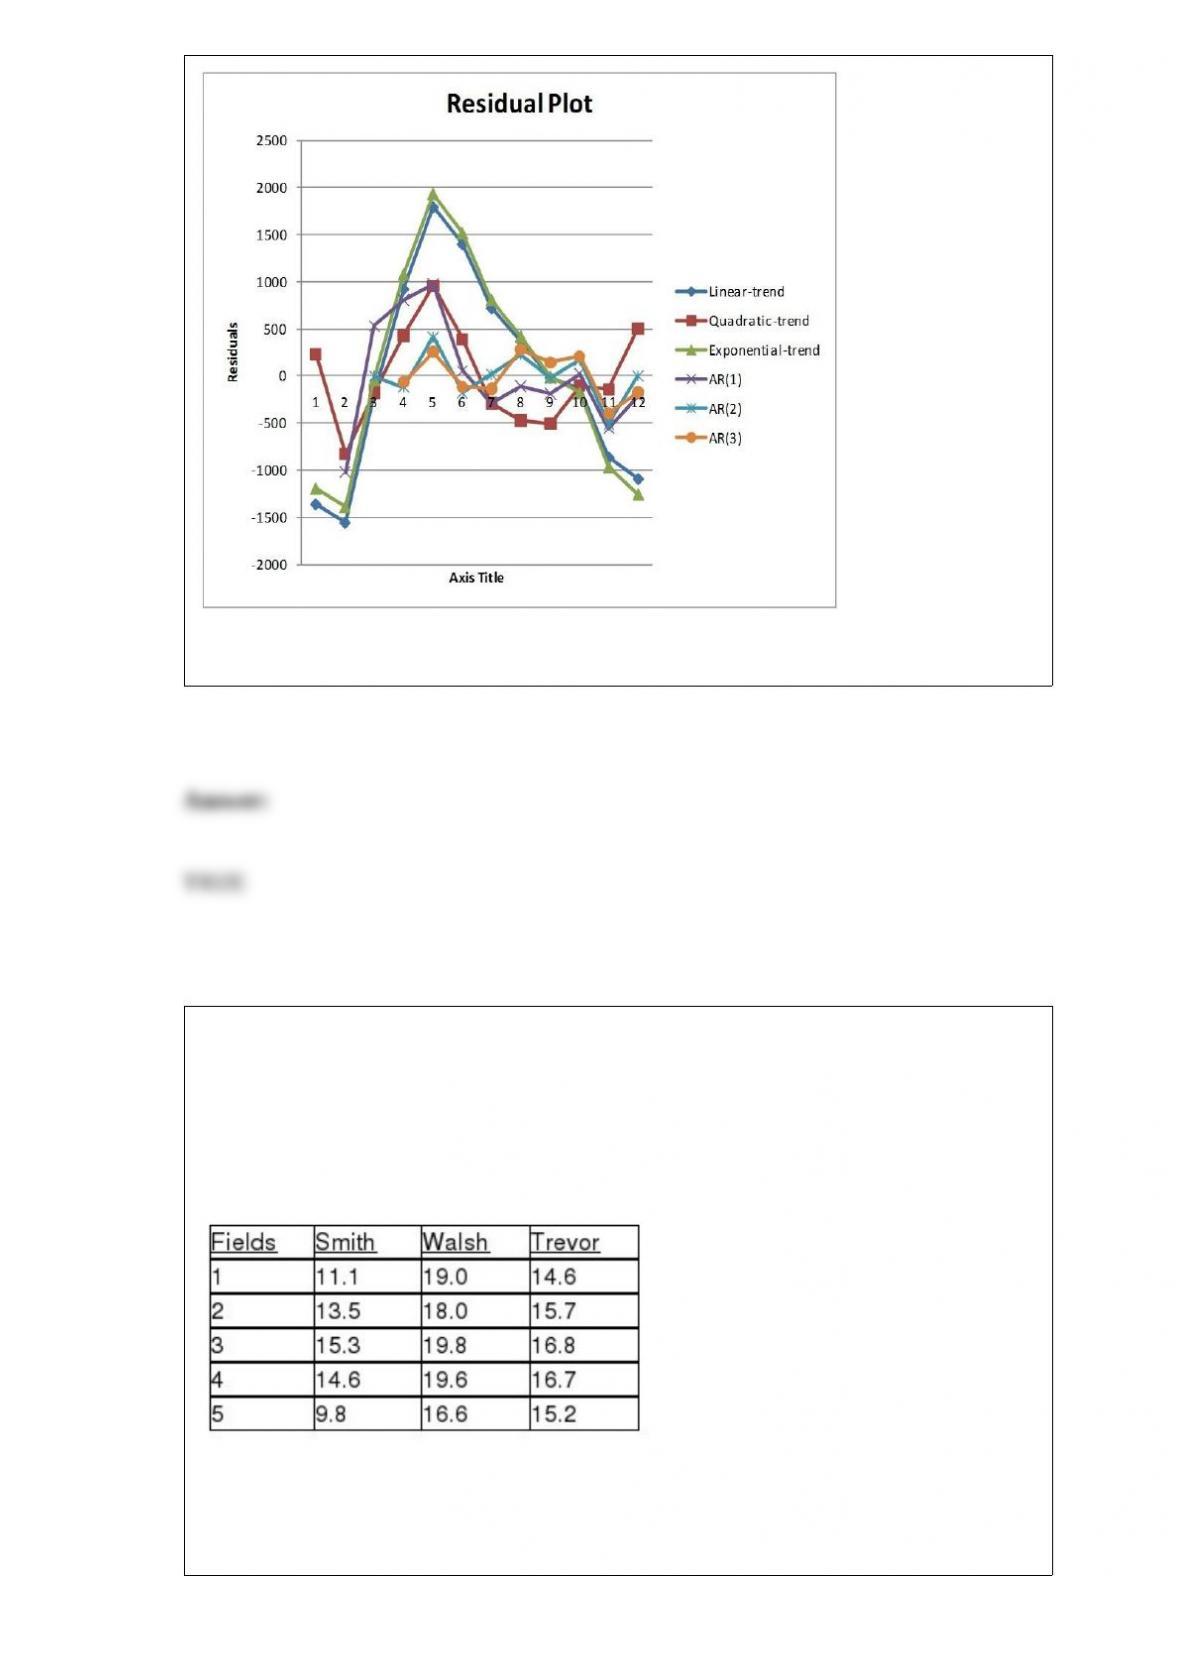
True or False: Referring to Table 16-13, you can conclude that the quadratic term in the
quadratic-trend model is statistically significant at the 5% level of significance.
TABLE 11-10
An agronomist wants to compare the crop yield of 3 varieties of chickpea seeds. She
plants all 3 varieties of the seeds on each of 5 different patches of fields. She then
measures the crop yield in bushels per acre. Treating this as a randomized block design,
the results are presented in the table that follows.
True or False: Referring to Table 11-10, the decision made at a 0.01 level of
significance on the randomized block F test for the difference in means implies that all
3 means are significantly different.
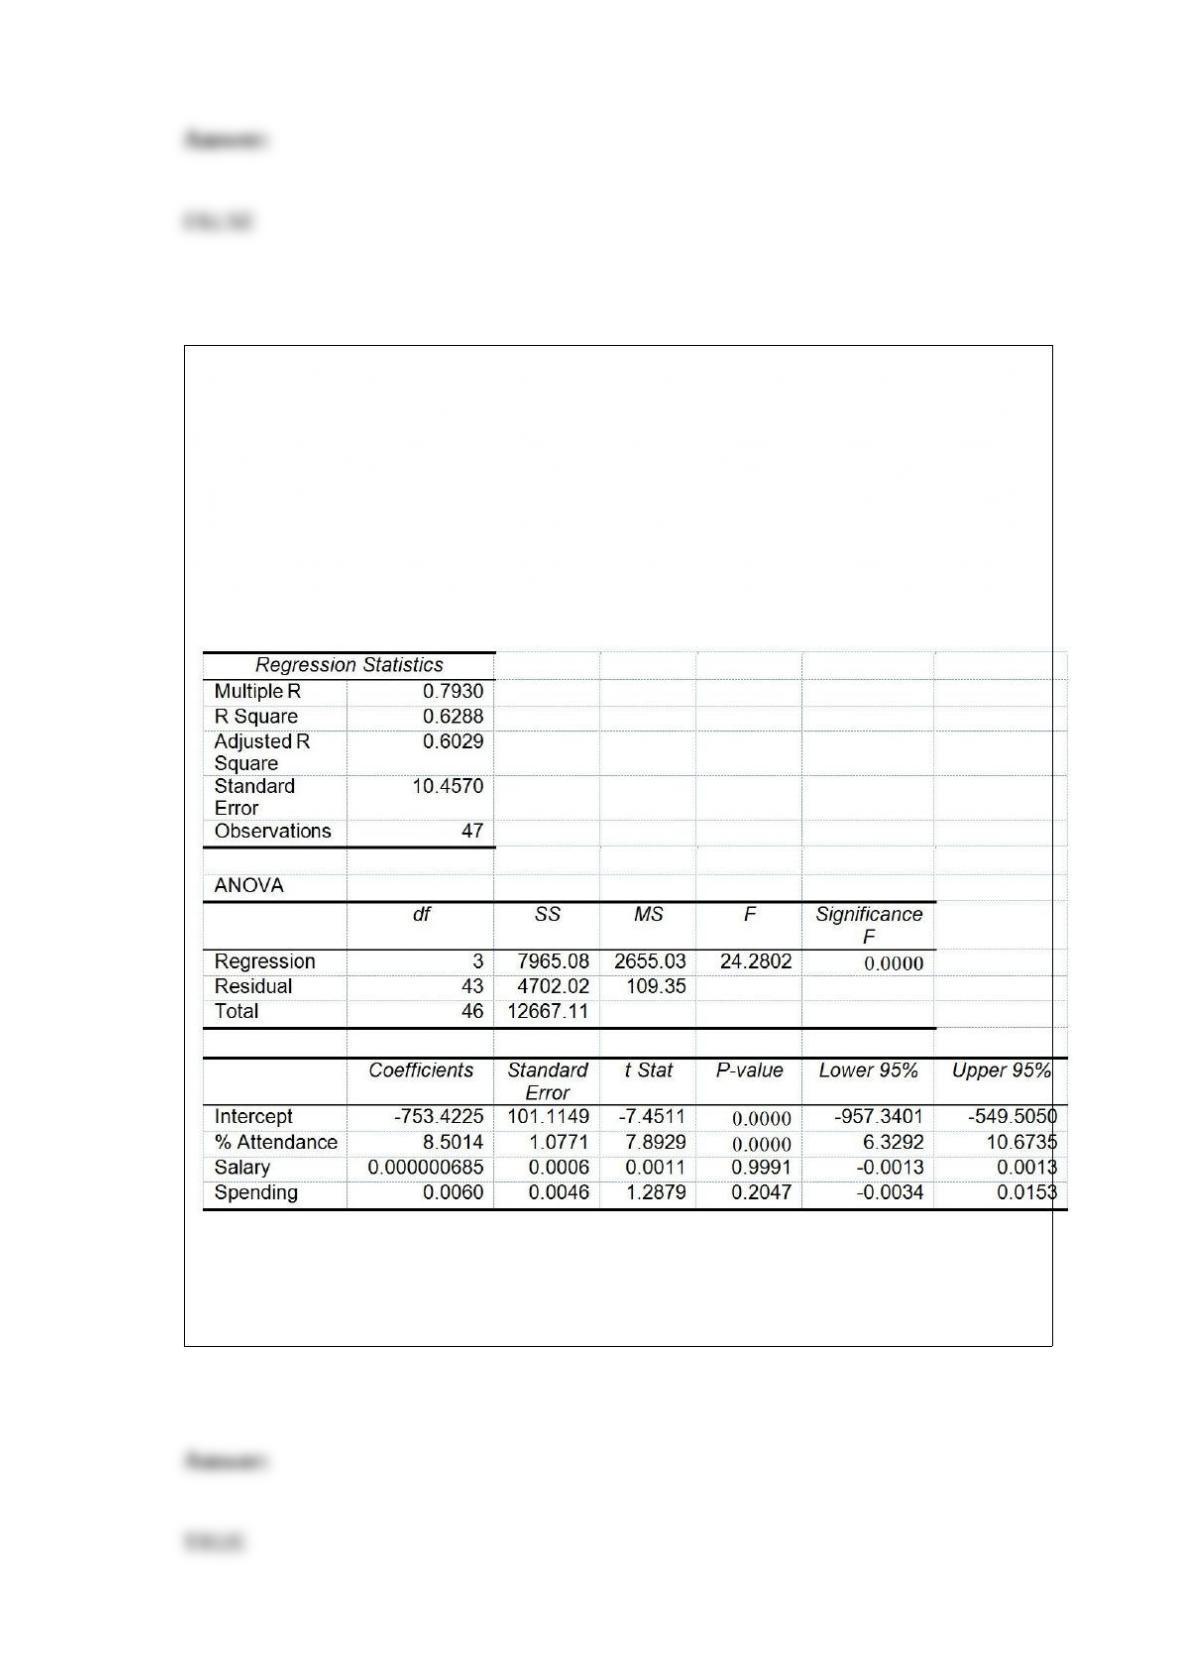
True or False: TABLE 17-8
The superintendent of a school district wanted to predict the percentage of students
passing a sixth-grade proficiency test. She obtained the data on percentage of students
passing the proficiency test (% Passing), daily mean of the percentage of students
attending class (% Attendance), mean teacher salary in dollars (Salaries), and
instructional spending per pupil in dollars (Spending) of 47 schools in the state.
Following is the multiple regression output with Y = % Passing as the dependent
variable, X1 = % Attendance, X2 = Salaries and X3 = Spending:
Referring to Table 17-8, there is sufficient evidence that the daily mean of the
percentage of students attending class has an effect on the percentage of students
passing the proficiency test while holding constant the effect of all the other
independent variables at a 5% level of significance.
True or False: TABLE 17-9
What are the factors that determine the acceleration time (in sec.) from 0 to 60 miles per
hour of a car? Data on the following variables for 171 different vehicle models were
collected:
Accel Time: Acceleration time in sec.
Cargo Vol: Cargo volume in cu. ft.
HP: Horsepower
MPG: Miles per gallon
SUV: 1 if the vehicle model is an SUV with Coupe as the base when SUV and Sedan
are both 0
Sedan: 1 if the vehicle model is a sedan with Coupe as the base when SUV and Sedan
are both 0
The regression results using acceleration time as the dependent variable and the
remaining variables as the independent variables are presented below.
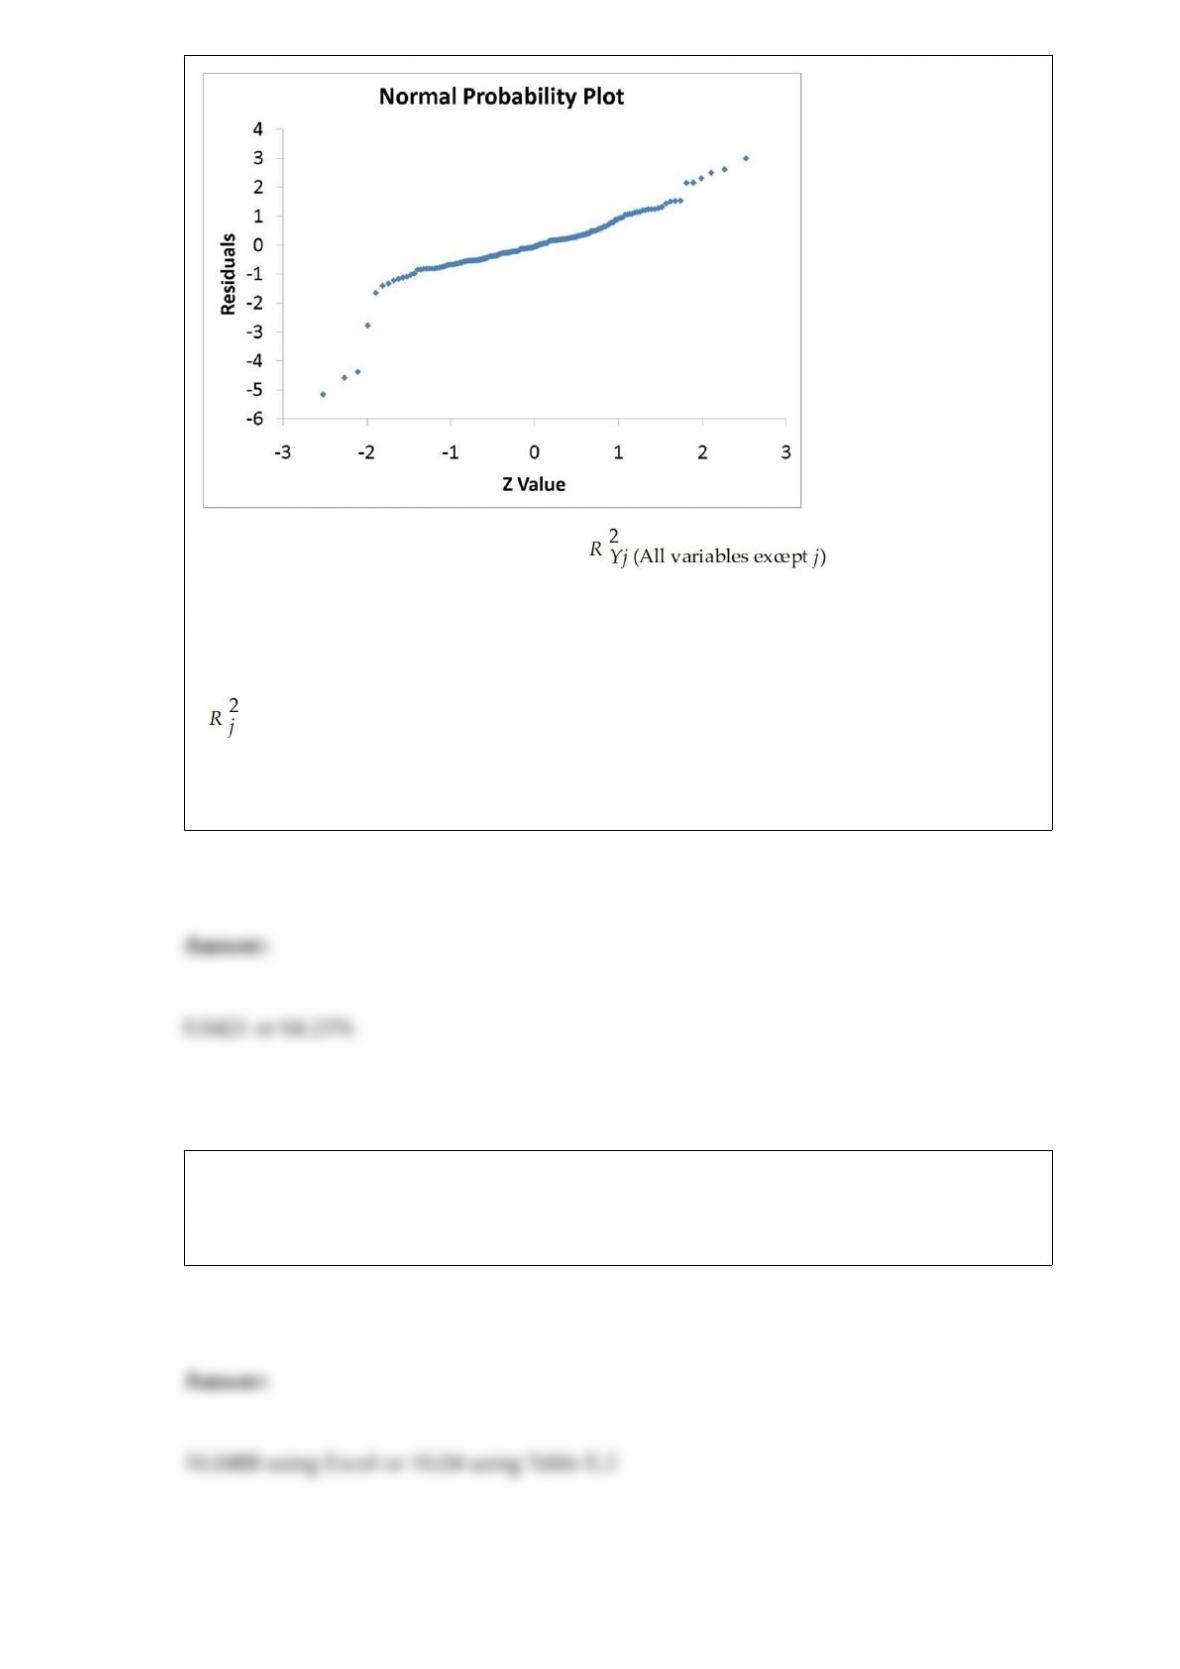
The various residual plots are as shown below.
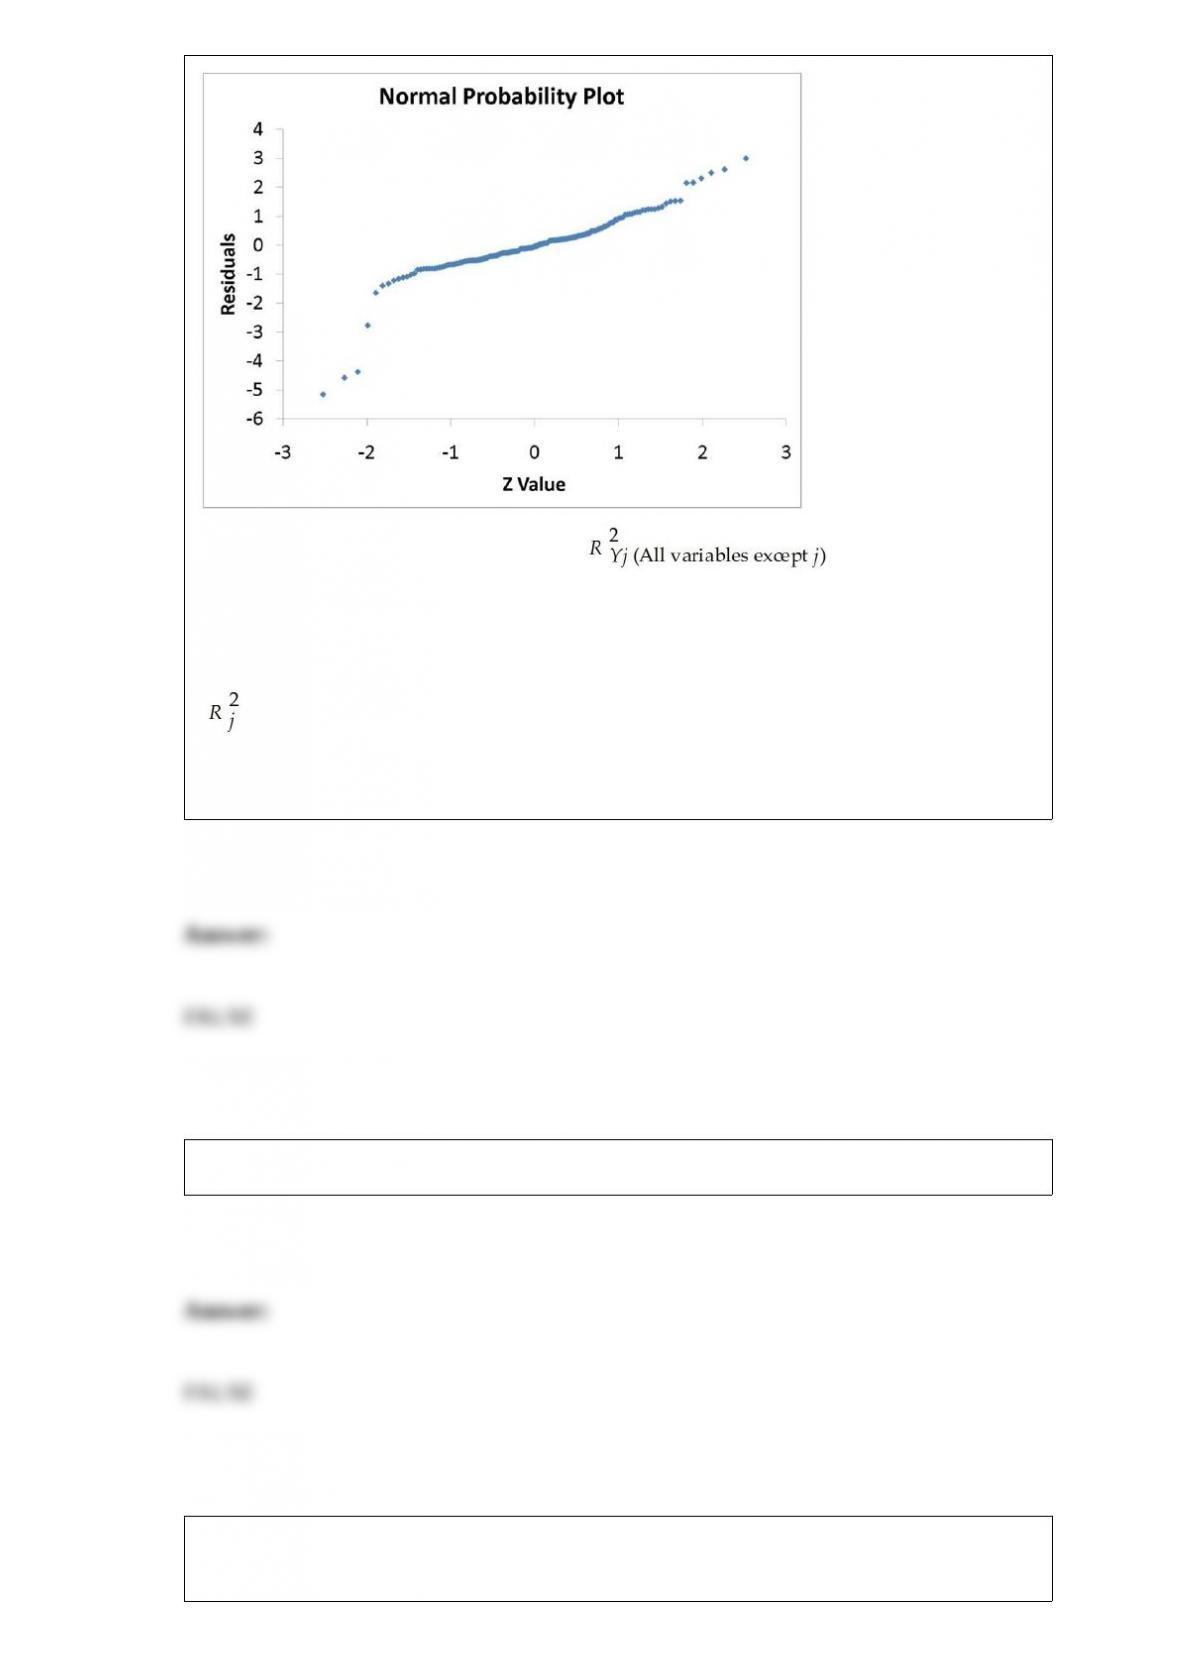
The coefficient of partial determination ( ) of each of the 5
predictors are, respectively, 0.0380, 0.4376, 0.0248, 0.0188, and 0.0312.
The coefficient of multiple determination for the regression model using each of the 5
variables Xj as the dependent variable and all other X variables as independent variables
( ) are, respectively, 0.7461, 0.5676, 0.6764, 0.8582, 0.6632.
Referring to Table 17-9, the 0 to 60 miles per hour acceleration time of a coupe is
predicted to be 0.7679 seconds higher than that of a sedan.
True or False: If P(A and B) = 1, then A and B must be mutually exclusive.
True or False: The goals of model building are to find a good model with the fewest
independent variables that is easier to interpret and has lower probability of collinearity.
True or False: An investment consultant is recommending a certain class of mutual
funds to the clienteles based on its exceptionally high probability of gain. It is an ethical
practice to explain to the clienteles what the basis of her probability estimate is.
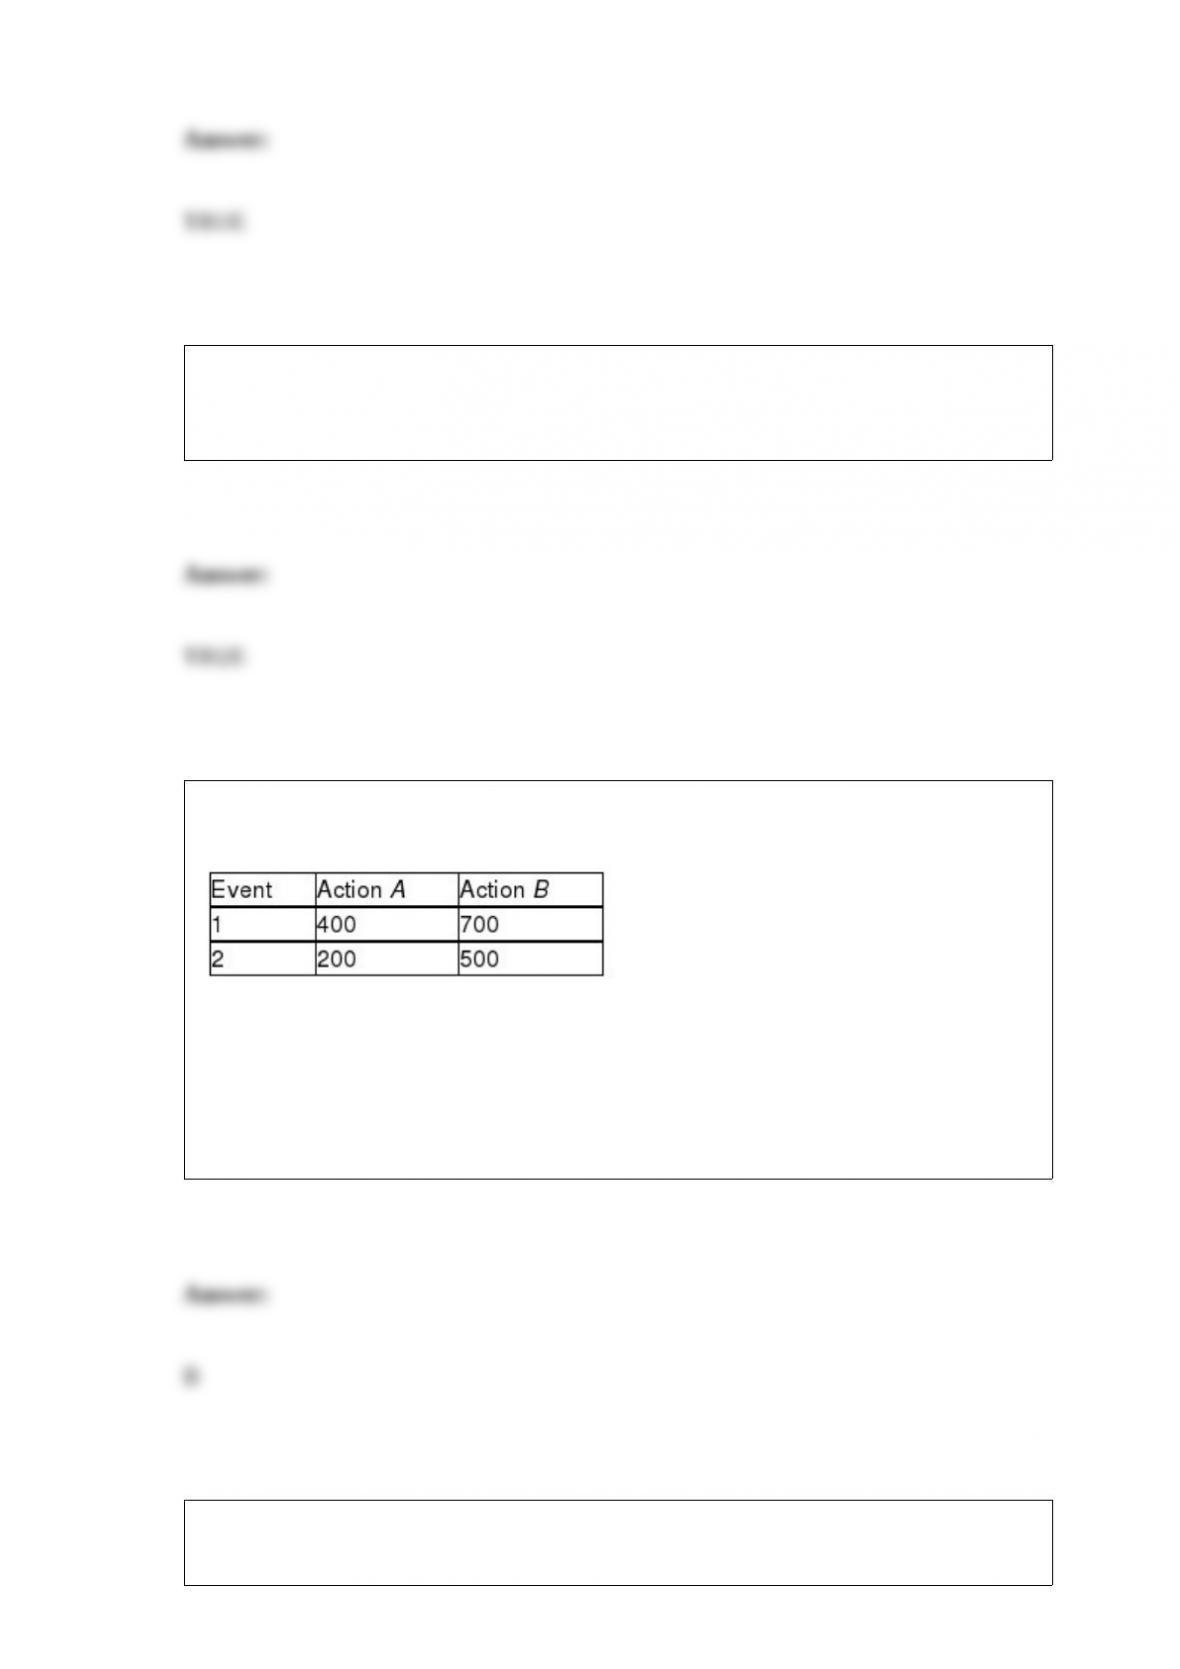
TABLE 19-2
The following payoff matrix is given in dollars.
Suppose the probability of Event 1 is 0.5 and Event 2 is 0.5.
Referring to Table 19-2, what is the action with the preferable coefficient of variation?
A) Action A
B) Action B
C) Either Action A or Action B
D) It cannot be determined.
TABLE 13-12
The manager of the purchasing department of a large saving and loan organization
would like to develop a model to predict the amount of time (measured in hours) it
takes to record a loan application. Data are collected from a sample of 30 days, and the
number of applications recorded and completion time in hours is recorded. Below is the
regression output:
Referring to Table 13-12, the estimated mean amount of time it takes to record one
additional loan application is
A) 0.4024 fewer hours.
B) 0.4024 more hours.
C) 0.0126 fewer hours.
D) 0.0126 more hours.
TABLE 17-7
As a project for his business statistics class, a student examined the factors that
determined parking meter rates throughout the campus area. Data were collected for the
price per hour of parking, blocks to the quadrangle, and one of the three jurisdictions:
on campus, in downtown and off campus, or outside of downtown and off campus. The
population regression model hypothesized is
Yi= α + β1X1i + β2X2i + β3X3i + ε
where
Y is the meter price
X1 is the number of blocks to the quad
X2 is a dummy variable that takes the value 1 if the meter is located in downtown and
off campus and the value 0 otherwise
X3 is a dummy variable that takes the value 1 if the meter is located outside of
downtown and off campus, and the value 0 otherwise
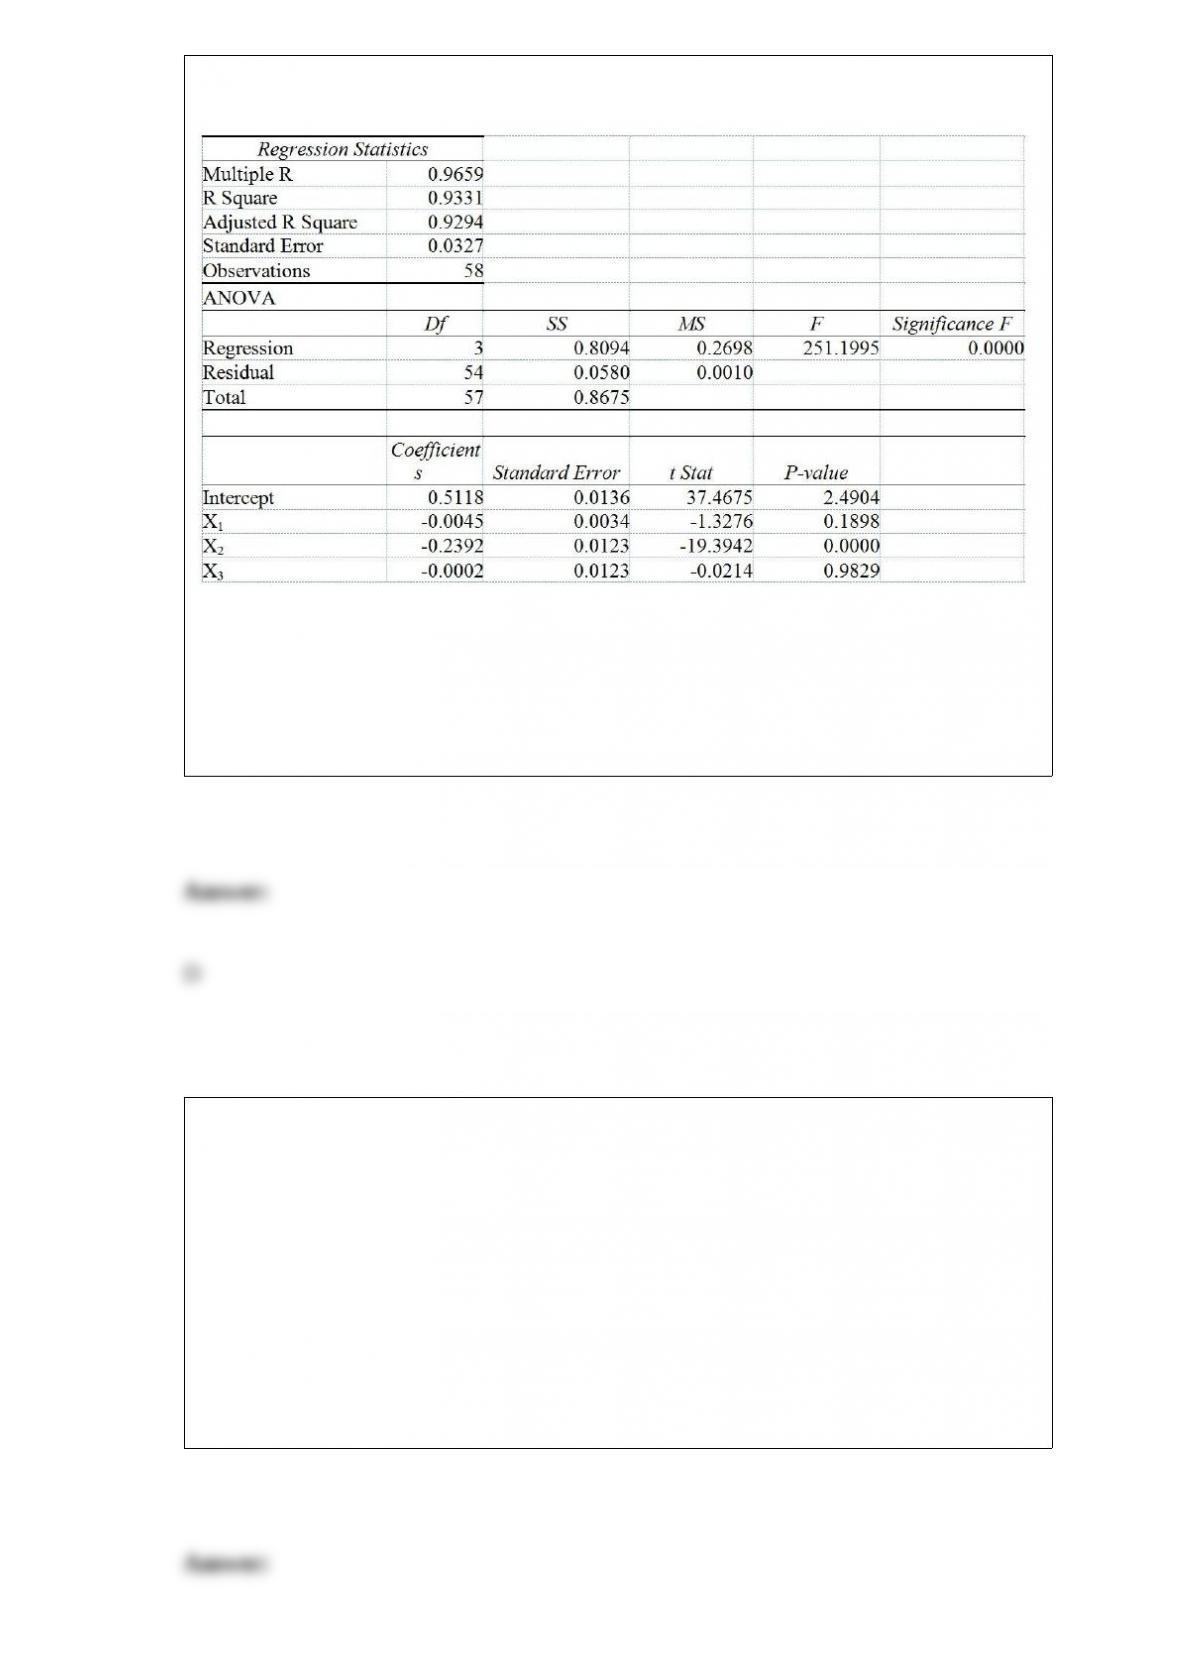
The following Excel results are obtained.
Referring to Table 17-7, predict the meter rate per hour if one parks outside of
downtown and off campus 3 blocks from the quad.
A) -$0.0139
B) $0.2589
C) $0.2604
D) $0.4981
A company that manufactures designer jeans is contemplating whether to increase its
advertising budget by $1 million for next year. If the expanded advertising campaign is
successful, the company expects sales to increase by $1.6 million next year. If the
advertising campaign fails, the company expects sales to increase by only $400,000
next year. If the advertising budget is not increased, the company expects sales to
increase by $200,000. Identify the actions in this decision-making problem.
A) Two choices: <1> increase the budget and <2> do not increase the budget.
B) Two possibilities: <1>campaign is successful and <2> campaign is not successful.
C) Four consequences resulting from the Increase/Do Not Increase and Successful/Not
Successful combinations.
D) The increase in sales dollars next year.
Blossom's Flowers purchases roses for sale for Valentine's Day. The roses are purchased
for $10 a dozen and are sold for $20 a dozen. Any roses not sold on Valentine's Day can
be sold for $5 per dozen. The owner will purchase 1 of 3 amounts of roses for
Valentine's Day: 100, 200, or 400 dozen roses. If the probability of selling 100 dozen
roses is 0.2 and 200 dozen roses is 0.5, then the probability of selling 400 dozen roses is
A) 0.7.
B) 0.5.
C) 0.3.
D) 0.2.
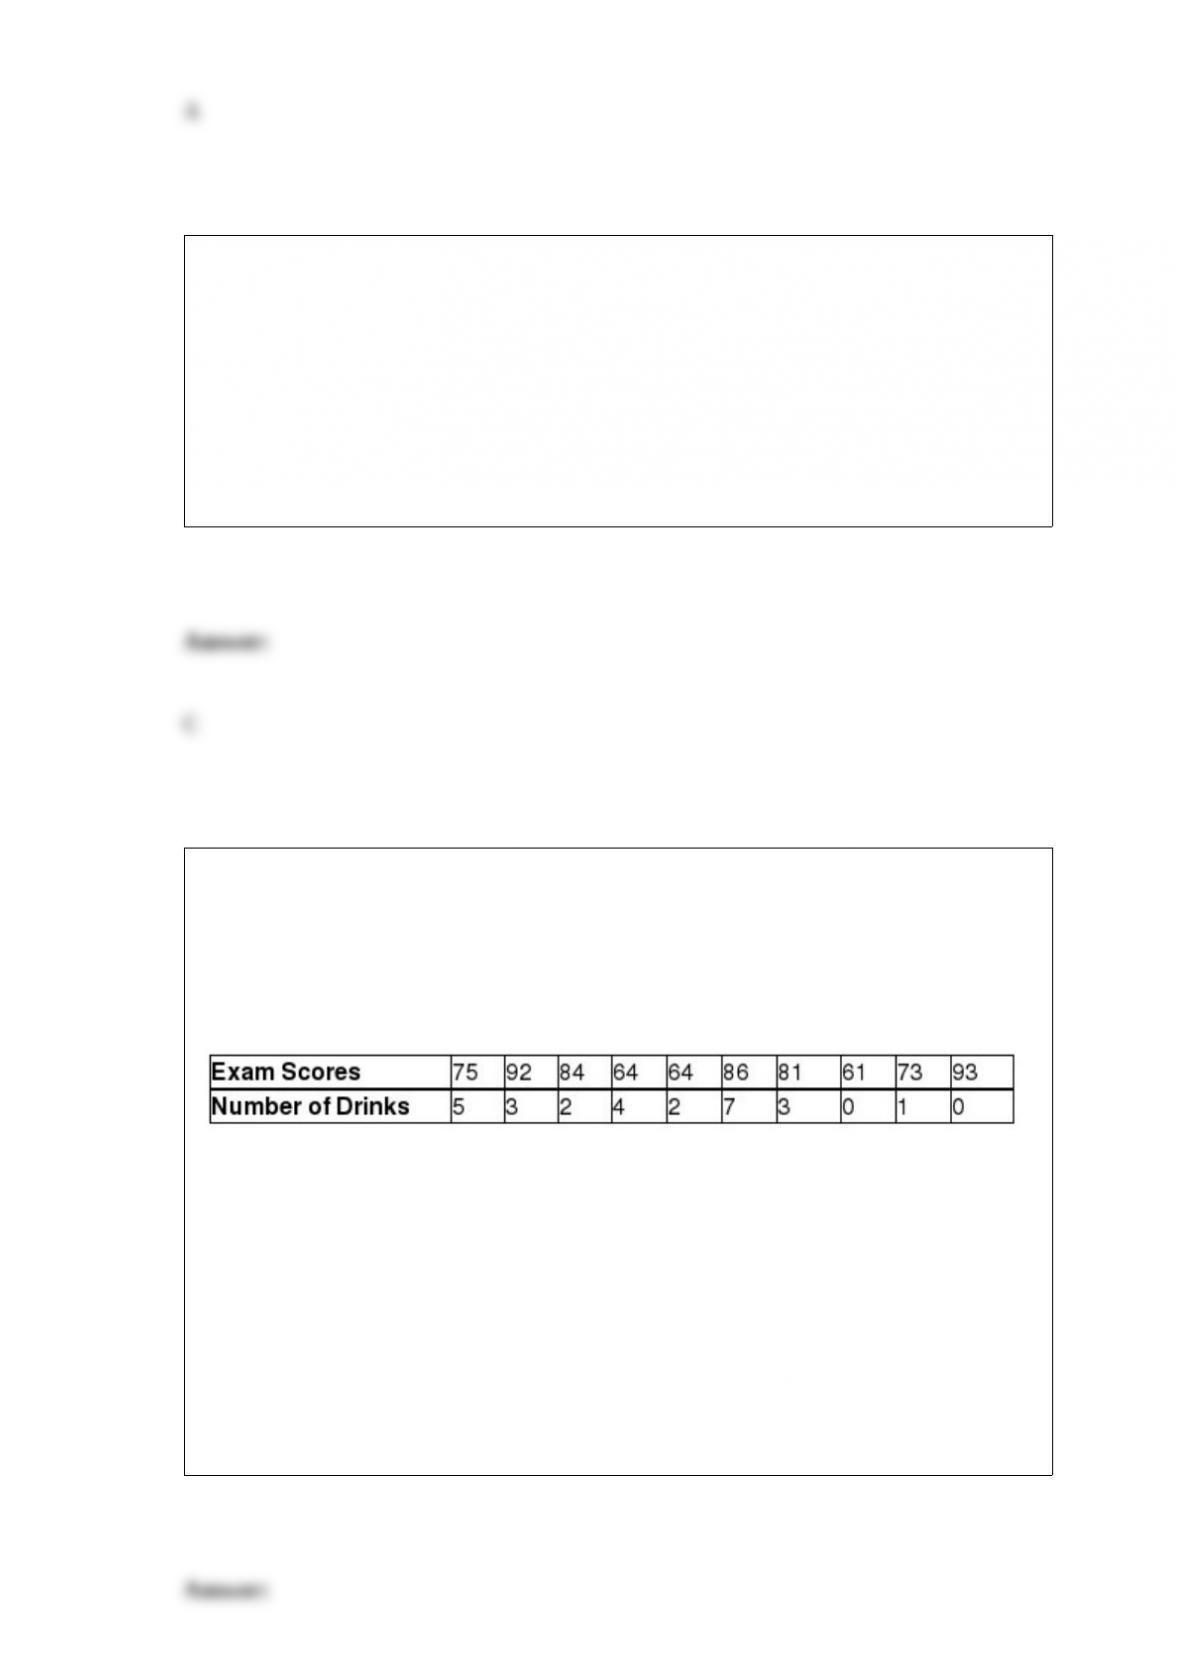
TABLE 3-13
Energy drink consumption has continued to gain in popularity since the 1997 debut of
Red Bull, the current leader in the energy drink market. Given below are the exam
scores and the number of 12-ounce energy drinks consumed within a week prior to the
exam of 10 college students.
Referring to Table 3-13, you will expect a decrease in the amount of energy drink
consumed within the week prior to the exam to be associated with
A) no predictable change in the number of energy drinks consumed after the exam.
B) an increase in the exam score.
C) a decrease in the exam score.
D) no predictable change in the exam score.
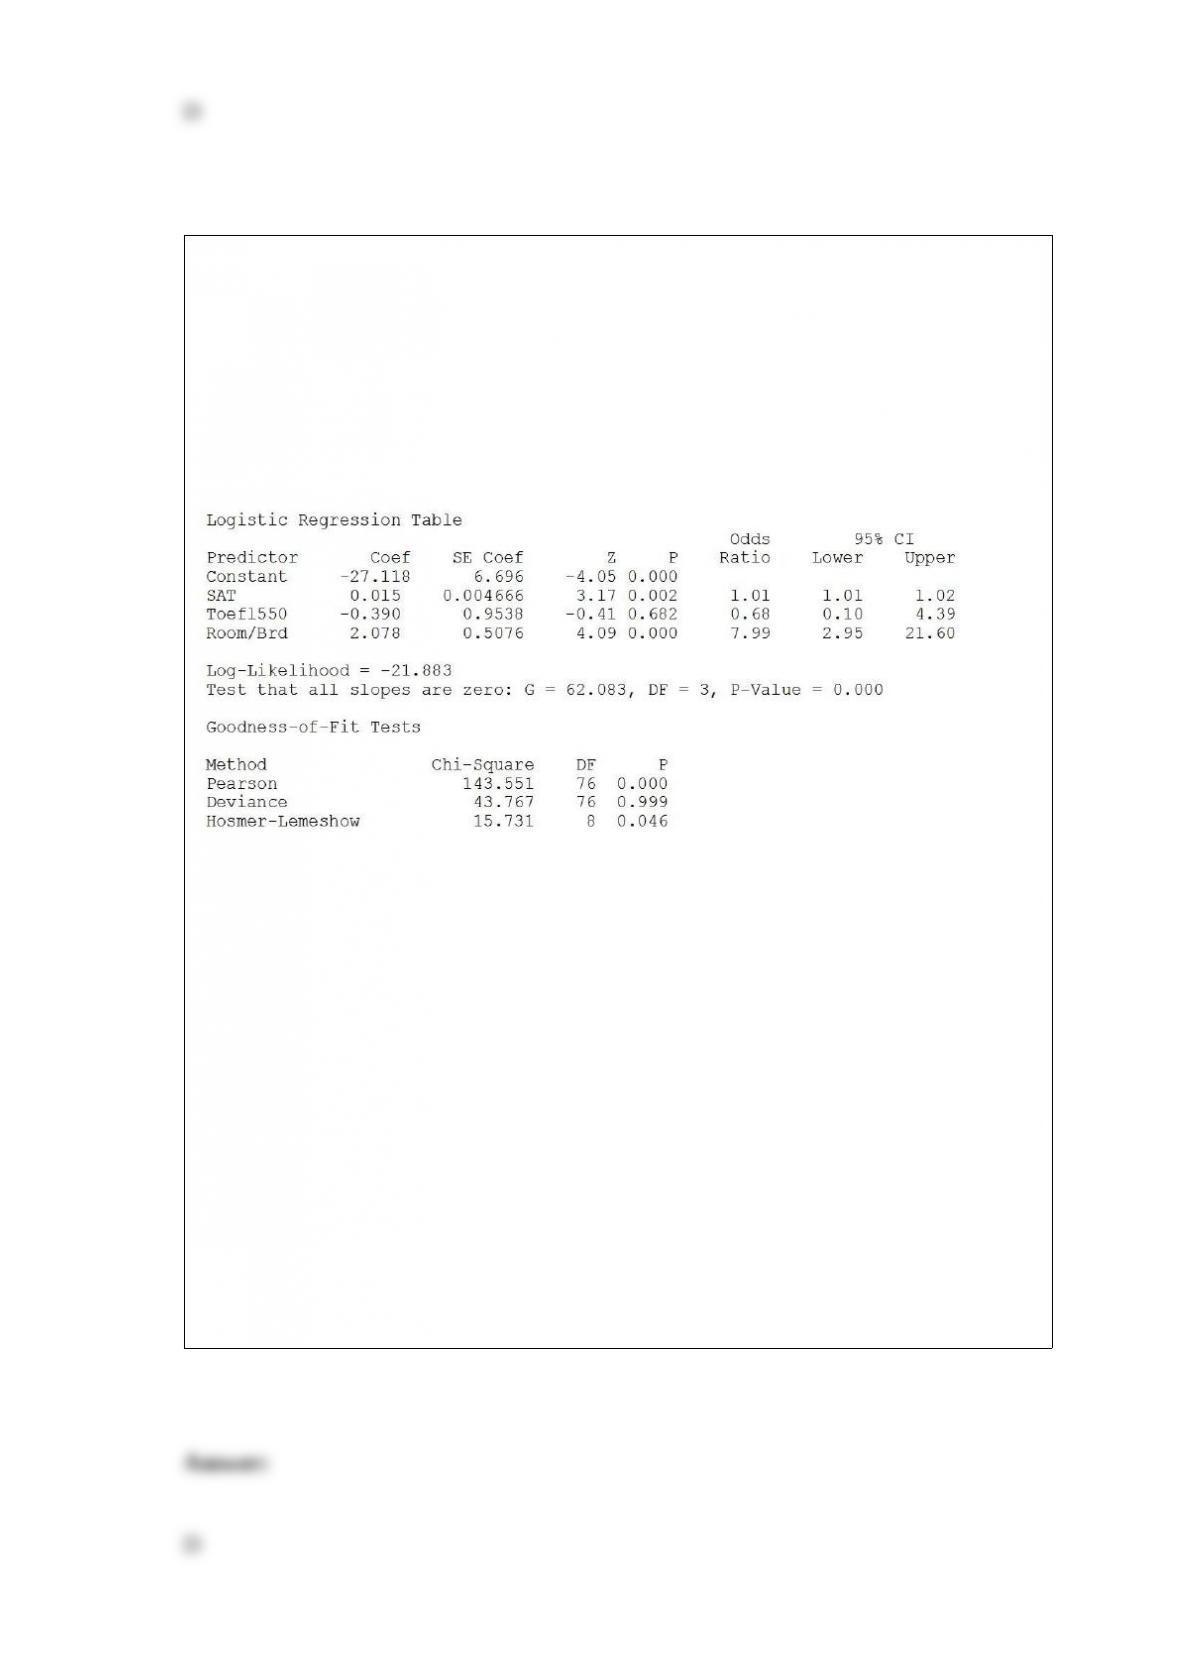
TABLE 17-11
A logistic regression model was estimated in order to predict the probability that a
randomly chosen university or college would be a private university using information
on mean total Scholastic Aptitude Test score (SAT) at the university or college, the
room and board expense measured in thousands of dollars (Room/Brd), and whether the
TOEFL criterion is at least 550 (Toefl550 = 1 if yes, 0 otherwise.) The dependent
variable, Y, is school type (Type = 1 if private and 0 otherwise).
Referring to Table 17-11, which of the following is the correct interpretation for the
SAT slope coefficient?
A) Holding constant the effect of the other variables, the estimated mean value of
school type increases by 0.015 for each increase of one point in average SAT score.
B) Holding constant the effect of the other variables, the estimated school type
increases by 0.015 for each increase of one point in average SAT score.
C) Holding constant the effect of the other variables, the estimated probability of the
school being a private school increases by 0.015 for each increase of one point in mean
SAT score.
D) Holding constant the effect of the other variables, the estimated natural logarithm of
the odds ratio of the school being a private school increases by 0.015 for each increase
of one point in mean SAT score.
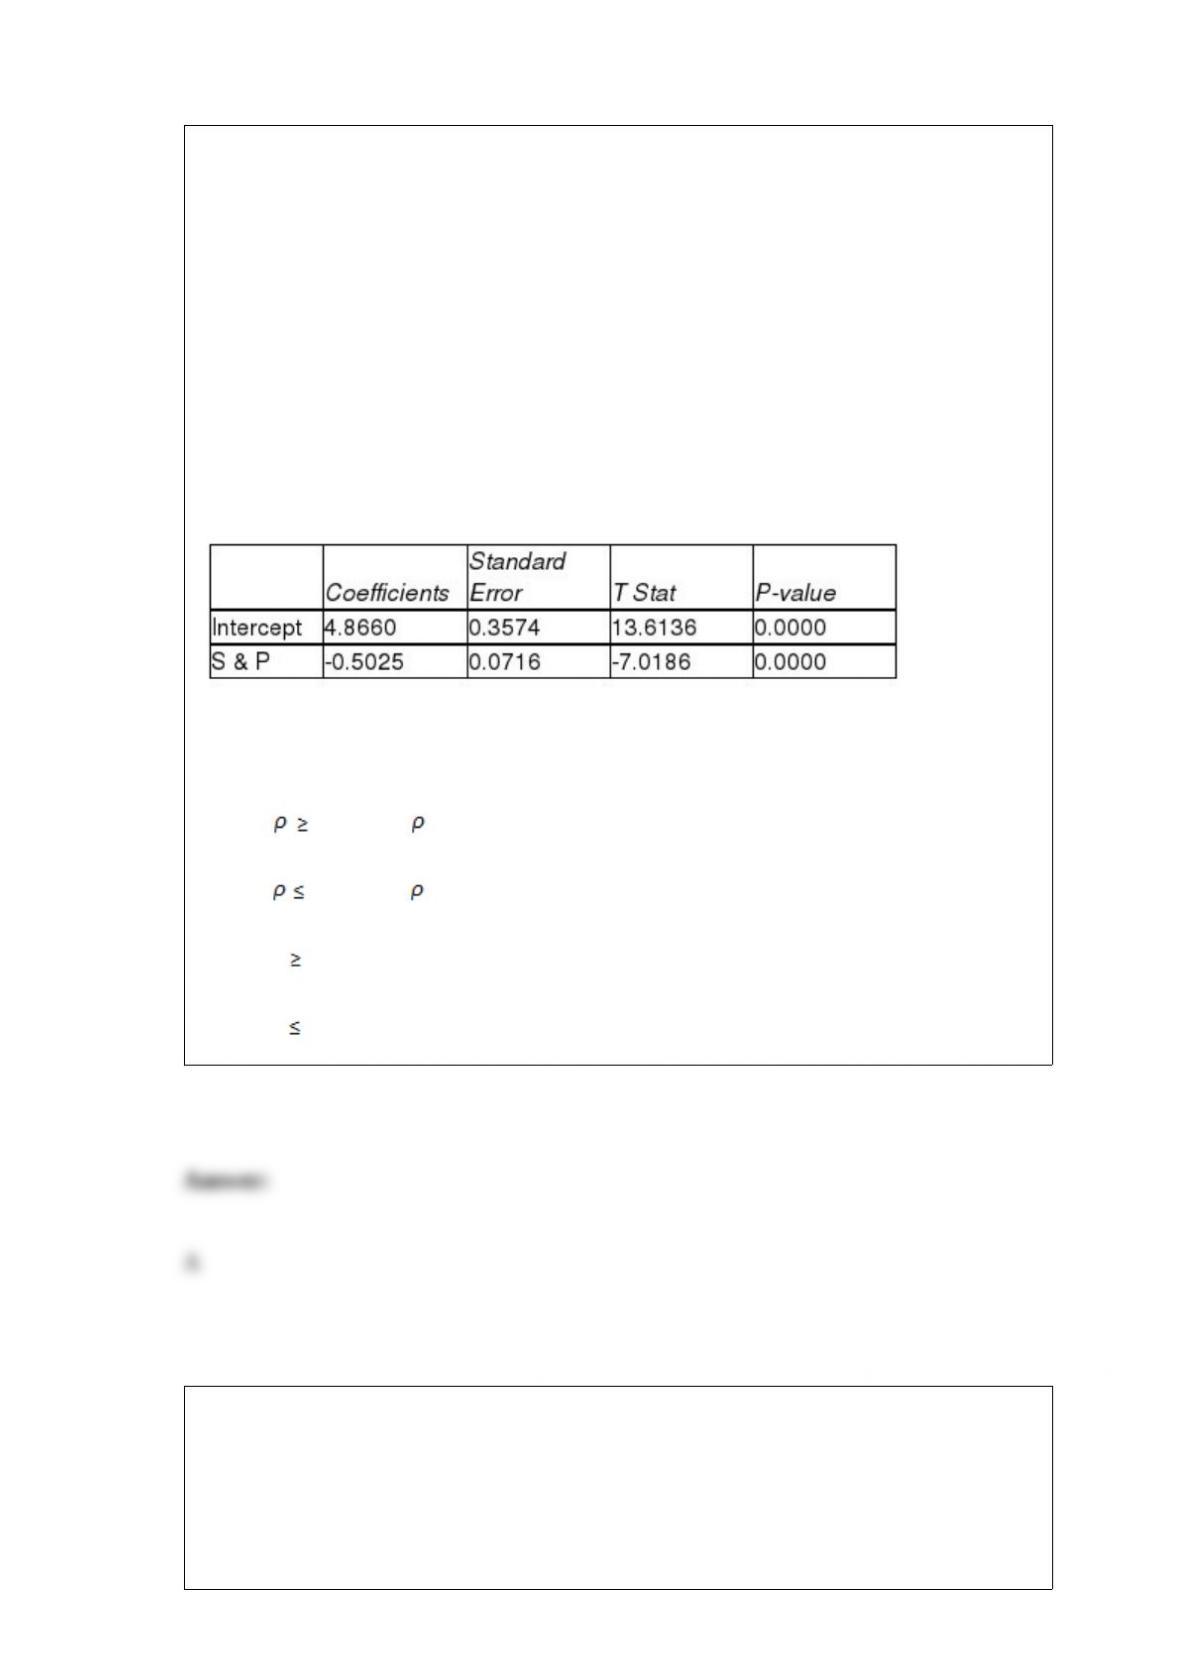
TABLE 13-7
An investment specialist claims that if one holds a portfolio that moves in the opposite
direction to the market index like the S&P 500, then it is possible to reduce the
variability of the portfolio's return. In other words, one can create a portfolio with
positive returns but less exposure to risk.
A sample of 26 years of S&P 500 index and a portfolio consisting of stocks of private
prisons, which are believed to be negatively related to the S&P 500 index, is collected.
A regression analysis was performed by regressing the returns of the prison stocks
portfolio (Y) on the returns of S&P 500 index (X) to prove that the prison stocks
portfolio is negatively related to the S&P 500 index at a 5% level of significance. The
results are given in the following EXCEL output.
Referring to Table 13-7, to test whether the prison stocks portfolio is negatively related
to the S&P 500 index, the appropriate null and alternative hypotheses are, respectively,
A) H0 : 0 vs. H1 : < 0.
B) H0 : 0 vs. H1 : > 0.
C) H0 : r 0 vs. H1 : r < 0.
D) H0 : r 0 vs. H1 : r > 0.
A survey claims that 9 out of 10 doctors recommend aspirin for their patients with
headaches. To test this claim against the alternative that the actual proportion of doctors
who recommend aspirin is less than 0.90, a random sample of 100 doctors was selected.
Suppose you reject the null hypothesis. What conclusion can you reach?
A) There is not sufficient evidence that the proportion of doctors who recommend

aspirin is not less than 0.90.
B) There is sufficient evidence that the proportion of doctors who recommend aspirin is
not less than 0.90.
C) There is not sufficient evidence that the proportion of doctors who recommend
aspirin is less than 0.90.
D) There is sufficient evidence that the proportion of doctors who recommend aspirin is
less than 0.90.
When polygons or histograms are constructed, which axis must show the true zero or
"origin"?
A) The horizontal axis
B) The vertical axis
C) Both the horizontal and vertical axes
D) Neither the horizontal nor the vertical axis
TABLE 17-9
What are the factors that determine the acceleration time (in sec.) from 0 to 60 miles per
hour of a car? Data on the following variables for 171 different vehicle models were
collected:
Accel Time: Acceleration time in sec.
Cargo Vol: Cargo volume in cu. ft.
HP: Horsepower
MPG: Miles per gallon
SUV: 1 if the vehicle model is an SUV with Coupe as the base when SUV and Sedan
are both 0
Sedan: 1 if the vehicle model is a sedan with Coupe as the base when SUV and Sedan
are both 0
The regression results using acceleration time as the dependent variable and the
remaining variables as the independent variables are presented below.
The various residual plots are as shown below.
The coefficient of partial determination ( ) of each of the 5
predictors are, respectively, 0.0380, 0.4376, 0.0248, 0.0188, and 0.0312.
The coefficient of multiple determination for the regression model using each of the 5
variables Xj as the dependent variable and all other X variables as independent variables
( ) are, respectively, 0.7461, 0.5676, 0.6764, 0.8582, 0.6632.
Referring to Table 17-9, ________ of the variation in Accel Time can be explained by
the five independent variables.
The amount of time necessary for assembly line workers to complete a product is a
normal variable with a mean of 15 minutes and a standard deviation of 2 minutes. So,
70% of the products would be assembled within ________ minutes.
TABLE 4-5
In a meat packaging plant Machine A accounts for 60% of the plant's output, while
Machine B accounts for 40% of the plant's output. In total, 4% of the packages are
improperly sealed. Also, 3% of the packages are from Machine A and are improperly
sealed.
Referring to Table 4-5, if a package selected at random came from Machine B, the
probability that it is improperly sealed is ________.
Referring to Table 14-19, what is the estimated odds ratio for a home owner with a
family income of $100,000 and a lawn size of 5,000 square feet?
TABLE 10-7
A buyer for a manufacturing plant suspects that his primary supplier of raw materials is
overcharging. In order to determine if his suspicion is correct, he contacts a second
supplier and asks for the prices on various identical materials. He wants to compare
these prices with those of his primary supplier. The data collected is presented in the
table below, with some summary statistics presented (all of these might not be
necessary to answer the questions which follow). The buyer believes that the
differences are normally distributed and will use this sample to perform an appropriate
test at a level of significance of 0.01.
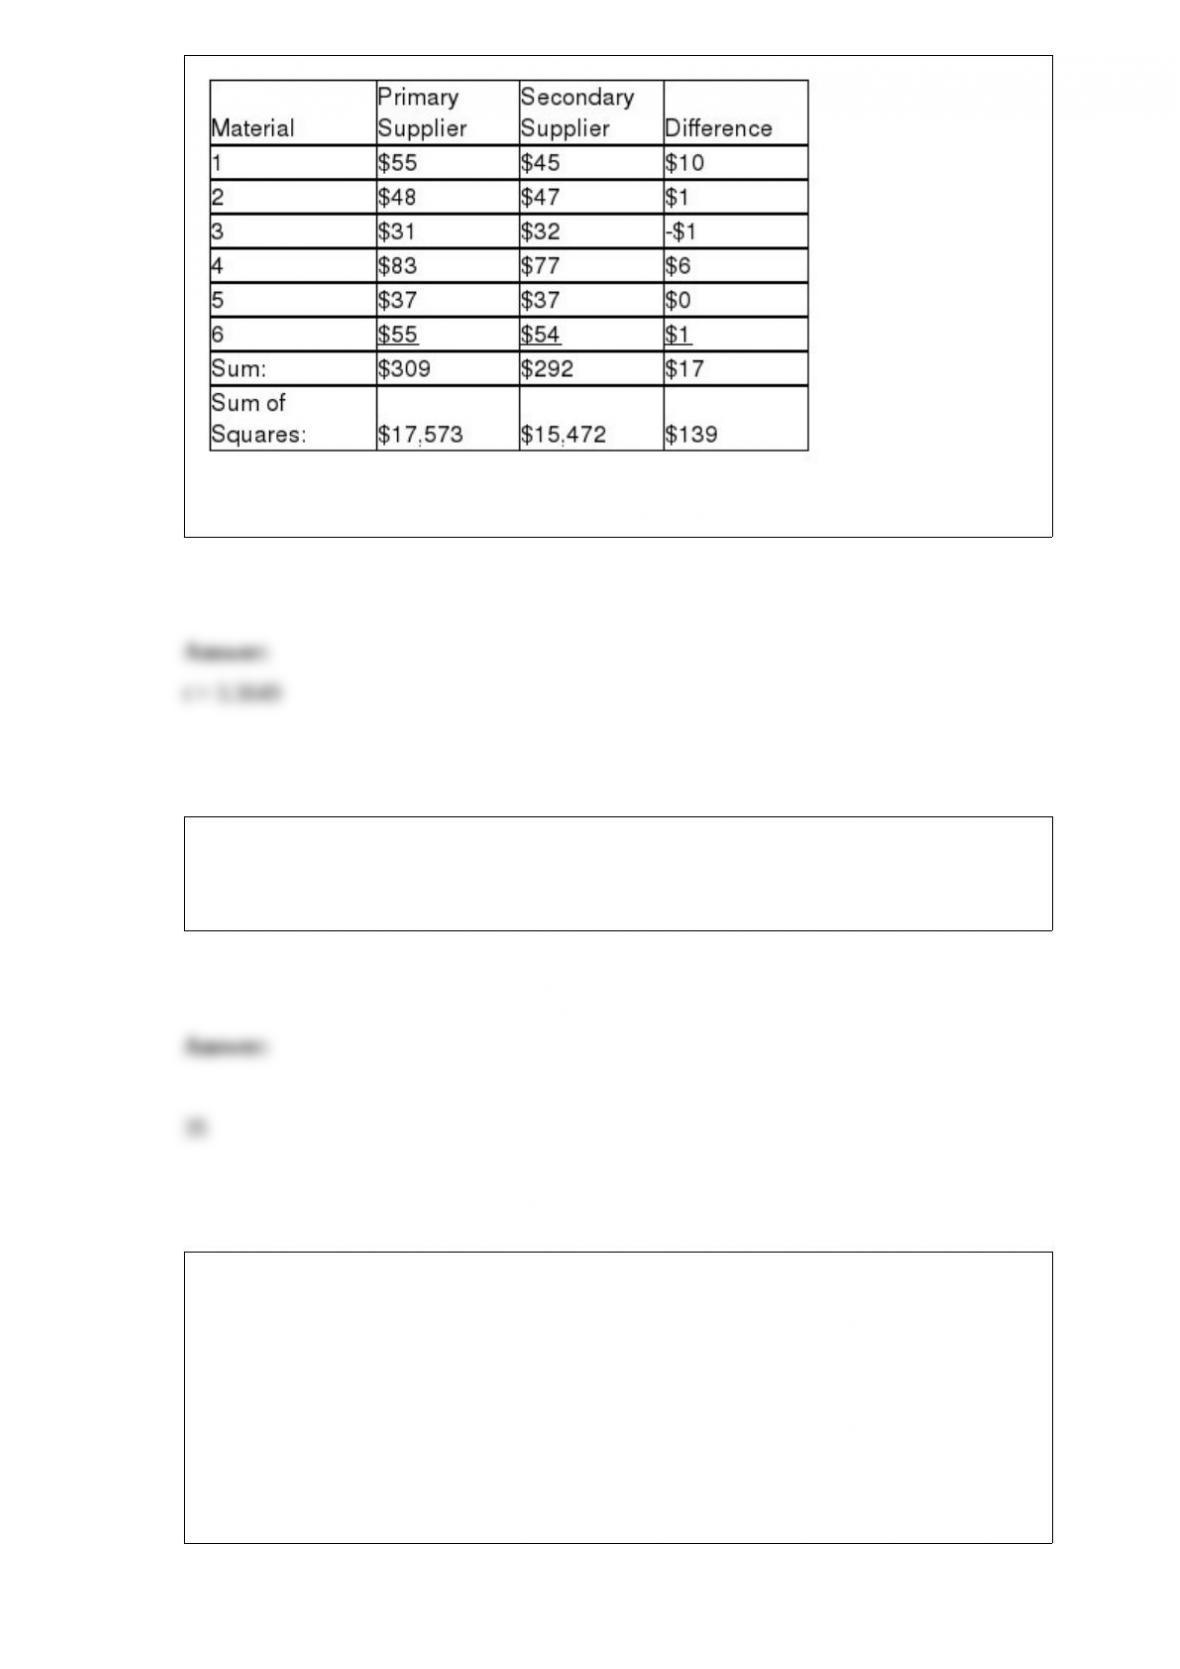
Referring to Table 10-7, the decision rule is to reject the null hypothesis if ________.
Seven passengers are on a waiting list for an overbooked flight. As a result of
cancellations, 3 seats become available. How many different ways can those 3 available
seats be filled regardless of the order?
TABLE 4-12
Jake woke up late in the morning on the day that he has to go to school to take an
important test. He can either take the shuttle bus which is usually running late 20% of
the time or ride his unreliable motorcycle which breaks down 40% of the time. He
decides to toss a fair coin to make his choice.
Referring to Table 4-12, if Jake is late to the test, what is the probability that he rode his
bike?
The head of a computer science department is interested in estimating the proportion of
students entering the department who will choose the new computer engineering option.
A preliminary sample indicates that the proportion will be around 0.25. Therefore, what
size sample should the department head take if she wants to be 95% confident that the
estimate is within 0.10 of the true proportion?


