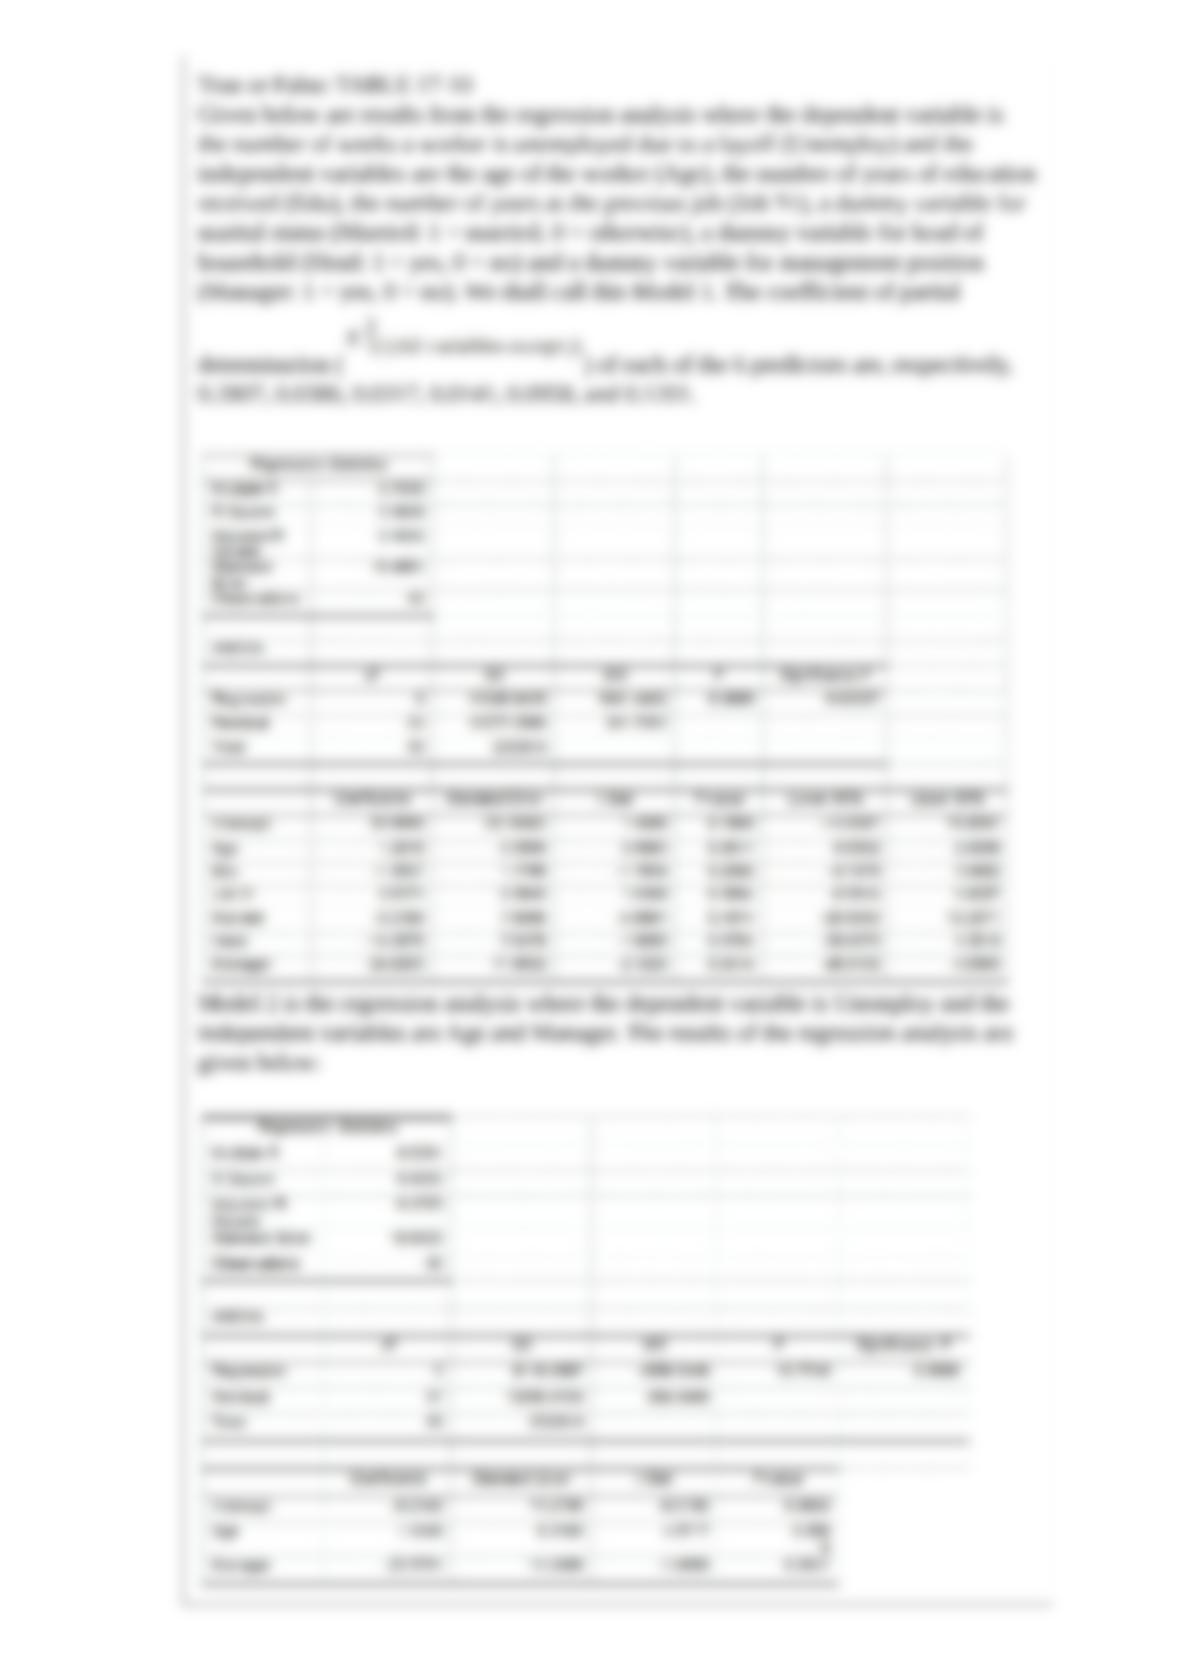
True or False: TABLE 17-10
Given below are results from the regression analysis where the dependent variable is
the number of weeks a worker is unemployed due to a layoff (Unemploy) and the
independent variables are the age of the worker (Age), the number of years of education
received (Edu), the number of years at the previous job (Job Yr), a dummy variable for
marital status (Married: 1 = married, 0 = otherwise), a dummy variable for head of
household (Head: 1 = yes, 0 = no) and a dummy variable for management position
(Manager: 1 = yes, 0 = no). We shall call this Model 1. The coefficient of partial
determination ( ) of each of the 6 predictors are, respectively,
0.2807, 0.0386, 0.0317, 0.0141, 0.0958, and 0.1201.
Model 2 is the regression analysis where the dependent variable is Unemploy and the
independent variables are Age and Manager. The results of the regression analysis are
given below:

Referring to Table 17-10, Model 1, there is sufficient evidence that at least one of the
explanatory variables is related to the number of weeks a worker is unemployed due to
a layoff at a 10% level of significance.
True or False: A population parameter is used to estimate a confidence interval.
TABLE 9-7
A major home improvement store conducted its biggest brand recognition campaign in
the company’s history. A series of new television advertisements featuring well-known
entertainers and sports figures were launched. A key metric for the success of television
advertisements is the proportion of viewers who “like the ads a lot”. A study of 1,189
adults who viewed the ads reported that 230 indicated that they “like the ads a lot.” The
percentage of a typical television advertisement receiving the “like the ads a lot” score
is believed to be 22%. Company officials wanted to know if there is evidence that the
series of television advertisements are less successful than the typical ad (i.e. if there is
evidence that the population proportion of “like the ads a lot” for the company’s ads is
less than 0.22) at a 0.01 level of significance.
True or False: Referring to Table 9-7, the null hypothesis would be rejected.
True or False: A regression had the following results: SST = 102.55, SSE = 82.04. It can
be said that 90.0% of the variation in the dependent variable is explained by the
independent variables in the regression.
TABLE 15-6
Given below are results from the regression analysis on 40 observations where the
dependent variable is the number of weeks a worker is unemployed due to a layoff (Y)
and the independent variables are the age of the worker (X1), the number of years of
education received (X2), the number of years at the previous job (X3), a dummy variable
for marital status (X4: 1 = married, 0 = otherwise), a dummy variable for head of
household (X5: 1 = yes, 0 = no) and a dummy variable for management position (X6: 1
= yes, 0 = no).
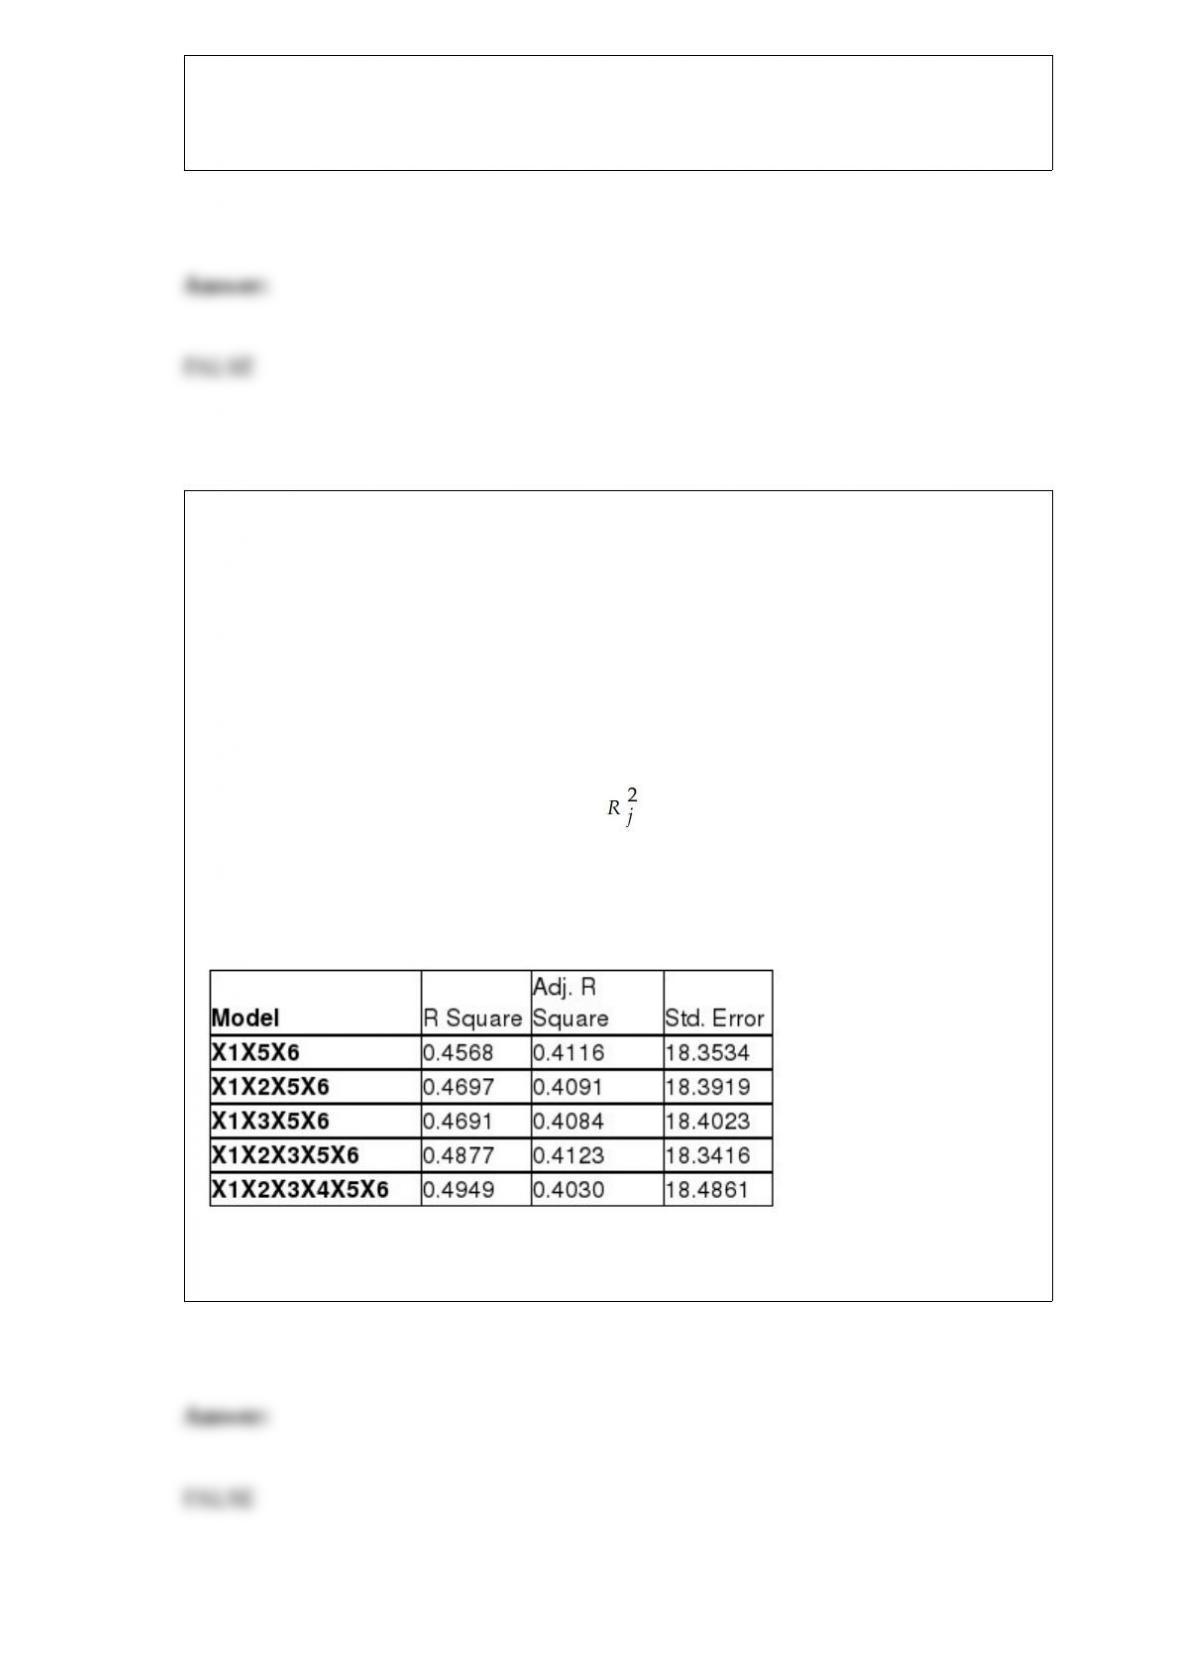
The coefficient of multiple determination ( ) for the regression model using each of
the 6 variables Xj as the dependent variable and all other X variables as independent
variables are, respectively, 0.2628, 0.1240, 0.2404, 0.3510, 0.3342 and 0.0993.
The partial results from best-subset regression are given below:
True or False: Referring to Table 15-6, the variable X3 should be dropped to remove
collinearity.

TABLE 12-20
A filling machine at a local soft drinks company is calibrated to fill the cans at a mean
amount of 12 fluid ounces and a standard deviation of 0.5 ounces. The company wants
to test whether the standard deviation of the amount filled by the machine is 0.5 ounces.
A random sample of 15 cans filled by the machine reveals a standard deviation of 0.67
ounces.
True or False: Referring to Table 12-20, in order to perform the test, you need to assume
that the amount filled by the machine follows a normal distribution.
True or False: The base period should be recent so that a price index is not severely
affected by change in technology, and consumer attitudes and habits.
True or False: Any set of normally distributed data can be transformed to its
standardized form.
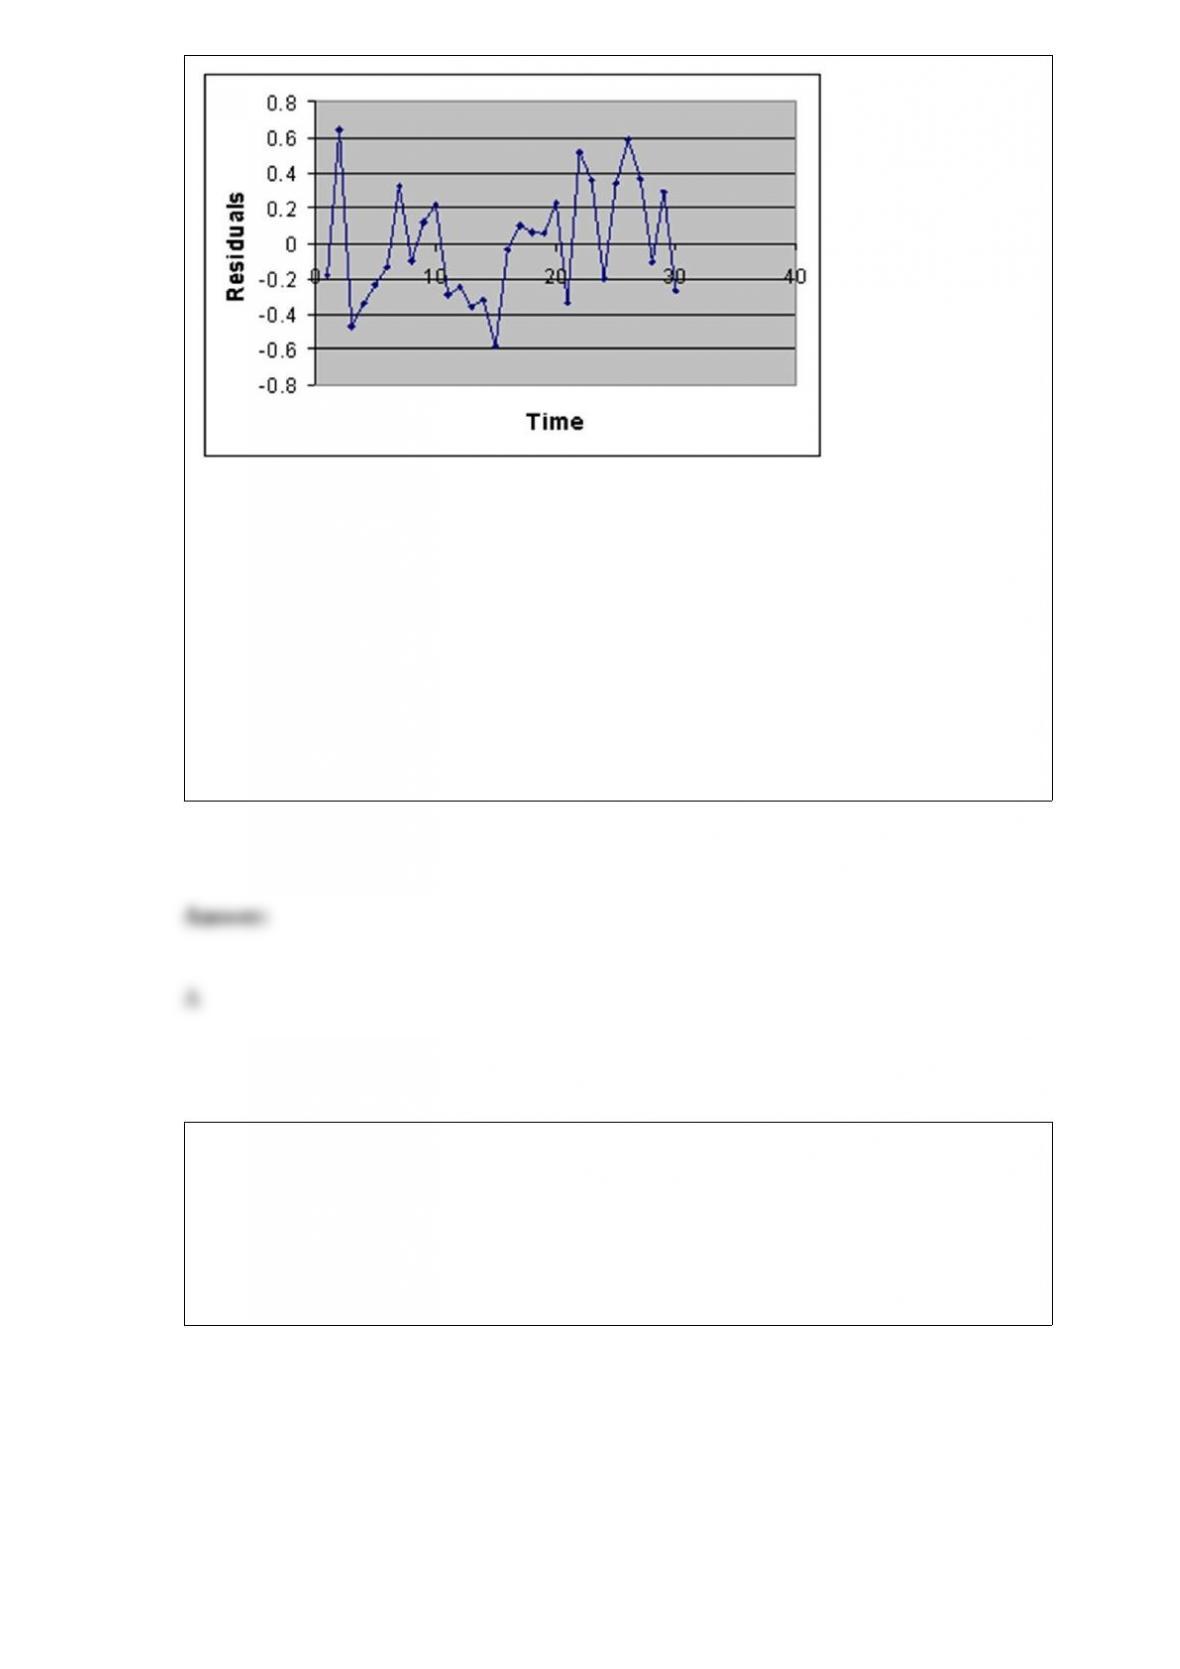
TABLE 13-12
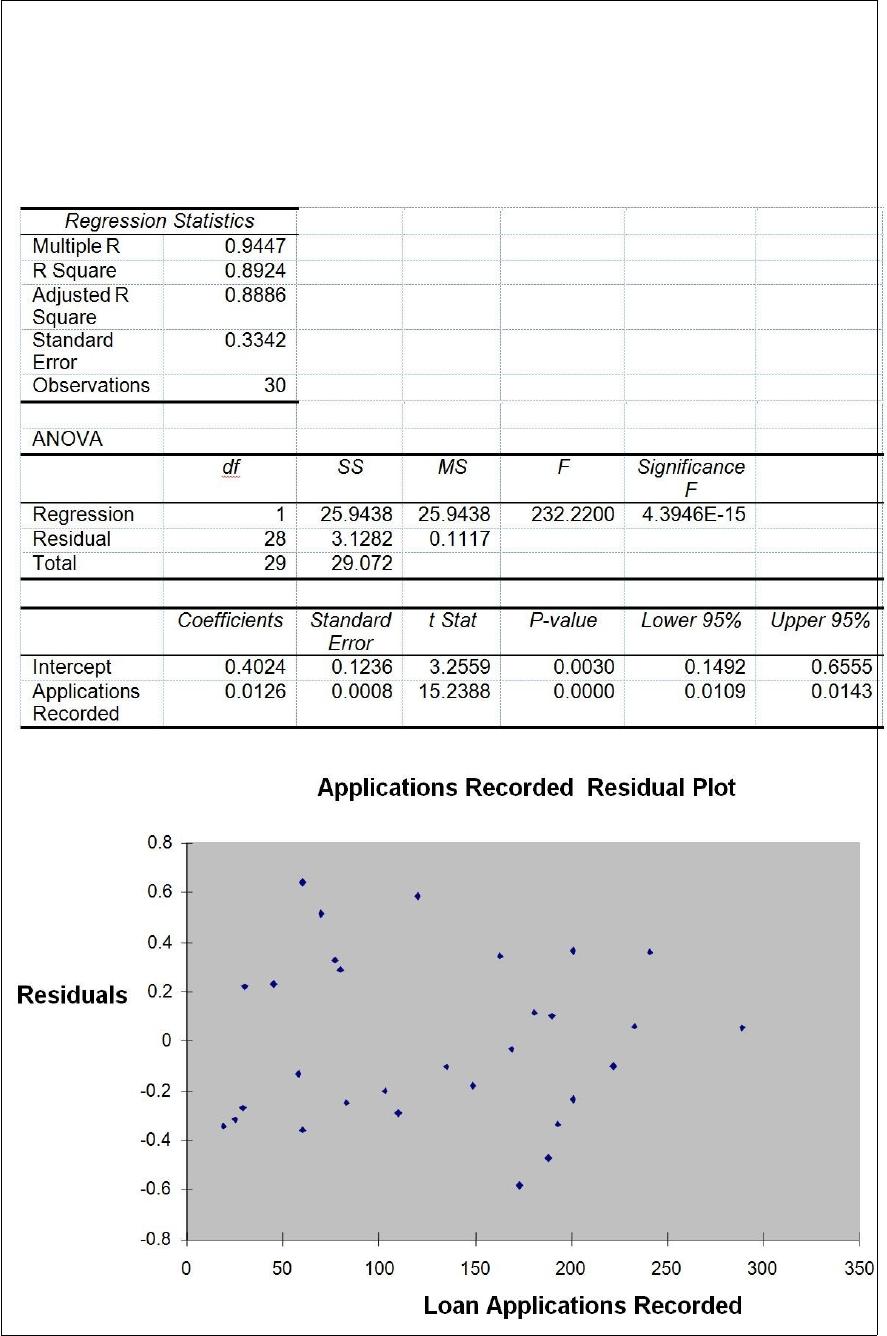
The manager of the purchasing department of a large saving and loan organization
would like to develop a model to predict the amount of time (measured in hours) it
takes to record a loan application. Data are collected from a sample of 30 days, and the
number of applications recorded and completion time in hours is recorded. Below is the
regression output:
Referring to Table 13-12, the degrees of freedom for the F test on whether the number
of load applications recorded affects the amount of time are
A) 1, 28.
B) 1, 29.
C) 28, 1.
D) 29, 1.
TABLE 17-1
A real estate builder wishes to determine how house size (House) is influenced by
family income (Income), family size (Size), and education of the head of household
(School). House size is measured in hundreds of square feet, income is measured in
thousands of dollars, and education is in years. The builder randomly selected 50
families and ran the multiple regression. Microsoft Excel output is provided below:
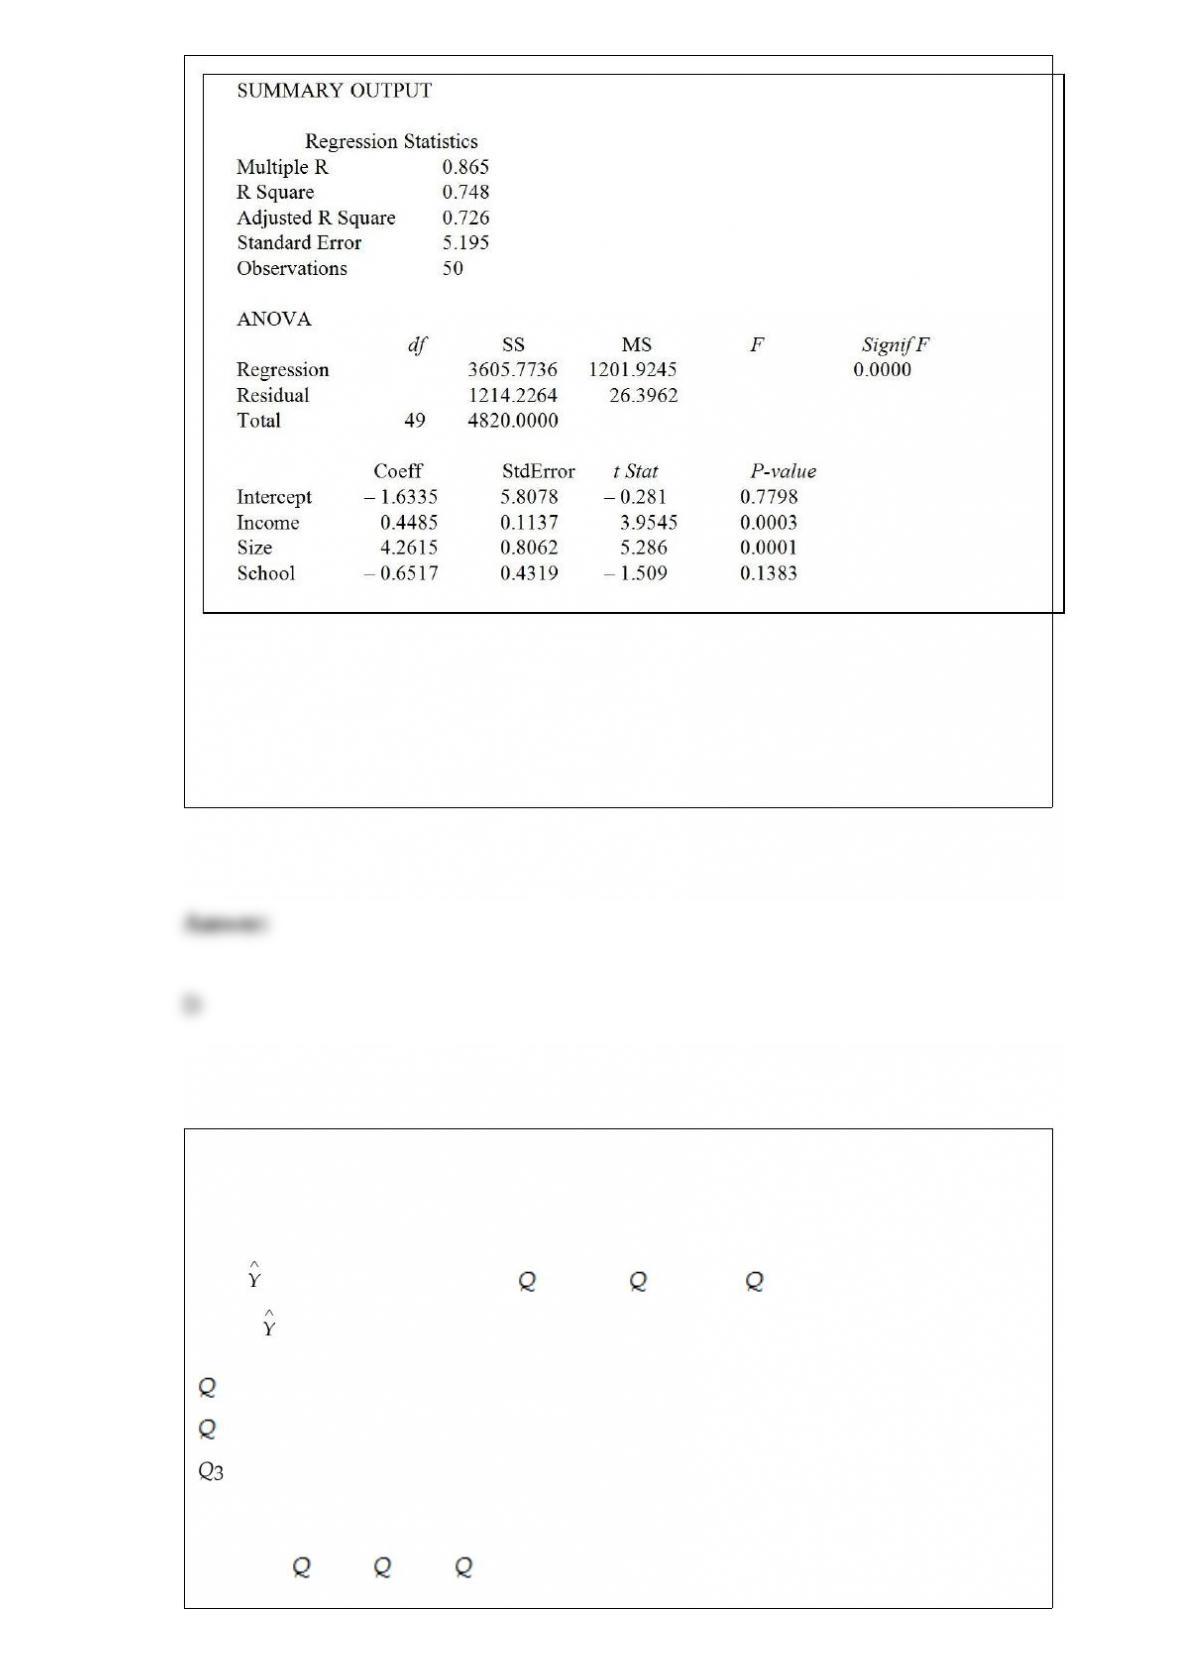
Referring to Table 17-1, the observed value of the F-statistic is missing from the
printout. What are the degrees of freedom for this F-statistic?
A) 46 for the numerator, 3 for the denominator
B) 3 for the numerator, 49 for the denominator
C) 46 for the numerator, 49 for the denominator
D) 3 for the numerator, 46 for the denominator
TABLE 16-12
A local store developed a multiplicative time-series model to forecast its revenues in
future quarters, using quarterly data on its revenues during the 5-year period from 2008
to 2012. The following is the resulting regression equation:
log10 = 6.102 + 0.012 X – 0.129 1 – 0.054 2 + 0.098 3
where is the estimated number of contracts in a quarter
X is the coded quarterly value with X = 0 in the first quarter of 2008
1 is a dummy variable equal to 1 in the first quarter of a year and 0 otherwise
2 is a dummy variable equal to 1 in the second quarter of a year and 0 otherwise
is a dummy variable equal to 1 in the third quarter of a year and 0 otherwise
Referring to Table 16-12, to obtain a fitted value for the fourth quarter of 2009 using the
model, which of the following sets of values should be used in the regression equation?
A) X = 7, 1 = 0, 2 = 0, 3 = 0
B) X = 7, 1 = 1, 2 = 0, 3 = 0
C) X = 8, 1 = 0, 2 = 0, 3 = 0
D) X = 8, 1 = 1, 2 = 0, 3 = 0
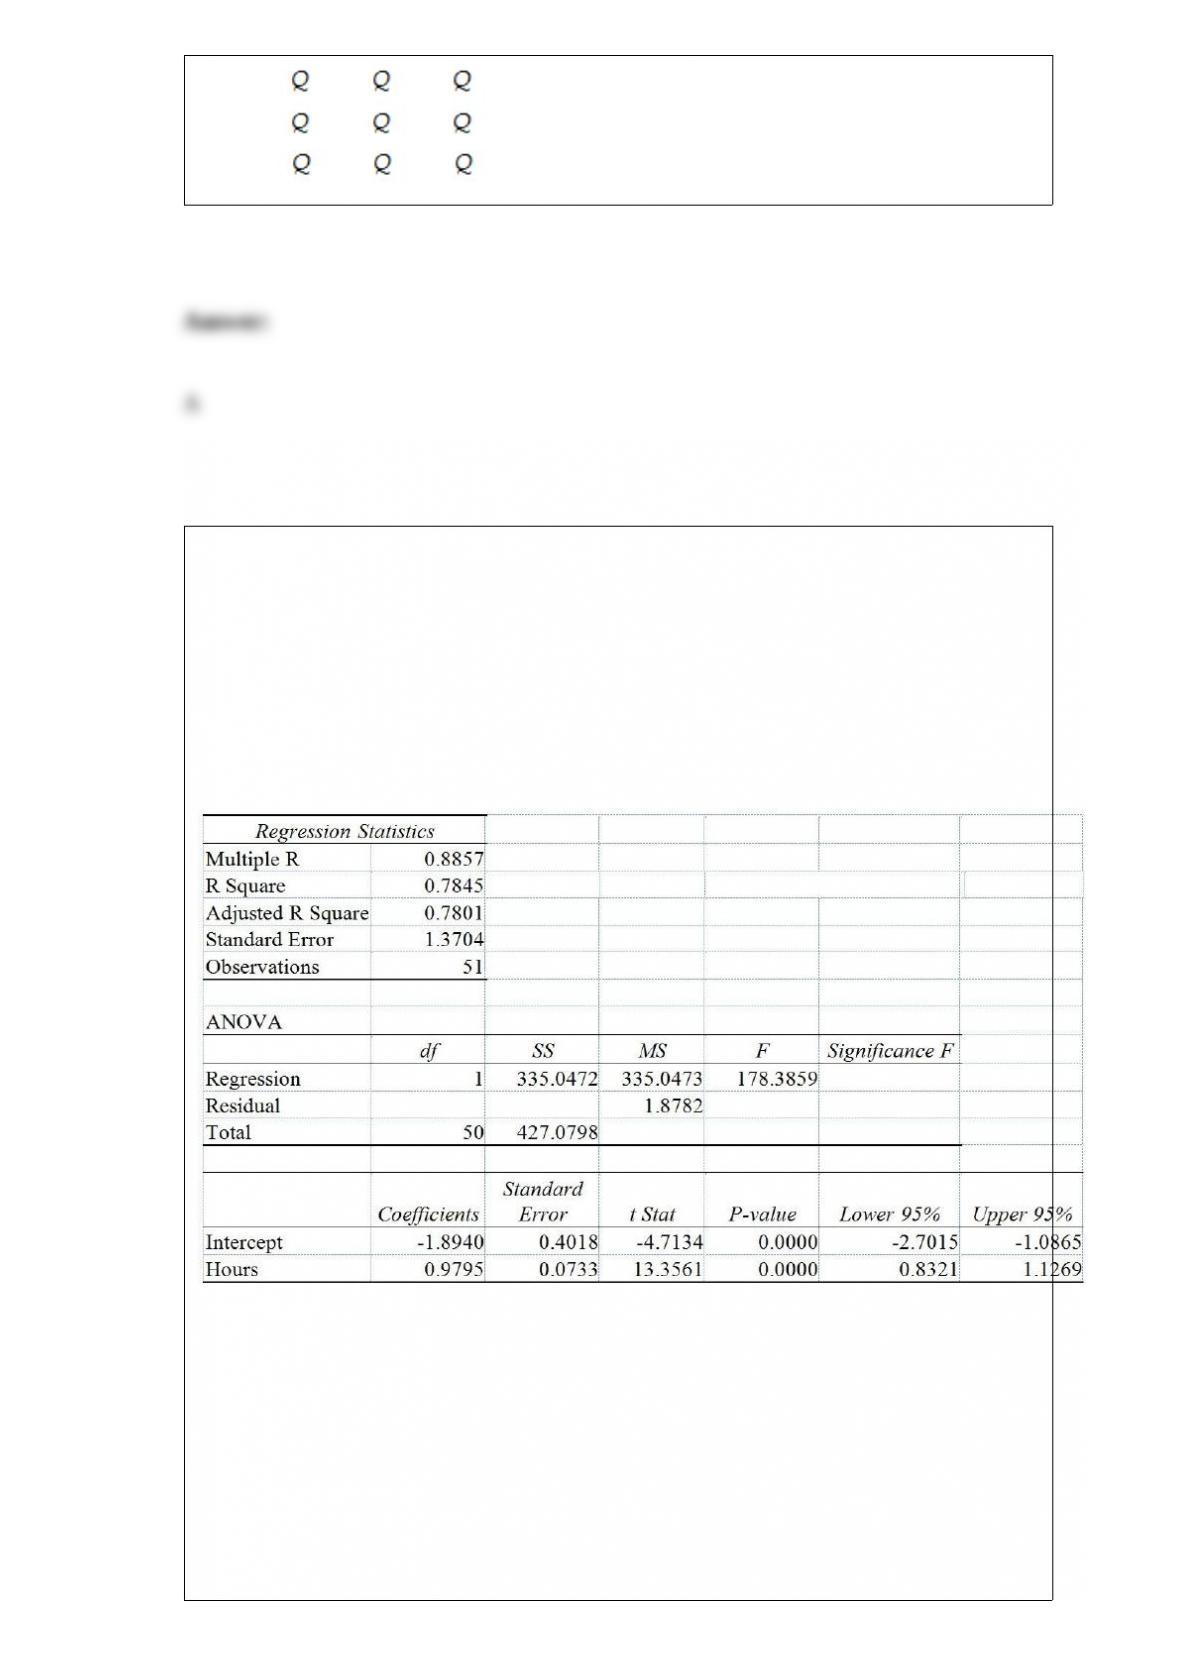
TABLE 13-9
It is believed that, the average numbers of hours spent studying per day (HOURS)
during undergraduate education should have a positive linear relationship with the
starting salary (SALARY, measured in thousands of dollars per month) after graduation.
Given below is the Excel output for predicting starting salary (Y) using number of hours
spent studying per day (X) for a sample of 51 students. NOTE: Only partial output is
shown.
Note: 2.051E – 05 = 2.051 ∗ 10-05 and 5.944E – 18 = 5.944 ∗ 10-18.
Referring to Table 13-9, the estimated change in mean salary (in thousands of dollars)
as a result of spending an extra hour per day studying is
A) -1.8940.
B) 0.7845.

C) 0.9795.
D) 335.0473.
If you wanted to find out if alcohol consumption (measured in fluid oz.) and grade point
average on a 4-point scale are linearly related, you would perform a
A) X2 test for the difference in two proportions.
B) X2 test for independence.
C) Z test for the difference in two proportions.
D) t test for a correlation coefficient.
TABLE 17-11
A logistic regression model was estimated in order to predict the probability that a
randomly chosen university or college would be a private university using information
on mean total Scholastic Aptitude Test score (SAT) at the university or college, the
room and board expense measured in thousands of dollars (Room/Brd), and whether the
TOEFL criterion is at least 550 (Toefl550 = 1 if yes, 0 otherwise.) The dependent
variable, Y, is school type (Type = 1 if private and 0 otherwise).
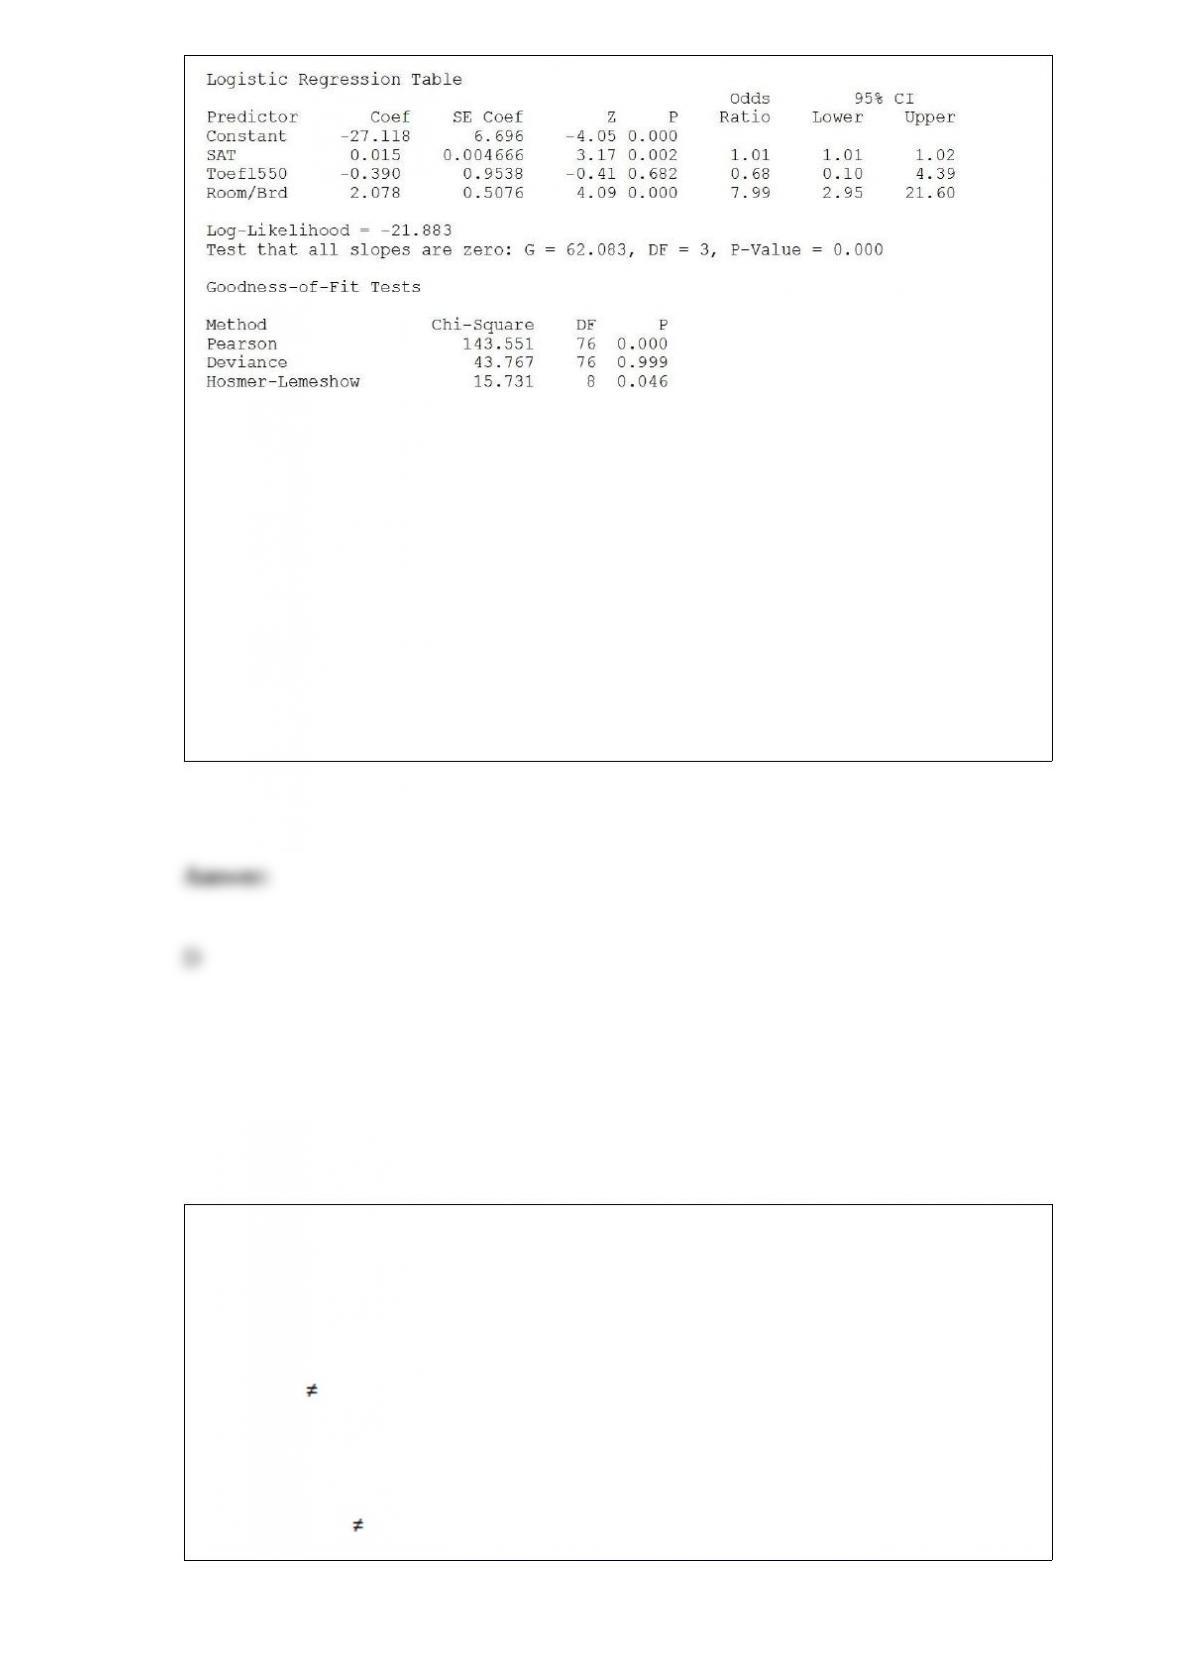
Referring to Table 17-11, which of the following is the correct interpretation for the
SAT slope coefficient?
A) Holding constant the effect of the other variables, the estimated mean value of
school type increases by 0.015 for each increase of one point in average SAT score.
B) Holding constant the effect of the other variables, the estimated school type
increases by 0.015 for each increase of one point in average SAT score.
C) Holding constant the effect of the other variables, the estimated probability of the
school being a private school increases by 0.015 for each increase of one point in mean
SAT score.
D) Holding constant the effect of the other variables, the estimated natural logarithm of
the odds ratio of the school being a private school increases by 0.015 for each increase
of one point in mean SAT score.
In testing for differences between the median of two independent populations, the null
hypothesis is
A) H0 : MD = 0.
B) H0 : MD 0.
C) H0 : M1 – M2 = 0.
D) H0 : M1 – M2 0.
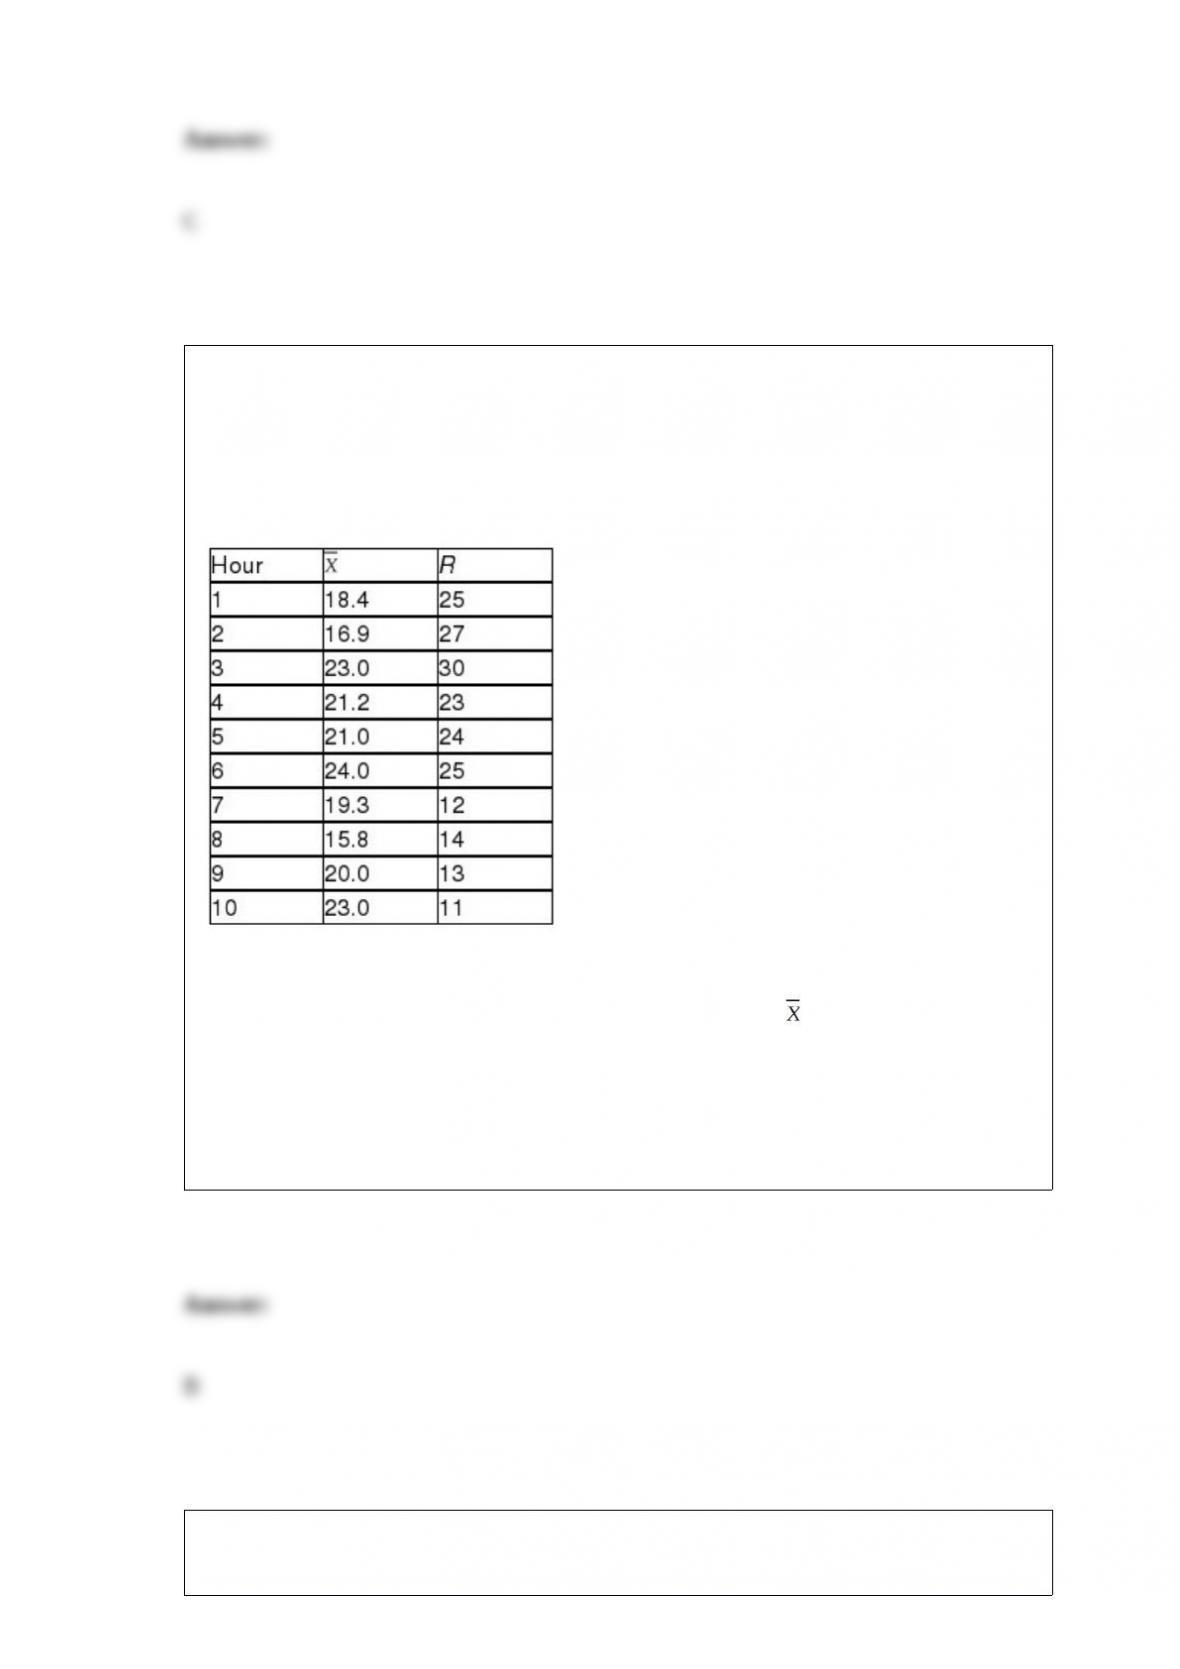
TABLE 18-4
A factory supervisor is concerned that the time it takes workers to complete an
important production task (measured in seconds) is too erratic and adversely affects
expected profits. The supervisor proceeds by randomly sampling 5 individuals per hour
for a period of 10 hours. The sample mean and range for each hour are listed below.
She also decides that lower and upper specification limit for the critical-to-quality
variable should be 10 and 30 seconds, respectively.
Referring to Table 18-4, suppose the supervisor constructs an chart to see if the
process is in-control. What is the center line of the chart?
A) 20.00
B) 20.26
C) 21.00
D) 24.26
TABLE 17-9
What are the factors that determine the acceleration time (in sec.) from 0 to 60 miles per
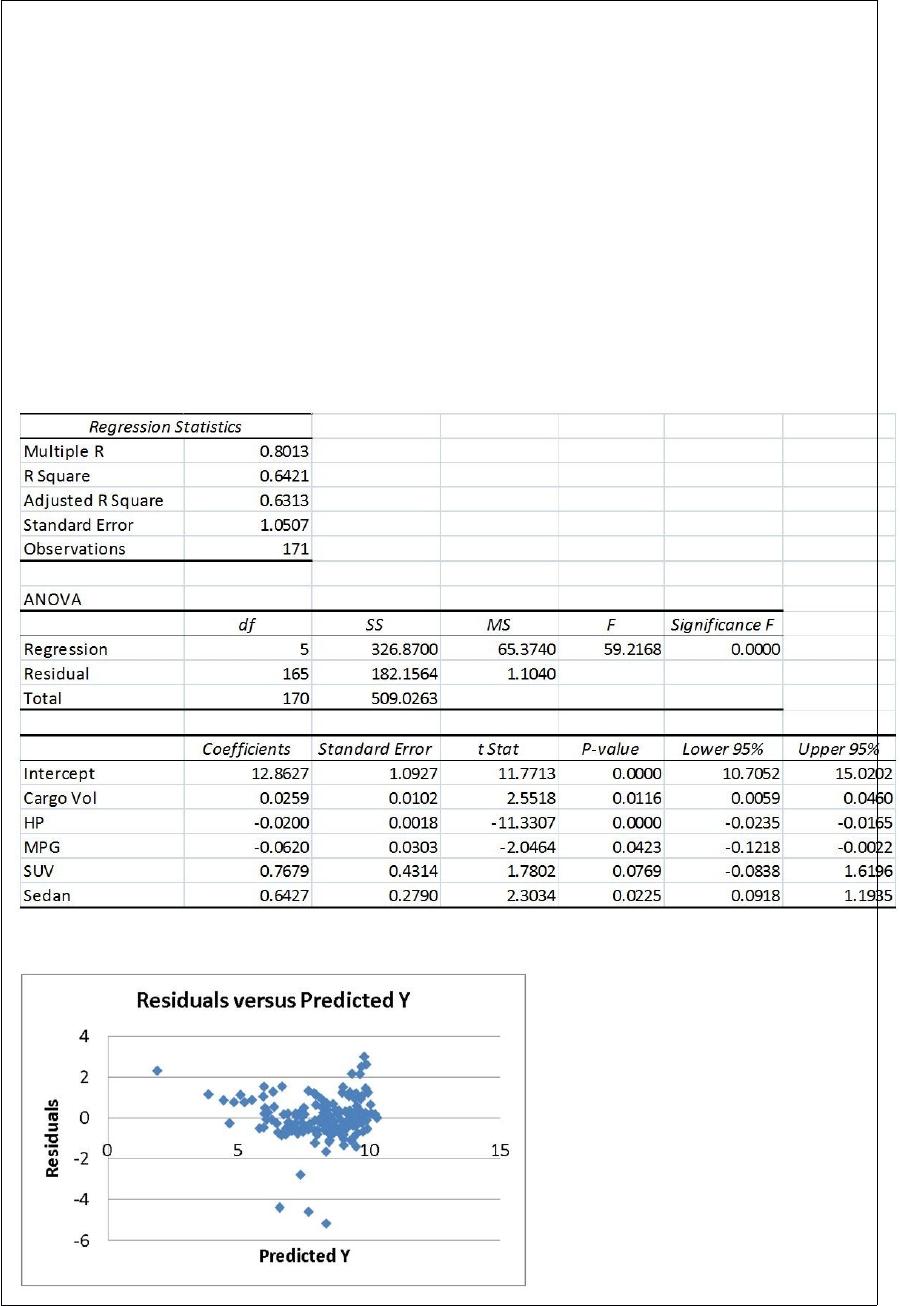
hour of a car? Data on the following variables for 171 different vehicle models were
collected:
Accel Time: Acceleration time in sec.
Cargo Vol: Cargo volume in cu. ft.
HP: Horsepower
MPG: Miles per gallon
SUV: 1 if the vehicle model is an SUV with Coupe as the base when SUV and Sedan
are both 0
Sedan: 1 if the vehicle model is a sedan with Coupe as the base when SUV and Sedan
are both 0
The regression results using acceleration time as the dependent variable and the
remaining variables as the independent variables are presented below.
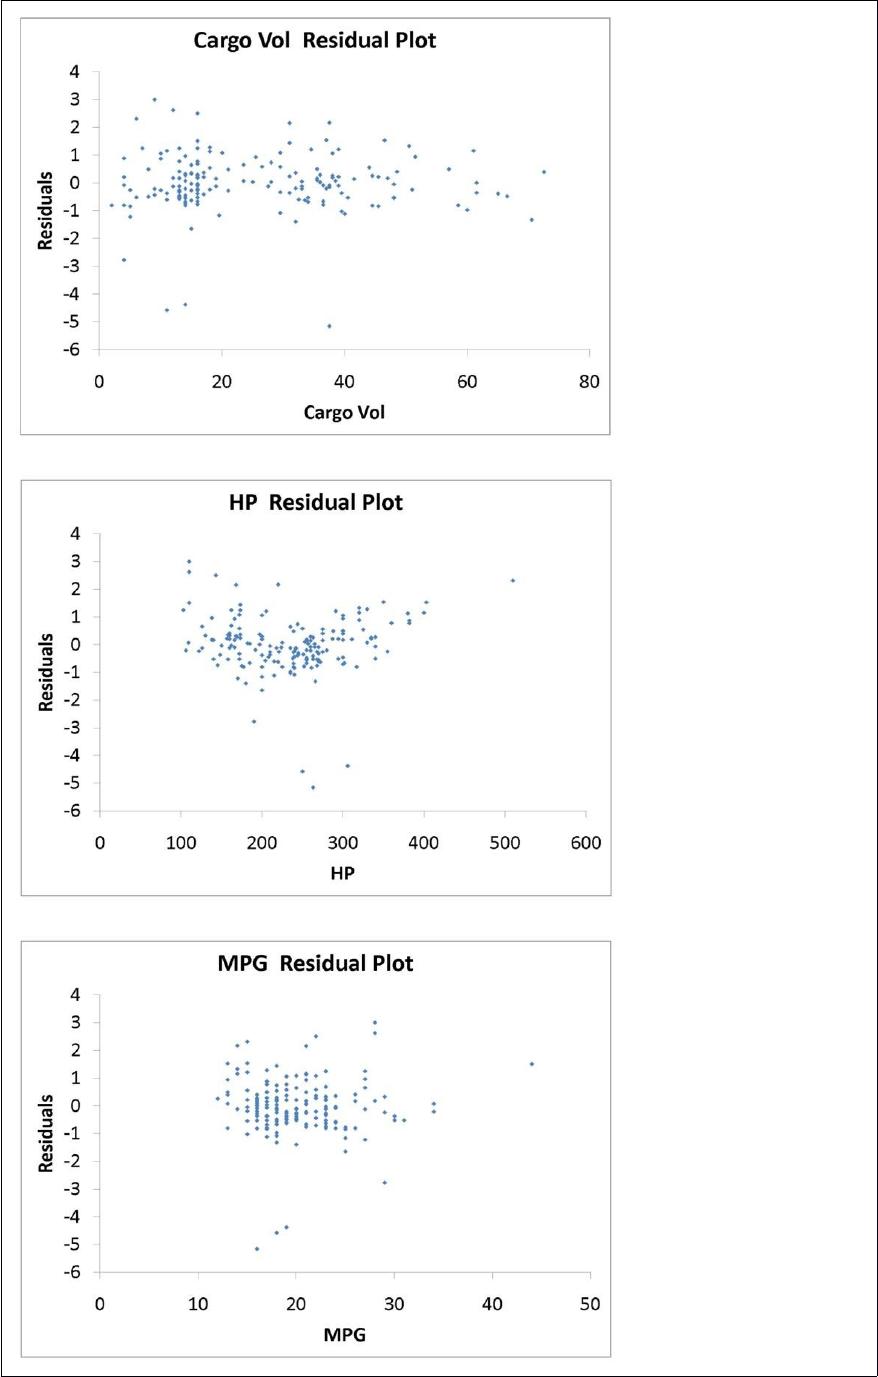
The various residual plots are as shown below.
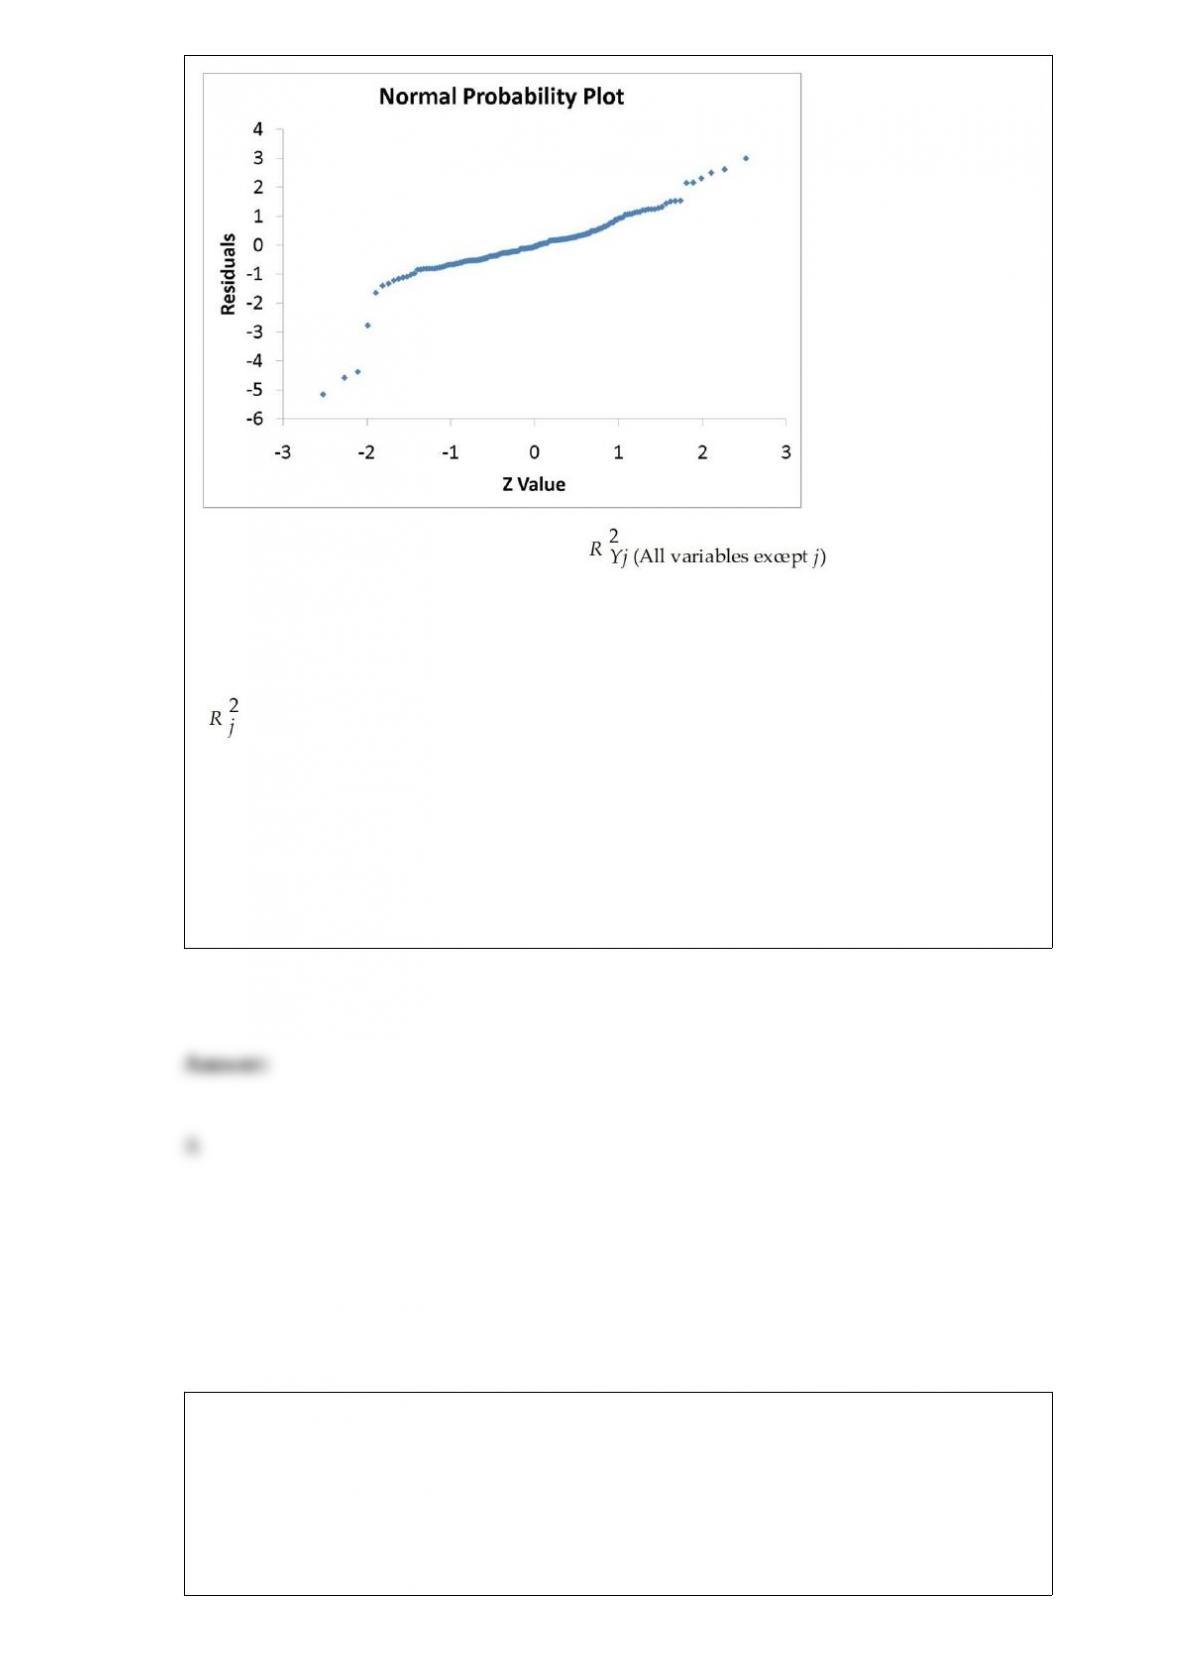
The coefficient of partial determination ( ) of each of the 5
predictors are, respectively, 0.0380, 0.4376, 0.0248, 0.0188, and 0.0312.
The coefficient of multiple determination for the regression model using each of the 5
variables Xj as the dependent variable and all other X variables as independent variables
( ) are, respectively, 0.7461, 0.5676, 0.6764, 0.8582, 0.6632.
Referring to Table 17-9, which of the following assumptions is most likely violated
based on the residual plot for HP?
A) Linearity
B) Normality of errors
C) Independence of errors
D) None of the above
Referring to Table 14-3, to test whether aggregate price index has a positive impact on
consumption, the p-value is
TABLE 14-3
An economist is interested to see how consumption for an economy (in $ billions) is
influenced by gross domestic product ($ billions) and aggregate price (consumer price
index). The Microsoft Excel output of this regression is partially reproduced below.
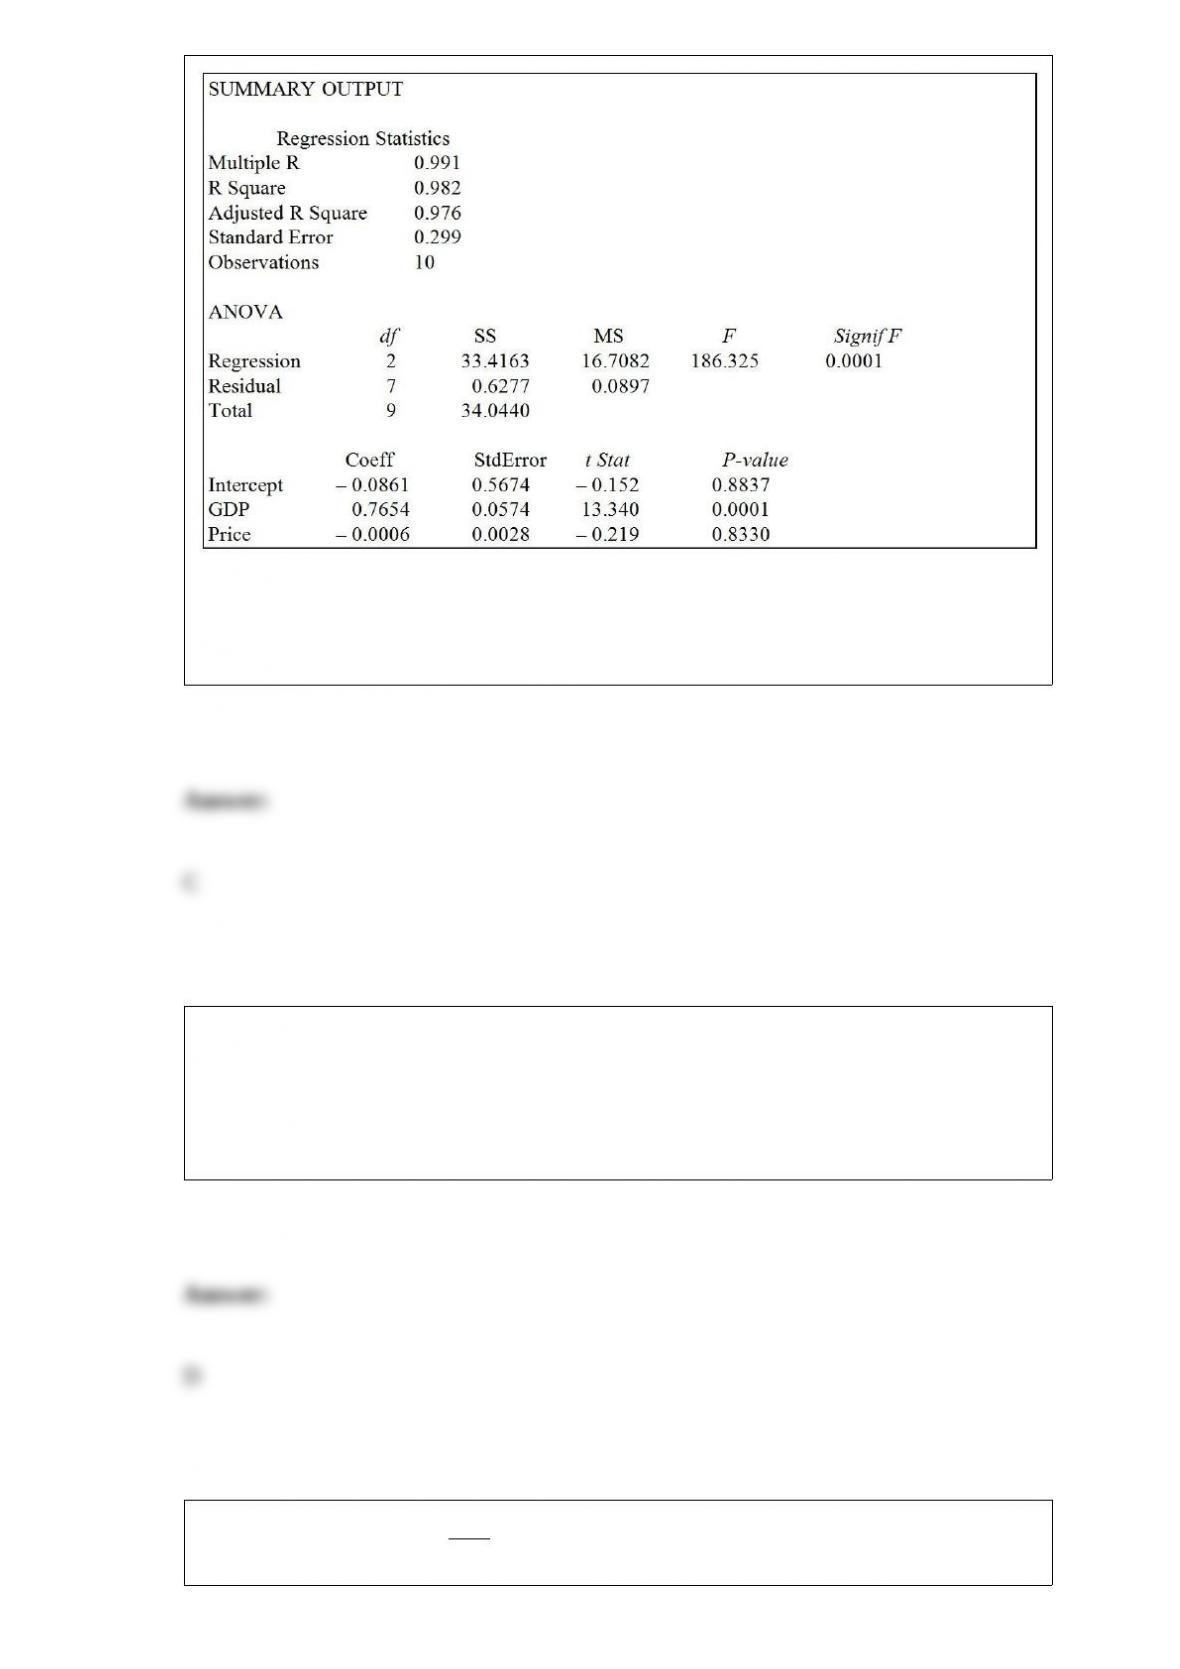
A) 0.0001.
B) 0.4165.
C) 0.5835.
D) 0.8330.
One of the morals of the red bead experiment is
A) variation is part of the process.
B) only management can change the system.
C) it is the system that primarily determines performance.
D) All of the above.
Which of the following is true about the sampling distribution of the sample mean?

A) The mean of the sampling distribution is always .
B) The standard deviation of the sampling distribution is always .
C) The shape of the sampling distribution is always approximately normal.
D) All of the above are true.
It is desired to estimate the mean total compensation of CEOs in the Service industry.
Data were randomly collected from 18 CEOs and the 95% confidence interval was
calculated to be ($2,181,260, $5,836,180). Based on the interval above, do you believe
the mean total compensation of CEOs in the Service industry is more than $3,000,000?
A) Yes, and I am 95% confident of it.
B) Yes, and I am 78% confident of it.
C) I am 95% confident that the mean compensation is $3,000,000.
D) I cannot conclude that the mean exceeds $3,000,000 at the 95% confidence level.
TABLE 12-9
Many companies use well-known celebrities as spokespersons in their TV
advertisements. A study was conducted to determine whether brand awareness of
female TV viewers and the gender of the spokesperson are independent. Each in a
sample of 300 female TV viewers was asked to identify a product advertised by a
celebrity spokesperson. The gender of the spokesperson and whether or not the viewer
could identify the product was recorded. The numbers in each category are given below.
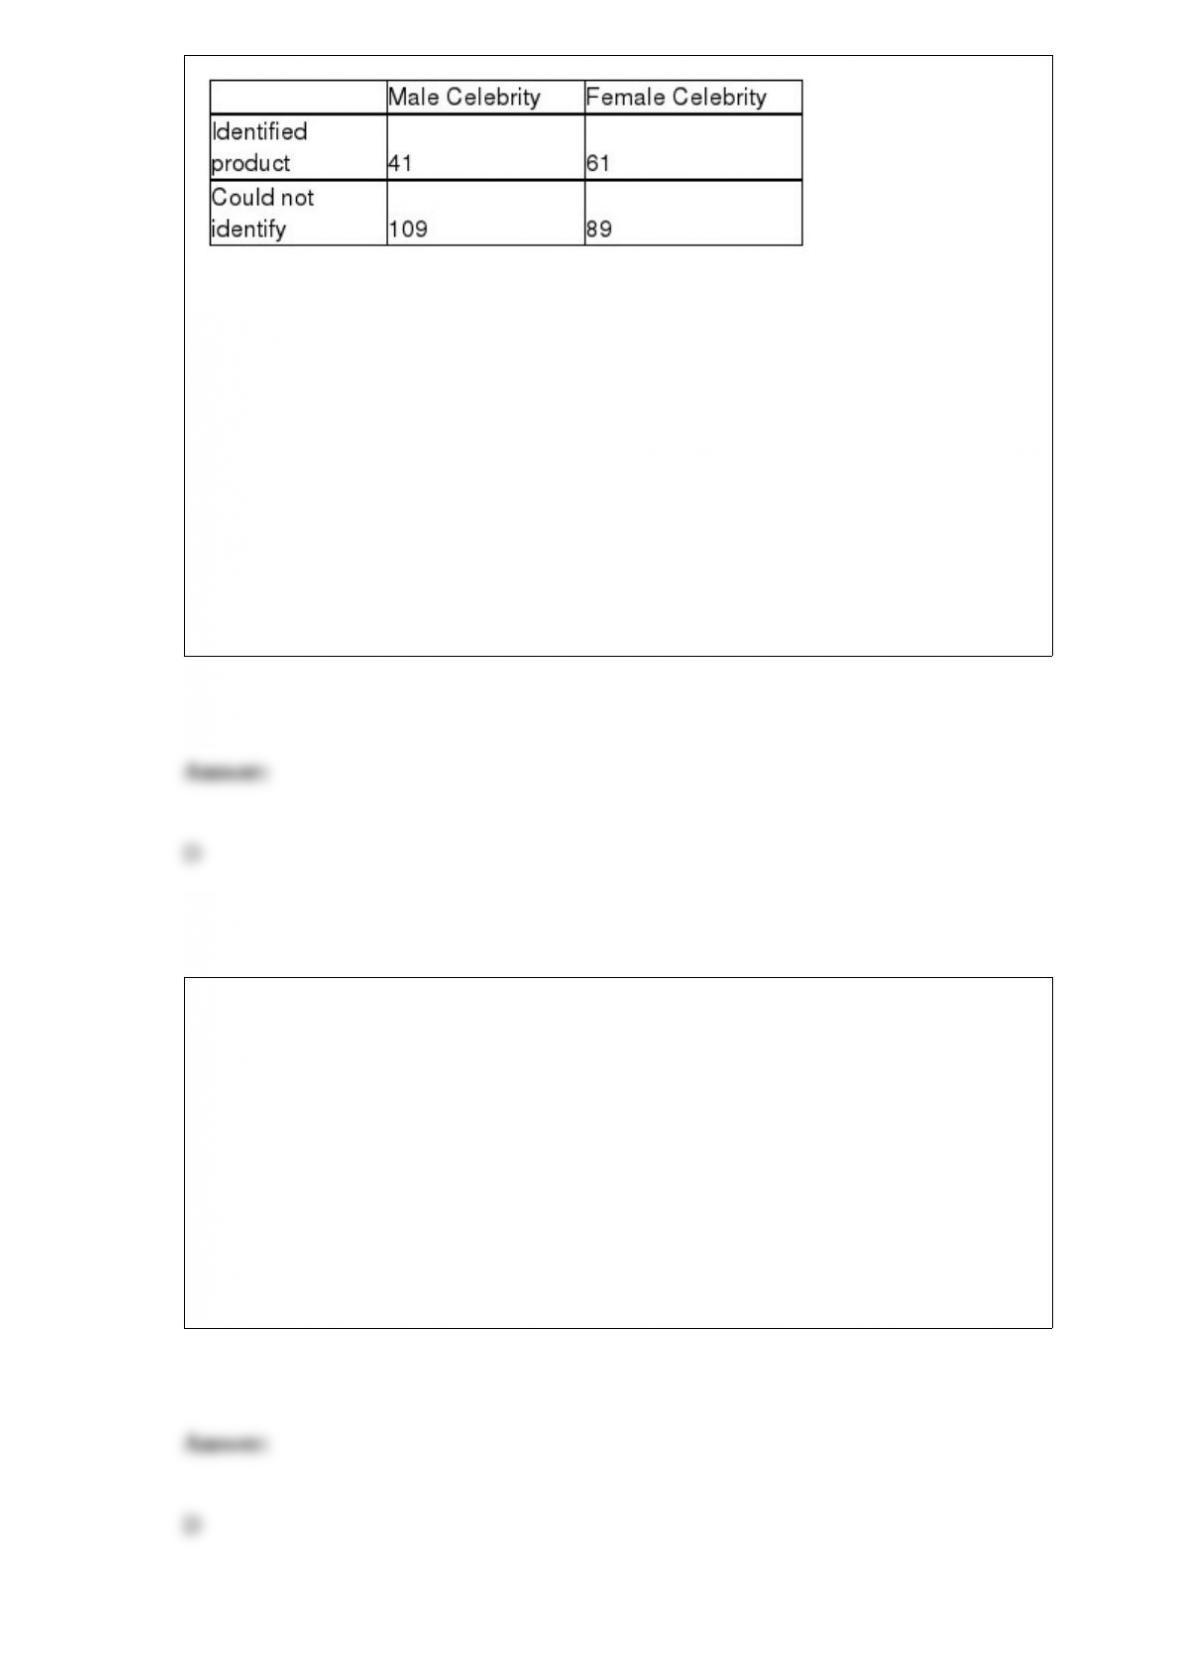
Referring to Table 12-9, at 5% level of significance, the conclusion is that
A) brand awareness of female TV viewers and the gender of the spokesperson are
independent.
B) brand awareness of female TV viewers and the gender of the spokesperson are not
independent.
C) brand awareness of female TV viewers and the gender of the spokesperson are
related.
D) Both B and C.
Thirty-six of the staff of 80 teachers at a local intermediate school are certified in
Cardio-Pulmonary Resuscitation (CPR). In 180 days of school, about how many days
can we expect that the teacher on bus duty will likely be certified in CPR?
A) 5 days
B) 45 days
C) 65 days
D) 81 days
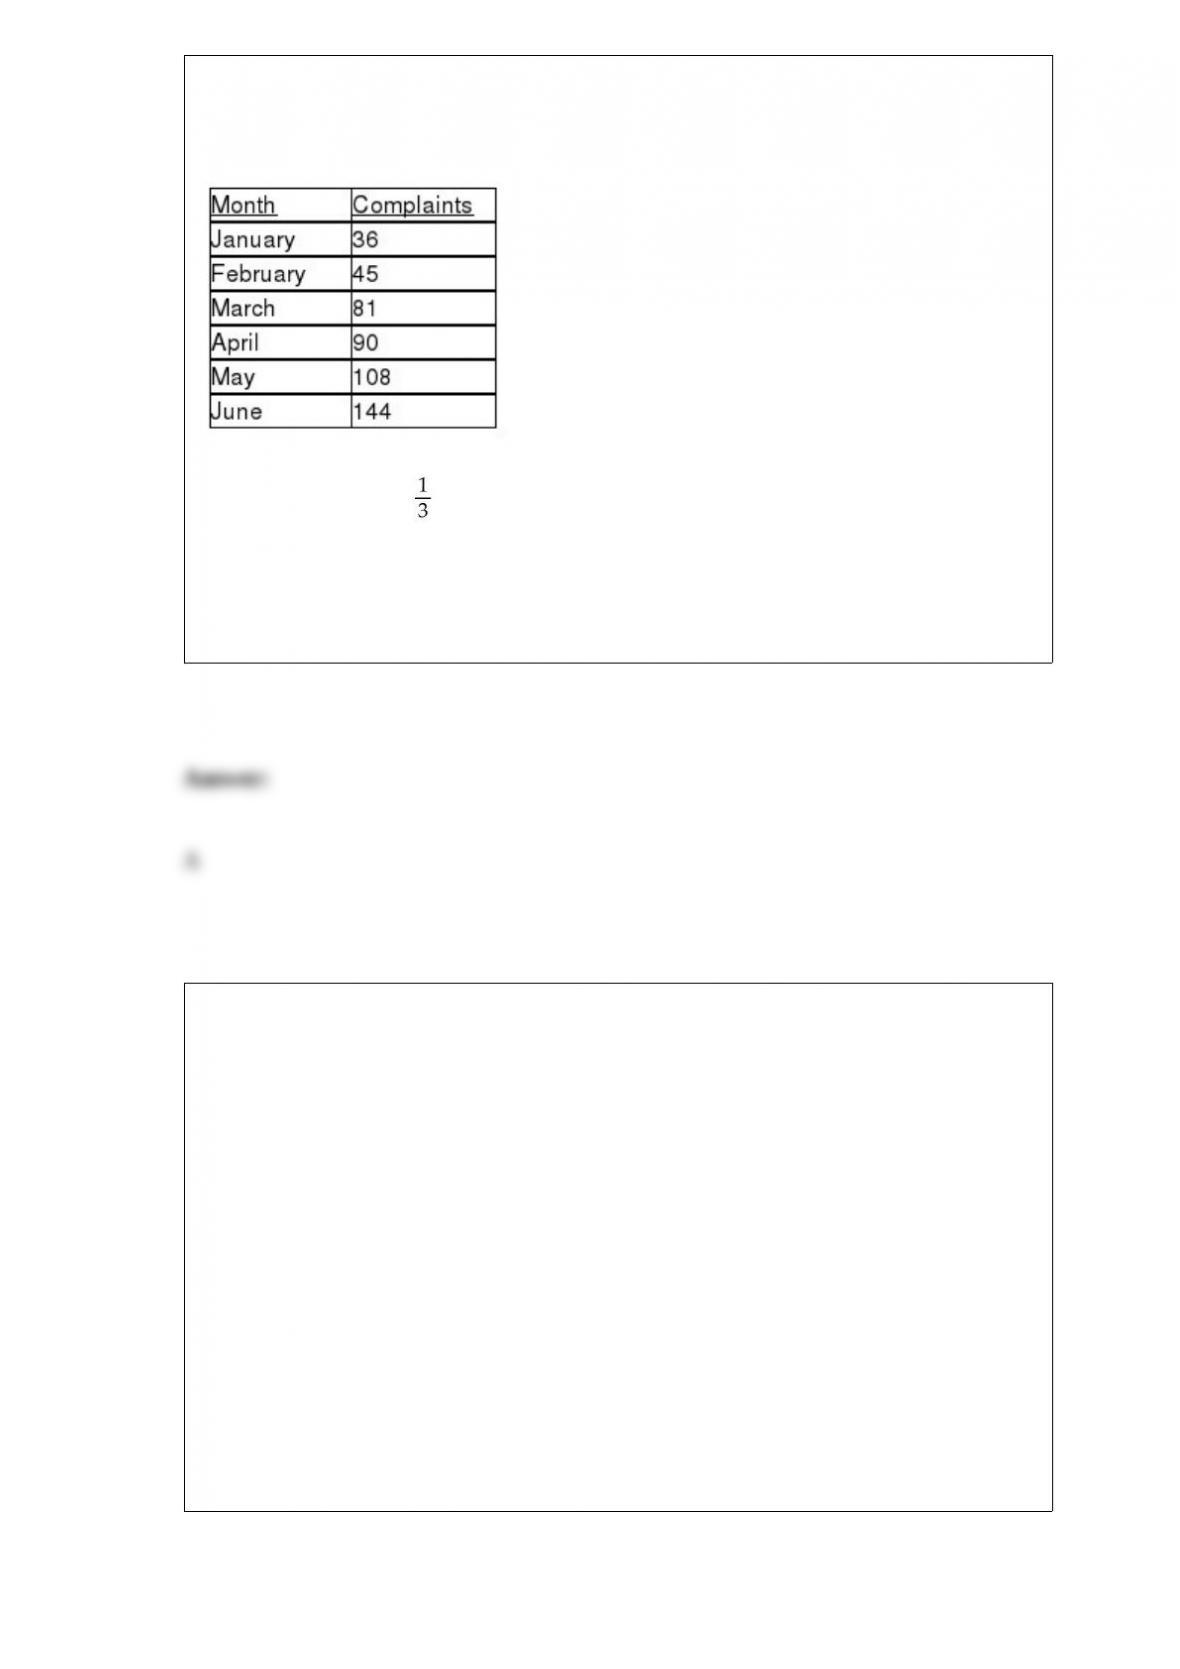
TABLE 16-3
The following table contains the number of complaints received in a department store
for the first 6 months of last year.
Referring to Table 16-3, if this series is smoothed using exponential smoothing with a
smoothing constant of , what would be the first value?
A) 36
B) 39
C) 42
D) 45
TABLE 1-1
The manager of the customer service division of a major consumer electronics company
is interested in determining whether the customers who have purchased a Blu-ray
player made by the company over the past 12 months are satisfied with their products.
Referring to Table 1-1, the possible responses to the question “Out of a 100 point score
with 100 being the highest and 0 being the lowest, what is your satisfaction level on the
videocassette recorder that you purchased?” are values from a
A) discrete numerical variable.
B) continuous numerical variable.
C) categorical variable.
D) table of random numbers.

You have collected information on the market share of 5 different search engines used
by U.S. Internet users in a particular quarter. Which of the following is the best for
presenting the information?
A) a pie chart
B) a histogram
C) a stem-and-leaf display
D) a contingency table
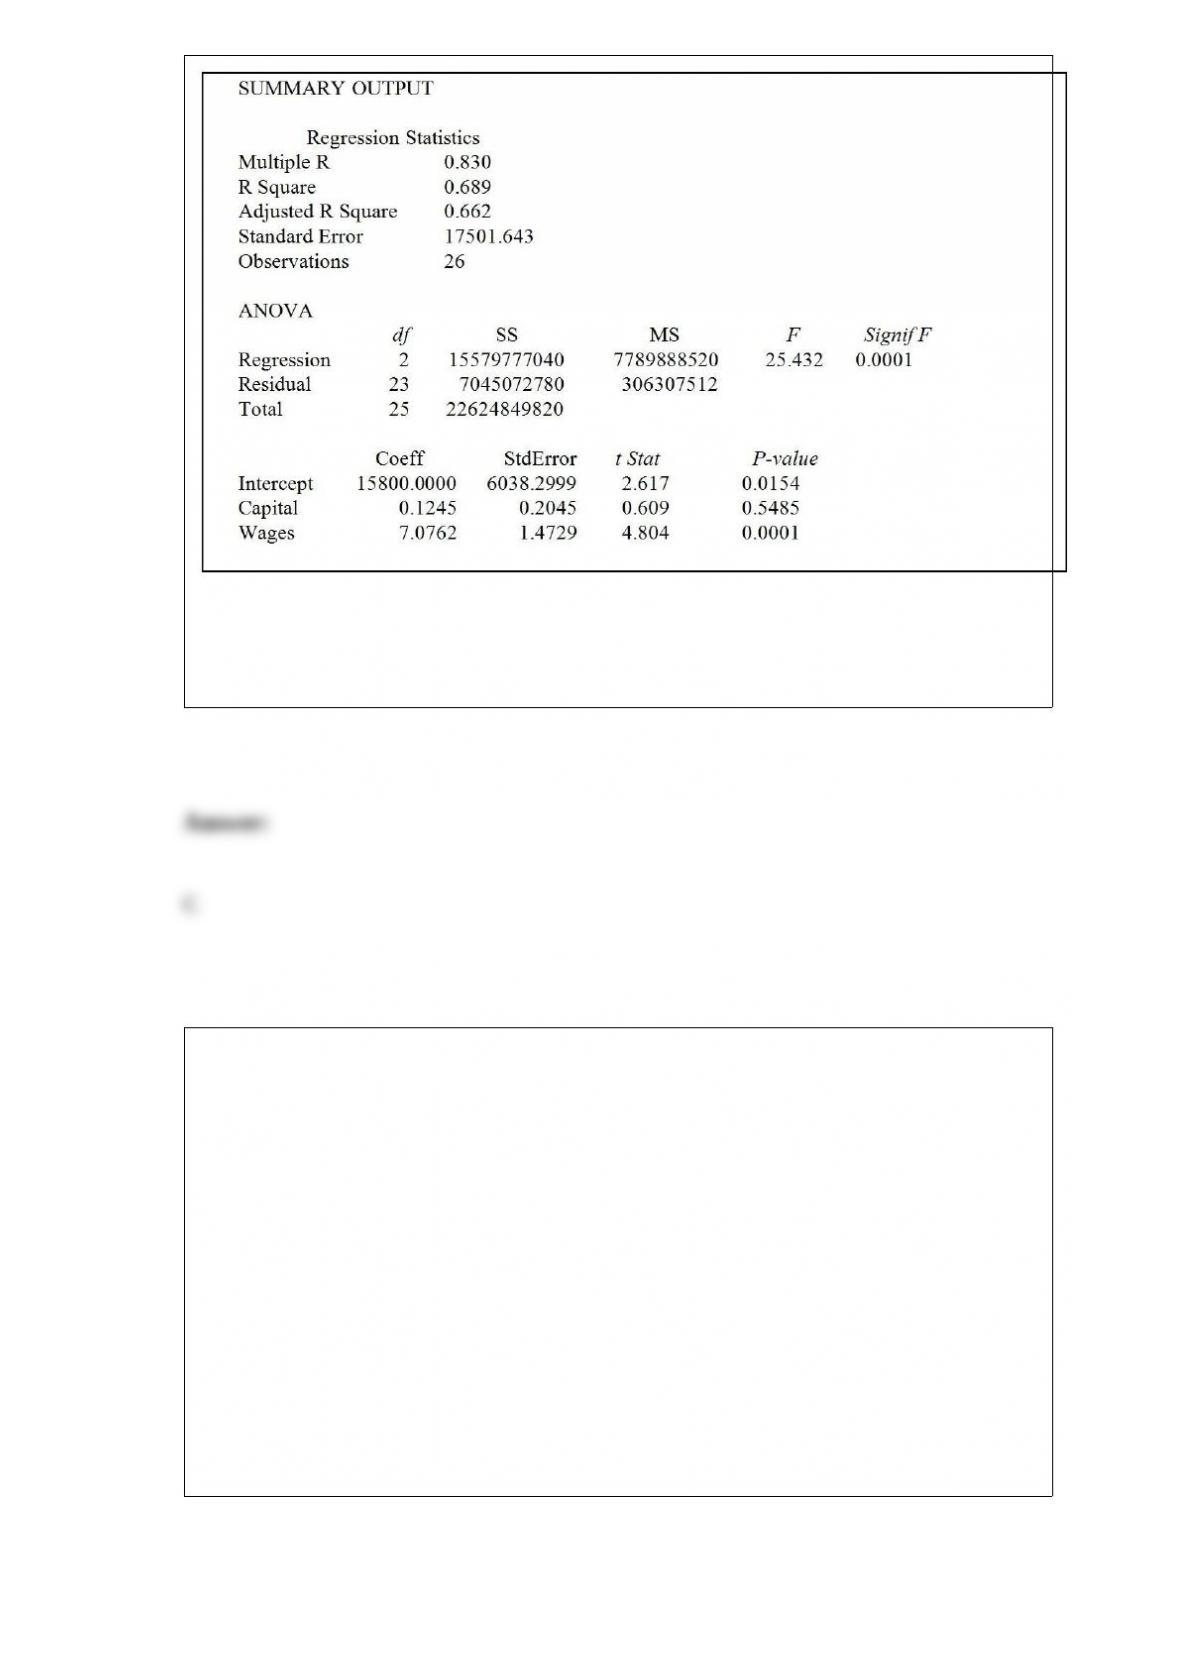
Referring to Table 14-5, what fraction of the variability in sales is explained by
spending on capital and wages?
TABLE 14-5
A microeconomist wants to determine how corporate sales are influenced by capital and
wage spending by companies. She proceeds to randomly select 26 large corporations
and record information in millions of dollars. The Microsoft Excel output below shows
results of this multiple regression.
A) 27.0%
B) 50.9%
C) 68.9%
D) 83.0%
TABLE 1-2
A Wall Street Journal poll asked 2,150 adults in the United States a series of questions
to find out their view on the U.S. economy.
Referring to Table 1-2, the possible responses to the question “How many people in
your household are unemployed currently?” are values from a
A) discrete numerical variable.
B) continuous numerical variable.
C) categorical variable.
D) table of random numbers.

TABLE 5-11
Subscribers to Investment Advice White Letters perform security transactions at the rate
of five trades per month. Assume that one of the subscribers performs transactions at
this rate and the probability of a transaction for any two months is the same and the
number of transactions in one month is independent of the number of transactions in
another month.
Referring to Table 5-11, what is the variance of the number of transactions per month
for this subscriber?
TABLE 17-8
The superintendent of a school district wanted to predict the percentage of students
passing a sixth-grade proficiency test. She obtained the data on percentage of students
passing the proficiency test (% Passing), daily mean of the percentage of students
attending class (% Attendance), mean teacher salary in dollars (Salaries), and
instructional spending per pupil in dollars (Spending) of 47 schools in the state.
Following is the multiple regression output with Y = % Passing as the dependent
variable, X1 = % Attendance, X2 = Salaries and X3 = Spending:
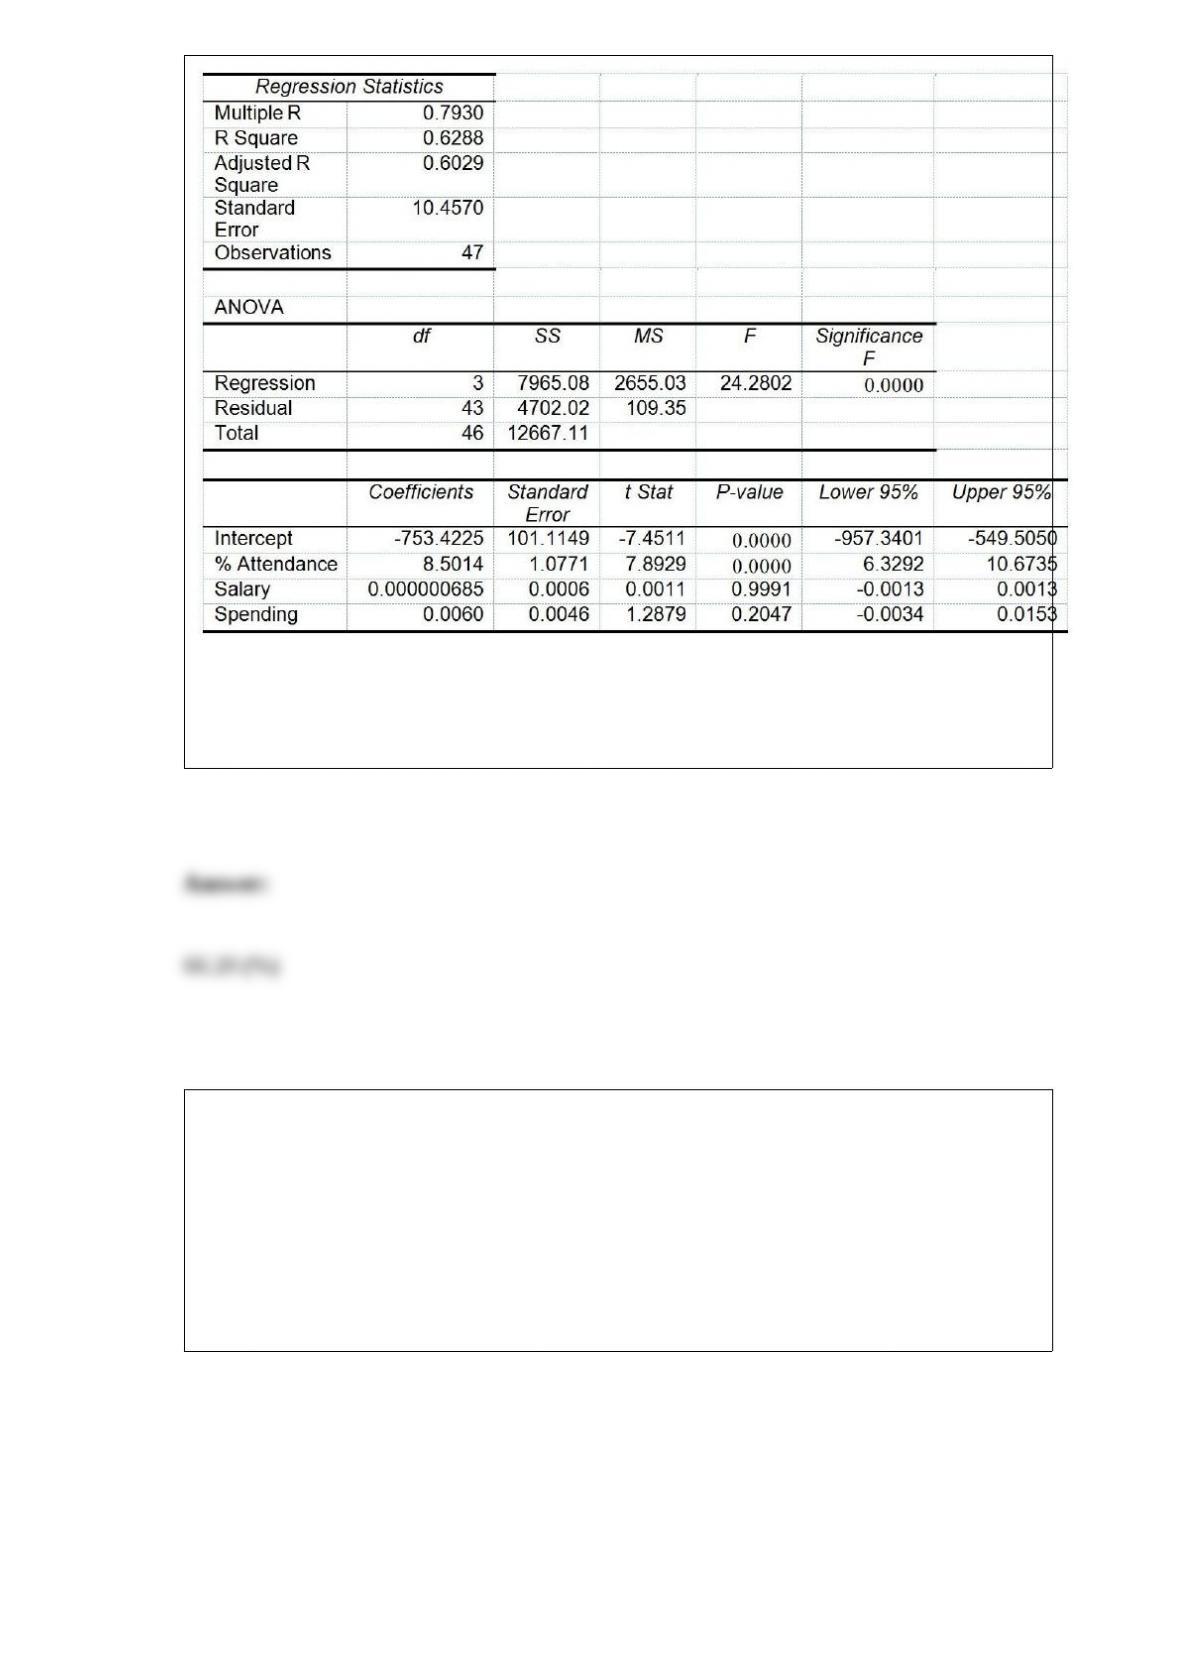
Referring to Table 17-8, estimate the mean percentage of students passing the
proficiency test for all the schools that have a daily mean of 95% of students attending
class, a mean teacher salary of 40,000 dollars, and an instructional spending per pupil of
2,000 dollars.
TABLE 11-9
The marketing manager of a company producing a new cereal aimed for children wants
to examine the effect of the color and shape of the box’s logo on the approval rating of
the cereal. He combined 4 colors and 3 shapes to produce a total of 12 designs. Each
logo was presented to 2 different groups (a total of 24 groups) and the approval rating
for each was recorded and is shown below. The manager analyzed these data using the
α = 0.05 level of significance for all inferences.
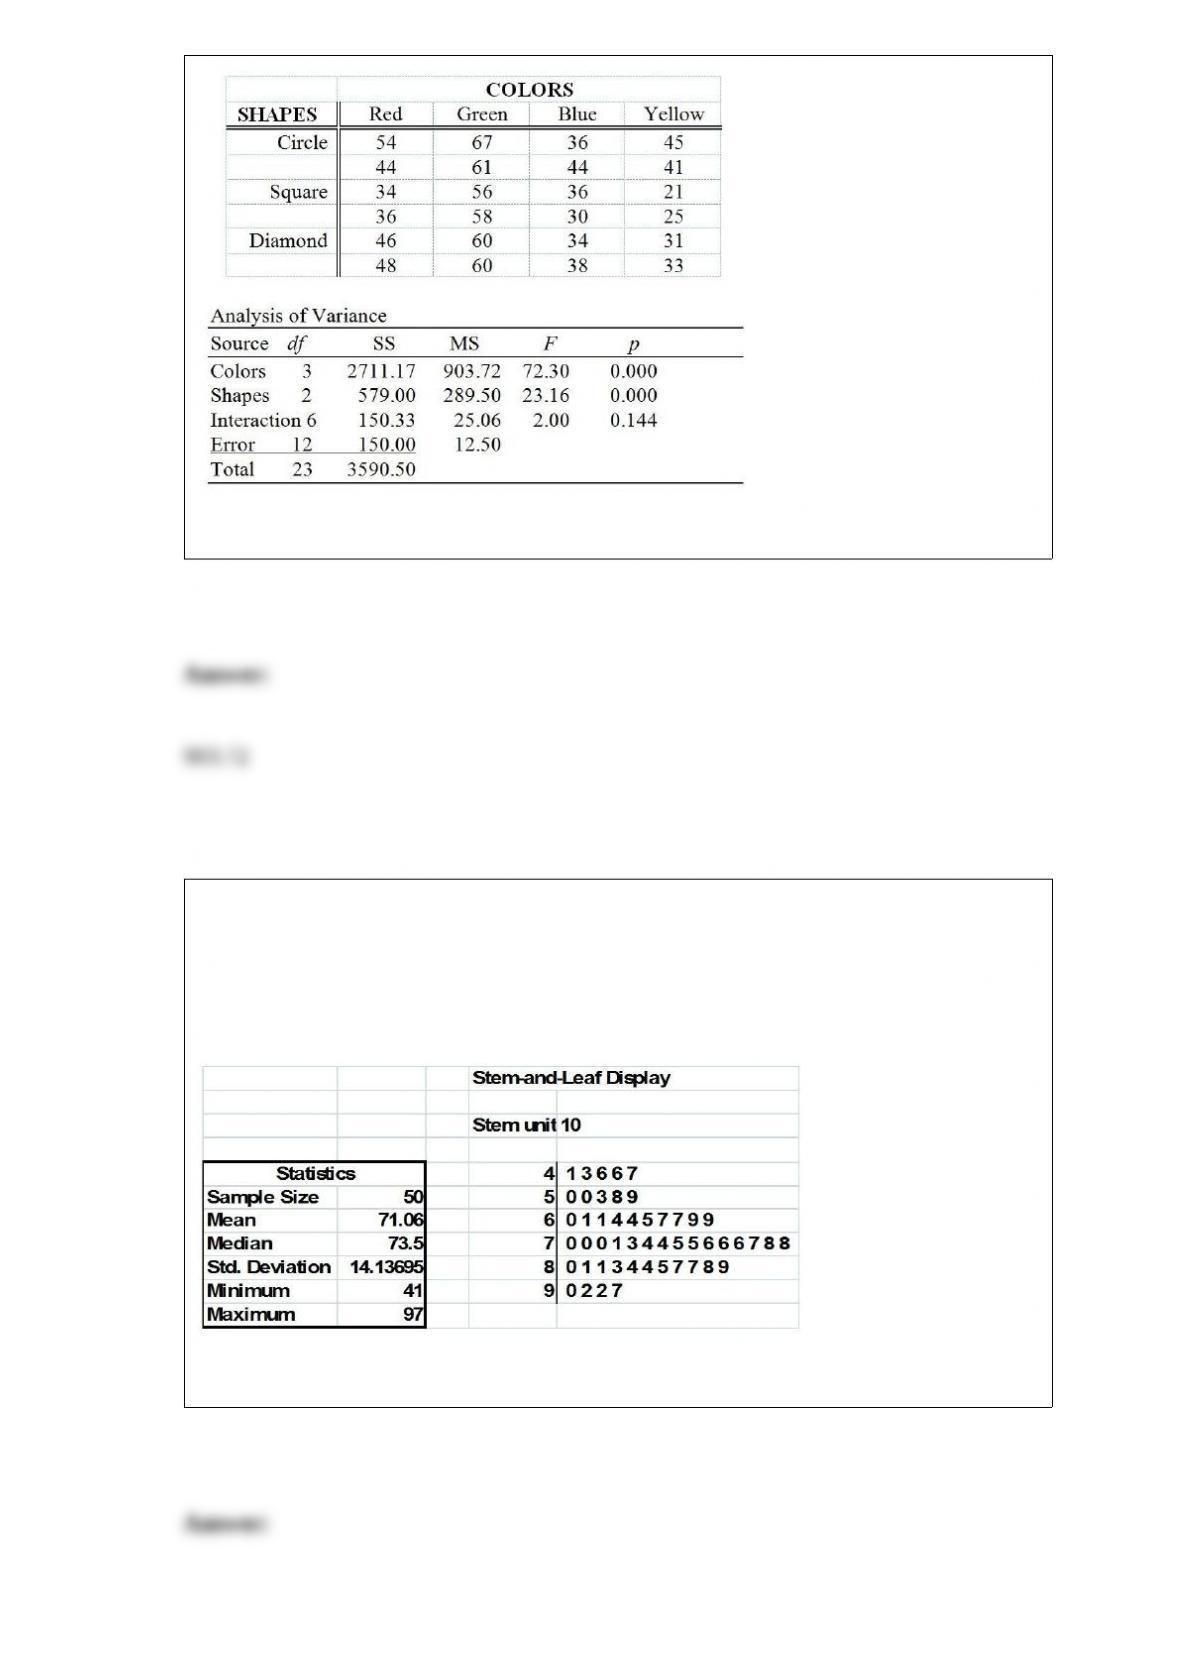
Referring to Table 11-9, the mean square for the factor color is ________.
TABLE 2-18
The stem-and-leaf display below shows the result of a survey of 50 students on their
satisfaction with their school, with the higher scores representing a higher level of
satisfaction.
Referring to Table 2-18, how many students have a satisfaction level in the 50s?
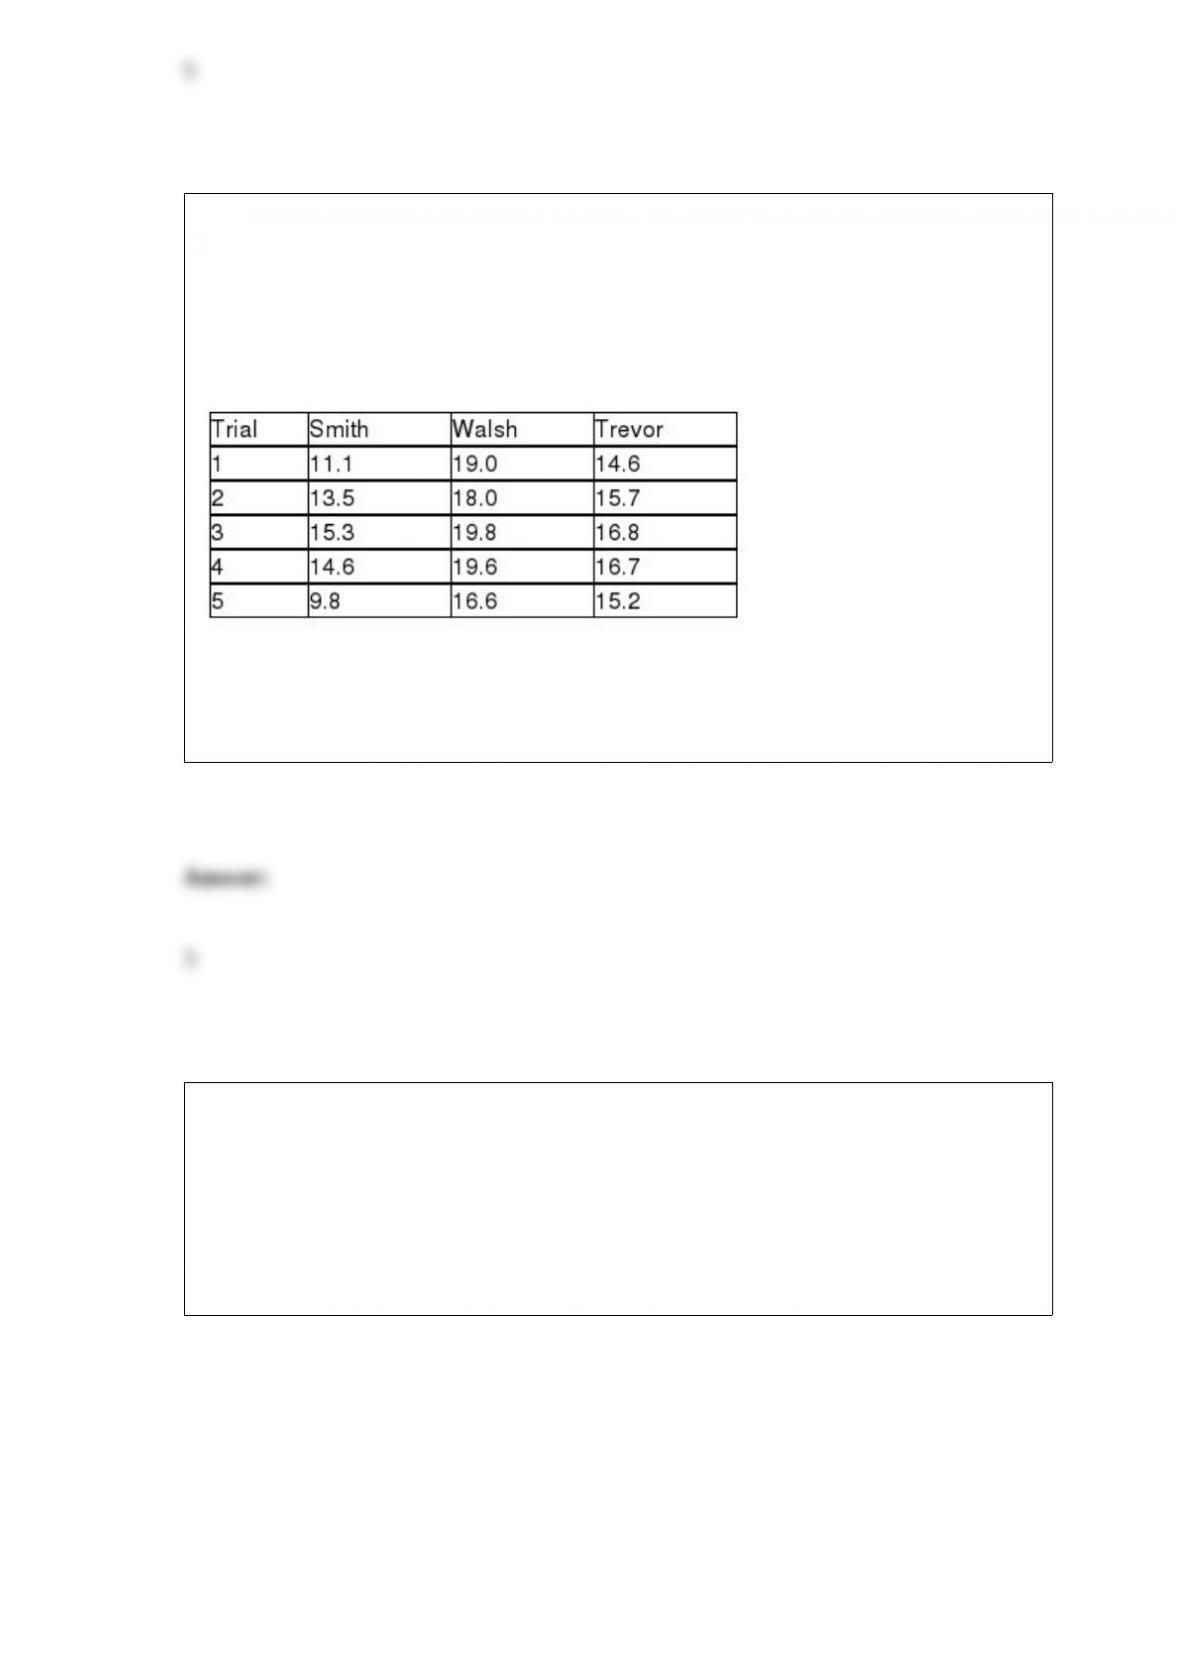
TABLE 11-4
An agronomist wants to compare the crop yield of 3 varieties of chickpea seeds. She
plants 15 fields, 5 with each variety. She then measures the crop yield in bushels per
acre. Treating this as a completely randomized design, the results are presented in the
table that follows.
Referring to Table 11-4, the agronomist decided to compare the 3 treatment means by
using the Tukey-Kramer procedure with an overall level of significance of 0.01. There
are ________ pairwise comparisons that can be made.
TABLE 17-11
A logistic regression model was estimated in order to predict the probability that a
randomly chosen university or college would be a private university using information
on mean total Scholastic Aptitude Test score (SAT) at the university or college, the
room and board expense measured in thousands of dollars (Room/Brd), and whether the
TOEFL criterion is at least 550 (Toefl550 = 1 if yes, 0 otherwise.) The dependent
variable, Y, is school type (Type = 1 if private and 0 otherwise).
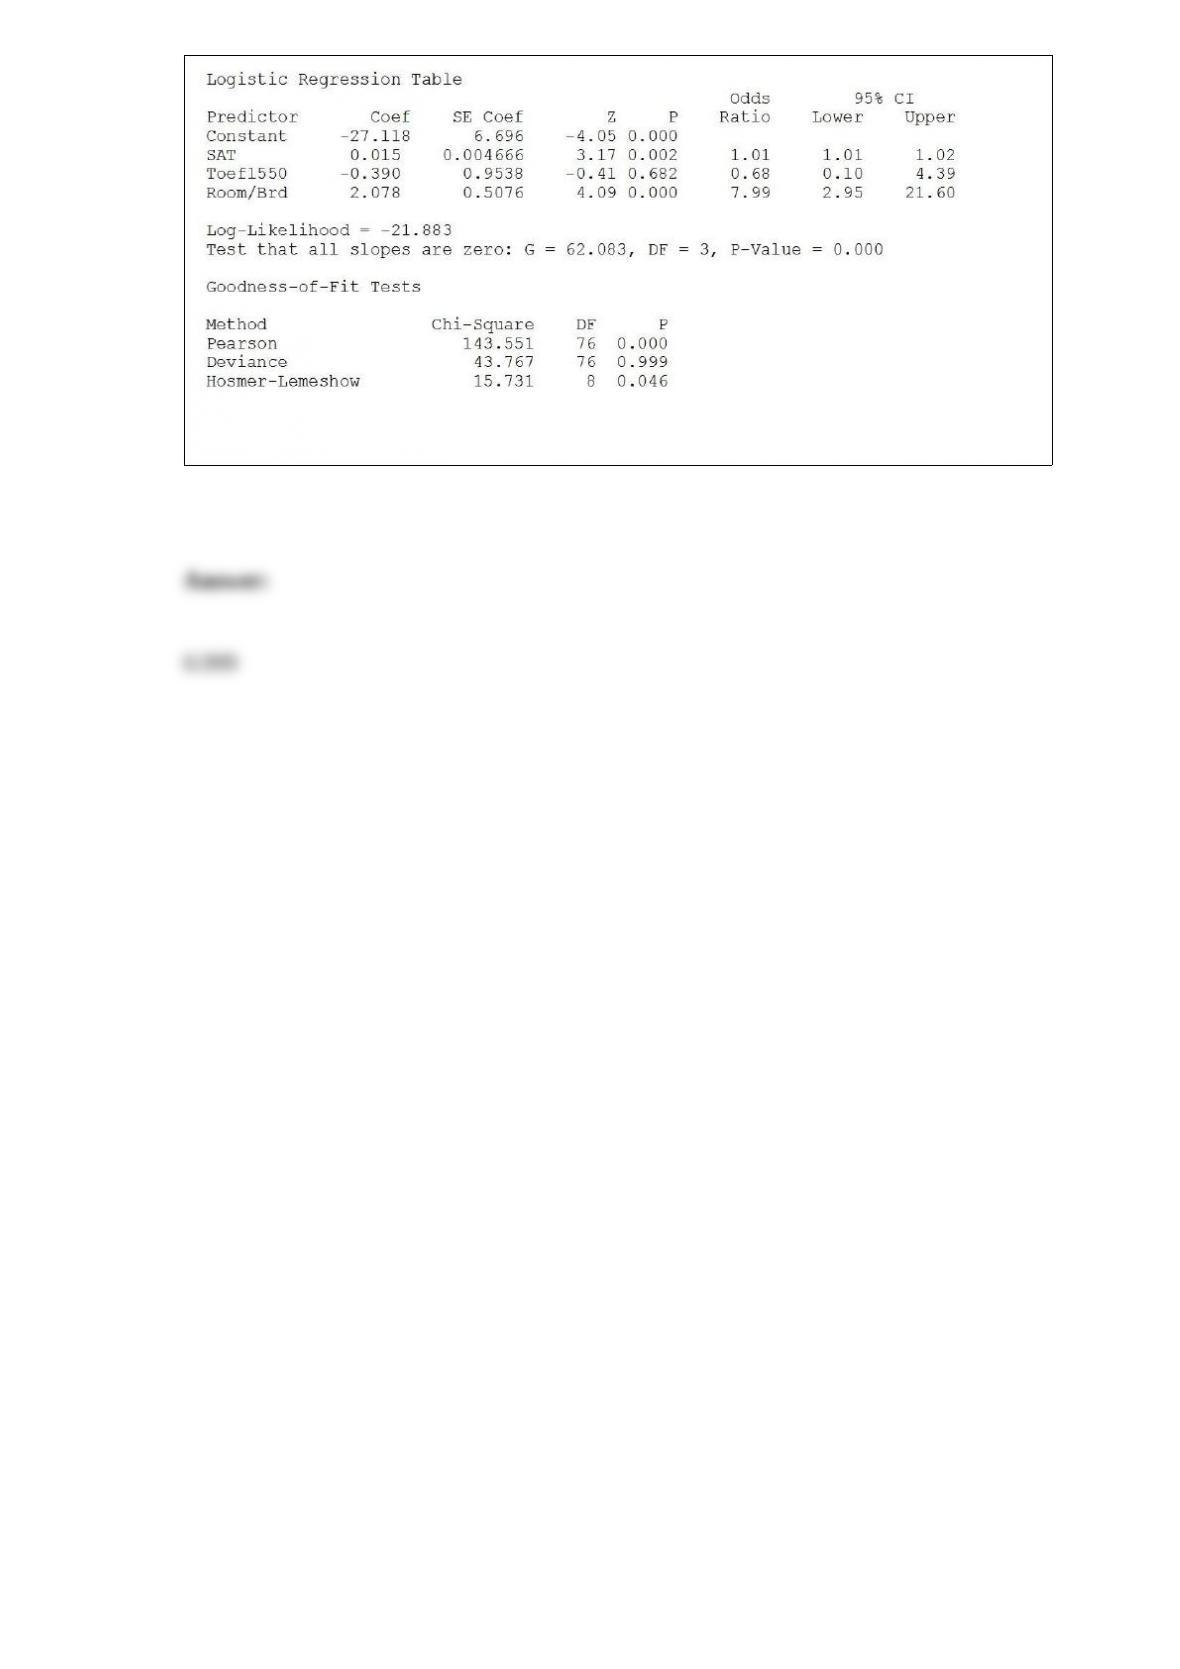
Referring to Table 17-11, what is the p-value of the test statistic when testing whether
the model is a good-fitting model?