True or False: The amount of alcohol consumed by a person per week is an example of
a continuous variable.
TABLE 8-6
After an extensive advertising campaign, the manager of a company wants to estimate
the proportion of potential customers that recognize a new product. She samples 120
potential consumers and finds that 54 recognize this product. She uses this sample
information to obtain a 95% confidence interval that goes from 0.36 to 0.54.
True or False: Referring to Table 8-6, the parameter of interest to the manager is the
proportion of potential customers in this sample that recognize the new product.
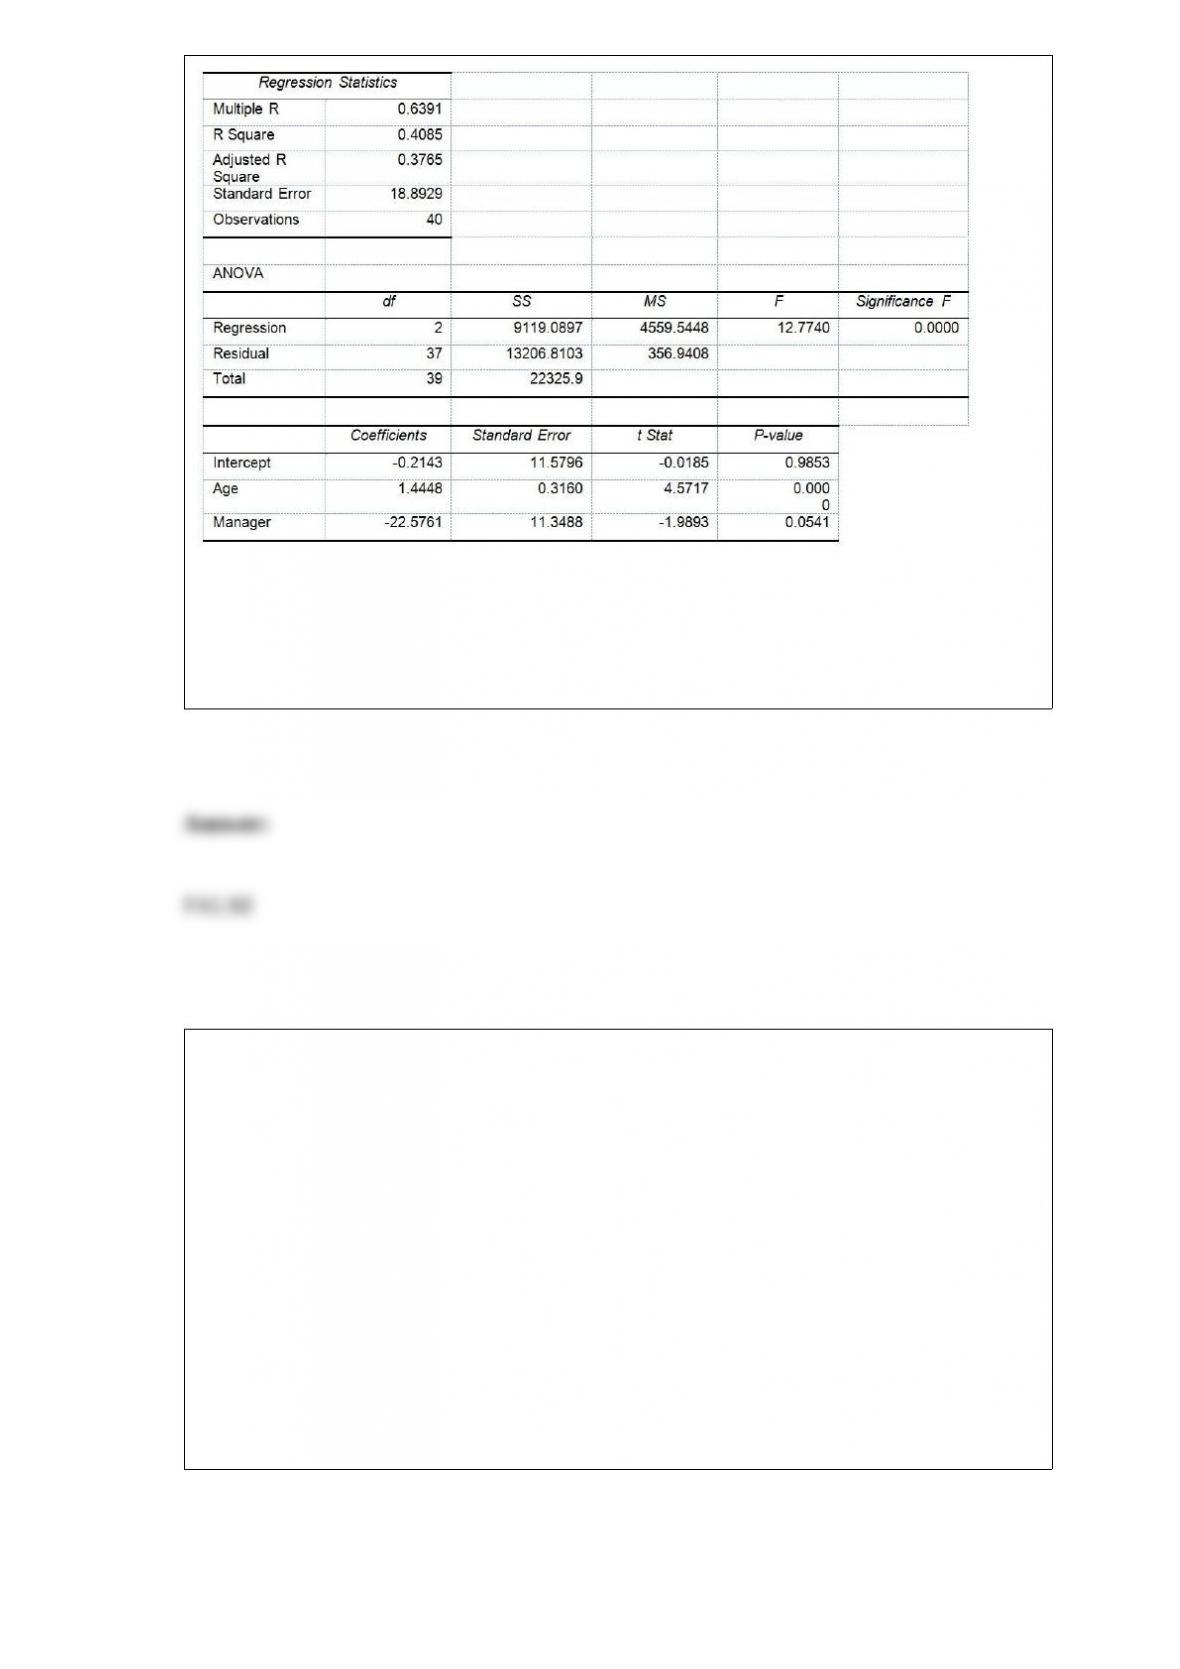
TABLE 14-17
Given below are results from the regression analysis where the
dependent variable is the number of weeks a worker is unemployed
due to a layo! (Unemploy) and the independent variables are the age
of the worker (Age) and a dummy variable for management position
(Manager: 1 = yes, 0 = no).
The results of the regression analysis are given below:
True or False: Referring to Table 14-17, we can conclude de.nitively
that, holding constant the e!ect of the other independent variable,
age has no impact on the mean number of weeks a worker is
unemployed due to a layo! at a 1% level of signi.cance if all we have
is the information of the 95% con.dence interval estimate for the
e!ect of a one year increase in age on the mean number of weeks a
worker is unemployed due to a layo!.
True or False: Common causes of variation are correctable without modifying the
system.
True or False: Compiling the number of registered voters who turned out to vote for the
primary in Iowa is an example of descriptive statistics.
True or False: The five-number summary consists of the smallest value, the first
quartile, the median, the third quartile, and the largest value.
True or False: A sample size of 25 provides a sample variance of 400. The standard
error, in this case equal to 4, is best described as the estimate of the standard deviation
of means calculated from sample sizes of 25.
True or False: TABLE 17-10
Given below are results from the regression analysis where the dependent variable is
the number of weeks a worker is unemployed due to a layoff (Unemploy) and the
independent variables are the age of the worker (Age), the number of years of education
received (Edu), the number of years at the previous job (Job Yr), a dummy variable for
marital status (Married: 1 = married, 0 = otherwise), a dummy variable for head of
household (Head: 1 = yes, 0 = no) and a dummy variable for management position
(Manager: 1 = yes, 0 = no). We shall call this Model 1. The coefficient of partial
determination ( ) of each of the 6 predictors are, respectively,
0.2807, 0.0386, 0.0317, 0.0141, 0.0958, and 0.1201.
Model 2 is the regression analysis where the dependent variable is Unemploy and the
independent variables are Age and Manager. The results of the regression analysis are
given below:
Referring to Table 17-10 and using both Model 1 and Model 2, there is sufficient
evidence to conclude that at least one of the independent variables that are not
significant individually has become significant as a group in explaining the variation in
the dependent variable at a 5% level of significance.
True or False: TABLE 17-9
What are the factors that determine the acceleration time (in sec.) from 0 to 60 miles per
hour of a car? Data on the following variables for 171 different vehicle models were
collected:
Accel Time: Acceleration time in sec.
Cargo Vol: Cargo volume in cu. ft.
HP: Horsepower
MPG: Miles per gallon
SUV: 1 if the vehicle model is an SUV with Coupe as the base when SUV and Sedan
are both 0
Sedan: 1 if the vehicle model is a sedan with Coupe as the base when SUV and Sedan
are both 0
The regression results using acceleration time as the dependent variable and the
remaining variables as the independent variables are presented below.
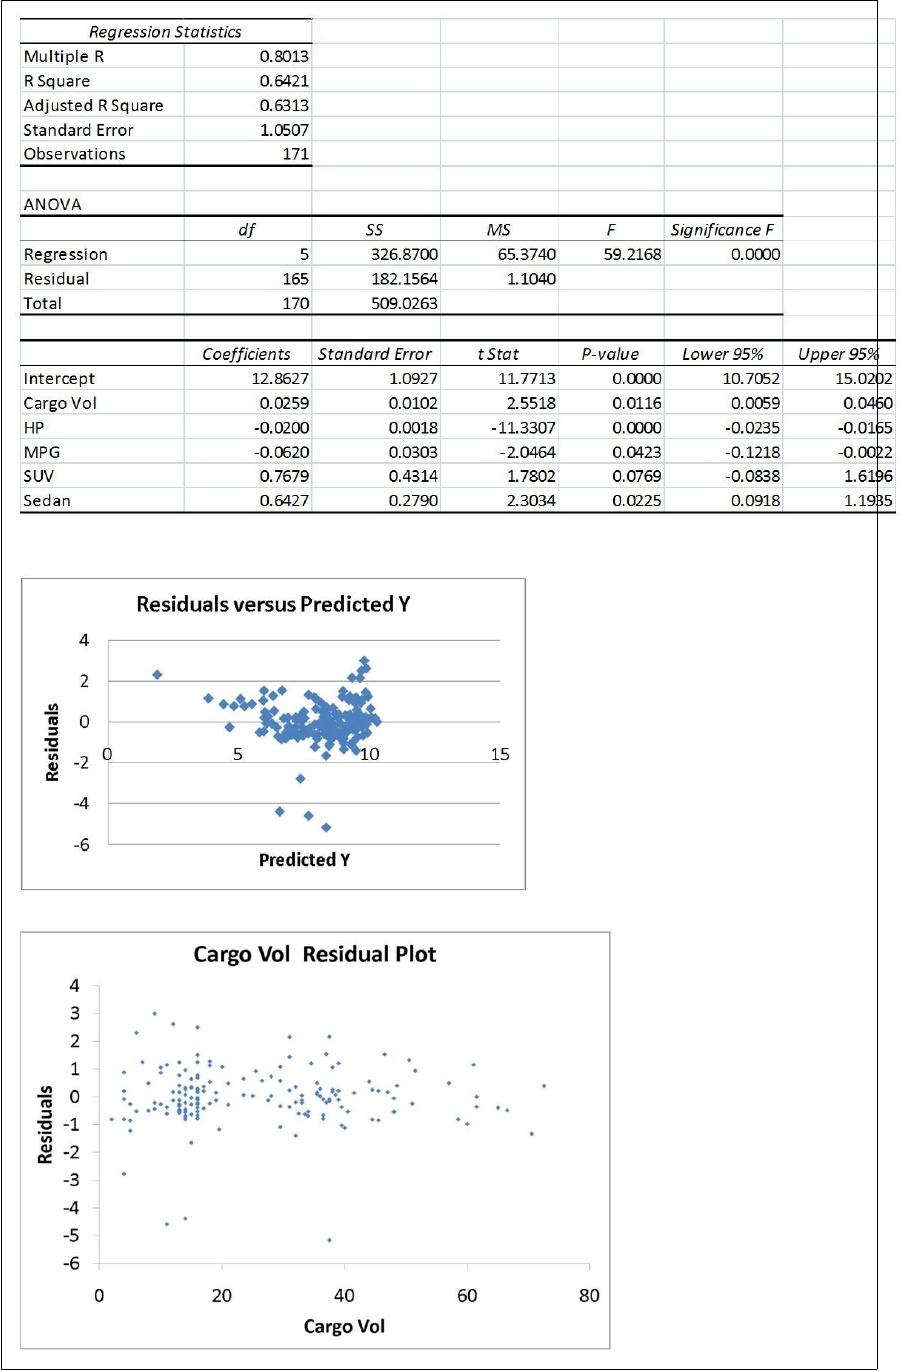
The various residual plots are as shown below.
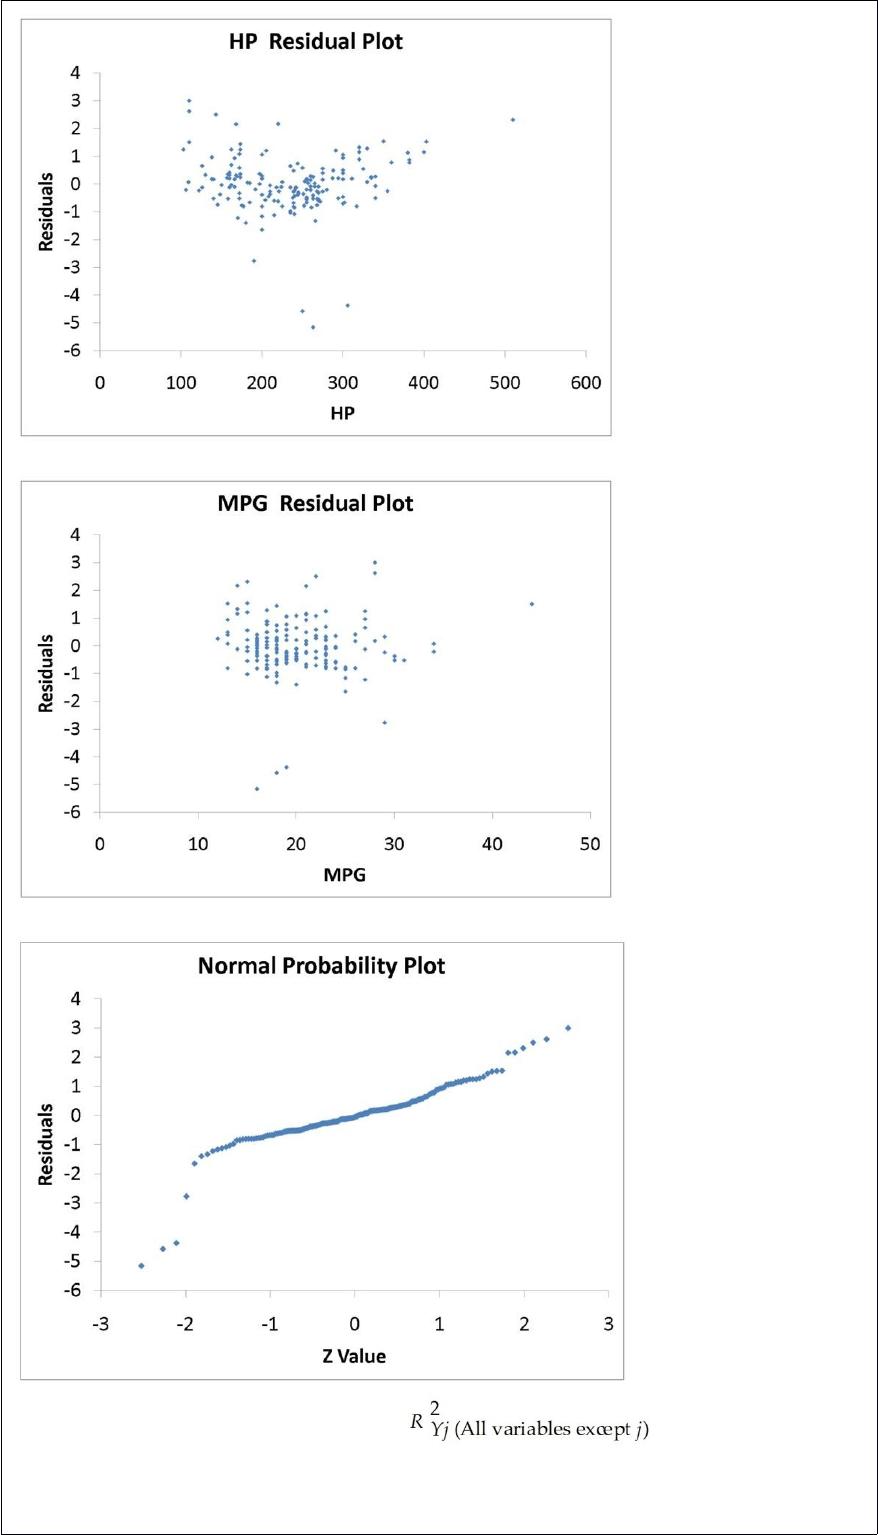
The coefficient of partial determination ( ) of each of the 5
predictors are, respectively, 0.0380, 0.4376, 0.0248, 0.0188, and 0.0312.
The coefficient of multiple determination for the regression model using each of the 5
variables Xj as the dependent variable and all other X variables as independent variables
( ) are, respectively, 0.7461, 0.5676, 0.6764, 0.8582, 0.6632.
Referring to Table 17-9, the 0 to 60 miles per hour acceleration time of a sedan is
predicted to be 0.1252 seconds higher than that of an SUV.
True or False: To determine the probability of getting between 2 and 4 events of interest
in a binomial distribution, you will find the area under the normal curve between X =
1.5 and 4.5.
True or False: In instances in which there is insufficient evidence to reject the null
hypothesis, you must make it clear that this has proven that the null hypothesis is true.
TABLE 11-4
An agronomist wants to compare the crop yield of 3 varieties of chickpea seeds. She
plants 15 fields, 5 with each variety. She then measures the crop yield in bushels per
acre. Treating this as a completely randomized design, the results are presented in the
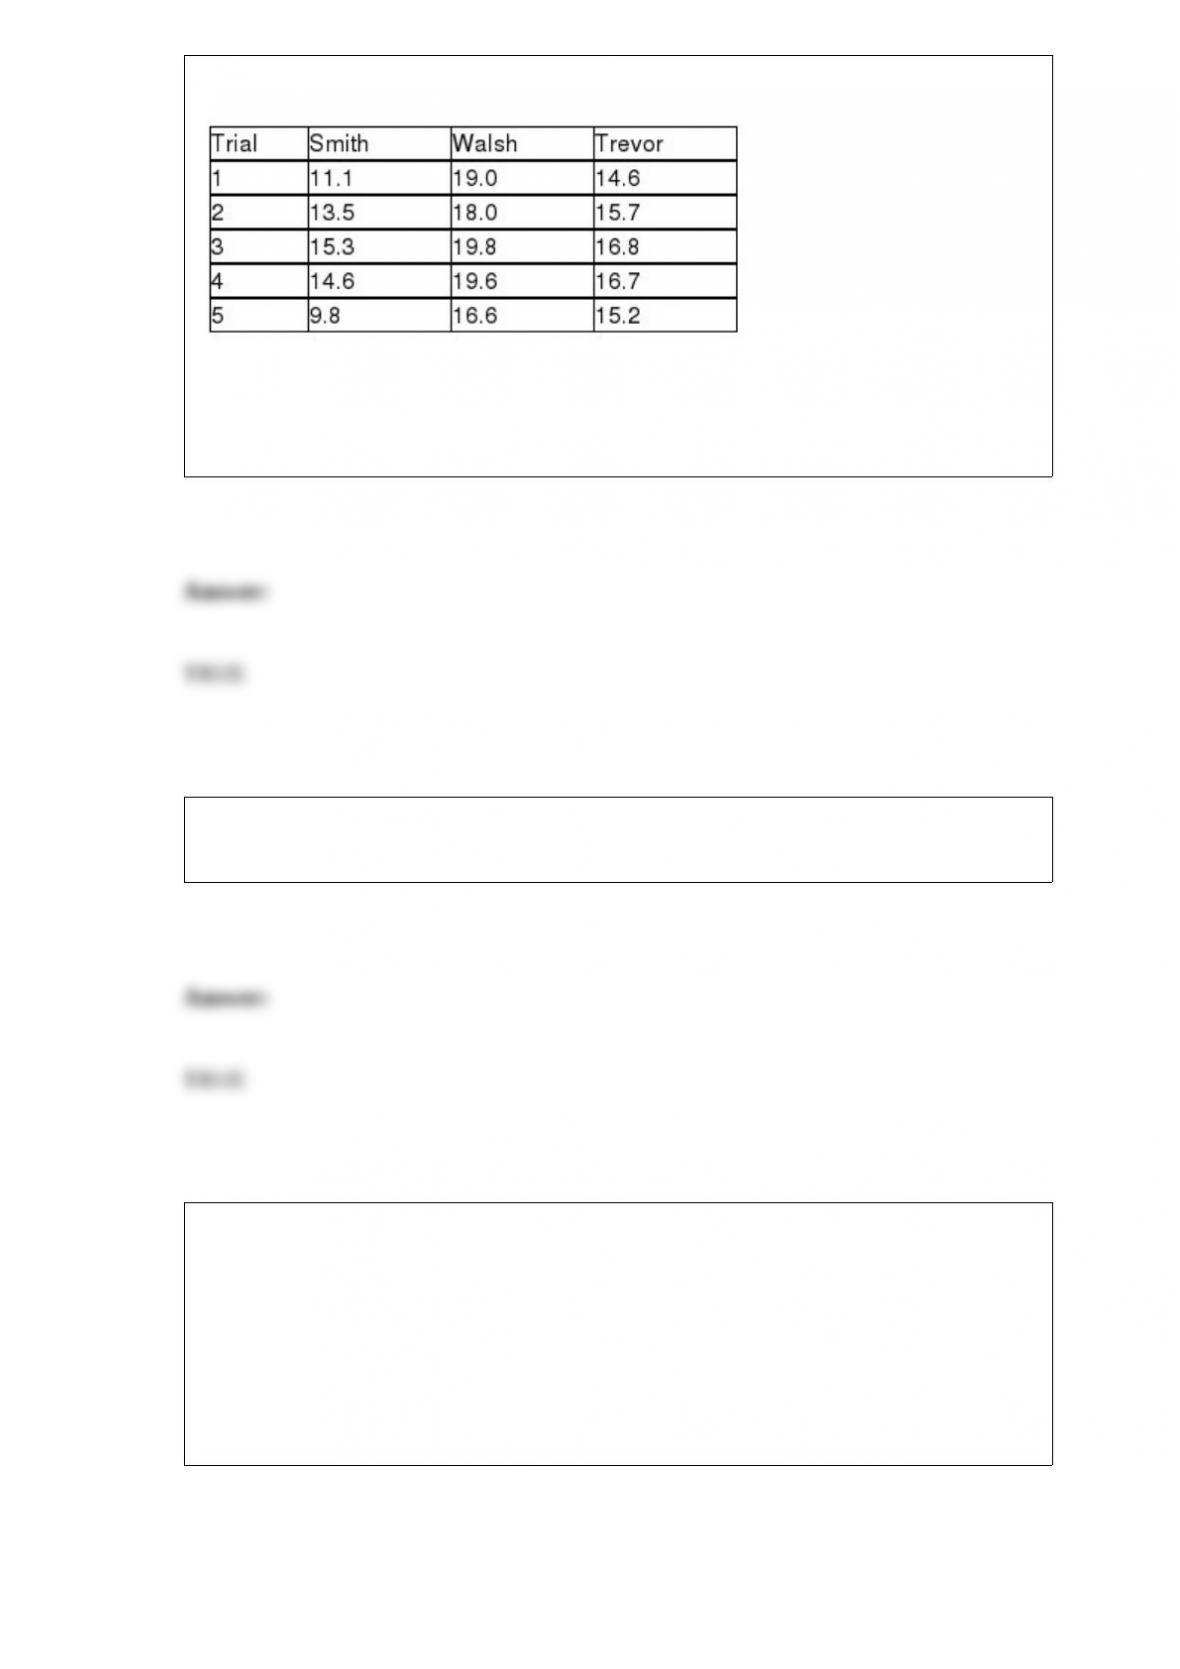
table that follows.
True or False: Referring to Table 11-4, based on the Tukey-Kramer procedure with an
overall level of significance of 0.01, the agronomist would decide that there is a
significant difference between the crop yield of Smith and Walsh seeds.
True or False: Other things being equal, as the confidence level for a confidence
interval increases, the width of the interval increases.
TABLE 11-8
An important factor in selecting database software is the time required for a user to
learn how to use the system. To evaluate three potential brands (A, B and C) of database
software, a company designed a test involving five different employees. To reduce
variability due to differences among employees, each of the five employees is trained
on each of the three different brands. The amount of time (in hours) needed to learn
each of the three different brands is given below:
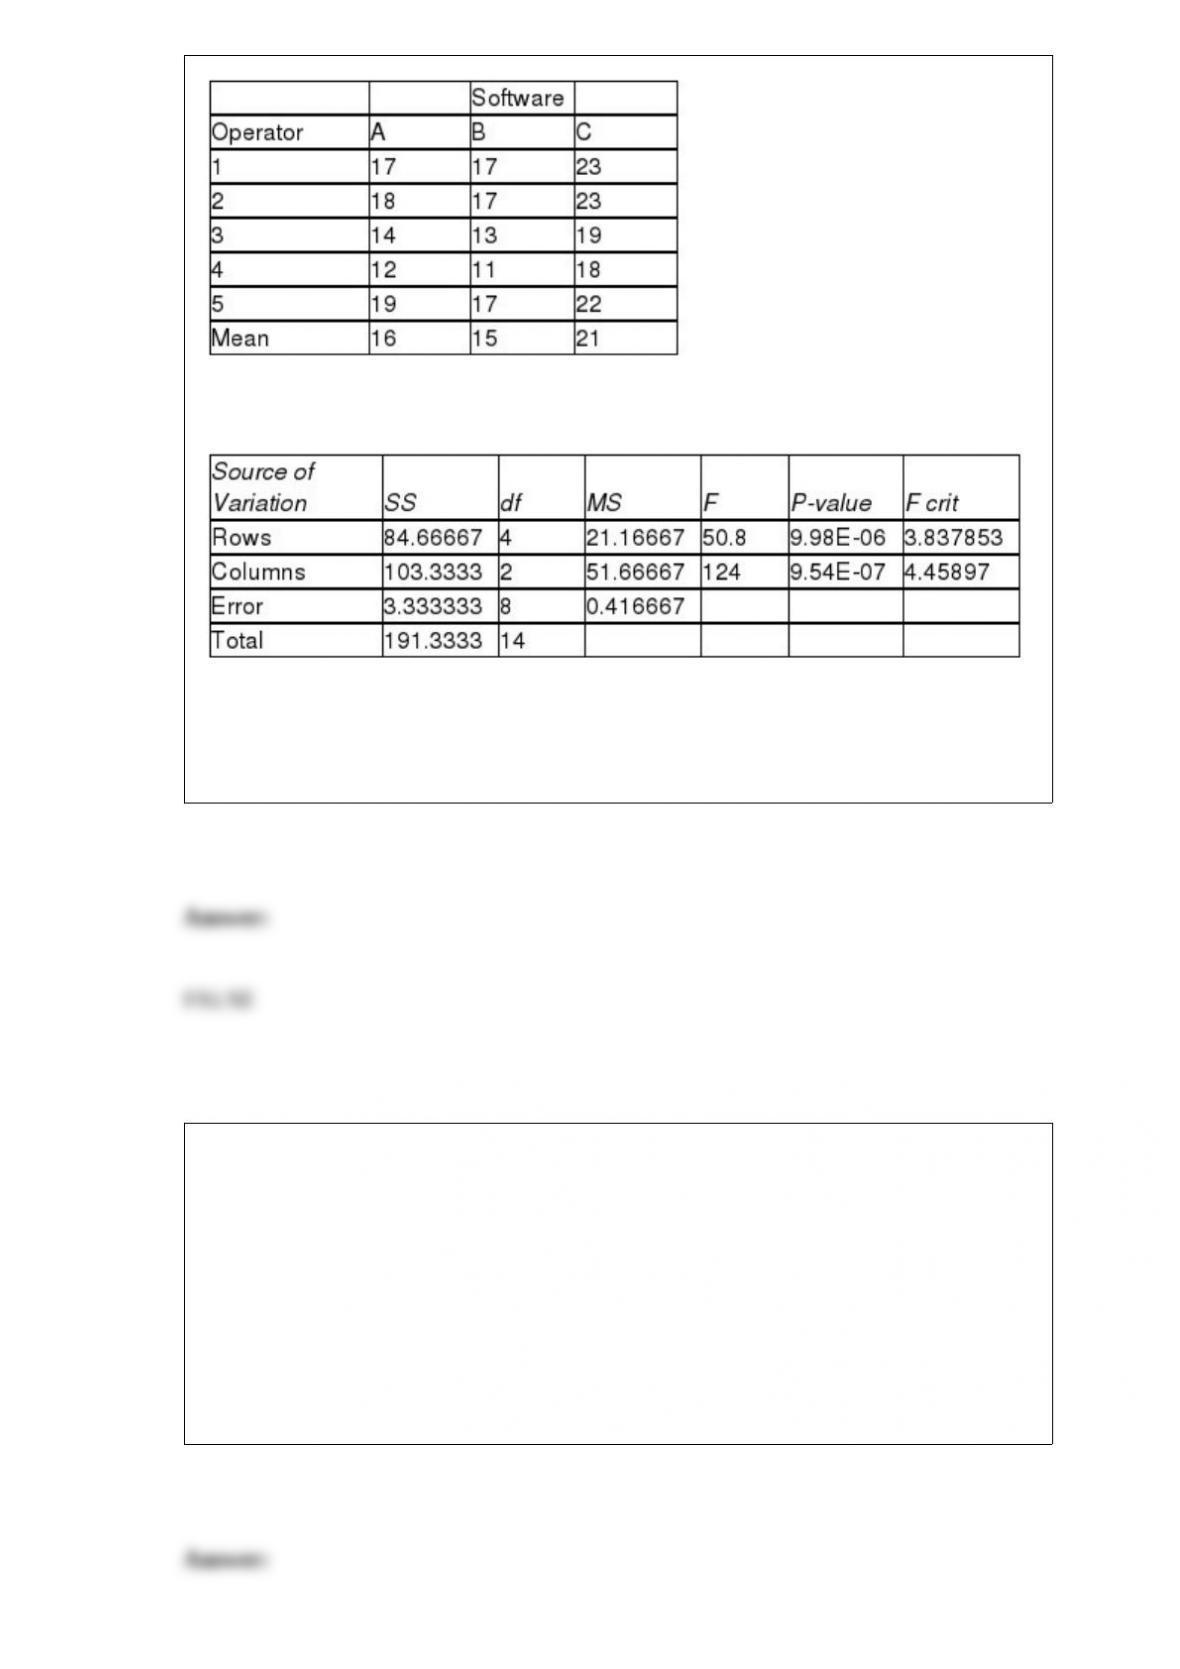
Below is the Excel output for the randomized block design:
True or False: Referring to Table 11-8, there is evidence of a significant difference in
the mean amount of time needed to learn Brand A and Brand B at the 5% level of
significance.
If two events are mutually exclusive, what is the probability that both occur at the same
time?
A) 0
B) 0.50
C) 1.00
D) Cannot be determined from the information given.
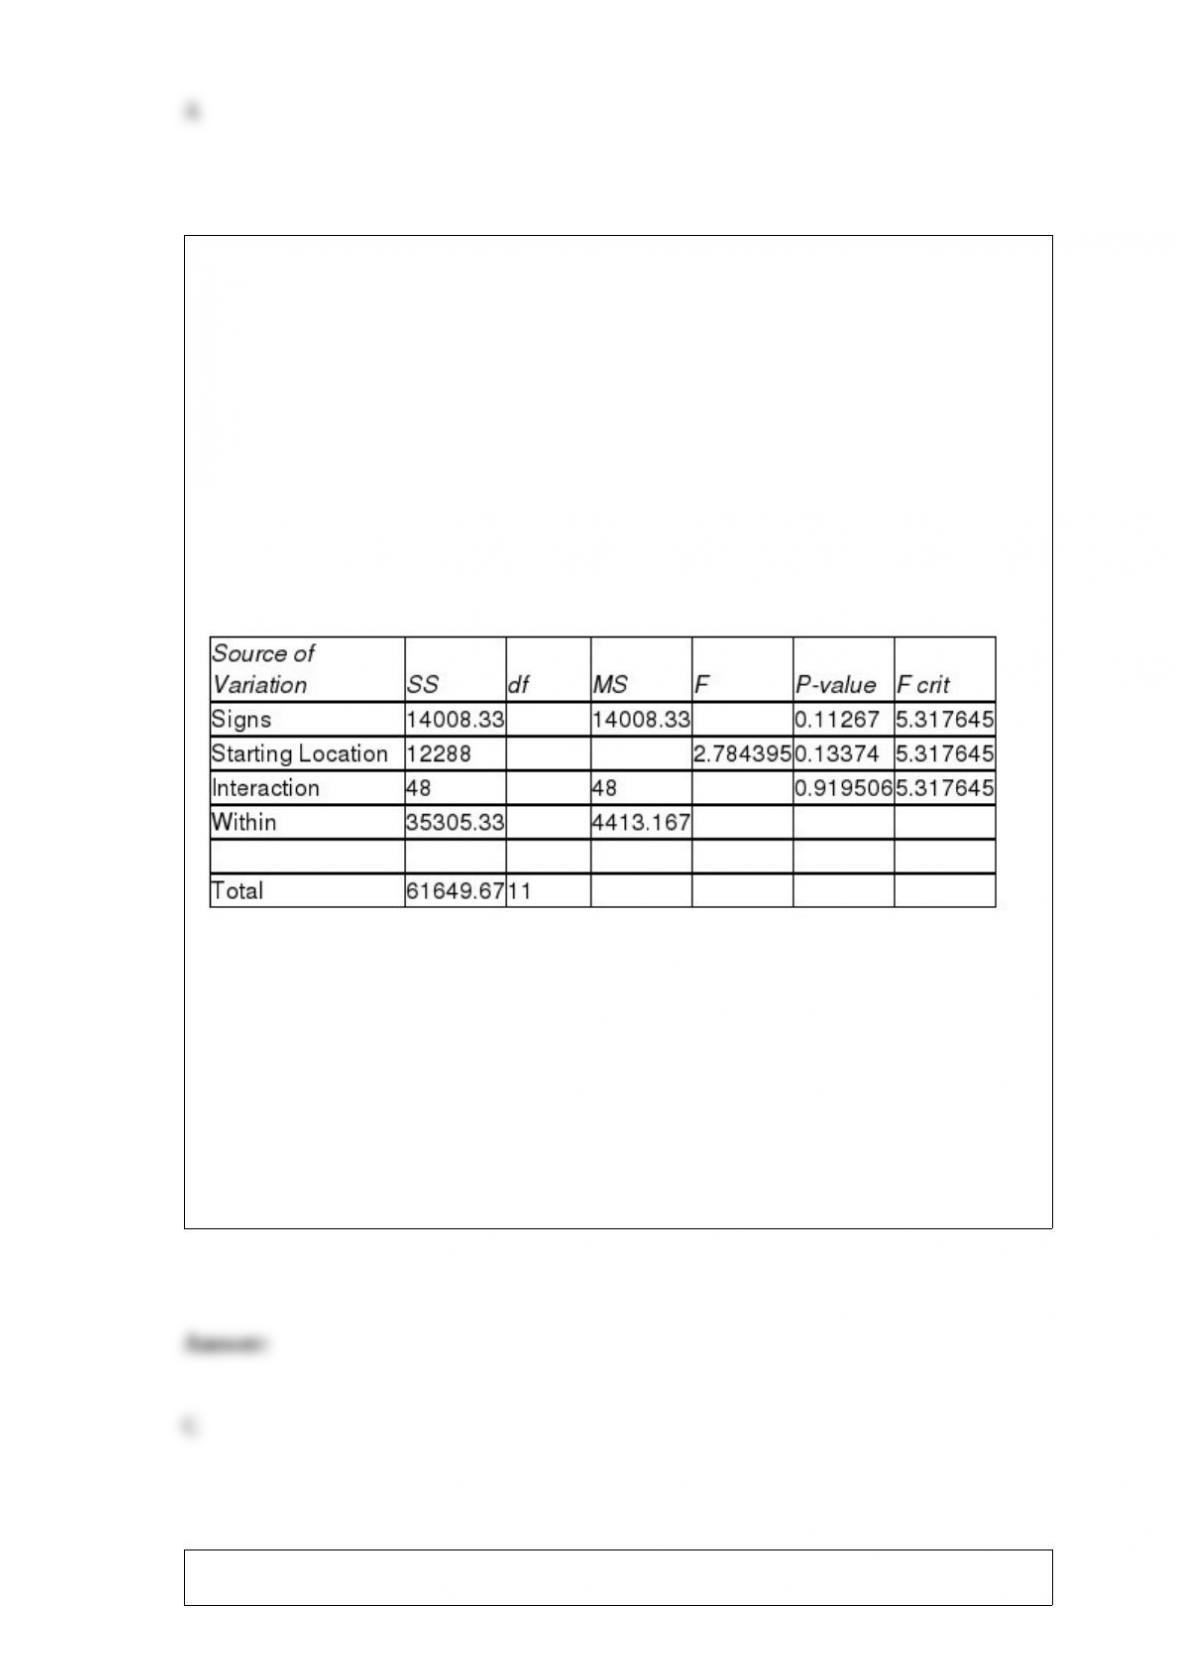
TABLE 11-7
A campus researcher wanted to investigate the factors that affect visitor travel time in a
complex, multilevel building on campus. Specifically, he wanted to determine whether
different building signs (building maps versus wall signage) affect the total amount of
time visitors require to reach their destination and whether that time depends on
whether the starting location is inside or outside the building. Three subjects were
assigned to each of the combinations of signs and starting locations, and travel time in
seconds from beginning to destination was recorded. An Excel output of the appropriate
analysis is given below:
ANOVA
Referring to Table 11-7, the within (error) degrees of freedom is
A) 1.
B) 4.
C) 8.
D) 11.
Which of the following situations suggests a process that appears to be operating out of

statistical control?
A) A control chart with a series of consecutive points that are above the center line and
a series of consecutive points that are below the center line
B) A control chart in which points fall outside the lower control limit
C) A control chart in which several points fall outside the upper control limit
D) All of the above
A company that manufactures designer jeans is contemplating whether to increase its
advertising budget by $1 million for next year. If the expanded advertising campaign is
successful, the company expects sales to increase by $1.6 million next year. If the
advertising campaign fails, the company expects sales to increase by only $400,000
next year. If the advertising budget is not increased, the company expects sales to
increase by $200,000. Identify the payoffs in this decision-making problem.
A) Two choices: <1> increase the budget and <2> do not increase the budget.
B) Two possibilities: <1> campaign is successful and <2> campaign is not successful.
C) Four consequences resulting from the Increase/Do Not Increase and Successful/Not
Successful combinations.
D) The increase in sales dollars next year.
Every spring semester, the School of Business coordinates with local business leaders a
luncheon for graduating seniors, their families, and friends. Corporate sponsorship pays
for the lunches of each of the seniors, but students have to purchase tickets to cover the
cost of lunches served to guests they bring with them. Data on the number of guests
each graduating senior invited to the luncheon and the number of graduating seniors in
each category were collected. You want to know the most popular number of guests
brought by the graduating seniors. Which of the following will you compute?
A) Arithmetic mean
B) Median
C) Interquartile range
D) Mode
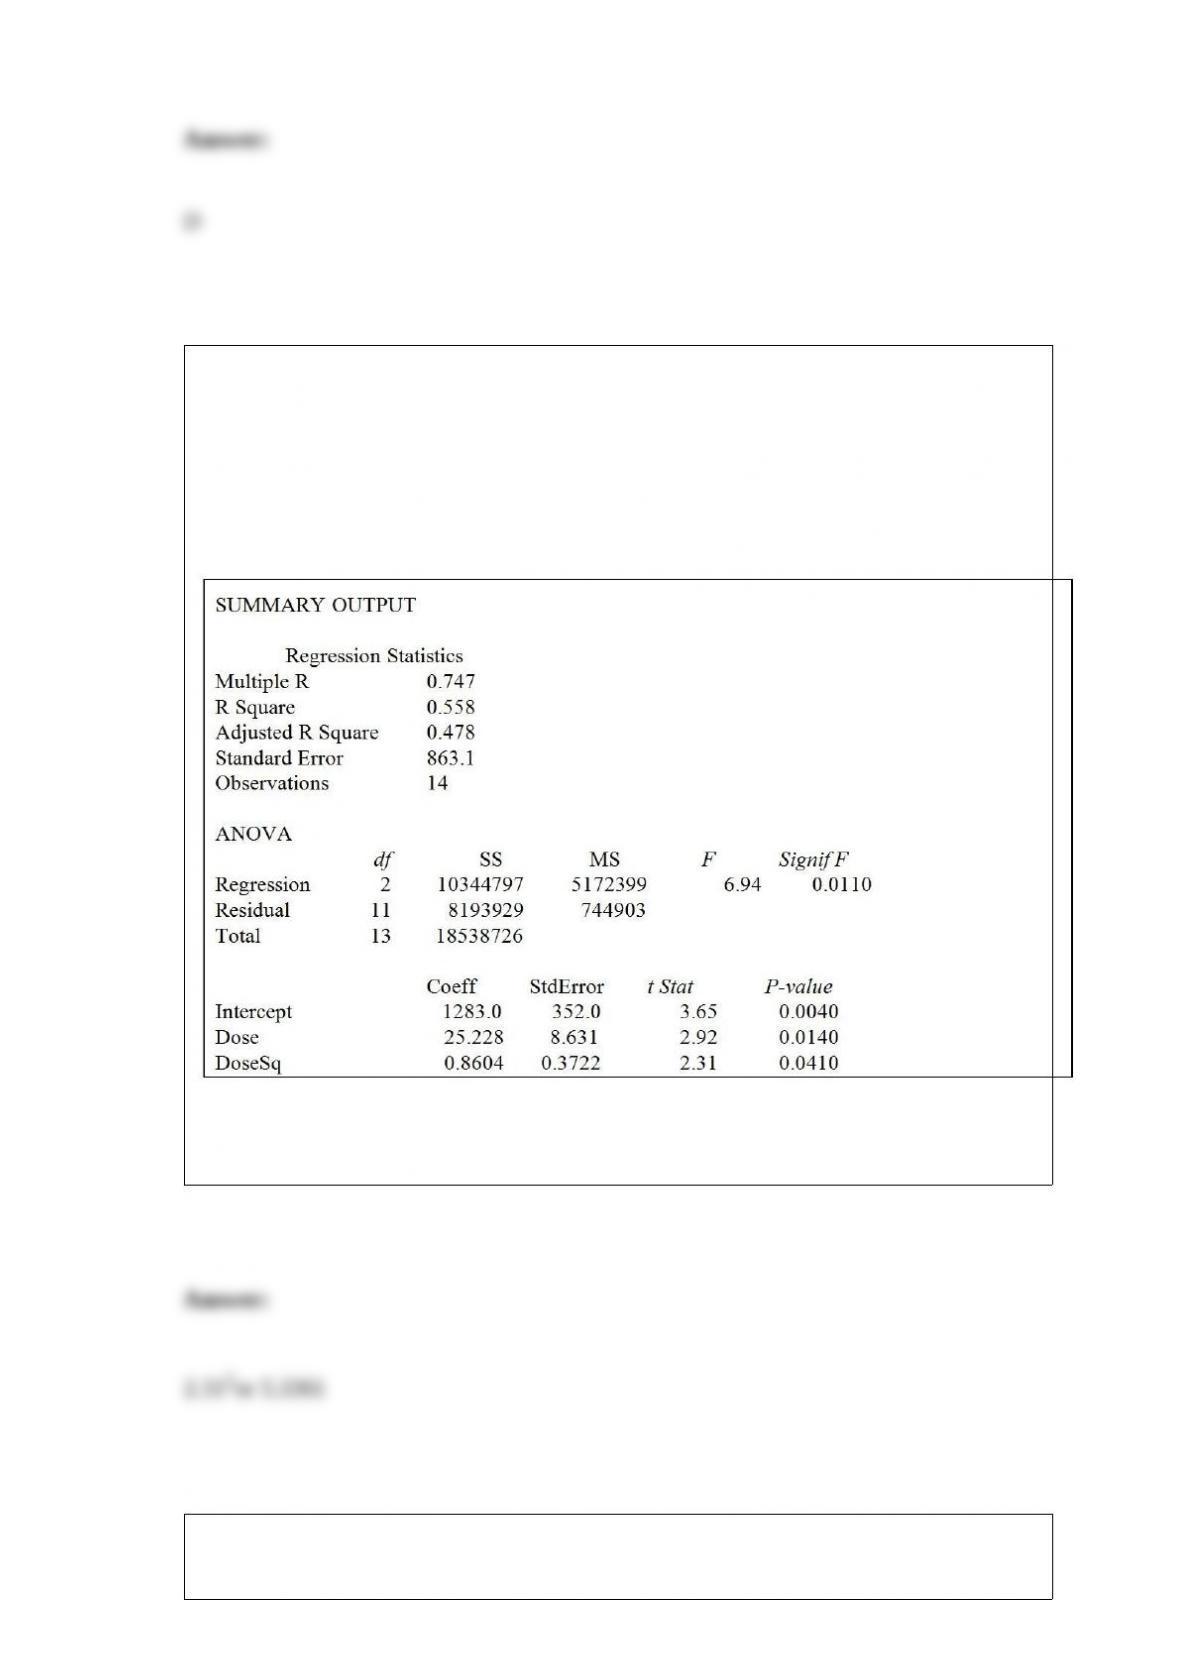
TABLE 15-3
A chemist employed by a pharmaceutical firm has developed a muscle relaxant. She
took a sample of 14 people suffering from extreme muscle constriction. She gave each a
vial containing a dose (X) of the drug and recorded the time to relief (Y) measured in
seconds for each. She fit a curvilinear model to this data. The results obtained by
Microsoft Excel follow
Referring to Table 15-3, suppose the chemist decides to use an F test to determine if
there is a significant curvilinear relationship between time and dose. The value of the
test statistic is ________.
TABLE 2-5
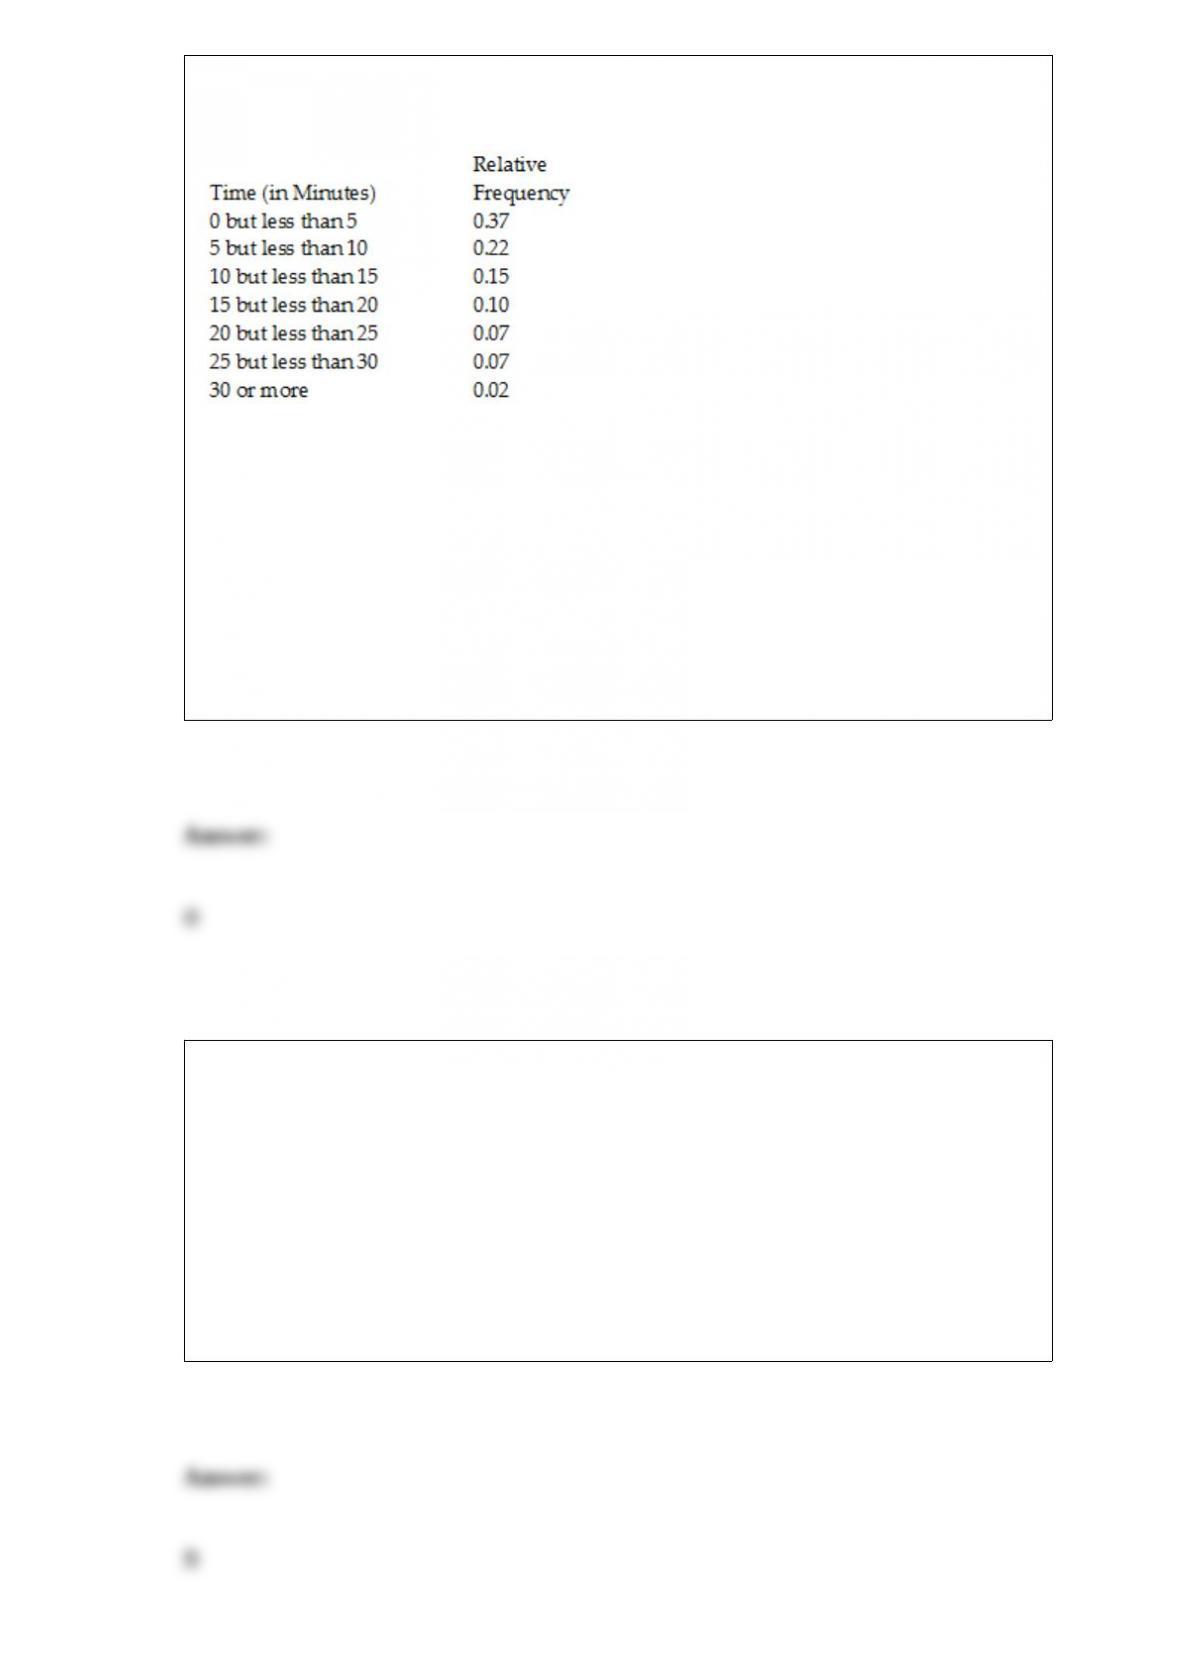
The following are the duration in minutes of a sample of long-distance phone calls
made within the continental United States reported by one long-distance carrier.
Referring to Table 2-5, what is the width of each class?
A) 1 minute
B) 5 minutes
C) 2%
D) 100%
For a sample size of 16, the sampling distribution of the mean will be approximately
normally distributed
A) regardless of the shape of the population.
B) if the shape of the population is symmetrical.
C) if the sample standard deviation is known.
D) if the sample is normally distributed.
TABLE 1-1
The manager of the customer service division of a major consumer electronics company
is interested in determining whether the customers who have purchased a Blu-ray
player made by the company over the past 12 months are satisfied with their products.
Referring to Table 1-1, the possible responses to the question “How would you rate the
quality of your purchase experience with 1 = excellent, 2 = good, 3 = decent, 4 = poor,
5 = terrible?” result in
A) a nominal scale variable.
B) an ordinal scale variable.
C) an interval scale variable.
D) a ratio scale variable.
A regression diagnostic tool used to study the possible effects of collinearity is
A) the slope.
B) the Y-intercept.
C) the VIF.
D) the standard error of the estimate.
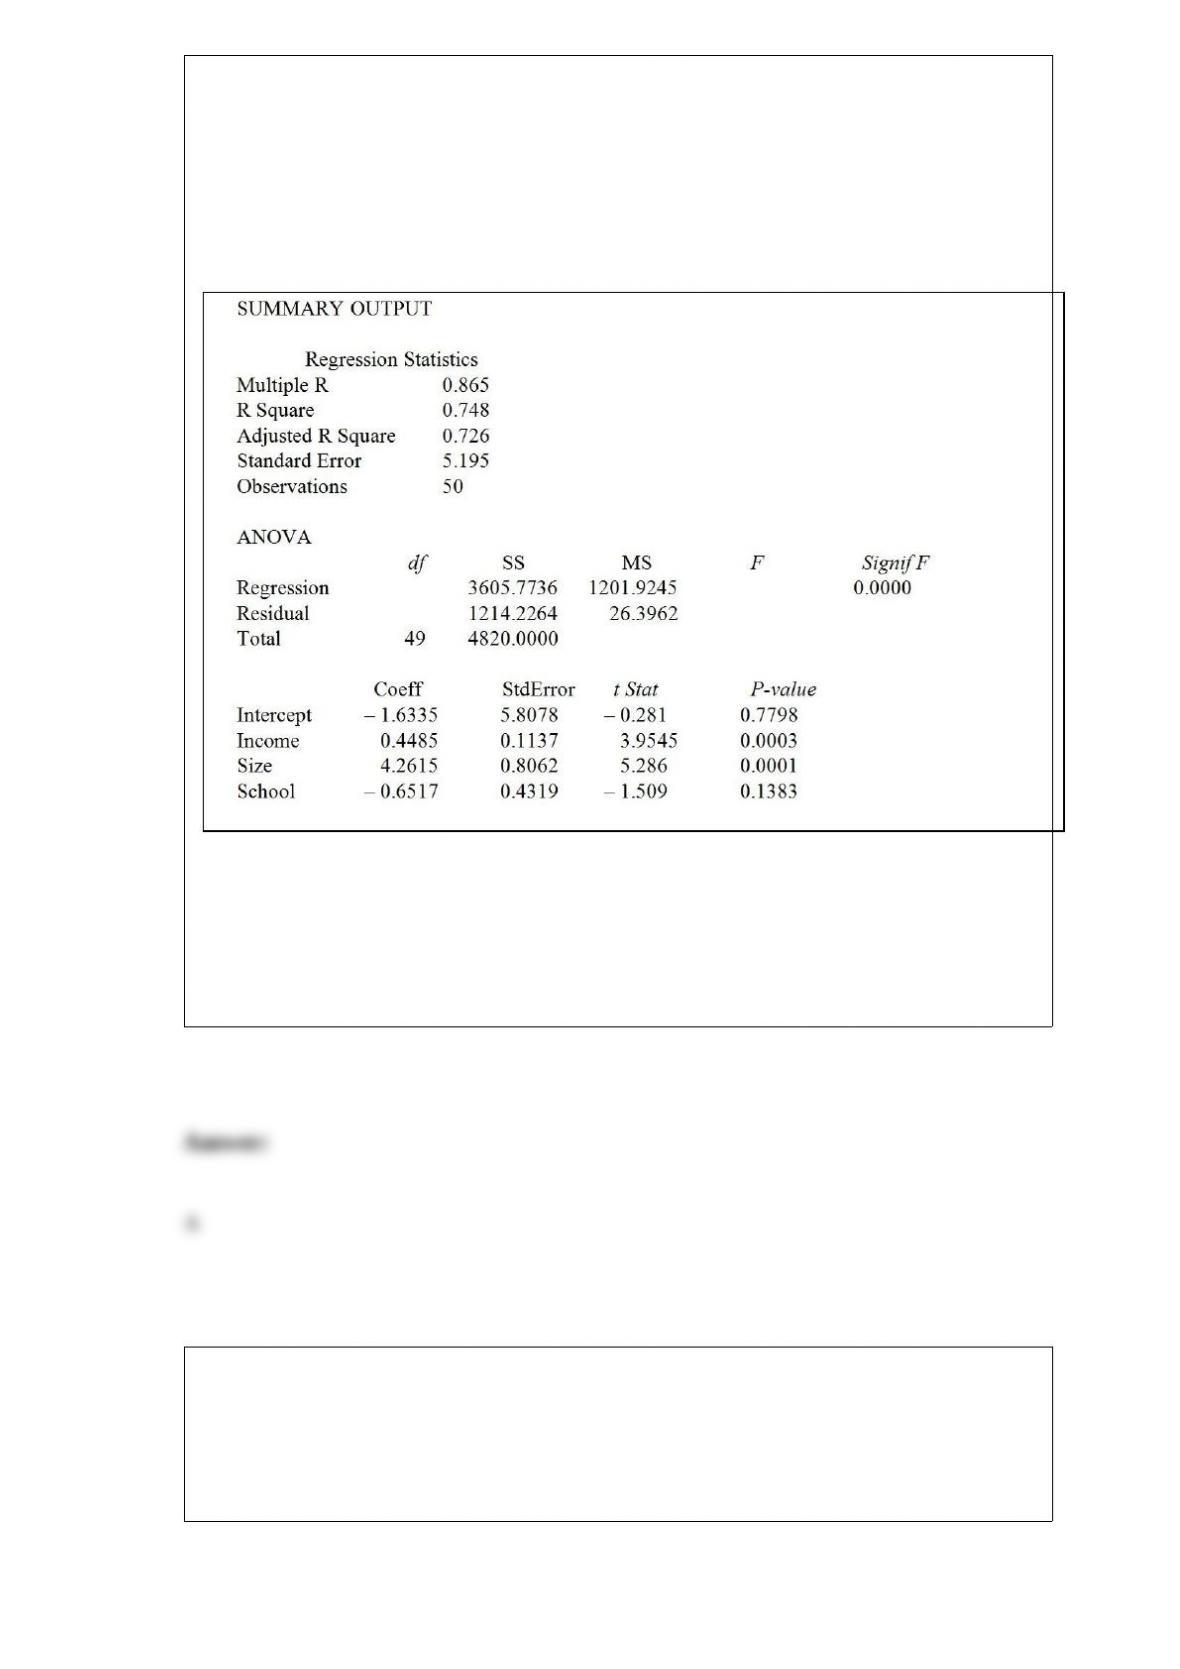
TABLE 17-1
A real estate builder wishes to determine how house size (House) is influenced by
family income (Income), family size (Size), and education of the head of household
(School). House size is measured in hundreds of square feet, income is measured in
thousands of dollars, and education is in years. The builder randomly selected 50
families and ran the multiple regression. Microsoft Excel output is provided below:
Referring to Table 17-1, which of the following values for the level of significance is
the smallest for which at least two explanatory variables are significant individually?
A) 0.01
B) 0.025
C) 0.05
D) 0.15
TABLE 18-3
A quality control analyst for a light bulb manufacturer is concerned that the time it takes
to produce a batch of light bulbs is too erratic. Accordingly, the analyst randomly
surveys 10 production periods each day for 14 days and records the sample mean and
range for each day.
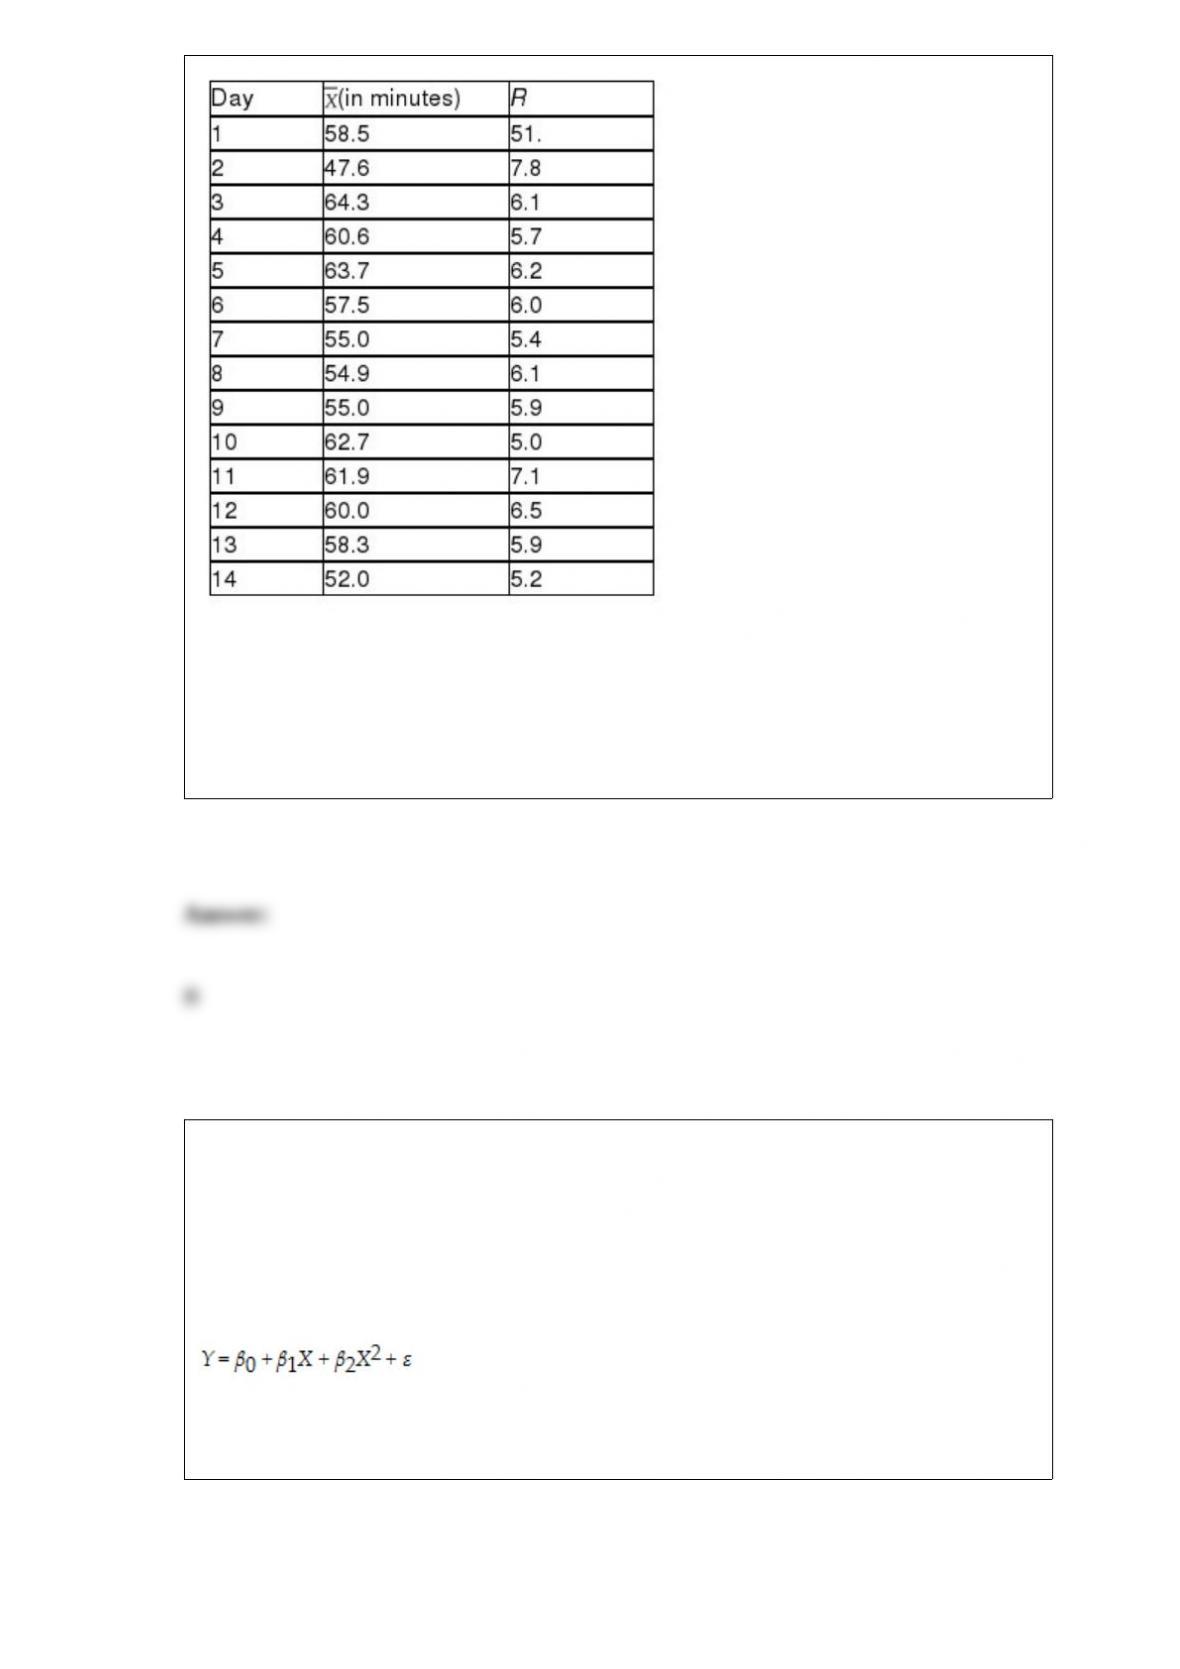
Referring to Table 18-3, suppose the analyst constructs an R chart to see if the
variability in production times is in-control. What is the center line of this R chart?
A) 4.8
B) 6.0
C) 6.9
D) 7.1
TABLE 15-1
A certain type of rare gem serves as a status symbol for many of its owners. In theory,
for low prices, the demand increases and it decreases as the price of the gem increases.
However, experts hypothesize that when the gem is valued at very high prices, the
demand increases with price due to the status owners believe they gain in obtaining the
gem. Thus, the model proposed to best explain the demand for the gem by its price is
the quadratic model:
where Y = demand (in thousands) and X = retail price per carat.
This model was fit to data collected for a sample of 12 rare gems of this type. A portion
of the computer analysis obtained from Microsoft Excel is shown below:
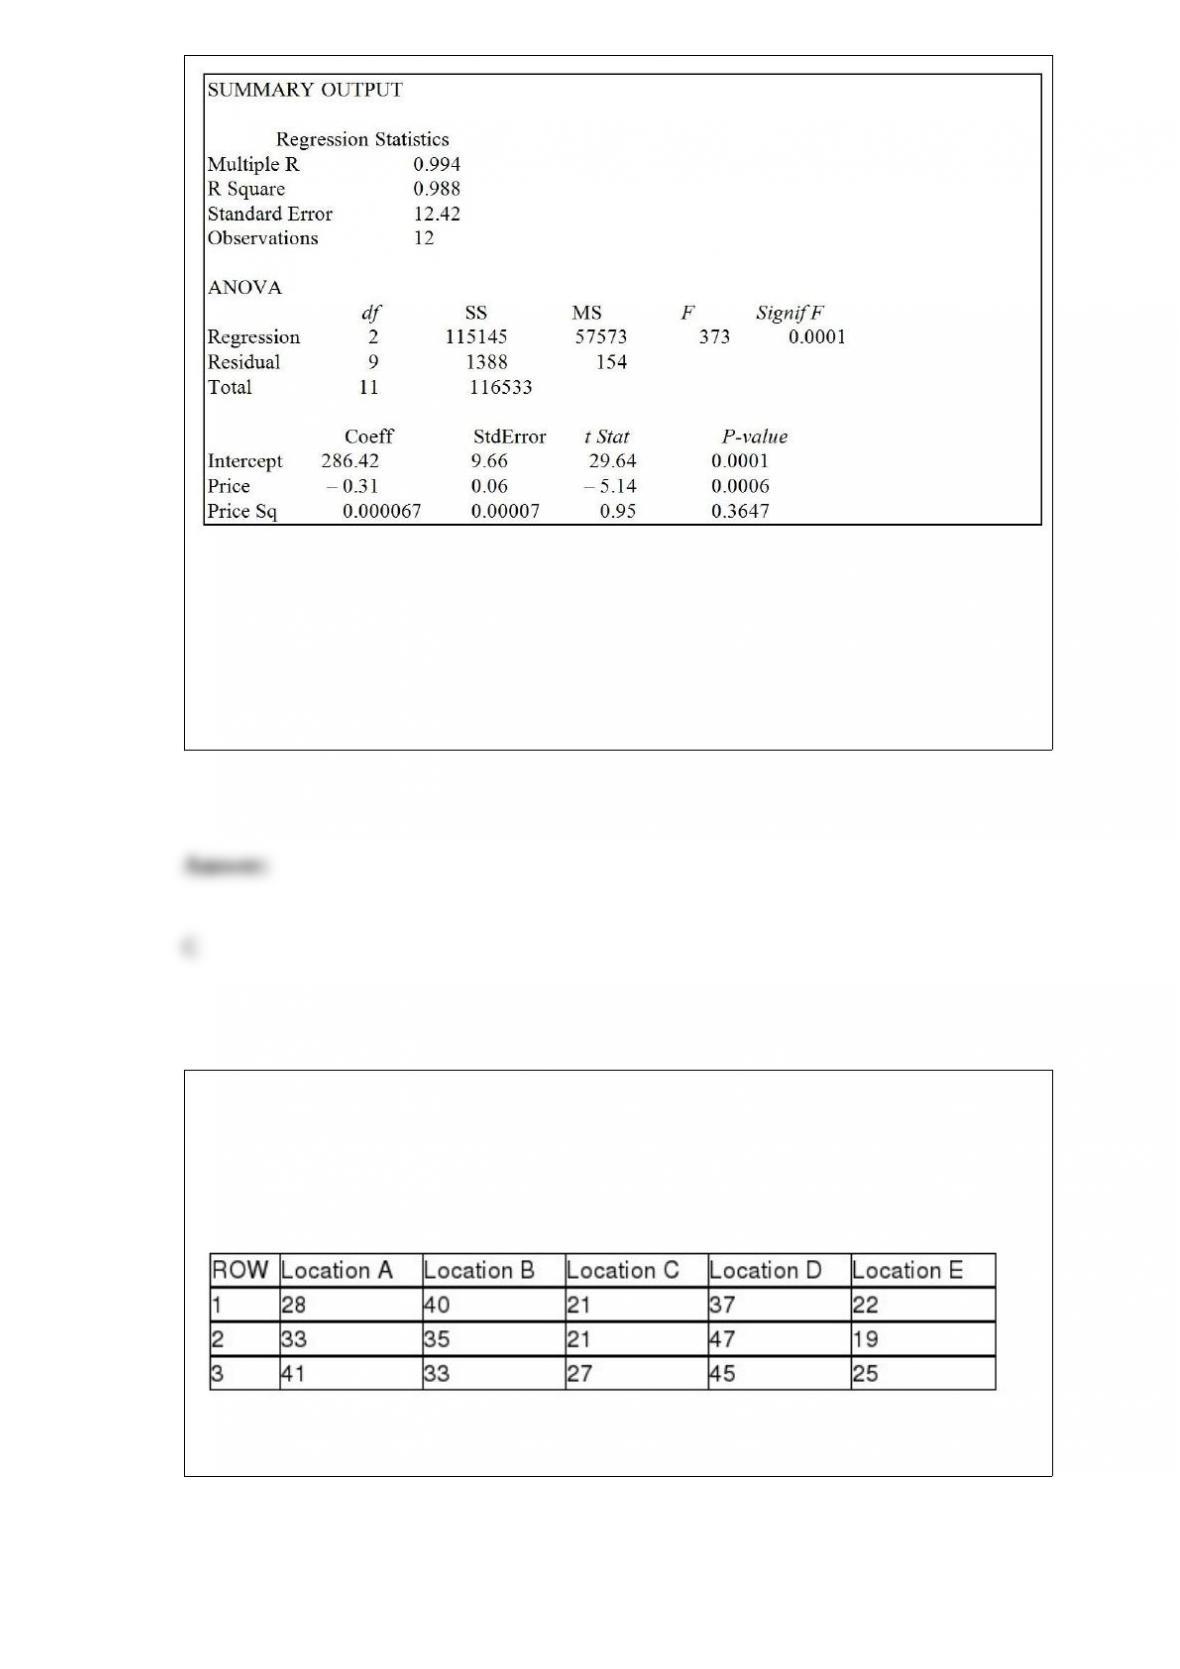
Referring to Table 15-1, what is the p-value associated with the test statistic for testing
whether there is an upward curvature in the response curve relating the demand (Y) and
the price (X)?
A) 0.0001
B) 0.0006
C) 0.3647
D) None of the above
TABLE 11-5
A hotel chain has identically small sized resorts in 5 locations in different small islands.
The data that follow resulted from analyzing the hotel occupancies on randomly
selected days in the 5 locations.
Analysis of Variance
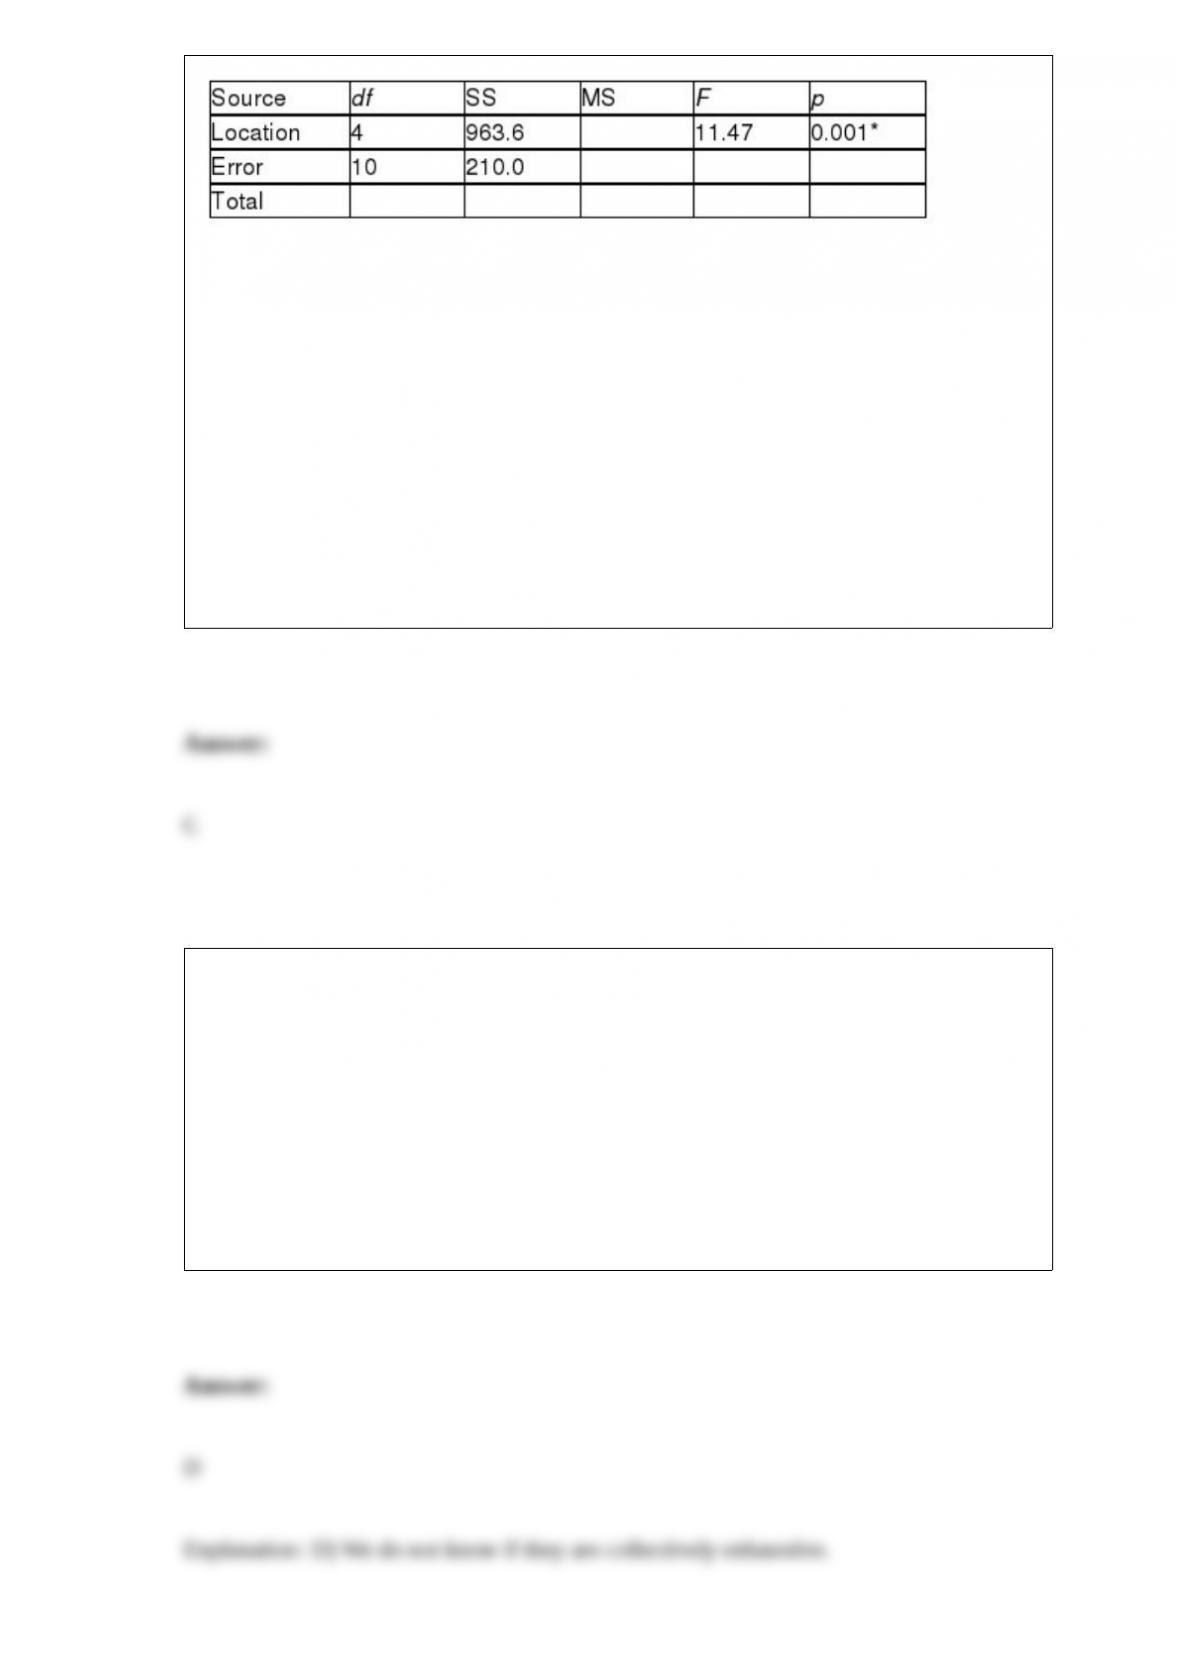
* or p < 0.005, tabular value
Referring to Table 11-5, what should be the conclusion for the Levene’s test for
homogeneity of variances at a 5% level of significance?
A) There is insufficient evidence that the variances are all the same.
B) There is sufficient evidence that the variances are all the same.
C) There is insufficient evidence that the variances are not all the same.
D) There is sufficient evidence that the variances are not all the same.
If two equally likely events A and B are mutually exclusive, what is the probability that
event A occurs?
A) 0
B) 0.50
C) 1.00
D) Cannot be determined from the information given.
The standard error of the mean
A) is never larger than the standard deviation of the population.
B) decreases as the sample size increases.
C) measures the variability of the mean from sample to sample.
D) All of the above.
________ is a procedure for revising probabilities based upon additional information.
A) Utility theory
B) Bernoulli’s theorem
C) Beckman’s theorem
D) Bayes’ theorem
Which of the following is a discrete quantitative (numerical) variable?
A) the Dow Jones Industrial average
B) the volume of water released from a dam
C) the distance you drove yesterday
D) the number of employees of an insurance company
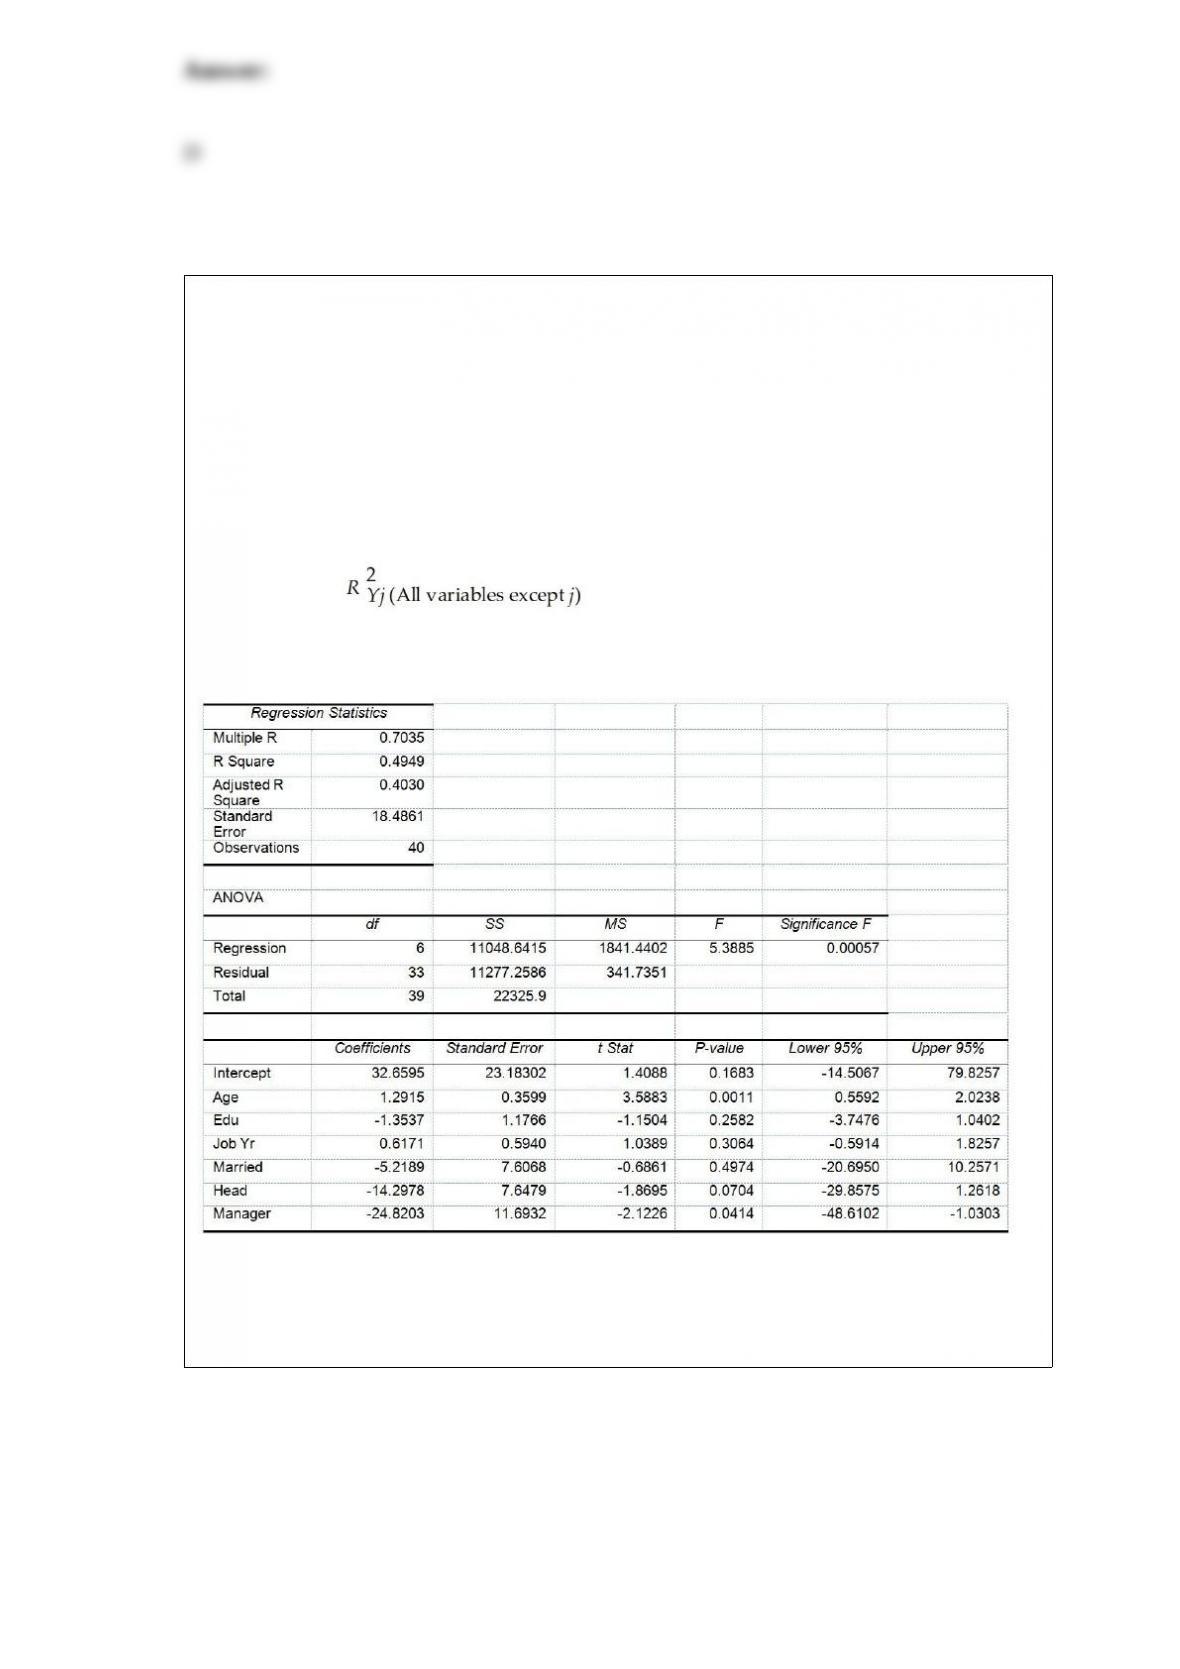
TABLE 17-10
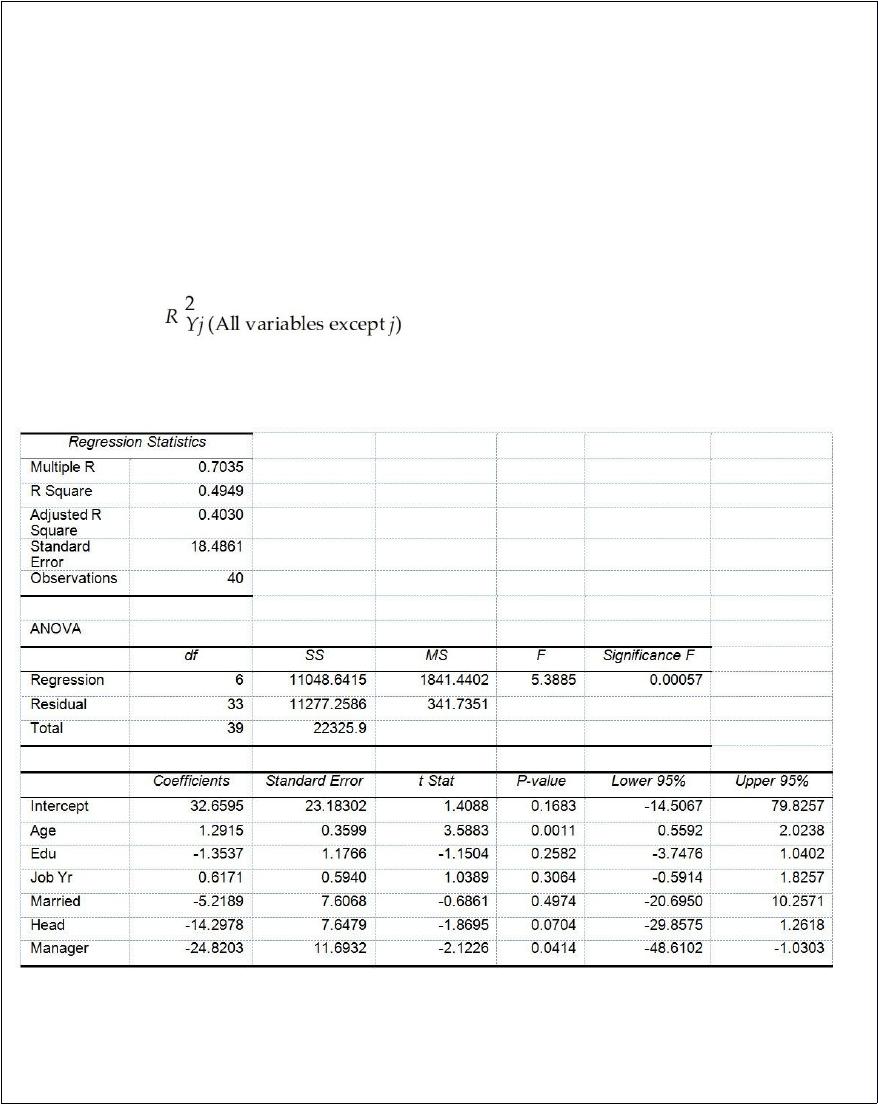
Given below are results from the regression analysis where the dependent variable is
the number of weeks a worker is unemployed due to a layoff (Unemploy) and the
independent variables are the age of the worker (Age), the number of years of education
received (Edu), the number of years at the previous job (Job Yr), a dummy variable for
marital status (Married: 1 = married, 0 = otherwise), a dummy variable for head of
household (Head: 1 = yes, 0 = no) and a dummy variable for management position
(Manager: 1 = yes, 0 = no). We shall call this Model 1. The coefficient of partial
determination ( ) of each of the 6 predictors are, respectively,
0.2807, 0.0386, 0.0317, 0.0141, 0.0958, and 0.1201.
Model 2 is the regression analysis where the dependent variable is Unemploy and the
independent variables are Age and Manager. The results of the regression analysis are
given below:

Referring to Table 17-10, Model 1, ________ of the variation in the number of weeks a
worker is unemployed due to a layoff can be explained by the number of years at the
previous job while controlling for the other independent variables.
Referring to Table 14-8, the analyst wants to use a t test to test for
the signi.cance of the coefficient of X2. For a level of signi.cance of
0.01, the critical values of the test are ________.TABLE 14-8
A .nancial analyst wanted to examine the relationship between salary
(in $1,000) and 2 variables: age
(X1 = Age) and experience in the .eld (X2 = Exper). He took a sample
of 20 employees and obtained the following Microsoft Excel output:
Also, the sum of squares due to the regression for the model that
includes only Age is 5022.0654 while the sum of squares due to the
regression for the model that includes only Exper is 125.9848.
The number of power outages at a nuclear power plant has a Poisson distribution with a
mean of 6 outages per year. The probability that there will be between 1 and 3 inclusive
power outages in a year is ________.
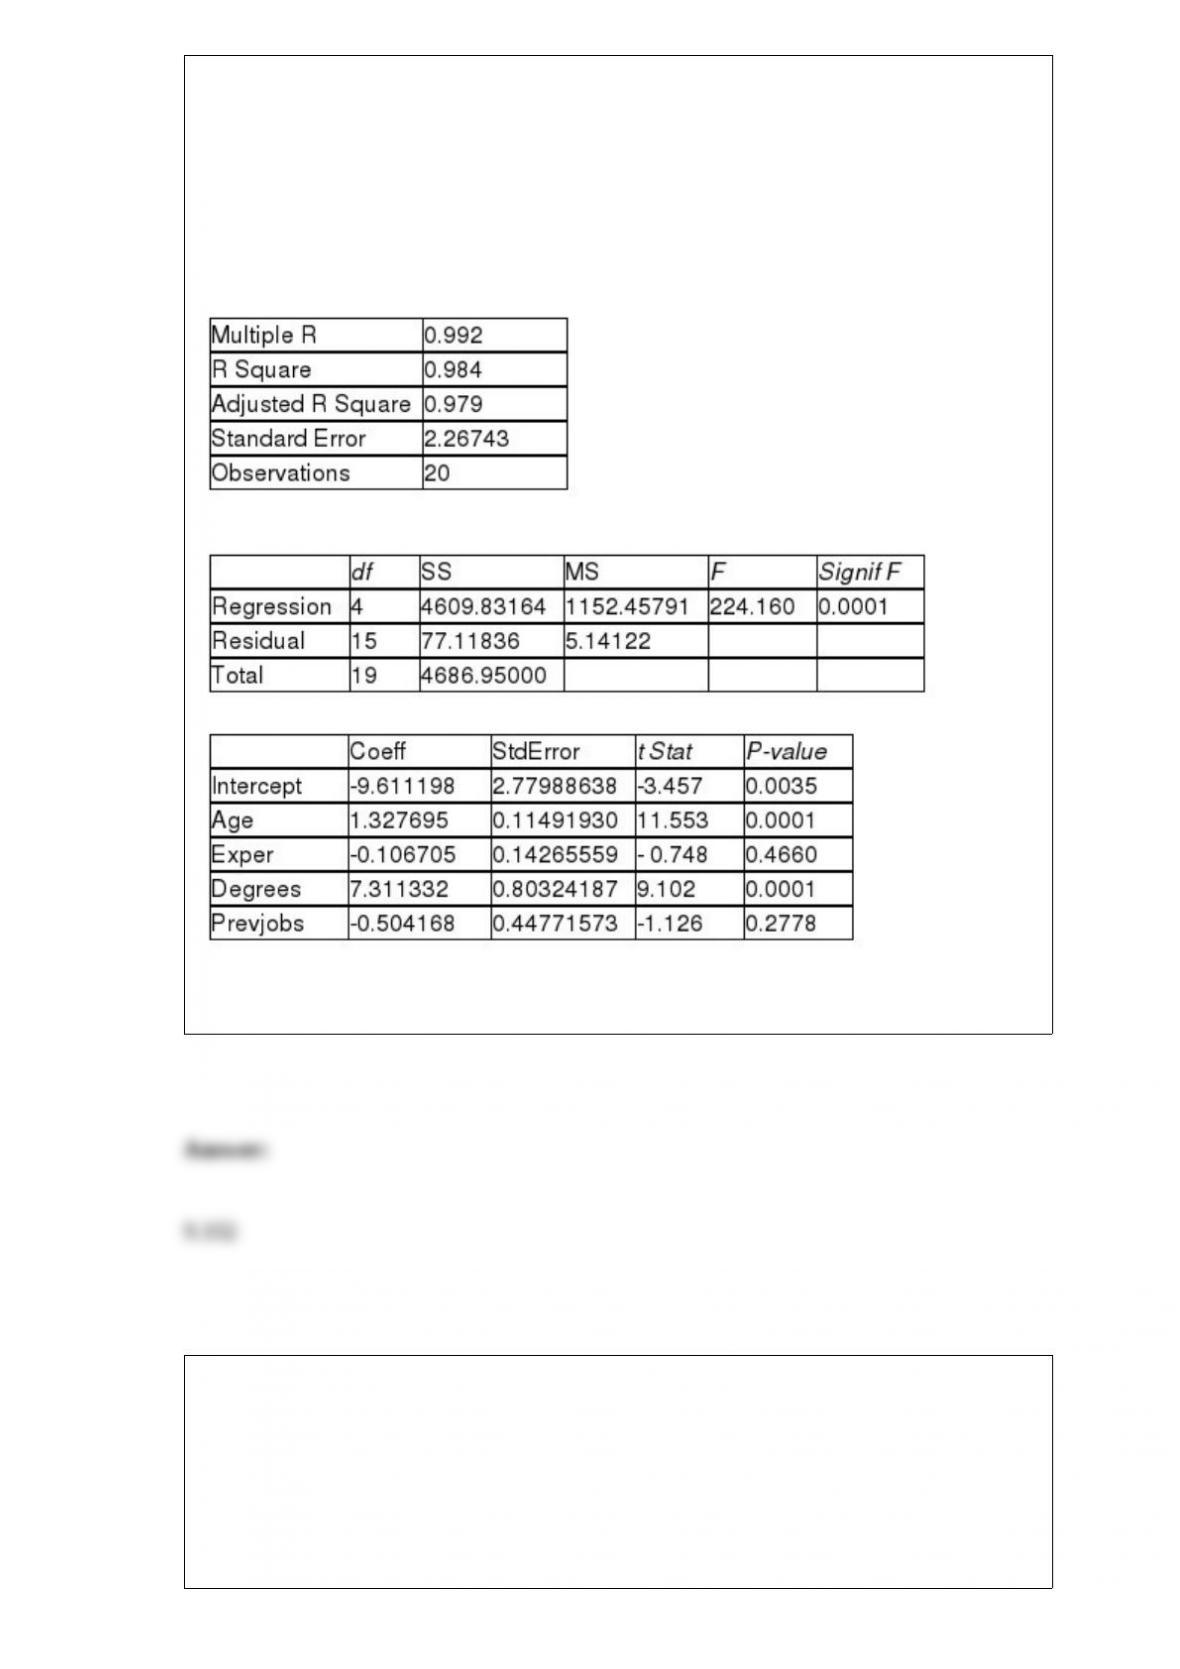
TABLE 17-3
A financial analyst wanted to examine the relationship between salary (in $1,000) and 4
variables: age (X1 = Age), experience in the field (X2 = Exper), number of degrees (X3 =
Degrees), and number of previous jobs in the field (X4 = Prevjobs). He took a sample of
20 employees and obtained the following Microsoft Excel output:
SUMMARY OUTPUT
Regression Statistics
ANOVA
Referring to Table 17-3, the analyst wants to use a t test to test for the significance of
the coefficient of X3. The value of the test statistic is ________.
TABLE 5-1
The probability that a particular type of smoke alarm will function properly and sound
an alarm in the presence of smoke is 0.8. You have 2 such alarms in your home and they
operate independently.
Referring to Table 5-1, the probability that at least one sounds an alarm in the presence
of smoke is ________.
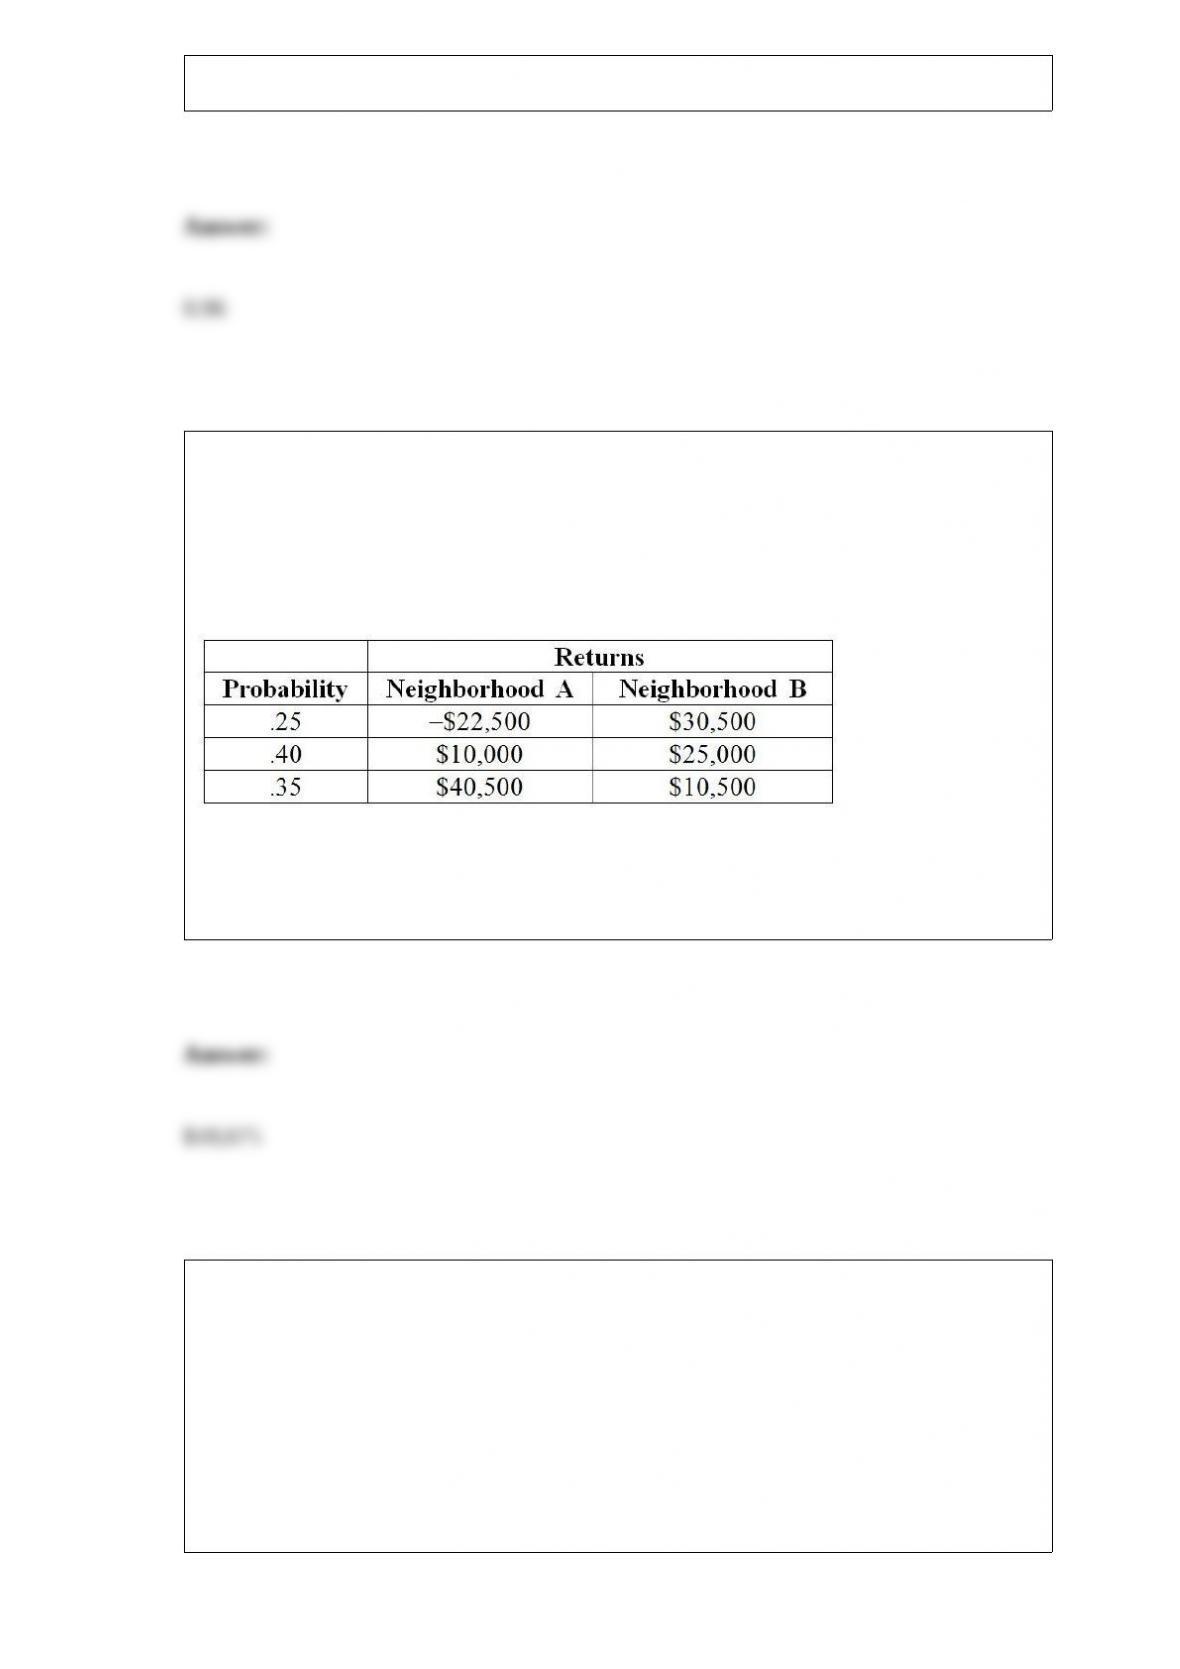
TABLE 5-7
There are two houses with almost identical characteristics available for investment in
two different neighborhoods with drastically different demographic composition. The
anticipated gain in value when the houses are sold in 10 years has the following
probability distribution:
Referring to Table 5-7, if you can invest 30% of your money on the house in
neighborhood A and the remaining on the house in neighborhood B, what is the
portfolio expected return of your investment?
TABLE 4-9
A survey conducted by the Segal Company of New York found that in a sample of 189
large companies, 40 offered stock options to their board members as part of their
noncash compensation packages. For small- to mid-sized companies, 43 of the 180
surveyed indicated that they offer stock options as part of their noncash compensation
packages to their board members.
Referring to Table 4-9, set up a contingency table.
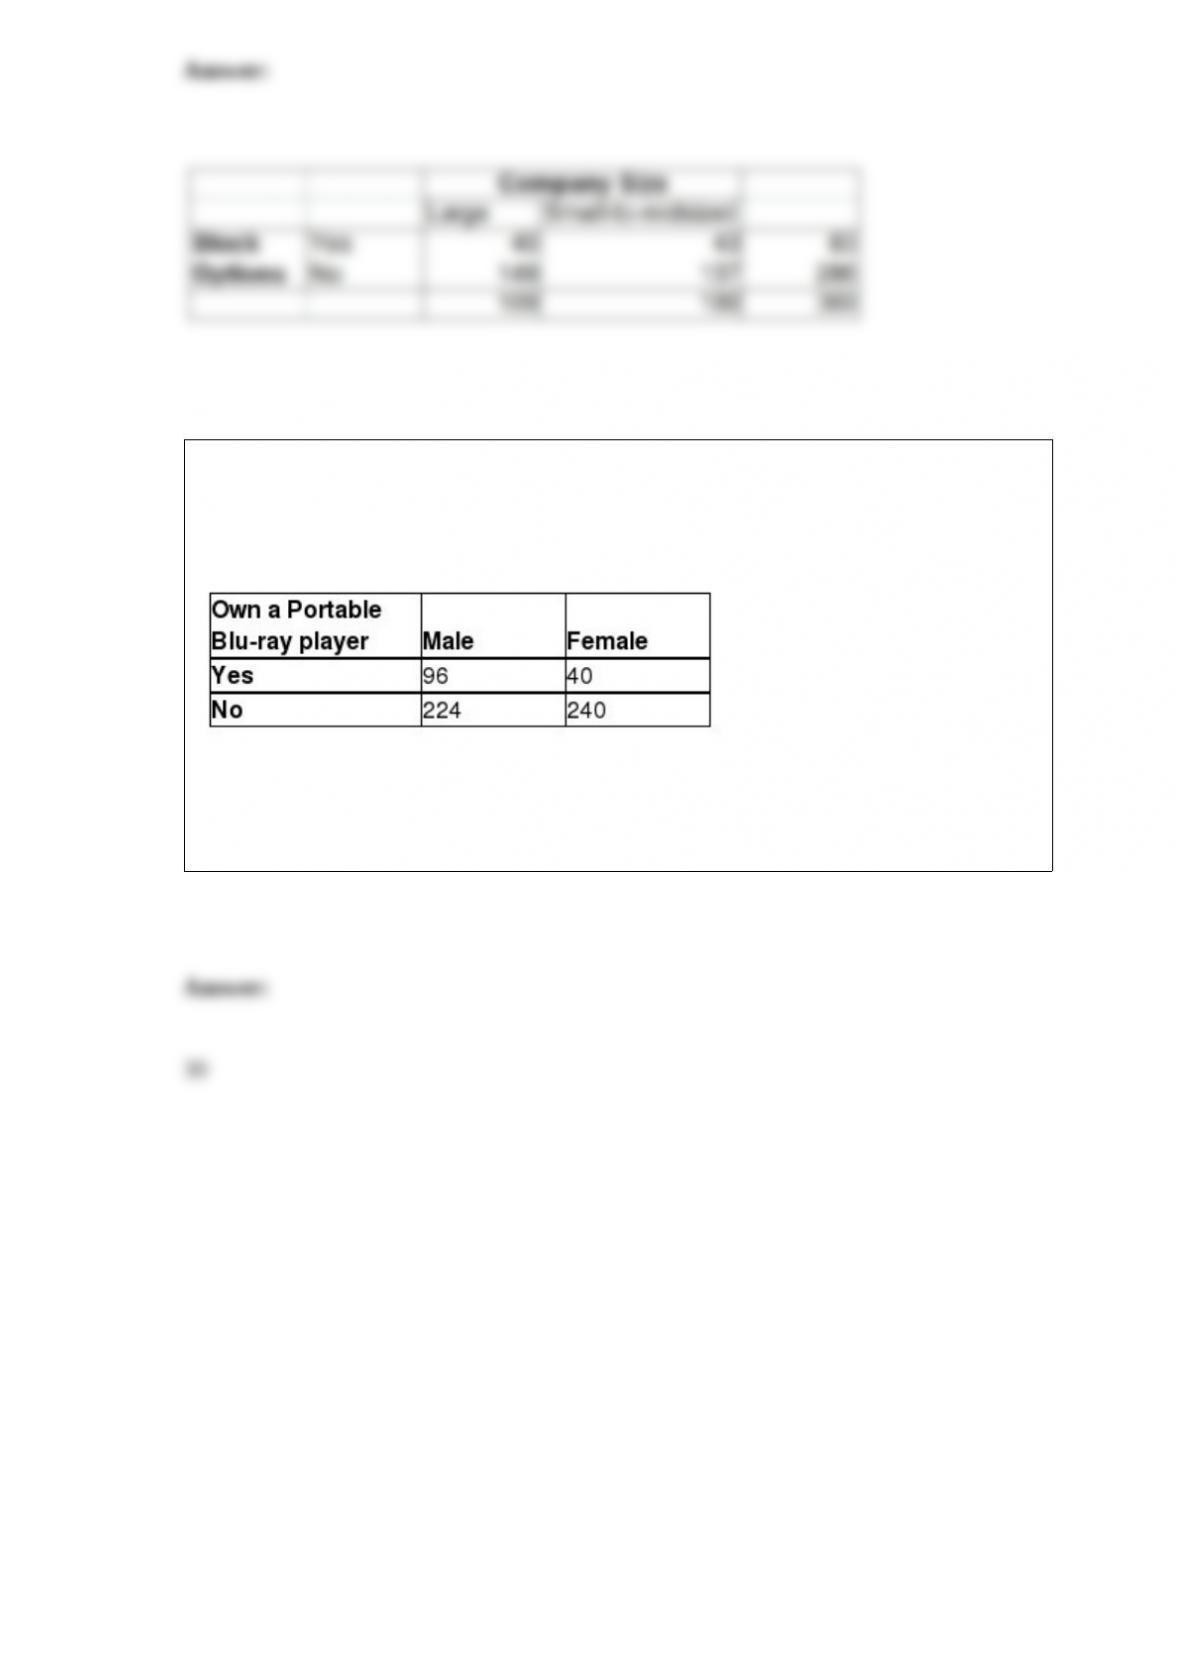
TABLE 2-14
The table below contains the number of people who own a portable Blu-ray player in a
sample of 600 broken down by gender.
Referring to Table 2-14, if the sample is a good representation of the population, we can
expect ________ percent of the males in the population will own a portable Blu-ray
player.