
True or False: One of the morals of the red bead experiment is that variation is part of
any process.
True or False: As the sample size increases, the effect of an extreme value on the
sample mean becomes smaller.
TABLE 8-12
A random sample of 100 stores from a large chain of 500 garden supply stores was
selected to determine the mean number of lawnmowers sold at an end-of-season
clearance sale. The sample results indicated a mean of 6 and a standard deviation of 2
lawnmowers sold. A 95% confidence interval (5.623 to 6.377) was established based on
these results.
True or False: Referring to Table 8-12, if the population had consisted of 400 stores, the
confidence interval estimate of the mean with finite population correction would have
been wider in range.
True or False: In the United States, the control limits on a control chart are placed so
that they are 3 standard deviations above and below a central line.
True or False: A Marine drill instructor recorded the time in which each of 11 recruits
completed an obstacle course both before and after basic training. To test whether any
improvement occurred, the instructor would use a t-distribution with 10 degrees of
freedom.
True or False: Suppose that the number of airplanes arriving at an airport per minute is
a Poisson process. The average number of airplanes arriving per minute is 3. The
probability that exactly 6 planes arrive in the next minute is 0.05041.
True or False: For distributions such as the normal distribution, the arithmetic mean is
considered more stable from sample to sample than other measures of central tendency.

True or False: The Paasche price index uses the consumption quantities in the year of
interest as the weights.
TABLE 12-1
A corporation randomly selects 150 salespeople and finds that 66% who have never
taken a self-improvement course would like such a course. The firm did a similar study
10 years ago in which 60% of a random sample of 160 salespeople wanted a
self-improvement course. The groups are assumed to be independent random samples.
Let and represent the true proportion of workers who would like to attend a
self-improvement course in the recent study and the past study, respectively.
Referring to Table 12-1, what is the value of the test statistic to use in evaluating the
alternative hypothesis that there is a difference in the two population proportions using
= 0.10?
A) 4.335
B) 2.706
C) 1.194
D) 0.274
A manager of a product sales group believes the number of sales made by an employee

depends on how many years that employee has been with the company and how he/she
scored on a business aptitude test. A random sample of 38 employees was selected to
collect data on their number of sales, number of years with the company and scores on a
business aptitude test. Which of the following would you perform to draw a conclusion
on the belief?
A) One-way ANOVA
B) Simple linear regression
C) Two-way ANOVA
D) Multiple linear regression
Blossom’s Flowers purchases roses for sale for Valentine’s Day. The roses are purchased
for $10 a dozen and are sold for $20 a dozen. Any roses not sold on Valentine’s Day can
be sold for $5 per dozen. The owner will purchase 1 of 3 amounts of roses for
Valentine’s Day: 100, 200, or 400 dozen roses. The payoff for buying 200 dozen roses
and selling 100 dozen roses at the full price is
A) $2,000.
B) $1,000.
C) $500.
D) -$500.
Which of the following is not one of Deming’s 14 points?
A) Create constancy of purpose for improvement of product or service.
B) Award business on the basis of price tag alone.
C) Break down barriers between staff areas.
D) Drive out fear.

TABLE 1-1
The manager of the customer service division of a major consumer electronics company
is interested in determining whether the customers who have purchased a Blu-ray
player made by the company over the past 12 months are satisfied with their products.
Referring to Table 1-1, the possible responses to the question “In which year were you
born?” are values from a
A) discrete numerical variable.
B) continuous numerical variable.
C) categorical variable.
D) table of random numbers.
TABLE 11-2
A realtor wants to compare the mean sales-to-appraisal ratios of residential properties
sold in four neighborhoods (A, B, C, and D). Four properties are randomly selected
from each neighborhood and the ratios recorded for each, as shown below.
Interpret the results of the analysis summarized in the following table:
Referring to Table 11-2, the null hypothesis for Levene’s test for homogeneity of
variances is
A) H0 : A = B= C = D.
B) H0 : MA = MB = MC = MD.
C) H0 : = = = .
D) H0 : A = B = C = D.
Let X represent the amount of time till the next student will arrive in the library parking
lot at the university. If we know that the distribution of arrival time can be modeled
using an exponential distribution with a mean of 4 minutes (i.e. the mean number of
arrivals is per minute), find the probability that it will take between 2 and 12 minutes
for the next student to arrive at the library parking lot.
A) 0.049787
B) 0.556744
C) 0.606531
D) 0.656318
TABLE 16-14
A contractor developed a multiplicative time-series model to forecast the number of

contracts in future quarters, using quarterly data on number of contracts during the
3-year period from 2010 to 2012. The following is the resulting regression equation:
ln = 3.37 + 0.117 X – 0.083 1 + 1.28 2 + 0.617 3
where is the estimated number of contracts in a quarter
X is the coded quarterly value with X = 0 in the first quarter of 2010
1 is a dummy variable equal to 1 in the first quarter of a year and 0 otherwise
2 is a dummy variable equal to 1 in the second quarter of a year and 0 otherwise
3 is a dummy variable equal to 1 in the third quarter of a year and 0 otherwise
Referring to Table 16-14, the best interpretation of the coefficient of Q3 (0.617) in the
regression equation is
A) the number of contracts in the third quarter of a year is approximately 62% higher
than the average over all 4 quarters.
B) the number of contracts in the third quarter of a year is approximately 62% higher
than it would be during the fourth quarter.
C) the number of contracts in the third quarter of a year is approximately 314% higher
than the average over all 4 quarters.
D) the number of contracts in the third quarter of a year is approximately 314% higher
than it would be during the fourth quarter.
The probability that house sales will increase in the next 6 months is estimated to be
0.25. The probability that the interest rates on housing loans will go up in the same
period is estimated to be 0.74. The probability that house sales or interest rates will go
up during the next 6 months is estimated to be 0.89. The events increase in house sales
and increase in interest rates in the next 6 months are
A) independent.
B) mutually exclusive.
C) collectively exhaustive.
D) None of the above.
TABLE 16-12
A local store developed a multiplicative time-series model to forecast its revenues in
future quarters, using quarterly data on its revenues during the 5-year period from 2008
to 2012. The following is the resulting regression equation:
log10 = 6.102 + 0.012 X – 0.129 1 – 0.054 2 + 0.098 3
where is the estimated number of contracts in a quarter
X is the coded quarterly value with X = 0 in the first quarter of 2008
1 is a dummy variable equal to 1 in the first quarter of a year and 0 otherwise
2 is a dummy variable equal to 1 in the second quarter of a year and 0 otherwise
is a dummy variable equal to 1 in the third quarter of a year and 0 otherwise
Referring to Table 16-12, to obtain a forecast for the third quarter of 2013 using the
model, which of the following sets of values should be used in the regression equation?
A) X = 22, 1 = 0, 2 = 0, 3 = 0
B) X = 22, 1 = 0, 2 = 0, 3 = 1
C) X = 23, 1 = 0, 2 = 0, 3 = 0
D) X = 23, 1 = 0, 2 = 0, 3 = 1
As a project for his business statistics class, a student examined the factors that
determined parking meter rates throughout the campus area. Data were collected for the
price per hour of parking, blocks to the quadrangle, and one of the three jurisdictions:
on campus, in downtown and off campus, or outside of downtown and off campus. The
population regression model hypothesized is
where
Y is the meter price
X1 is the number of blocks to the quad
X2 is a dummy variable that takes the value 1 if the meter is located in downtown and
off campus and the value 0 otherwise
X3 is a dummy variable that takes the value 1 if the meter is located outside of
downtown and off campus, and the value 0 otherwise
Suppose that whether the meter is located on campus is an important explanatory factor.
Why should the variable that depicts this attribute not be included in the model?
A) Its inclusion will introduce autocorrelation.
B) Its inclusion will introduce collinearity.
C) Its inclusion will inflate the standard errors of the estimated coefficients.
D) Both B and C
TABLE 17-12
The marketing manager for a nationally franchised lawn service company would like to
study the characteristics that differentiate home owners who do and do not have a lawn
service. A random sample of 30 home owners located in a suburban area near a large
city was selected; 15 did not have a lawn service (code 0) and 15 had a lawn service
(code 1). Additional information available concerning these 30 home owners includes
family income (Income, in thousands of dollars), lawn size (Lawn Size, in thousands of
square feet), attitude toward outdoor recreational activities (Attitude 0 = unfavorable, 1
= favorable), number of teenagers in the household (Teenager), and age of the head of
the household (Age).
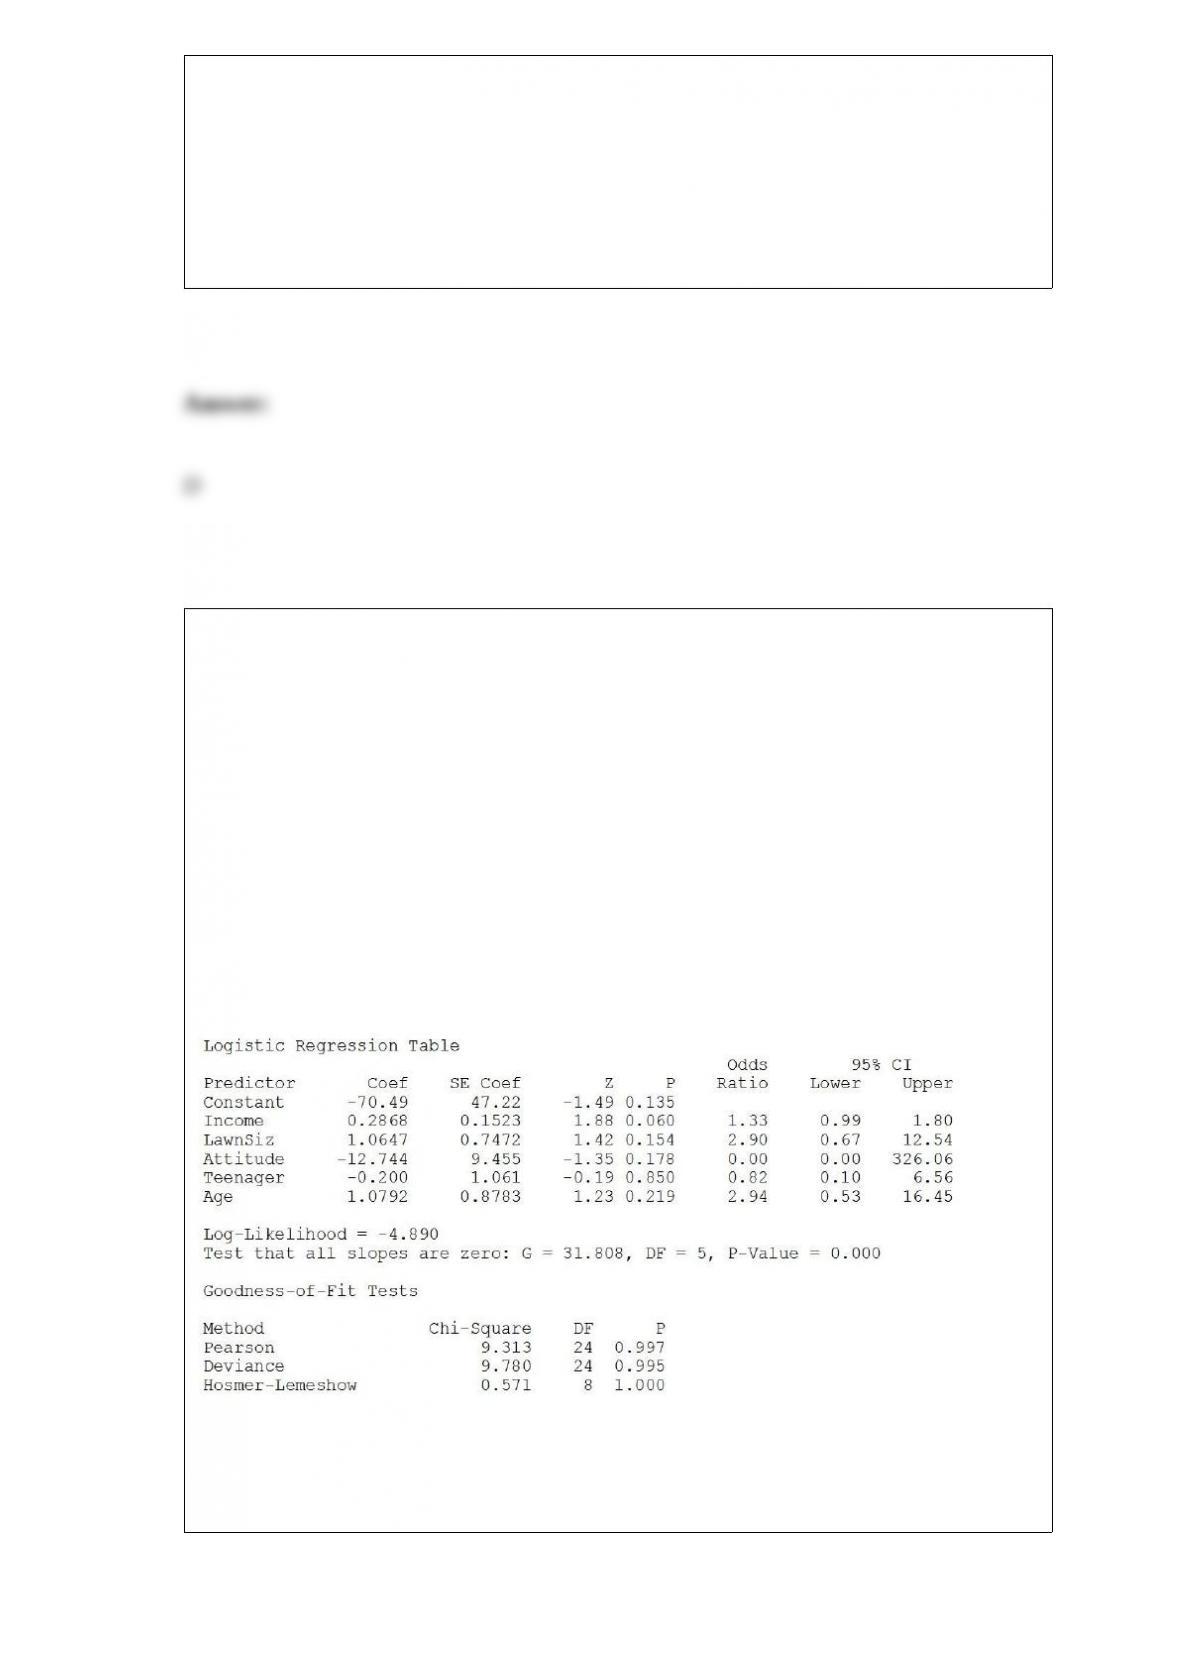
The Minitab output is given below:
Referring to Table 17-12, what is the estimated odds ratio for a 48-year-old home owner
with a family income of $100,000, a lawn size of 5,000 square feet, a negative attitude
toward outdoor recreation, and one teenager in the household?
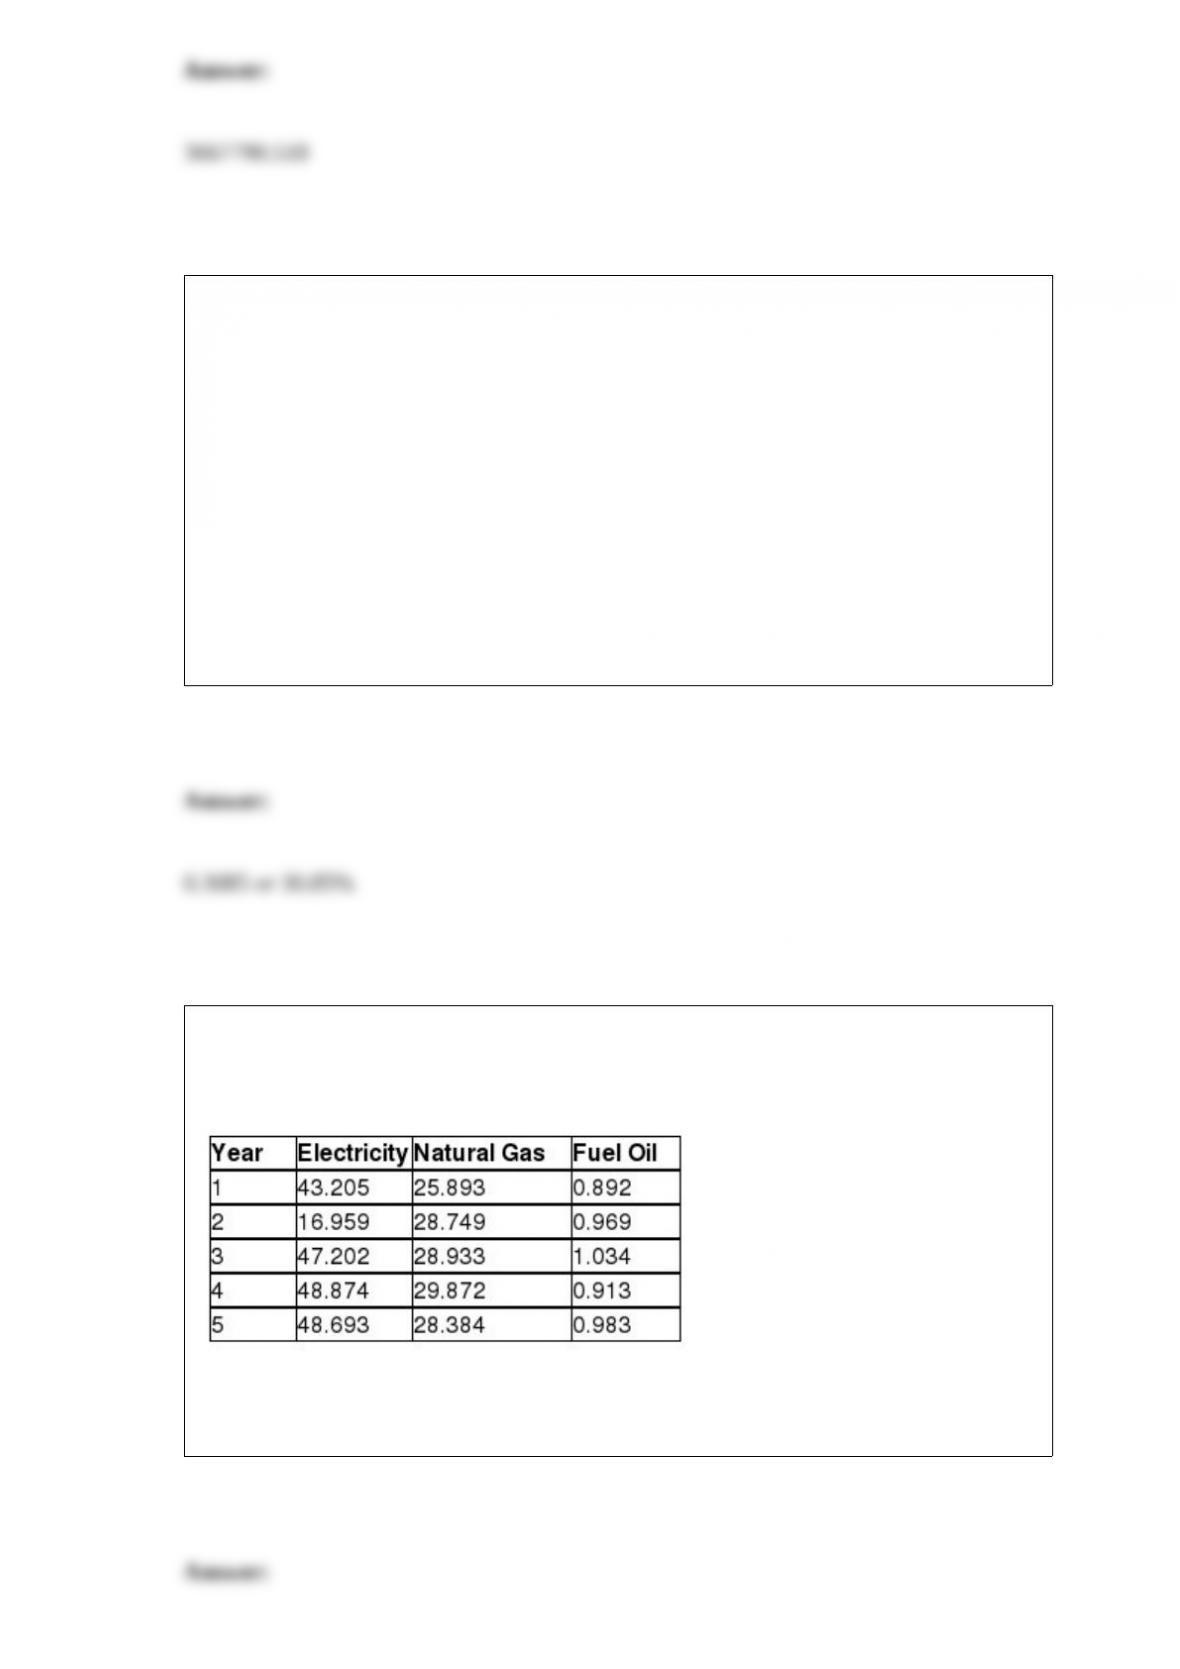
TABLE 6-5
A company producing orange juice buys all of its oranges from a large orange orchard.
The amount of juice that can be squeezed from each of these oranges is approximately
normally distributed with a mean of 4.7 ounces and some unknown standard deviation.
The company’s production manager knows that the probability is 30.85% that a
randomly selected orange will contain less than 4.5 ounces of juice. Also, the
probability is 10.56% that a randomly selected orange will contain more than 5.2
ounces of juice. Answer the following questions without the help of a calculator,
statistical software or statistical table.
Referring to Table 6-5, what is the probability that a randomly selected orange will
contain at least 4.9 ounces of juice?
TABLE 16-15
Given below are the average prices for three types of energy products for five
consecutive years.
Referring to Table 16-15, what is the Paasche price index for the group of three energy
items in year 5 for a family that consumed 13 units of electricity, 26 units of natural gas
and 235 units of fuel oil in year 5 using year 1 as the base year?
The Department of Commerce in a particular state has determined that the number of
small businesses that declare bankruptcy per month is approximately a Poisson
distribution with a mean of 6.4. Find the probability that exactly 5 bankruptcies occur
next month.
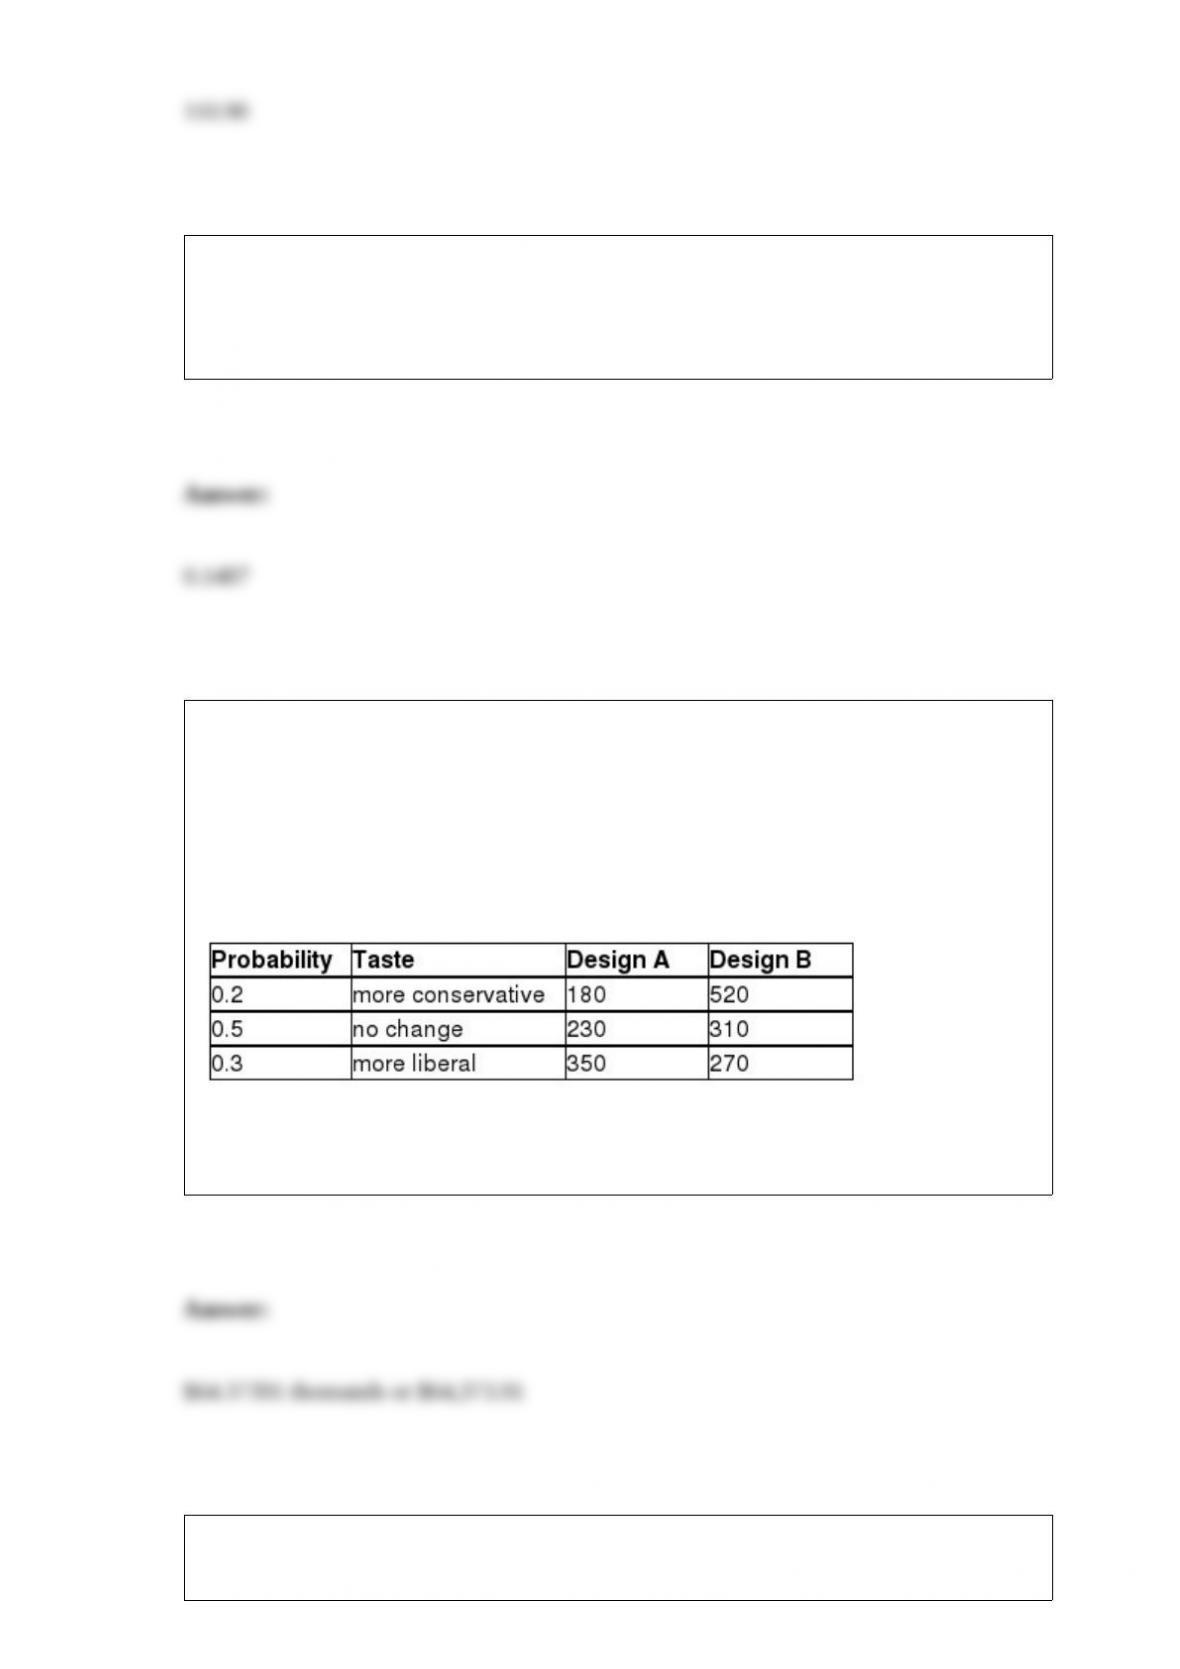
TABLE 5-8
Two different designs on a new line of winter jackets for the coming winter are
available for your manufacturing plants. Your profit (in thousands of dollars) will
depend on the taste of the consumers when winter arrives. The probability of the three
possible different tastes of the consumers and the corresponding profits are presented in
the following table.
Referring to Table 5-8, what is the standard deviation of your profit when Design A is
chosen?
TABLE 8-13

A wealthy real estate investor wants to decide whether it is a good investment to build a
high-end shopping complex in a suburban county in Houston. His main concern is the
total market value of the 3,605 houses in the suburban county. He commissioned a
statistical consulting group to take a sample of 200 houses and obtained a sample mean
market price of $225,000 and a sample standard deviation of $38,700. The consulting
group also found out that the mean differences between market prices and appraised
prices was $125,000 with a standard deviation of $3,400. Also the proportion of houses
in the sample that are appraised for higher than the market prices is 0.24.
Referring to Table 8-13, what will be the 90% confidence interval for the total
difference between the market prices and appraised prices of the houses in the suburban
county constructed by the consulting group?
TABLE 6-2
John has two jobs. For daytime work at a jewelry store he is paid $15,000 per month,
plus a commission. His monthly commission is normally distributed with a mean of
$10,000 and a standard deviation of $2,000. At night he works occasionally as a waiter,
for which his monthly income is normally distributed with a mean of $1,000 and a
standard deviation of $300. John’s income levels from these two sources are
independent of each other.
Referring to Table 6-2, for a given month, what is the probability that John’s income as
a waiter is between $800 and $900?