TABLE 8-17
A random sample of 100 stores from a large chain of 500 garden supply stores was
selected to determine the mean number of lawnmowers sold at an end-of-season
clearance sale. The sample results indicated a mean of 6 and a standard deviation of 2
lawnmowers sold. A 95% confidence interval (5.623 to 6.377) was established based on
these results.
True or False: Referring to Table 8-17, 95% of the stores have sold between 5.623 and
6.377 lawnmowers.
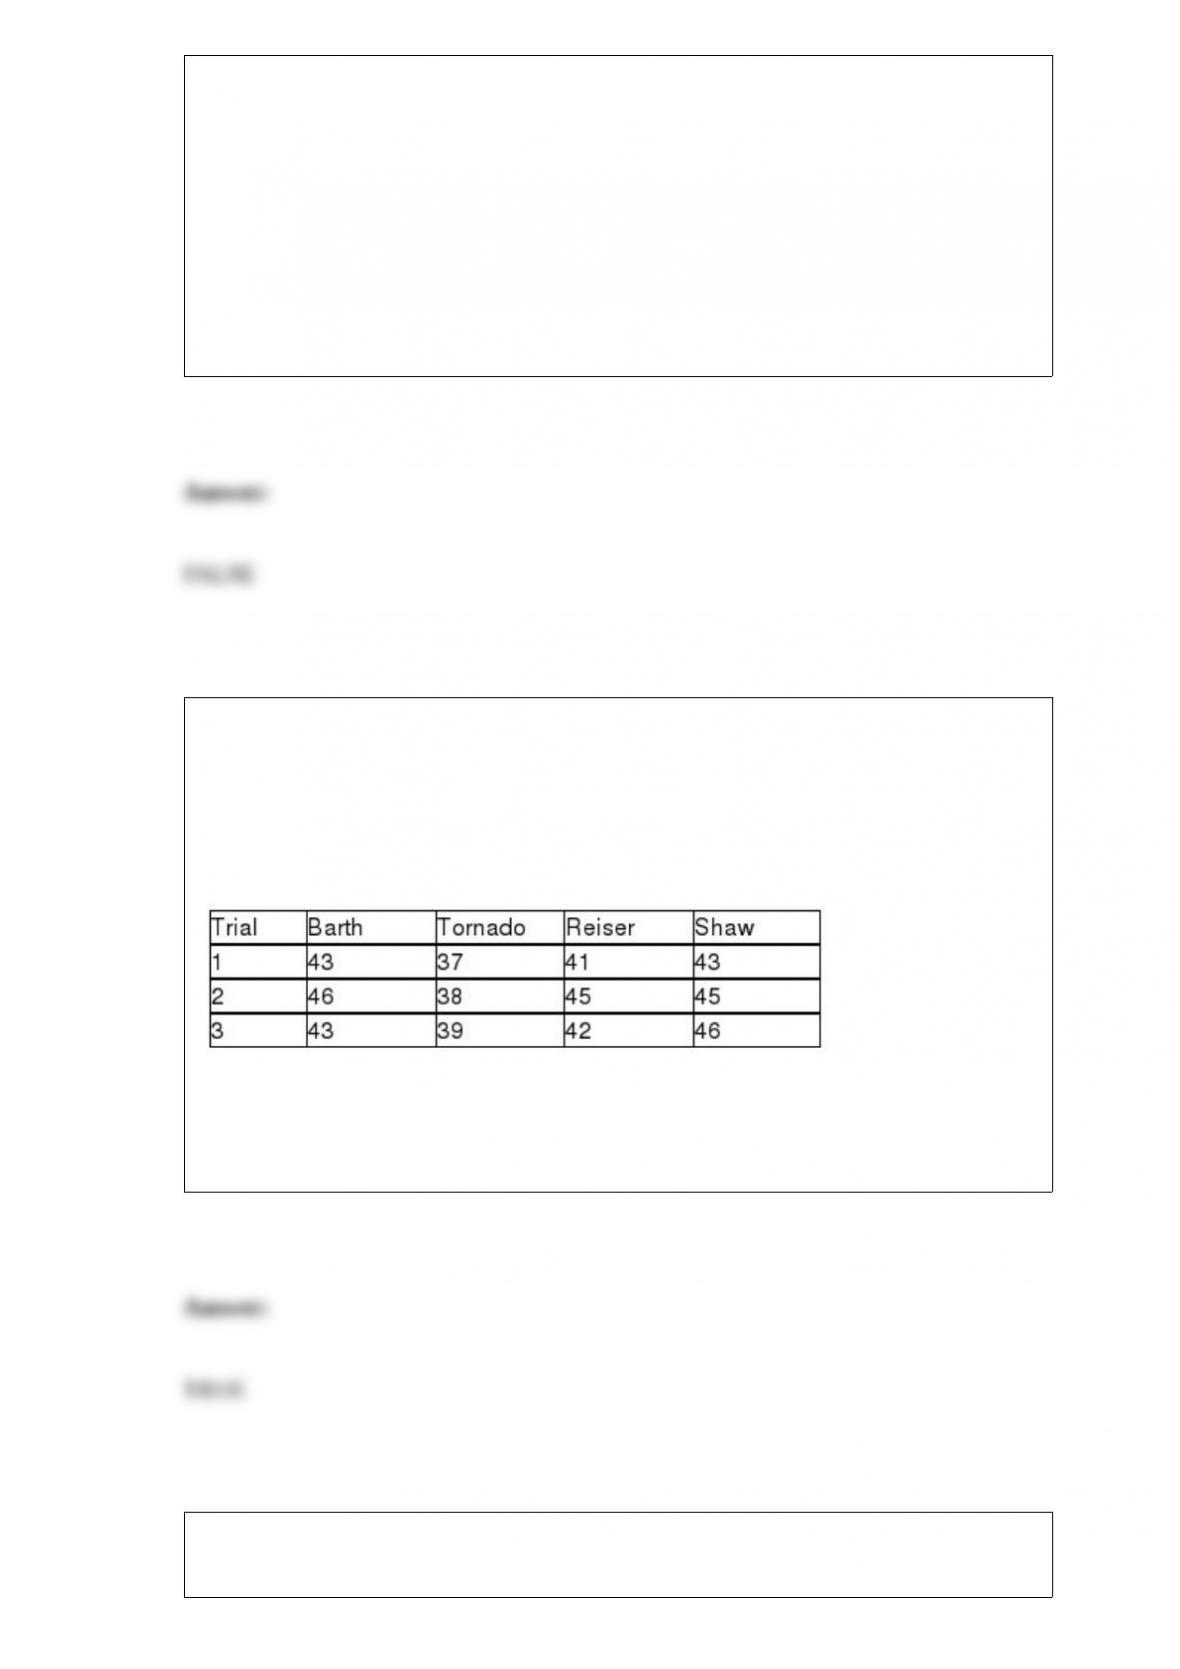
TABLE 11-3
As part of an evaluation program, a sporting goods retailer wanted to compare the
downhill coasting speeds of 4 brands of bicycles. She took 3 of each brand and
determined their maximum downhill speeds. The results are presented in miles per hour
in the table below.
True or False: Referring to Table 11-3, the test is less sensitive to the assumption that
the population of speeds has the same variance for the 4 brands because the sample
sizes of the 4 brands are equal.
True or False: TABLE 17-8
The superintendent of a school district wanted to predict the percentage of students
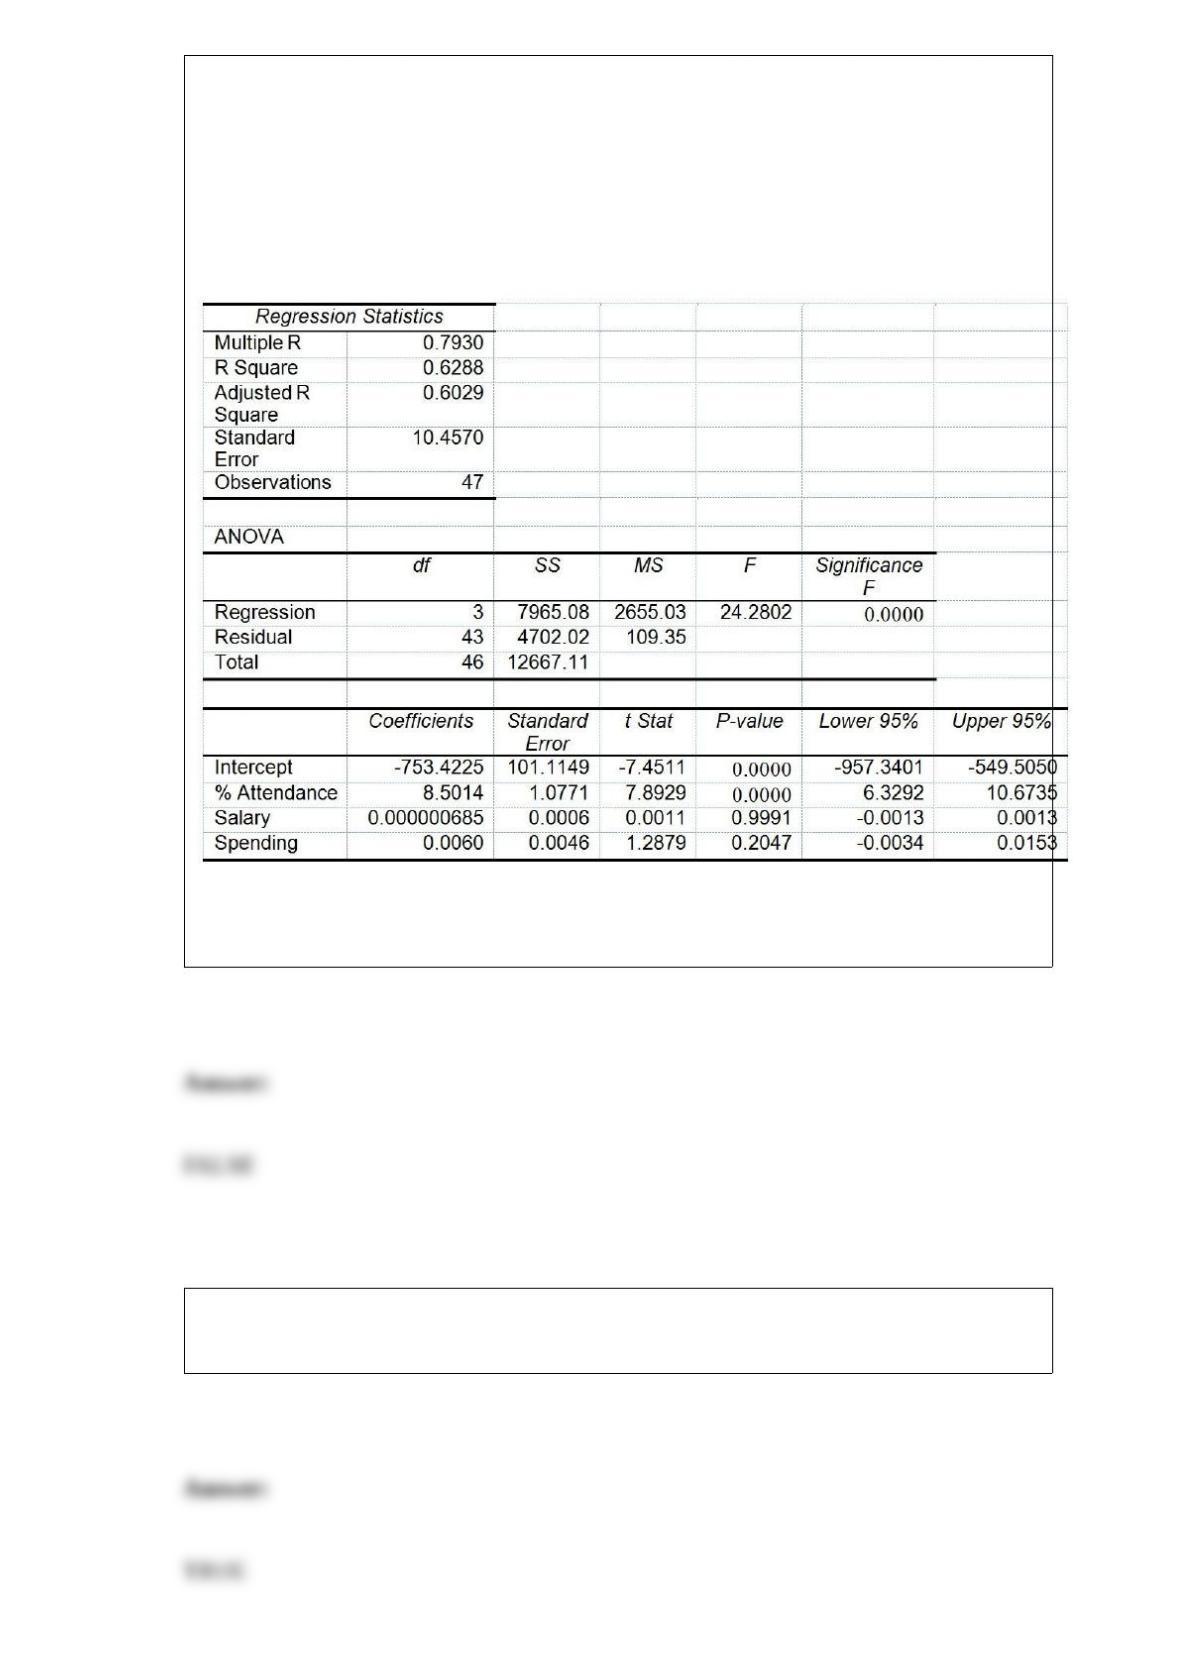
passing a sixth-grade proficiency test. She obtained the data on percentage of students
passing the proficiency test (% Passing), daily mean of the percentage of students
attending class (% Attendance), mean teacher salary in dollars (Salaries), and
instructional spending per pupil in dollars (Spending) of 47 schools in the state.
Following is the multiple regression output with Y = % Passing as the dependent
variable, X1 = % Attendance, X2 = Salaries and X3 = Spending:
Referring to Table 17-8, there is sufficient evidence that all of the explanatory variables
are related to the percentage of students passing the proficiency test at a 5% level of
significance.
True or False: A multidimensional contingency table allows you to tally the responses
of more than two categorical variables.

TABLE 8-11
A poll was conducted by the marketing department of a video game company to
determine the popularity of a new game that was targeted to be launched in three
months. Telephone interviews with 1,500 young adults were conducted which revealed
that 49% said they would purchase the new game. The margin of error was 3
percentage points.
True or False: Referring to Table 8-11, the standard error is 3%.
TABLE 8-5
A sample of salary offers (in thousands of dollars) given to management majors is: 48,
51, 46, 52, 47, 48, 47, 50, 51, and 59. Using this data to obtain a 95% confidence
interval resulted in an interval from 47.19 to 52.61.
True or False: Referring to Table 8-5, 95% of the salary offers are between 47.19 and
52.61.
True or False: A survey was conducted to determine how people rated the quality of
programming available on television. Respondents were asked to rate the overall
quality from 0 (no quality at all) to 100 (extremely good quality). A cumulative
percentage polygon (ogive) can be used to present this information.
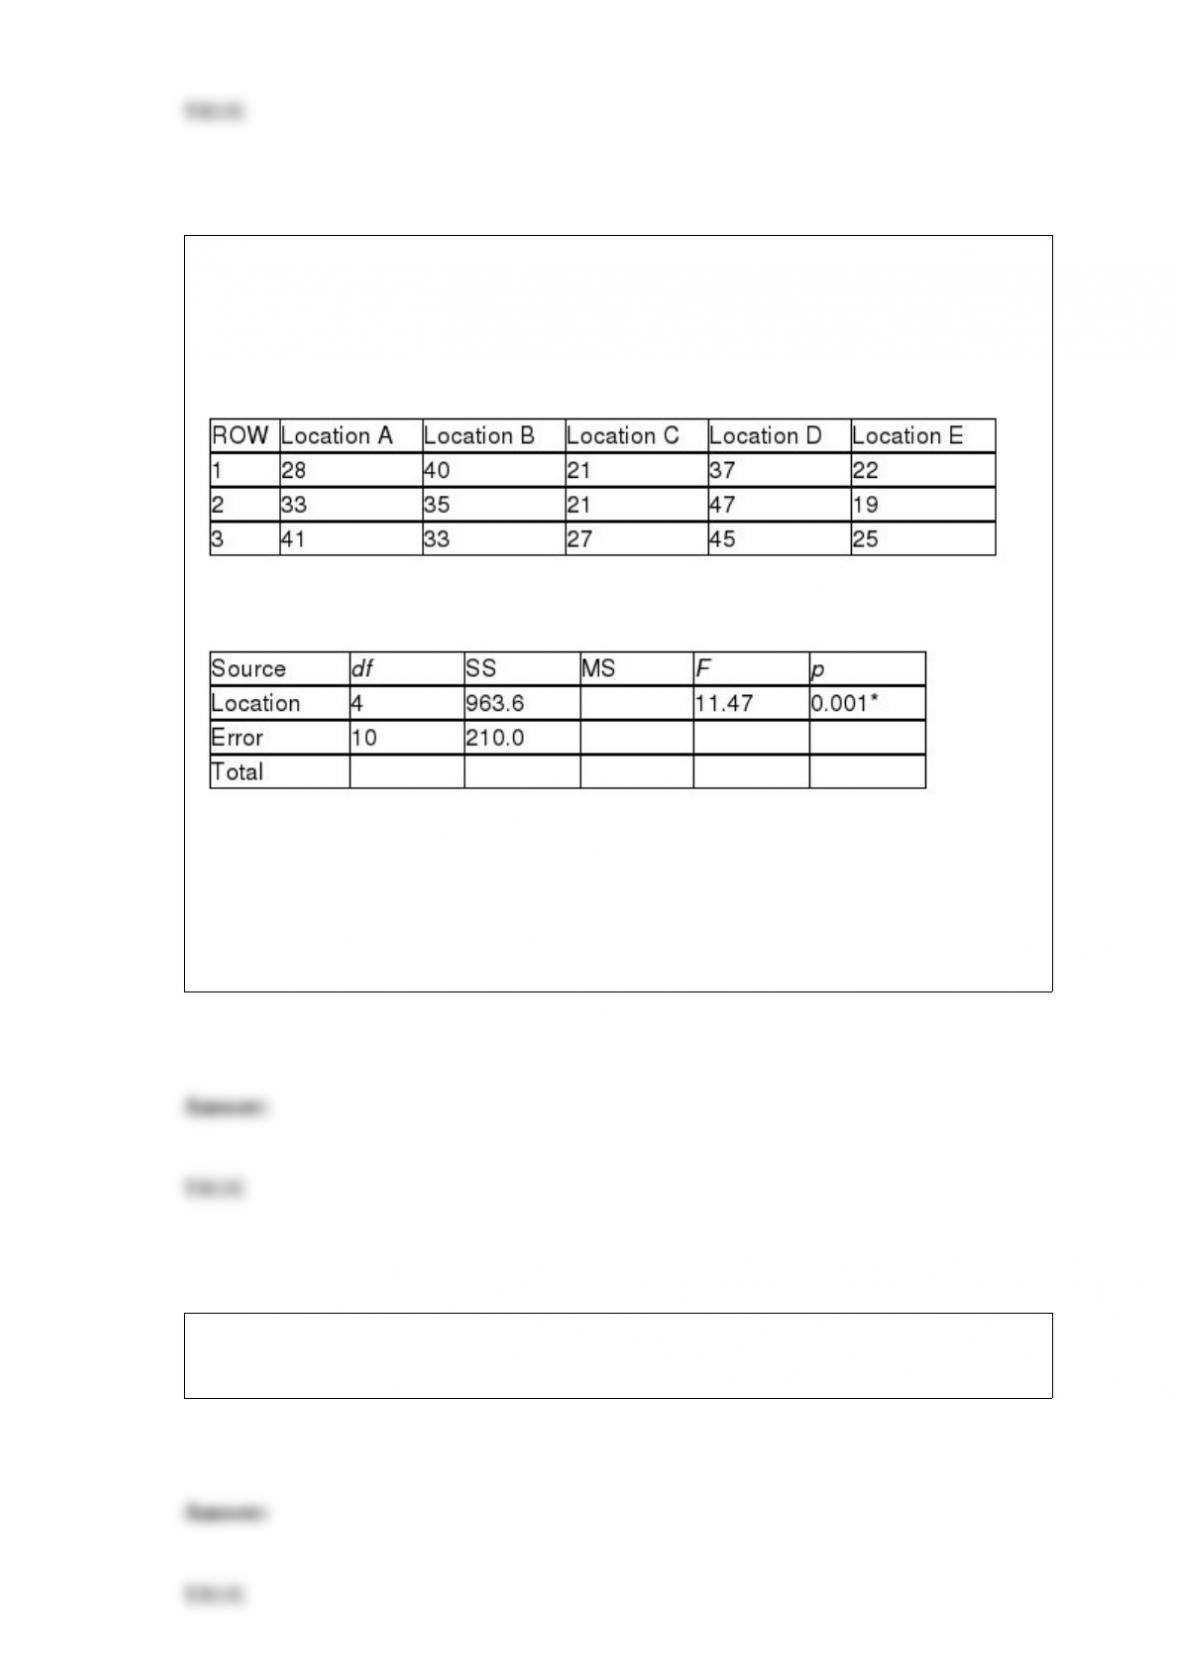
TABLE 11-5
A hotel chain has identically small sized resorts in 5 locations in different small islands.
The data that follow resulted from analyzing the hotel occupancies on randomly
selected days in the 5 locations.
Analysis of Variance
* or p < 0.005, tabular value
True or False: Referring to Table 11-5, if a level of significance of 0.05 is chosen, the
decision made indicates that at least 2 of the 5 locations have different mean occupancy
rates.
True or False: The answer to the question “How do you rate the quality of your business
statistics course?” is an example of an ordinal scaled variable.
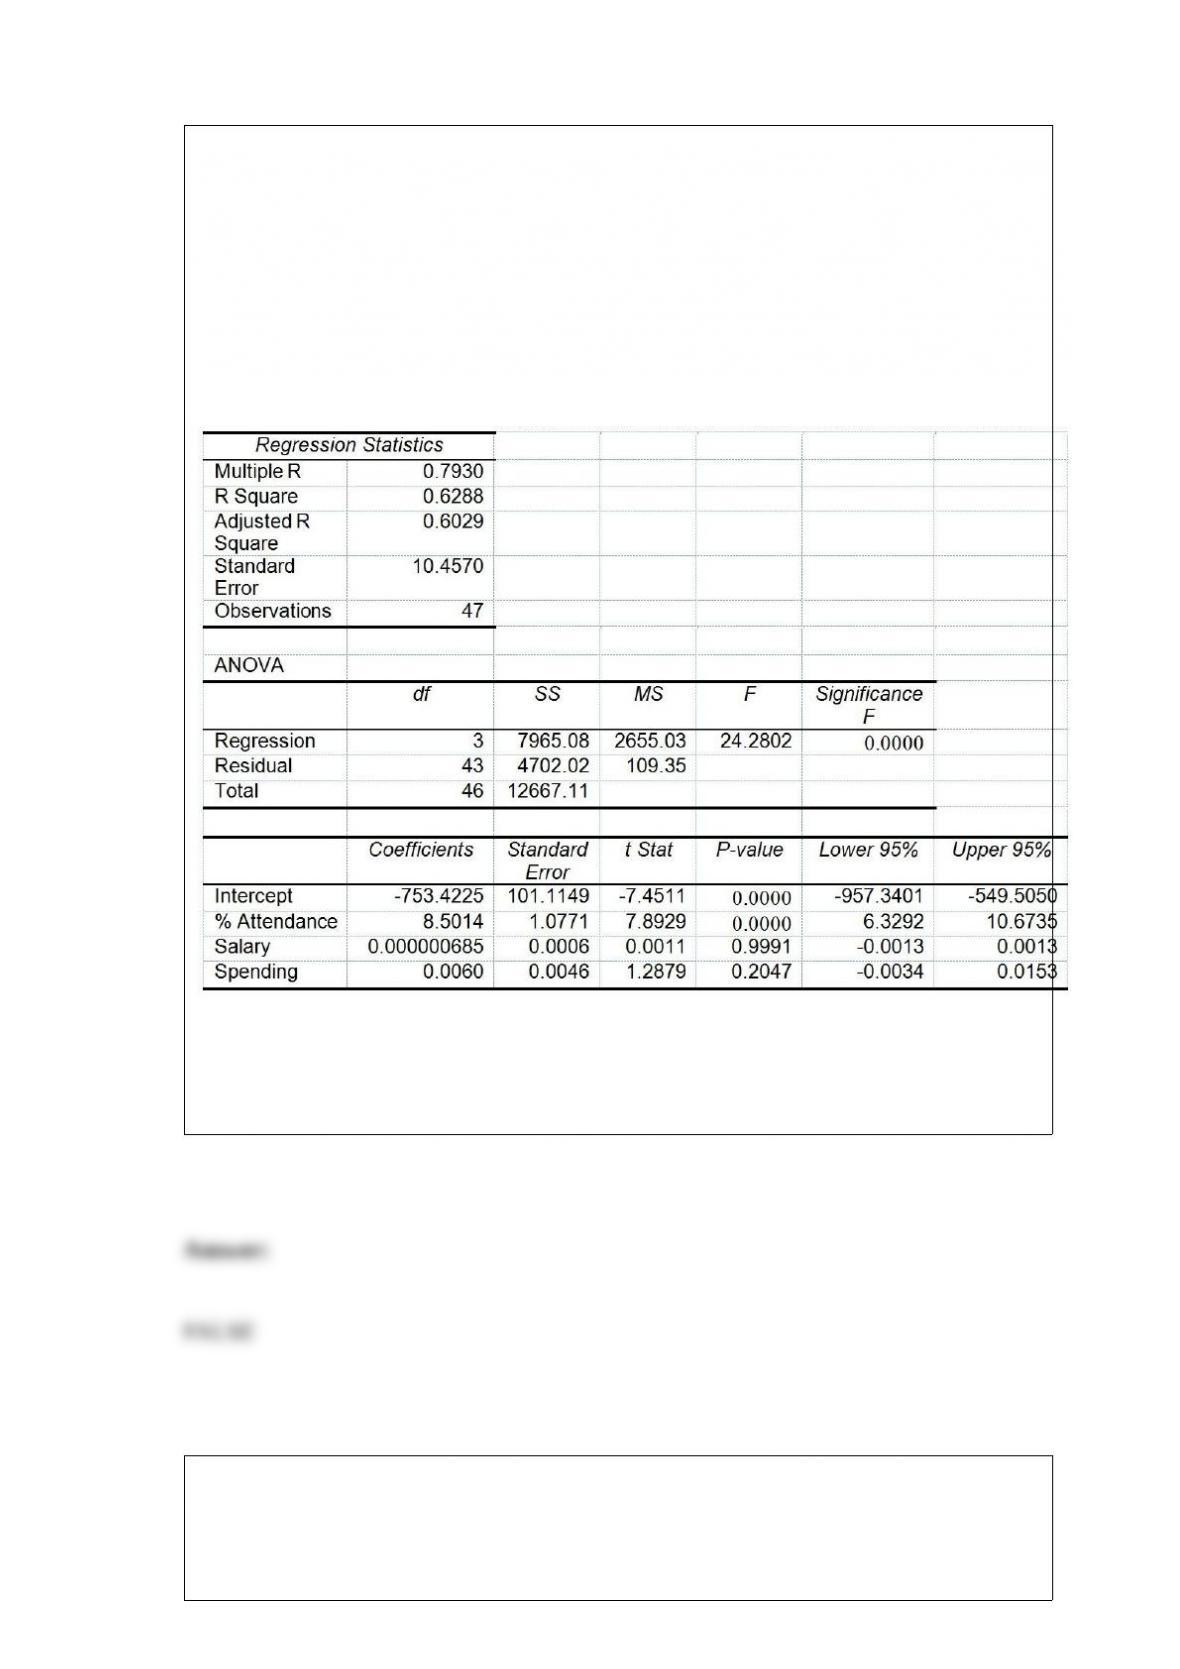
True or False: TABLE 17-8
The superintendent of a school district wanted to predict the percentage of students
passing a sixth-grade proficiency test. She obtained the data on percentage of students
passing the proficiency test (% Passing), daily mean of the percentage of students
attending class (% Attendance), mean teacher salary in dollars (Salaries), and
instructional spending per pupil in dollars (Spending) of 47 schools in the state.
Following is the multiple regression output with Y = % Passing as the dependent
variable, X1 = % Attendance, X2 = Salaries and X3 = Spending:
Referring to Table 17-8, you can conclude that the average teacher salary individually
has no impact on the mean percentage of students passing the proficiency test, taking
into account the effect of all the other independent variables, at a 10% level of
significance based solely on the 95% confidence interval estimate for β2.
A probability distribution is an equation that
A) associates a particular probability of occurrence with each outcome.
B) measures outcomes and assigns values of X to the simple events.
C) assigns a value to the variability of the set of events.
D) assigns a value to the center of the set of events.
The Cp statistic is used
A) to determine if there is a problem of collinearity.
B) if the variances of the error terms are all the same in a regression model.
C) to choose the best model.
D) to determine if there is an irregular component in a time series.
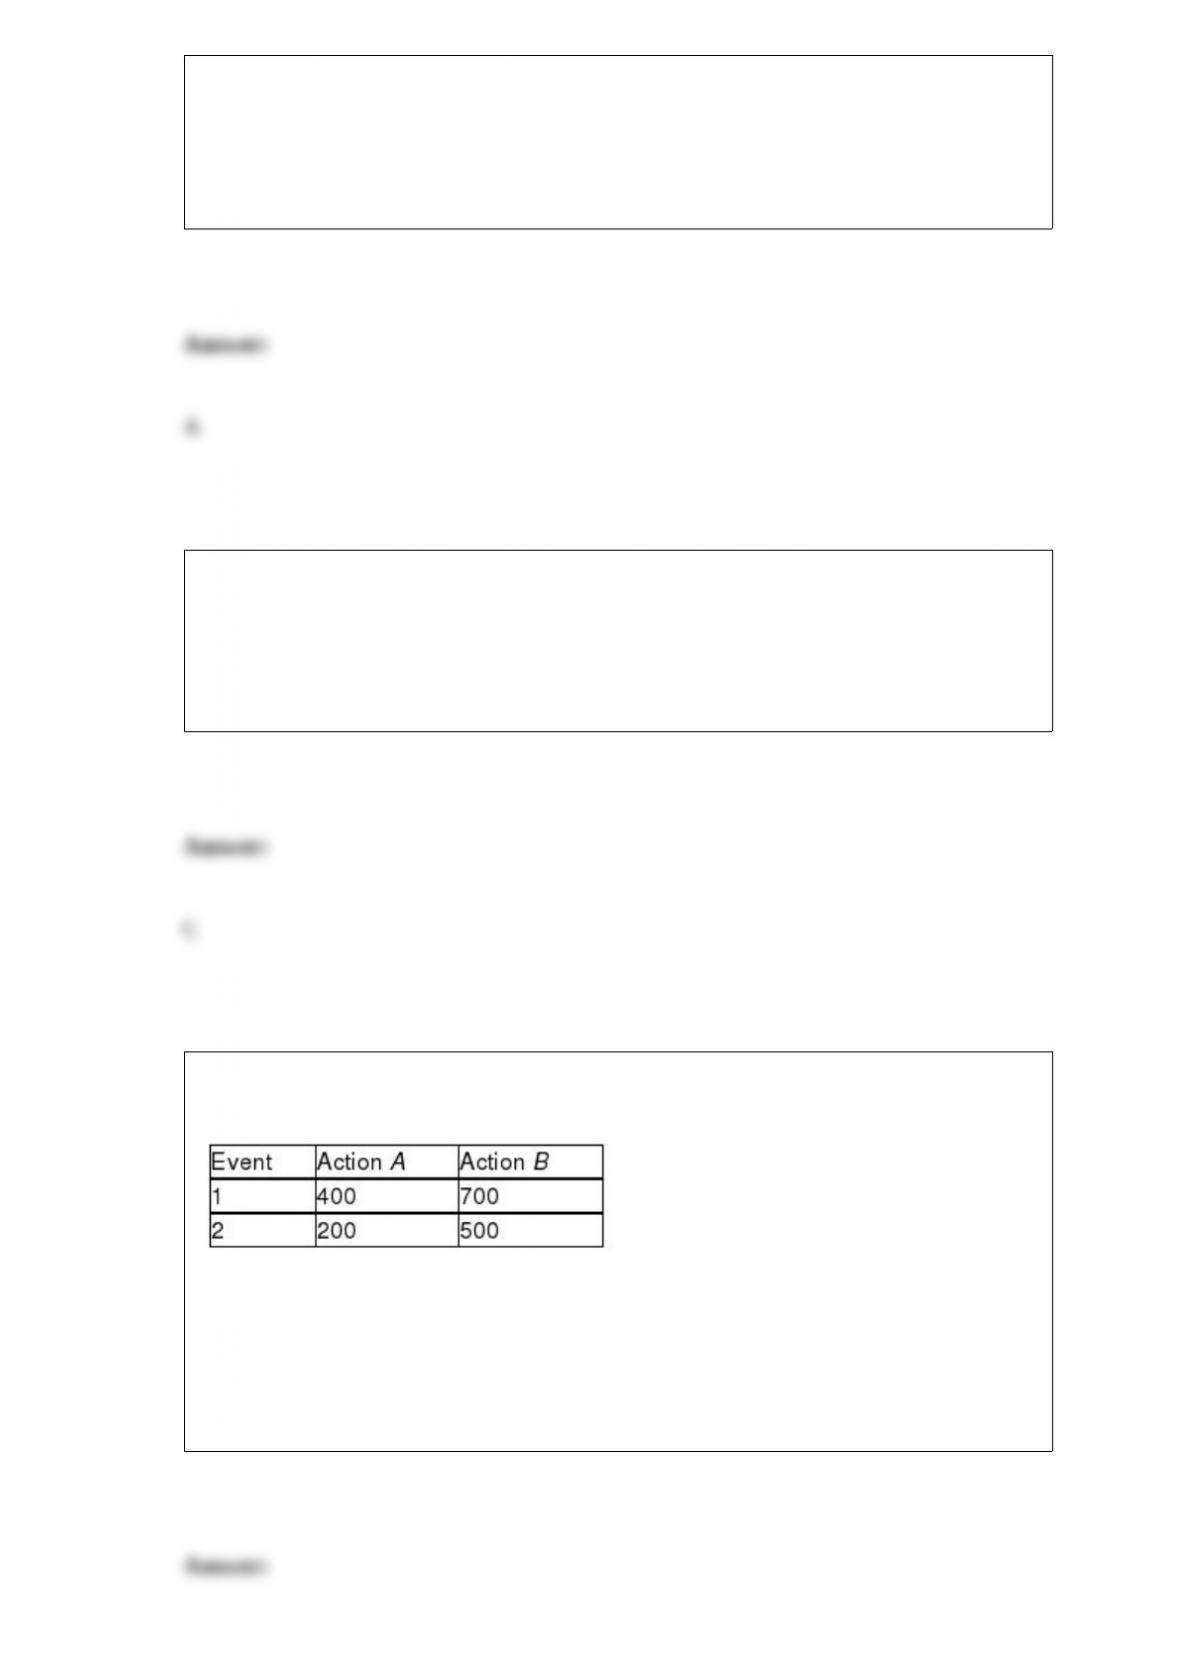
TABLE 19-2
The following payoff matrix is given in dollars.
Suppose the probability of Event 1 is 0.5 and Event 2 is 0.5.
Referring to Table 19-2, what is the best action using the maximin criterion?
A) Action A
B) Action B
C) Either Action A or Action B
D) It cannot be determined.
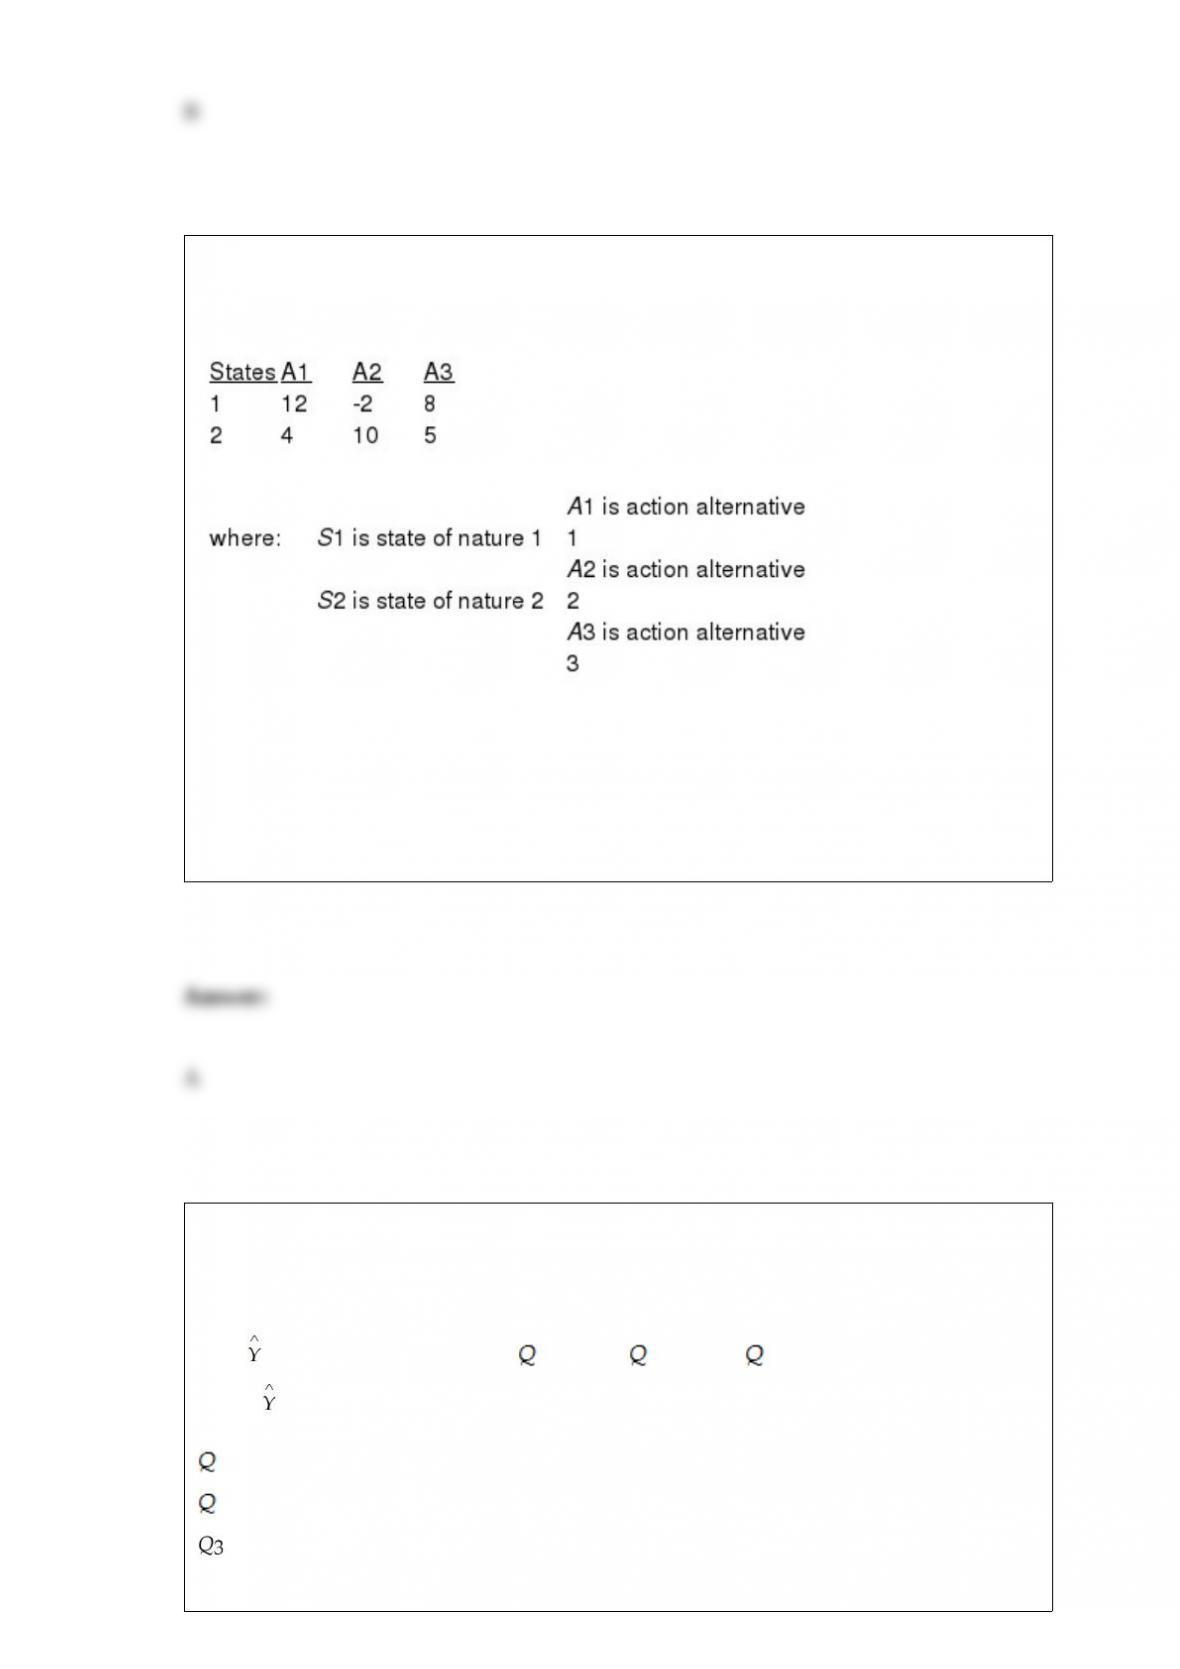
TABLE 19-1
The following payoff table shows profits associated with a set of 3 alternatives under 2
possible states of nature
Referring to Table 19-1, if the probability of S1 is 0.5, then the expected opportunity
loss (EOL) for A1 is
A) 3.
B) 4.5.
C) 7.
D) 8.
TABLE 16-12
A local store developed a multiplicative time-series model to forecast its revenues in
future quarters, using quarterly data on its revenues during the 5-year period from 2008
to 2012. The following is the resulting regression equation:
log10 = 6.102 + 0.012 X – 0.129 1 – 0.054 2 + 0.098 3
where is the estimated number of contracts in a quarter
X is the coded quarterly value with X = 0 in the first quarter of 2008
1 is a dummy variable equal to 1 in the first quarter of a year and 0 otherwise
2 is a dummy variable equal to 1 in the second quarter of a year and 0 otherwise
is a dummy variable equal to 1 in the third quarter of a year and 0 otherwise
Referring to Table 16-12, in testing the significance of the coefficient of X in the
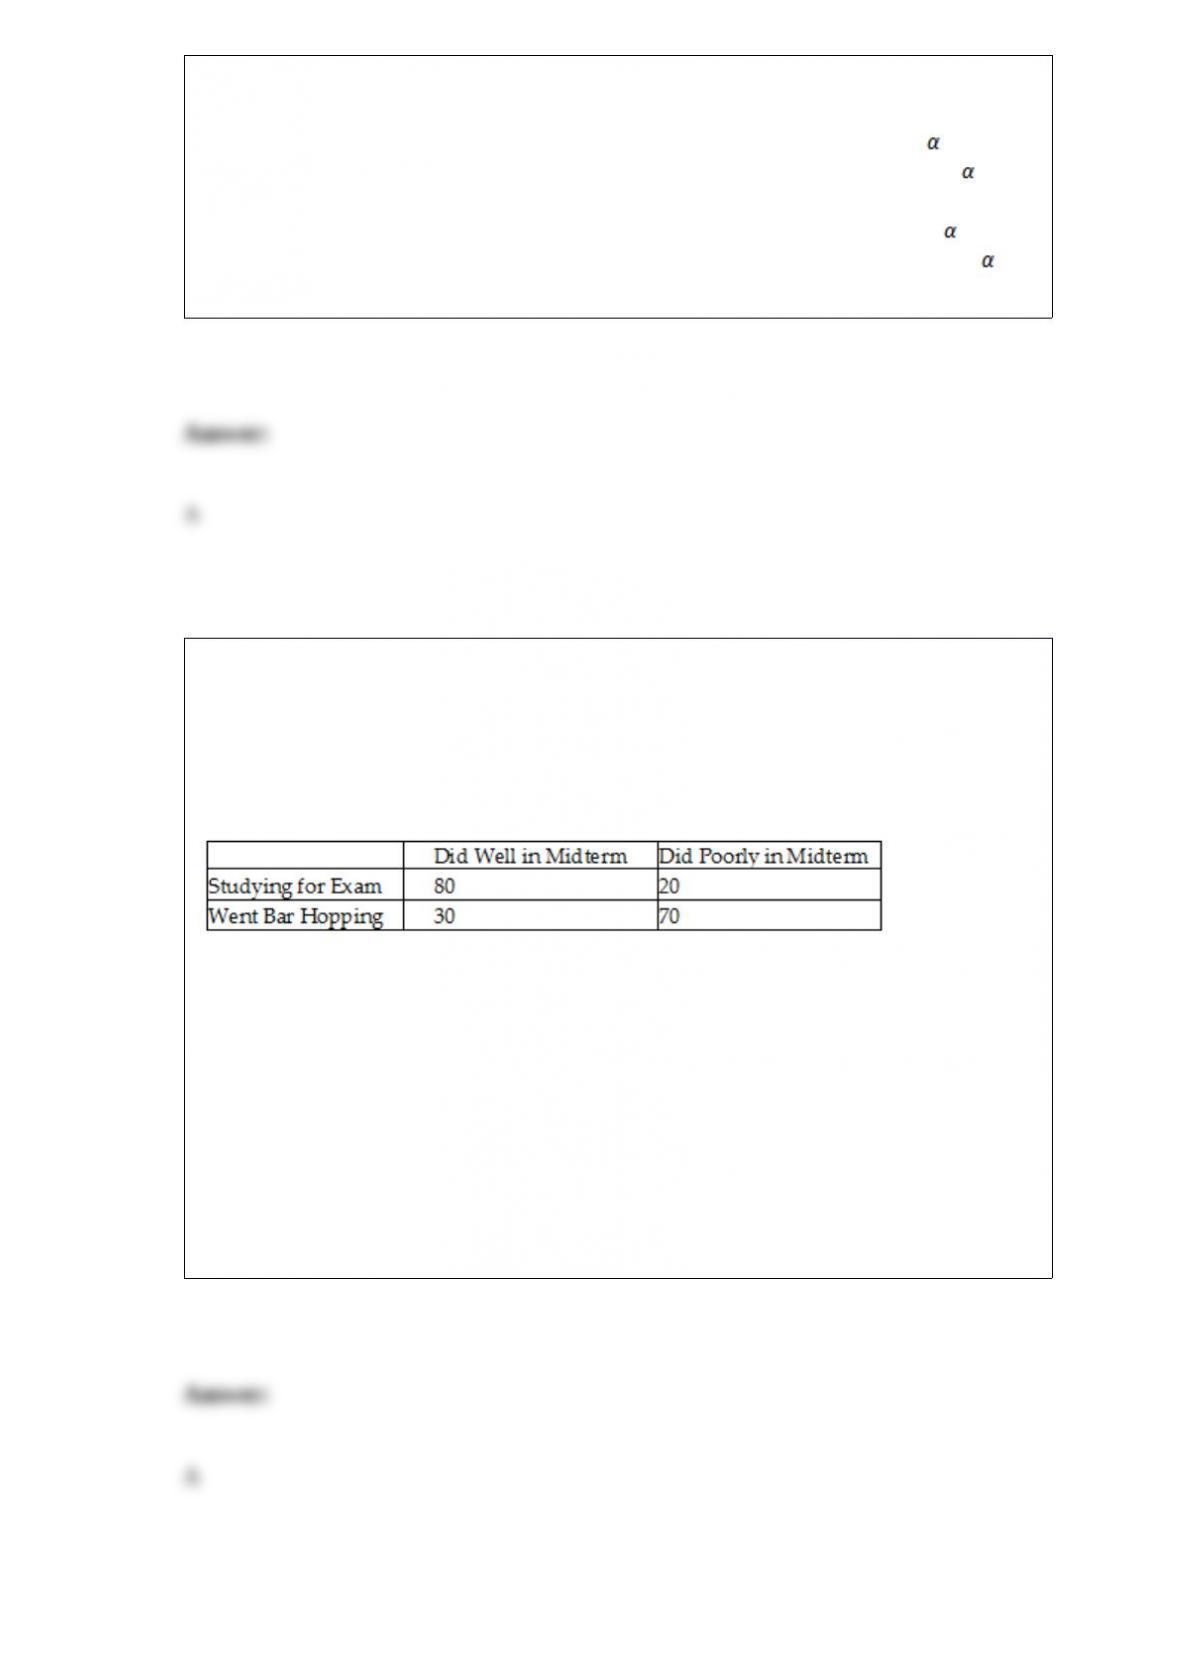
regression equation (0.012) which has a p-value of 0.0000. Which of the following is
the best interpretation of this result?
A) The quarterly growth rate in revenues is significantly different from 0% ( = 0.05).
B) The quarterly growth rate in revenues is not significantly different from 0% ( =
0.05).
C) The quarterly growth rate in revenues is significantly different from 1.2% ( = 0.05).
D) The quarterly growth rate in revenues is not significantly different from 1.2% ( =
0.05).
TABLE 2-6
A sample of 200 students at a Big-Ten university was taken after the midterm to ask
them whether they went bar hopping the weekend before the midterm or spent the
weekend studying, and whether they did well or poorly on the midterm. The following
table contains the result.
Referring to Table 2-6, ________ percent of the students in the sample spent the
weekend studying and did well on the midterm.
A) 40
B) 50
C) 72.72
D) 80
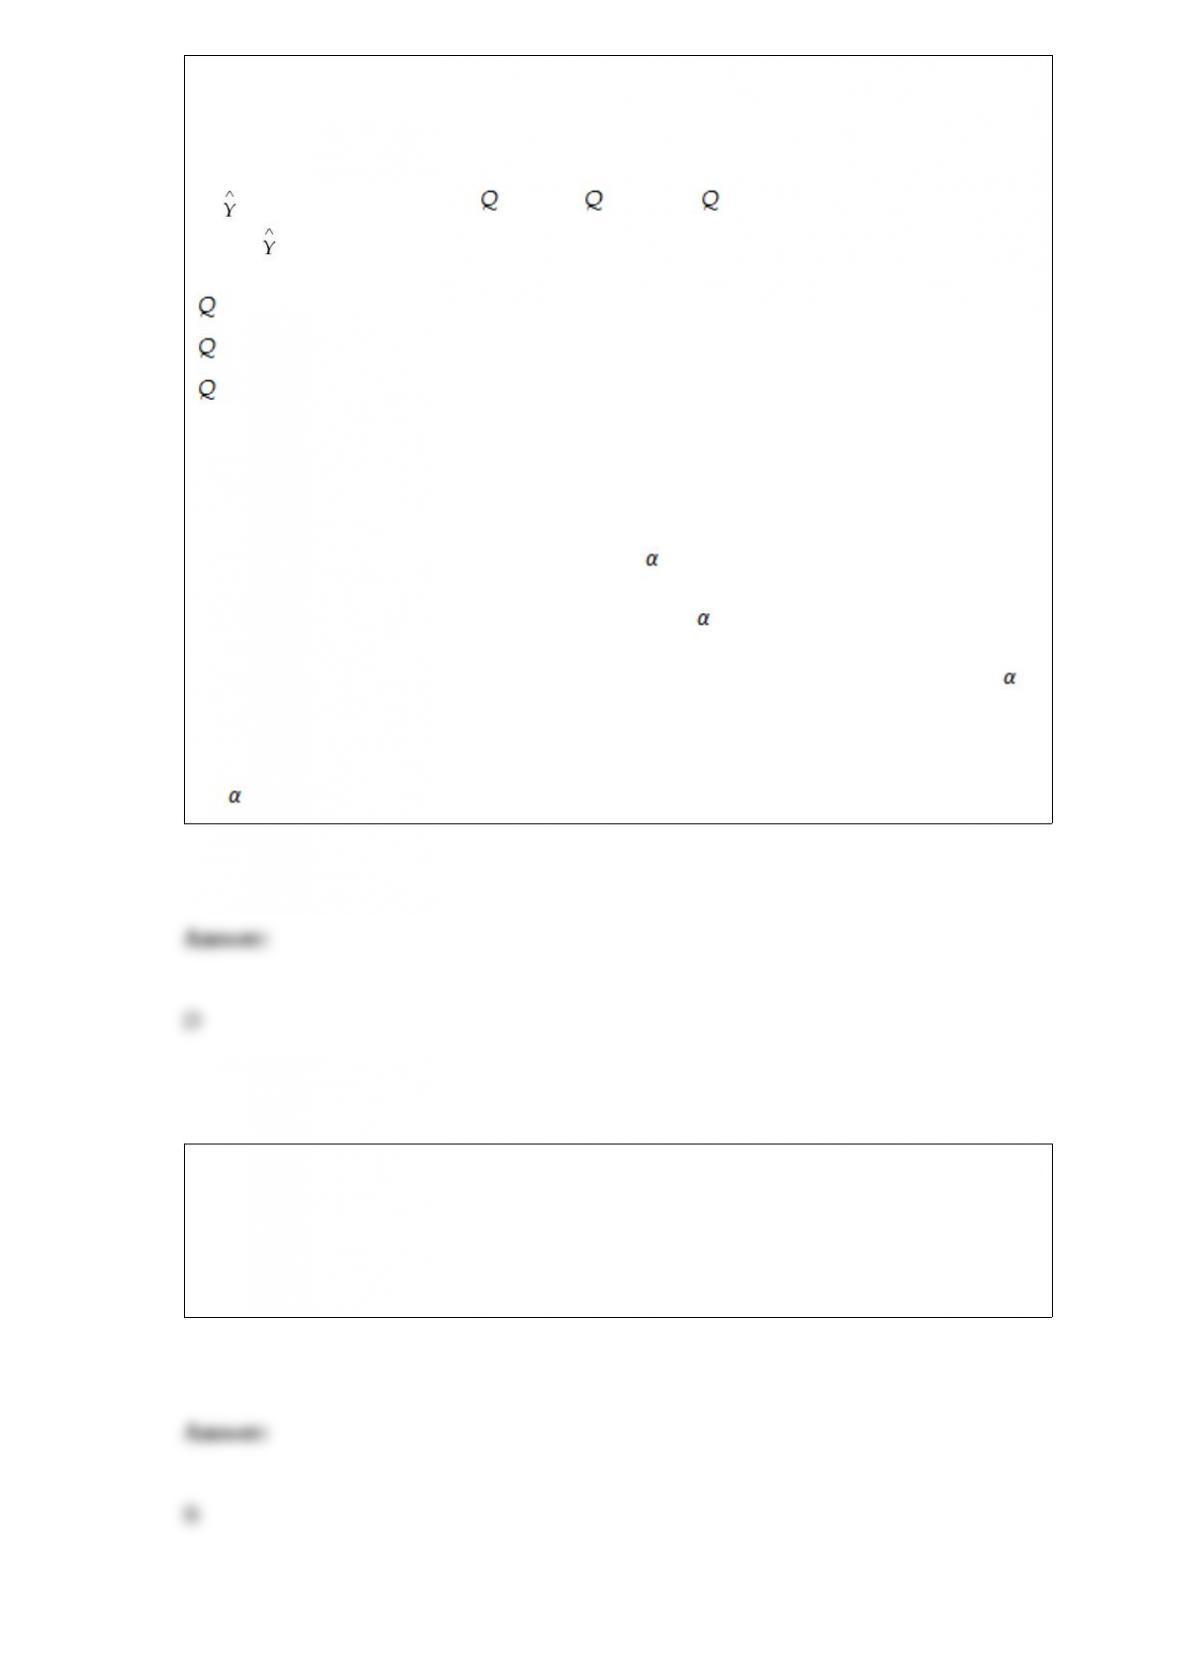
TABLE 16-14
A contractor developed a multiplicative time-series model to forecast the number of
contracts in future quarters, using quarterly data on number of contracts during the
3-year period from 2010 to 2012. The following is the resulting regression equation:
ln = 3.37 + 0.117 X – 0.083 1 + 1.28 2 + 0.617 3
where is the estimated number of contracts in a quarter
X is the coded quarterly value with X = 0 in the first quarter of 2010
1 is a dummy variable equal to 1 in the first quarter of a year and 0 otherwise
2 is a dummy variable equal to 1 in the second quarter of a year and 0 otherwise
3 is a dummy variable equal to 1 in the third quarter of a year and 0 otherwise
Referring to Table 16-14, in testing the coefficient for Q1 in the regression equation
(-0.083), the results were a t-statistic of -0.66 and an associated p-value of 0.530. Which
of the following is the best interpretation of this result?
A) The number of contracts in the first quarter of the year is significantly different from
the number of contracts in an average quarter ( = 0.05).
B) The number of contracts in the first quarter of the year is not significantly different
from the number of contracts in an average quarter ( = 0.05).
C) The number of contracts in the first quarter of the year is significantly different from
the number of contracts in the fourth quarter for a given coded quarterly value of X (
= 0.05).
D) The number of contracts in the first quarter of the year is not significantly different
from the number of contracts in the fourth quarter for a given coded quarterly value of
X ( = 0.05).
The cyclical component of a time series
A) represents periodic fluctuations which reoccur within 1 year.
B) represents periodic fluctuations which usually occur in 2 or more years.
C) is obtained by adjusting for the seasonal variation.
D) is obtained by adjusting for calendar variation.

When determining the sample size necessary for estimating the true population mean,
which factor is not considered when sampling with replacement?
A) the population size
B) the population standard deviation
C) the level of confidence desired in the estimate
D) the allowable or tolerable sampling error
You need to decide whether you should invest in a particular stock. You would like to
invest if the price is likely to rise in the long run. You have data on the daily mean price
of this stock over the past 12 months. Your best action is to
A) compute moving averages.
B) perform exponential smoothing.
C) estimate a least square trend model.
D) compute the MAD statistic.
TABLE 13-6
The following Excel tables are obtained when “Score received on an exam (measured in
percentage points)” (Y) is regressed on “percentage attendance” (X) for 22 students in a
Statistics for Business and Economics course.
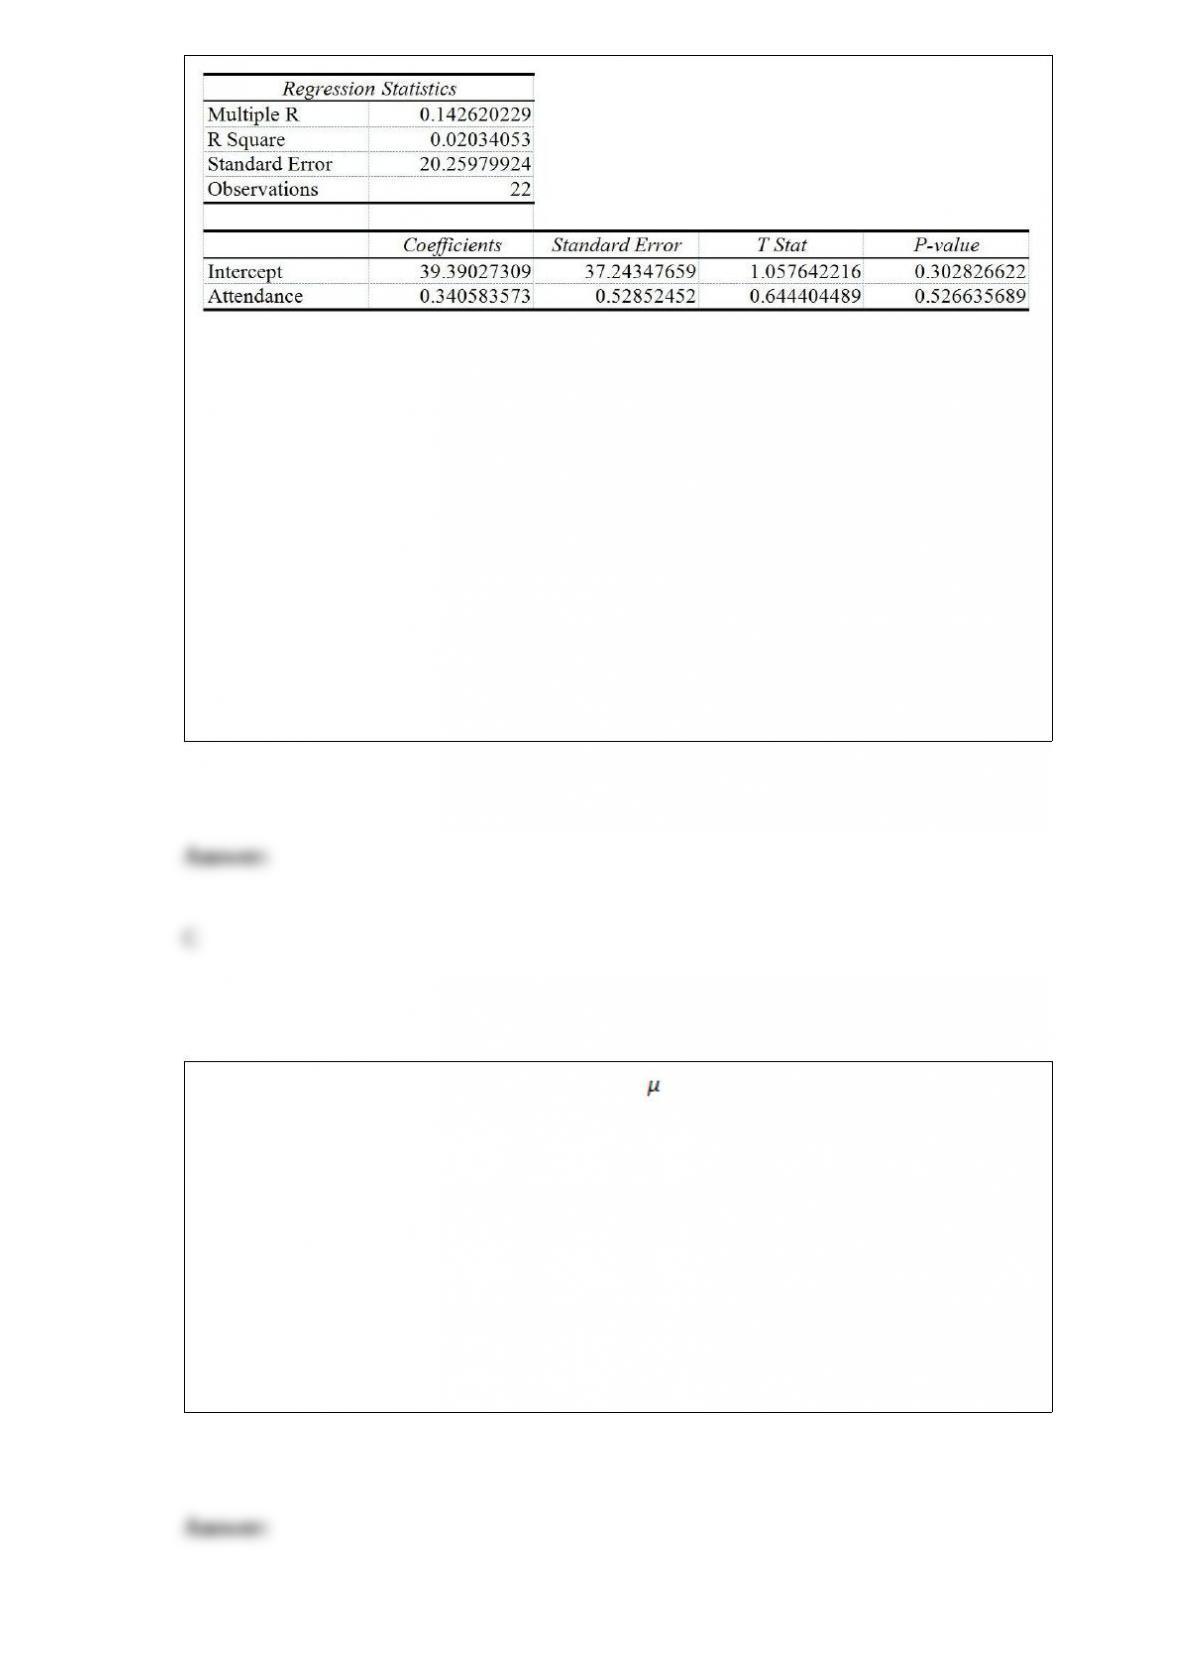
Referring to Table 13-6, which of the following statements is true?
A) If attendance increases by 0.341%, the estimated mean score received will increase
by 1 percentage point.
B) If attendance increases by 1%, the estimated mean score received will increase by
39.39 percentage points.
C) If attendance increases by 1%, the estimated mean score received will increase by
0.341 percentage points.
D) If the score received increases by 39.39%, the estimated mean attendance will go up
by 1%.
If we are performing a two-tail test of whether = 100, the probability of detecting a
shift of the mean to 105 will be ________ the probability of detecting a shift of the
mean to 110.
A) less than
B) greater than
C) equal to
D) not comparable to
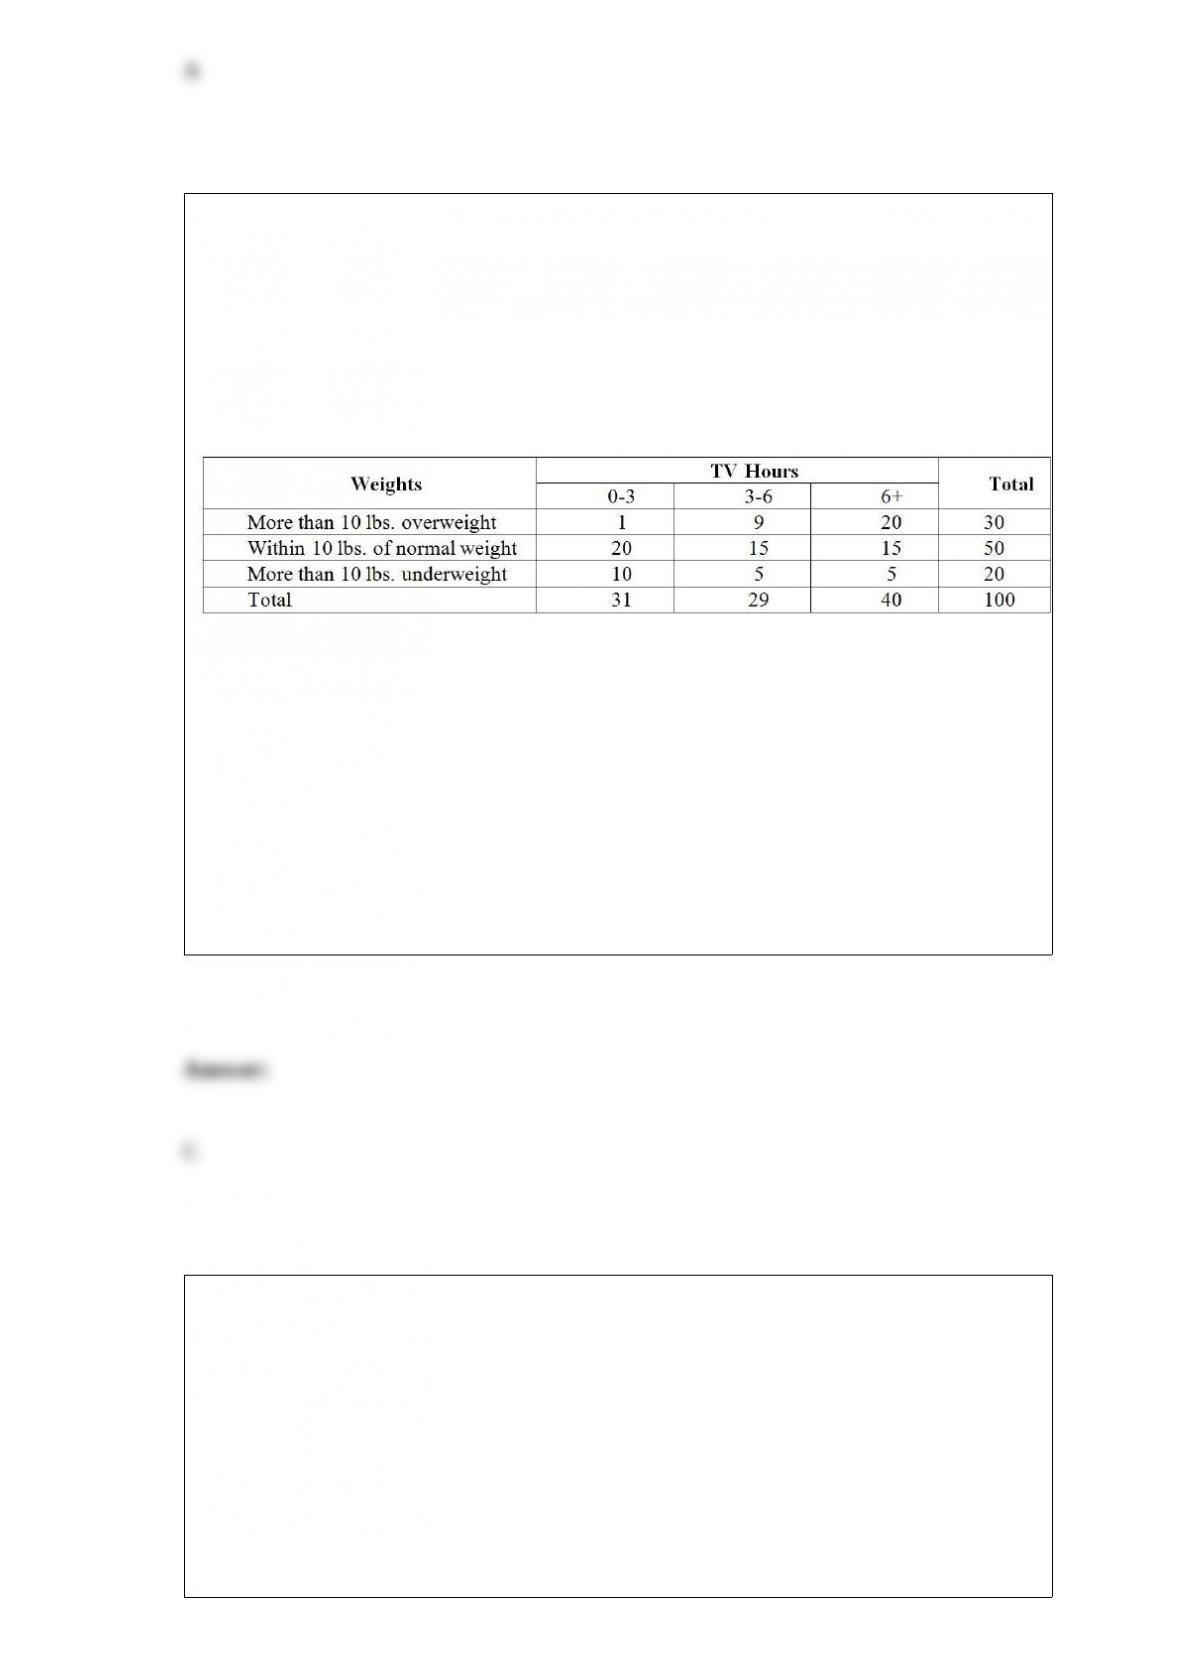
TABLE 12-13
Recent studies have found that American children are more obese than in the past. The
amount of time children spent watching television has received much of the blame. A
survey of 100 ten-year-olds revealed the following with regards to weights and average
number of hours a day spent watching television. We are interested in testing whether
the mean number of hours spent watching TV and weights are independent at 1% level
of significance.
Referring to Table 12-13, how many children in the survey spend more than 6 hours
watching TV and are more than 10 lbs. overweight?
A) 1
B) 9
C) 20
D) 40
If events A and B are mutually exclusive and collectively exhaustive, what is the
probability that event A occurs?
A) 0
B) 0.50
C) 1.00
D) Cannot be determined from the information given.
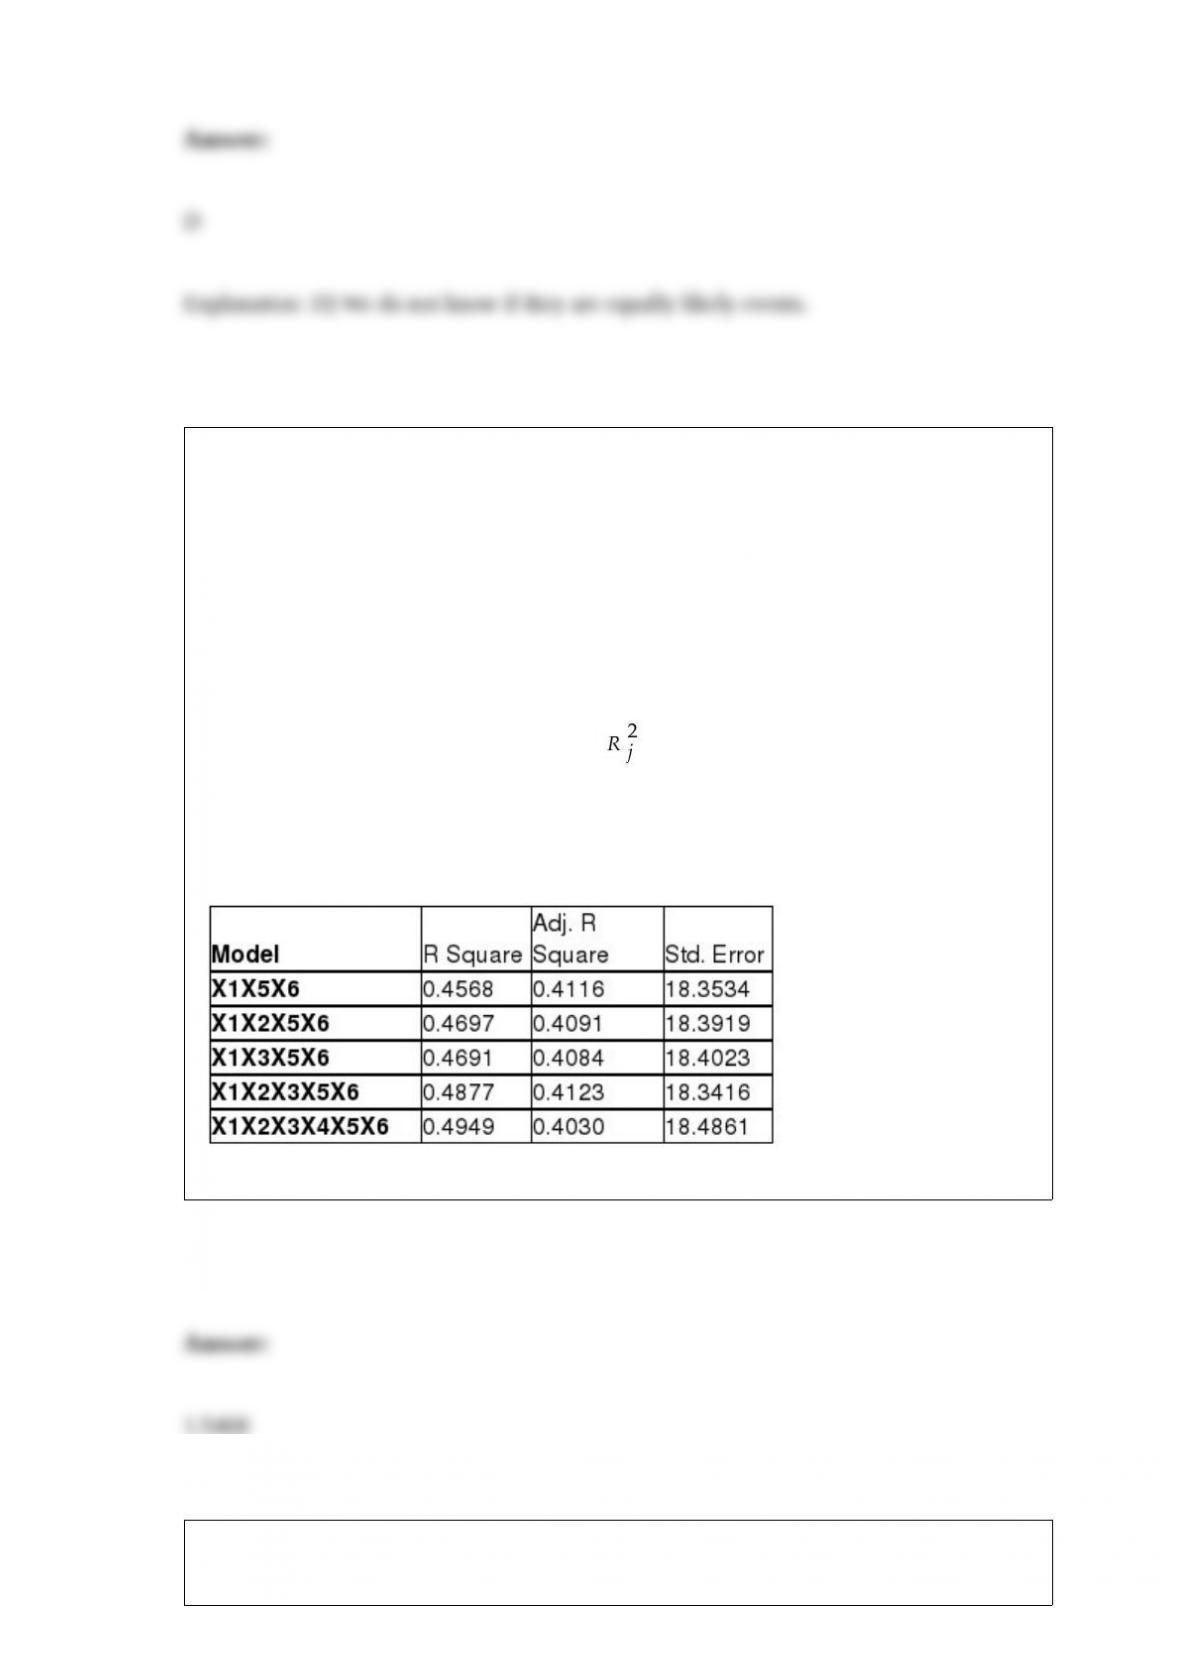
TABLE 15-6
Given below are results from the regression analysis on 40 observations where the
dependent variable is the number of weeks a worker is unemployed due to a layoff (Y)
and the independent variables are the age of the worker (X1), the number of years of
education received (X2), the number of years at the previous job (X3), a dummy variable
for marital status (X4: 1 = married, 0 = otherwise), a dummy variable for head of
household (X5: 1 = yes, 0 = no) and a dummy variable for management position (X6: 1
= yes, 0 = no).
The coefficient of multiple determination ( ) for the regression model using each of
the 6 variables Xj as the dependent variable and all other X variables as independent
variables are, respectively, 0.2628, 0.1240, 0.2404, 0.3510, 0.3342 and 0.0993.
The partial results from best-subset regression are given below:
Referring to Table 15-6, what is the value of the variance inflationary factor of Married?
TABLE 3-4
The ordered array below represents the number of cargo manifests approved by customs
inspectors of the Port of New York in a sample of 35 days:
16, 17, 18, 18, 19, 20, 20, 21, 21, 21, 22, 22, 22, 22, 23, 23, 23, 23, 24, 24, 24, 25, 25,
26, 26, 26, 27, 28, 28, 29, 29, 31, 31, 32, 32
Note: For this sample, the sum of the values is 838, and the sum of the squared
differences between each value and the mean is 619.89.
Referring to Table 3-4, the third quartile of the customs data is ________.
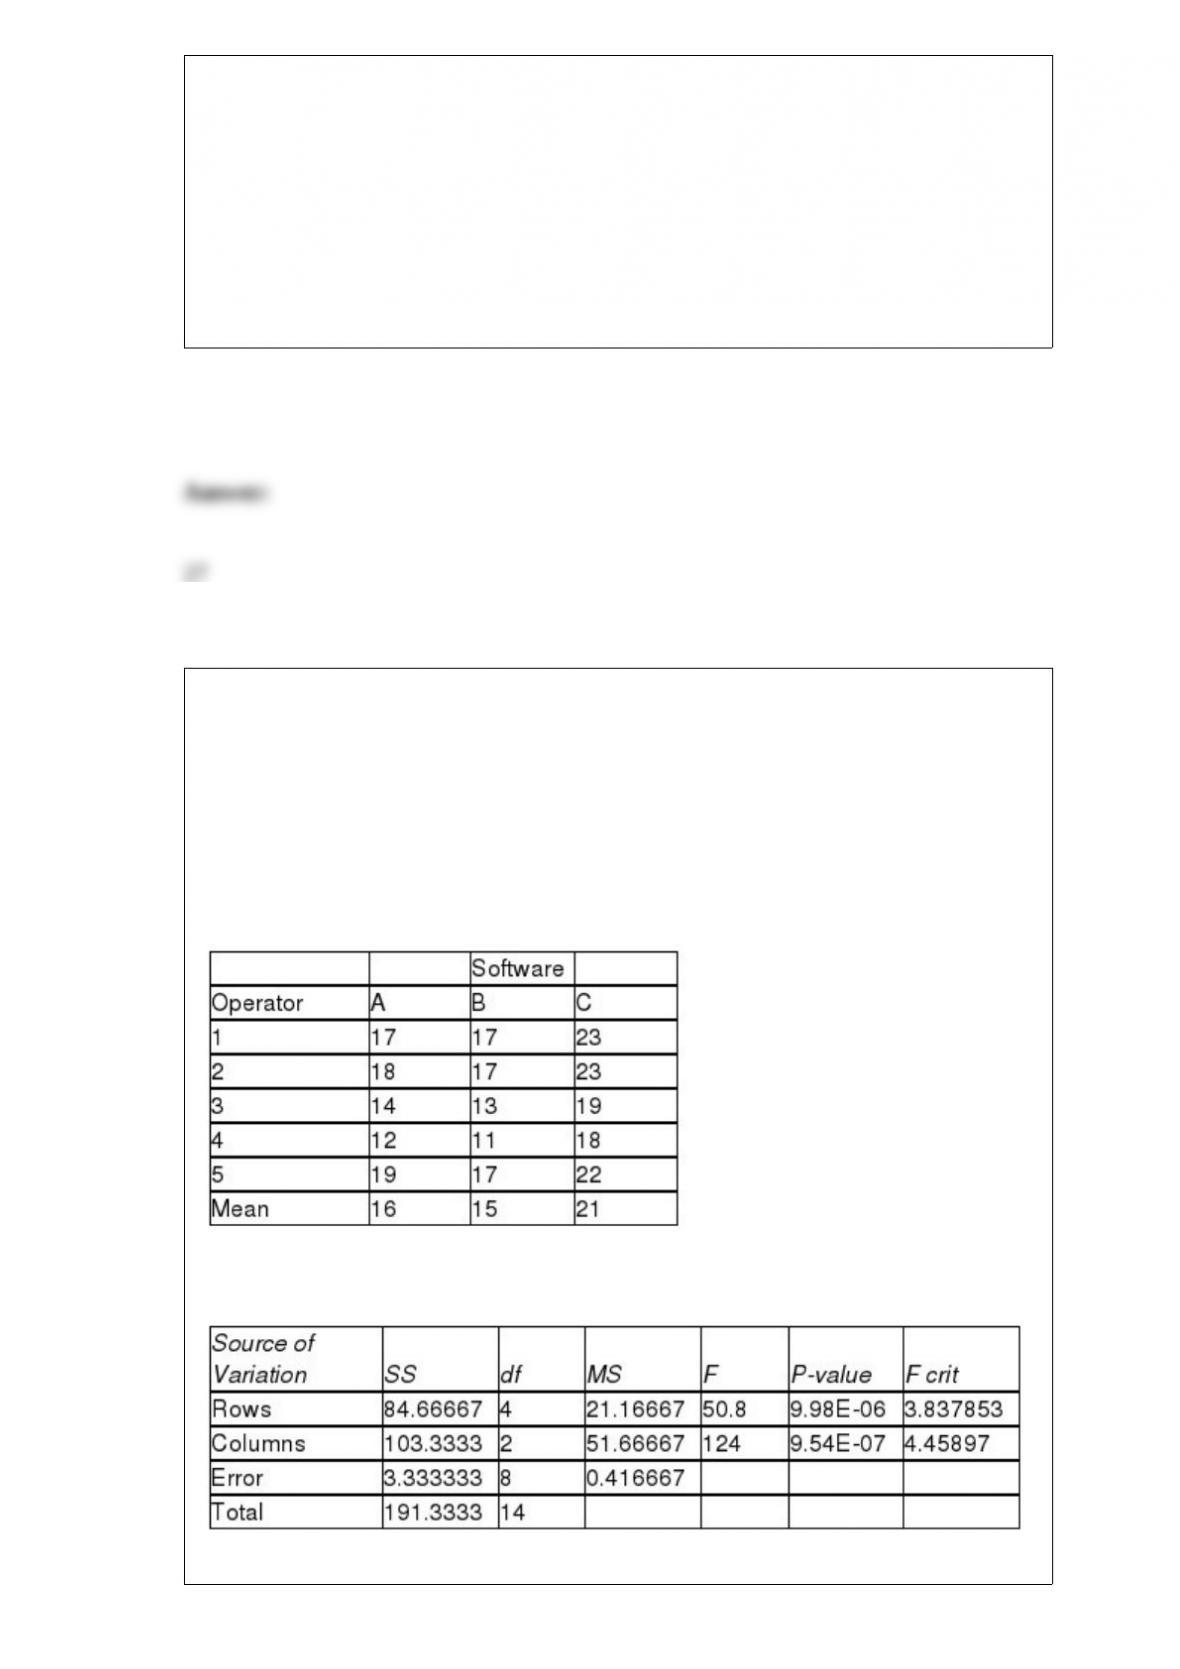
TABLE 11-8
An important factor in selecting database software is the time required for a user to
learn how to use the system. To evaluate three potential brands (A, B and C) of database
software, a company designed a test involving five different employees. To reduce
variability due to differences among employees, each of the five employees is trained
on each of the three different brands. The amount of time (in hours) needed to learn
each of the three different brands is given below:
Below is the Excel output for the randomized block design:
Referring to Table 11-8, the value of MSA is ________, while MSBL is ________.
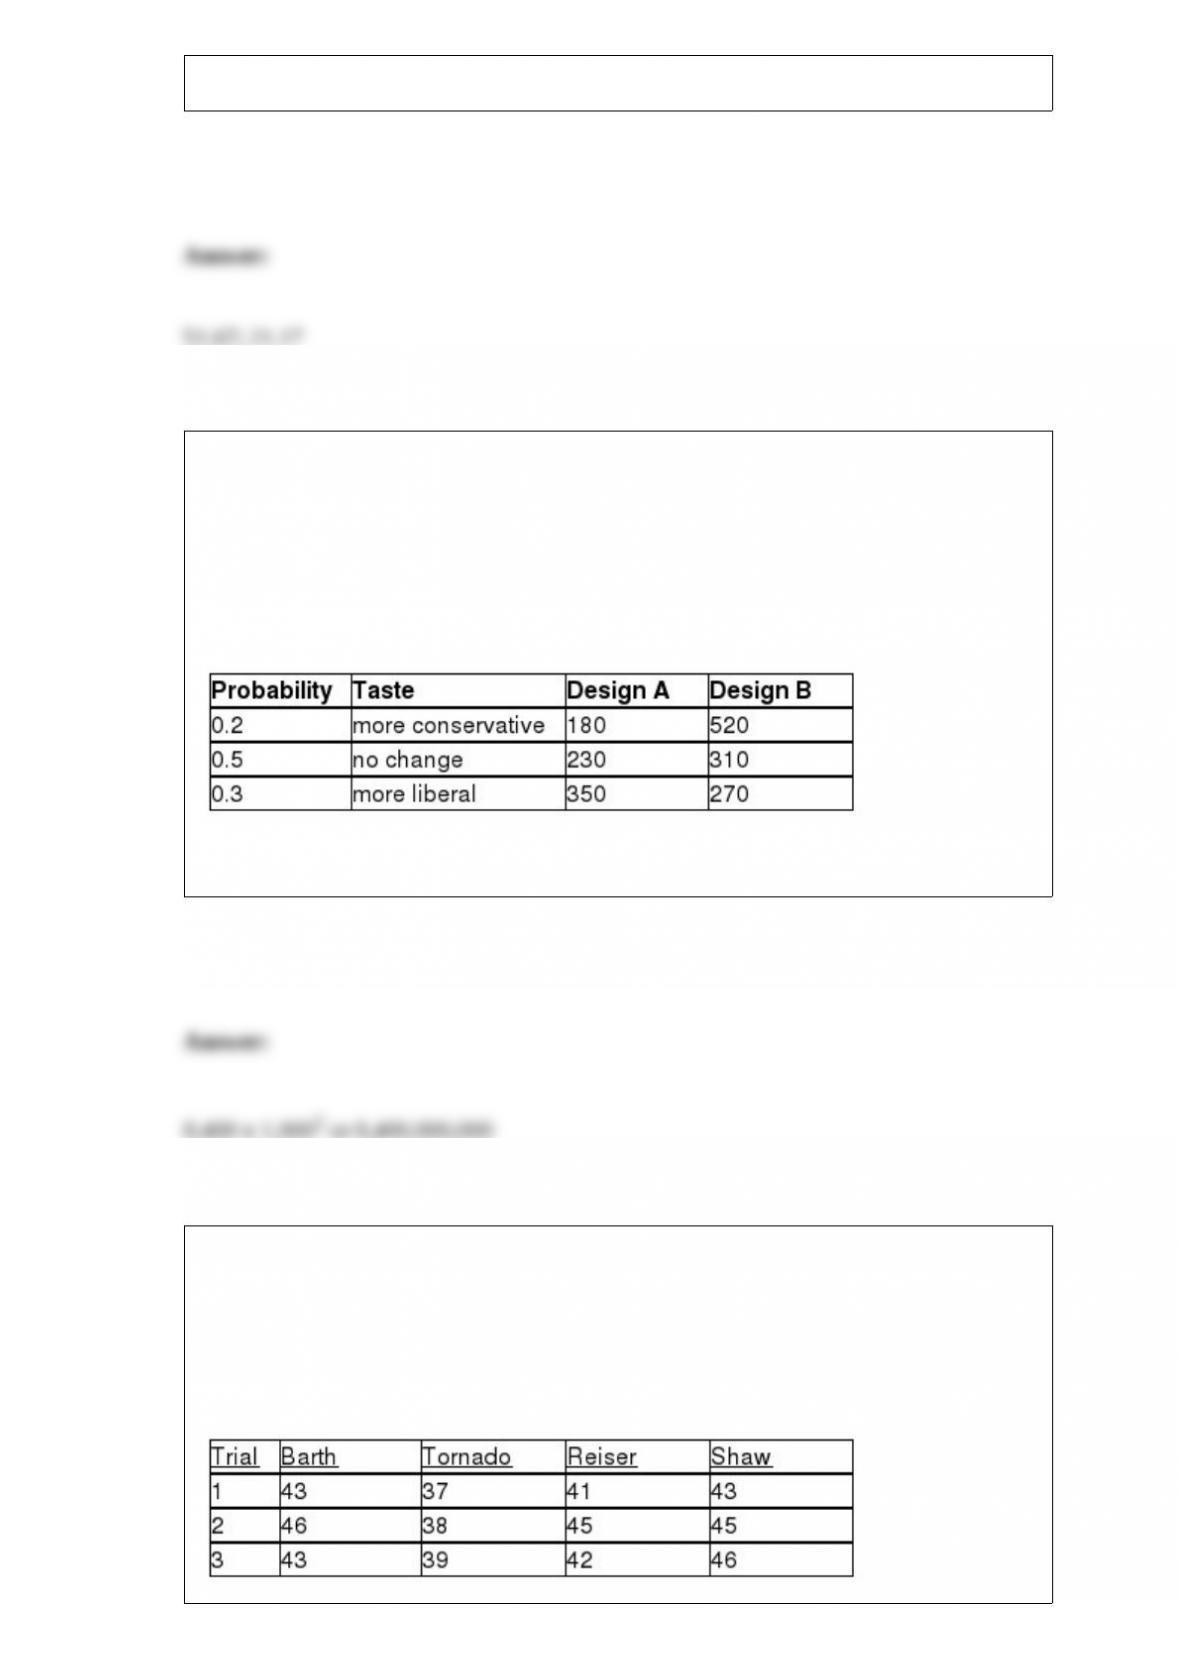
TABLE 5-8
Two different designs on a new line of winter jackets for the coming winter are
available for your manufacturing plants. Your profit (in thousands of dollars) will
depend on the taste of the consumers when winter arrives. The probability of the three
possible different tastes of the consumers and the corresponding profits are presented in
the following table.
Referring to Table 5-8, what is the variance of your profit when Design B is chosen?
TABLE 12-16
As part of an evaluation program, a sporting goods retailer wanted to compare the
downhill coasting speeds of 4 brands of bicycles. She took 3 of each brand and
determined their maximum downhill speeds. The results are presented in miles per hour
in the table below.
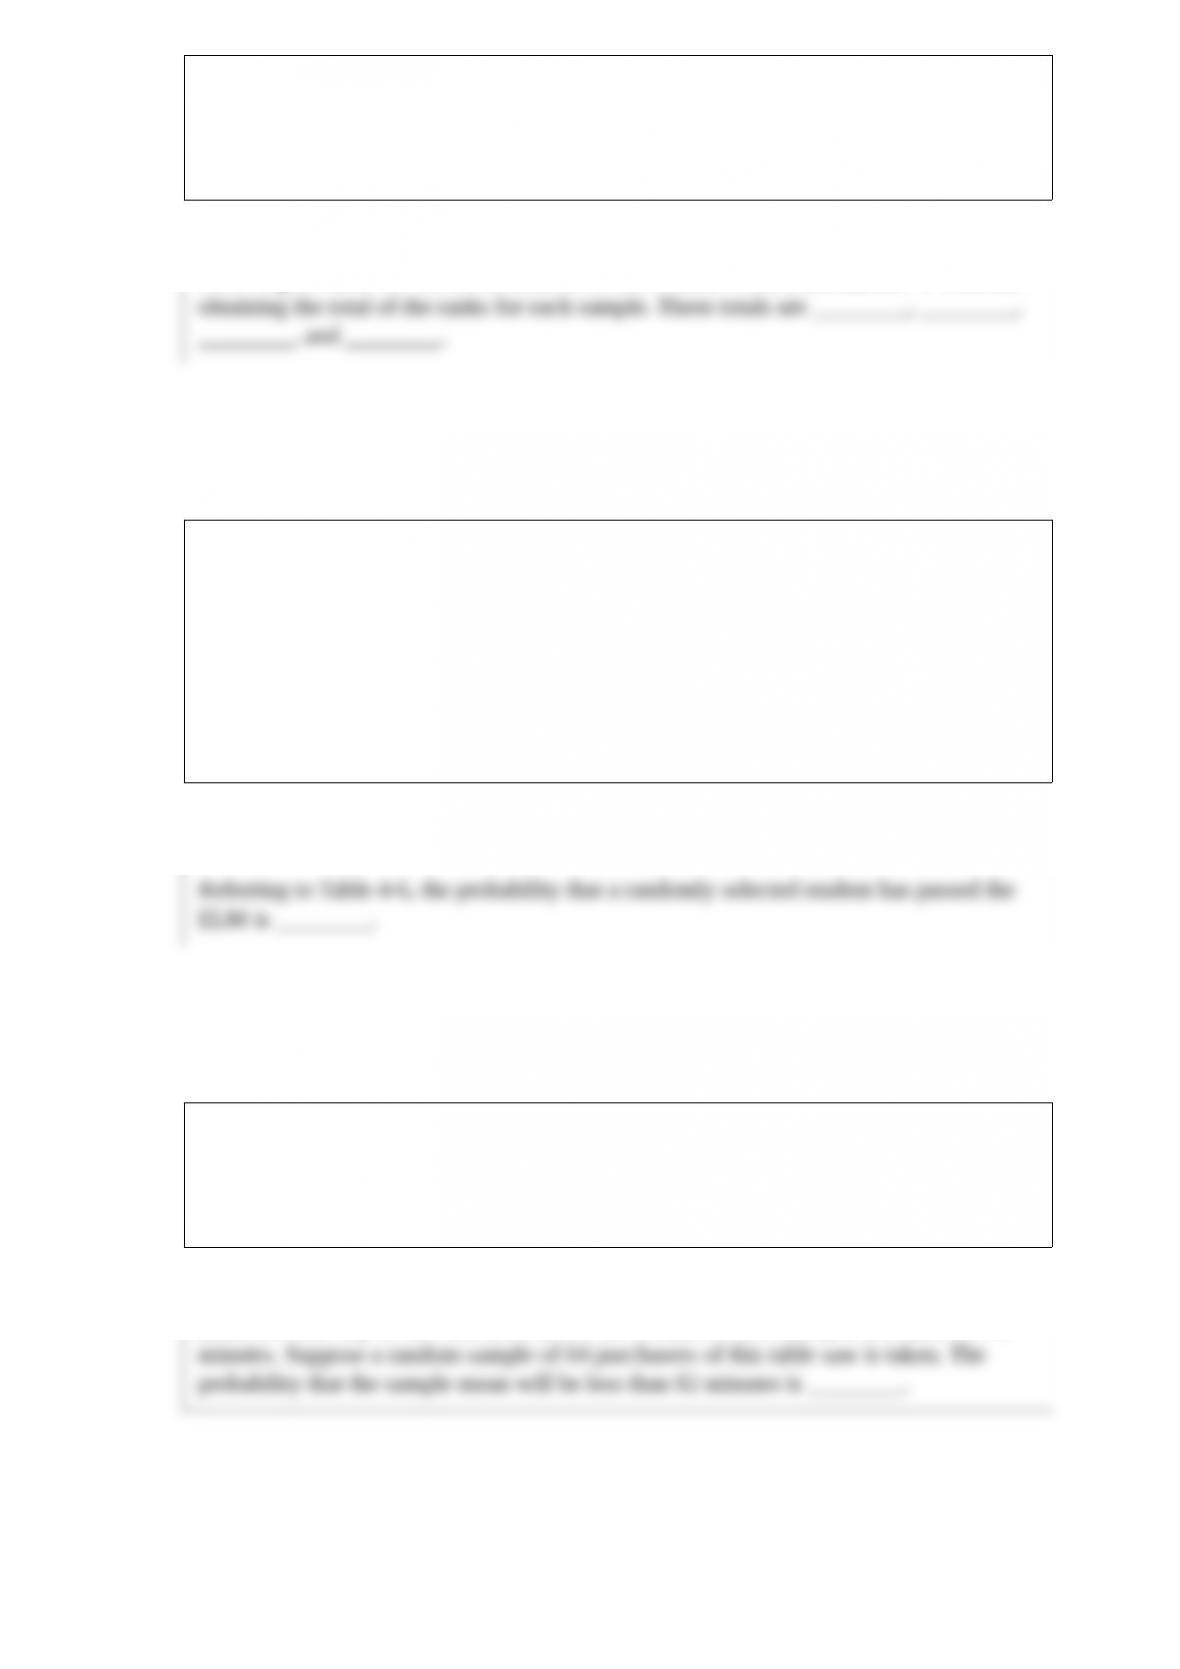
Referring to Table 12-16, the calculation of the Kruskal-Wallis test statistic H involves
obtaining the total of the ranks for each sample. These totals are ________, ________,
________, and ________.
TABLE 4-6
At a Texas college, 60% of the students are from the southern part of the state, 30% are
from the northern part of the state, and the remaining 10% are from out-of-state. All
students must take and pass an Entry
Referring to Table 4-6, the probability that a randomly selected student has passed the
ELM is ________.
A manufacturer of power tools claims that the mean amount of time required to
assemble their top-of-the-line table saw is 80 minutes with a standard deviation of 40
minutes. Suppose a random sample of 64 purchasers of this table saw is taken. The
probability that the sample mean will be less than 82 minutes is ________.
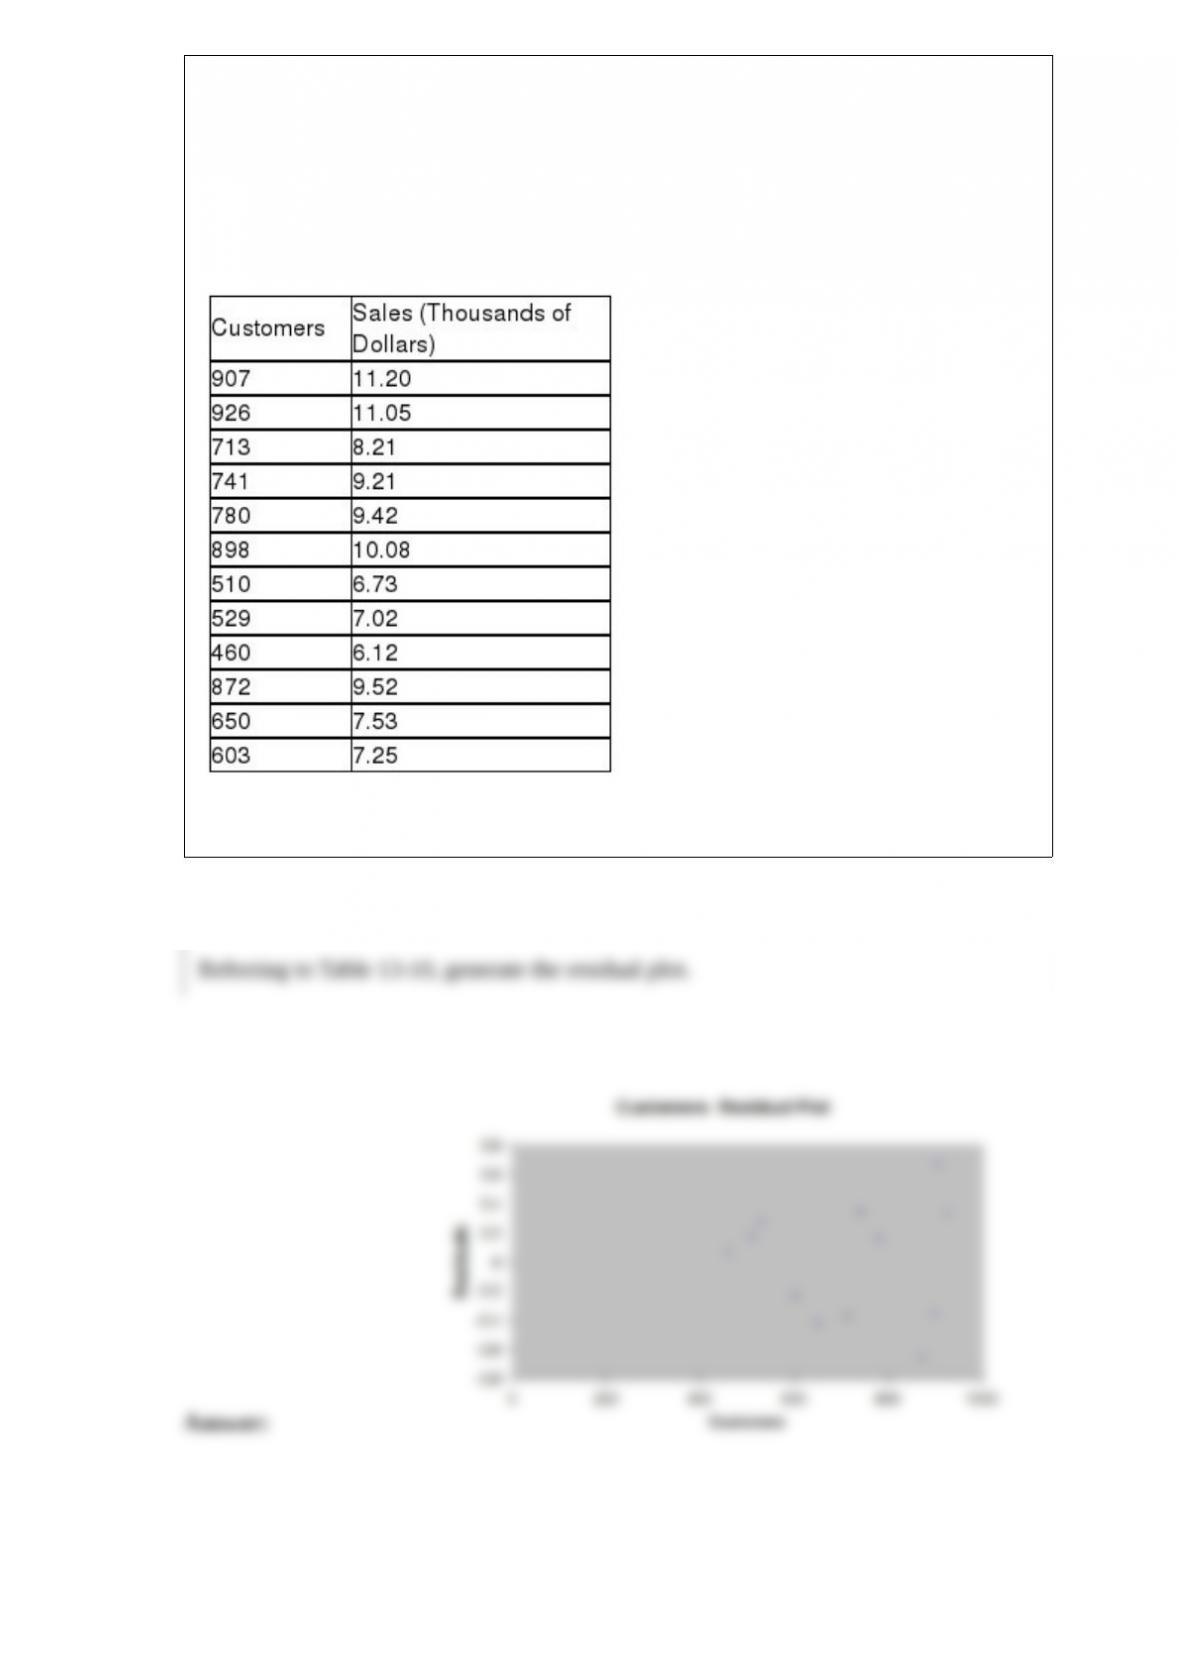
TABLE 13-10
The management of a chain electronic store would like to develop a model for
predicting the weekly sales (in thousands of dollars) for individual stores based on the
number of customers who made purchases. A random sample of 12 stores yields the
following results:
Referring to Table 13-10, generate the residual plot.