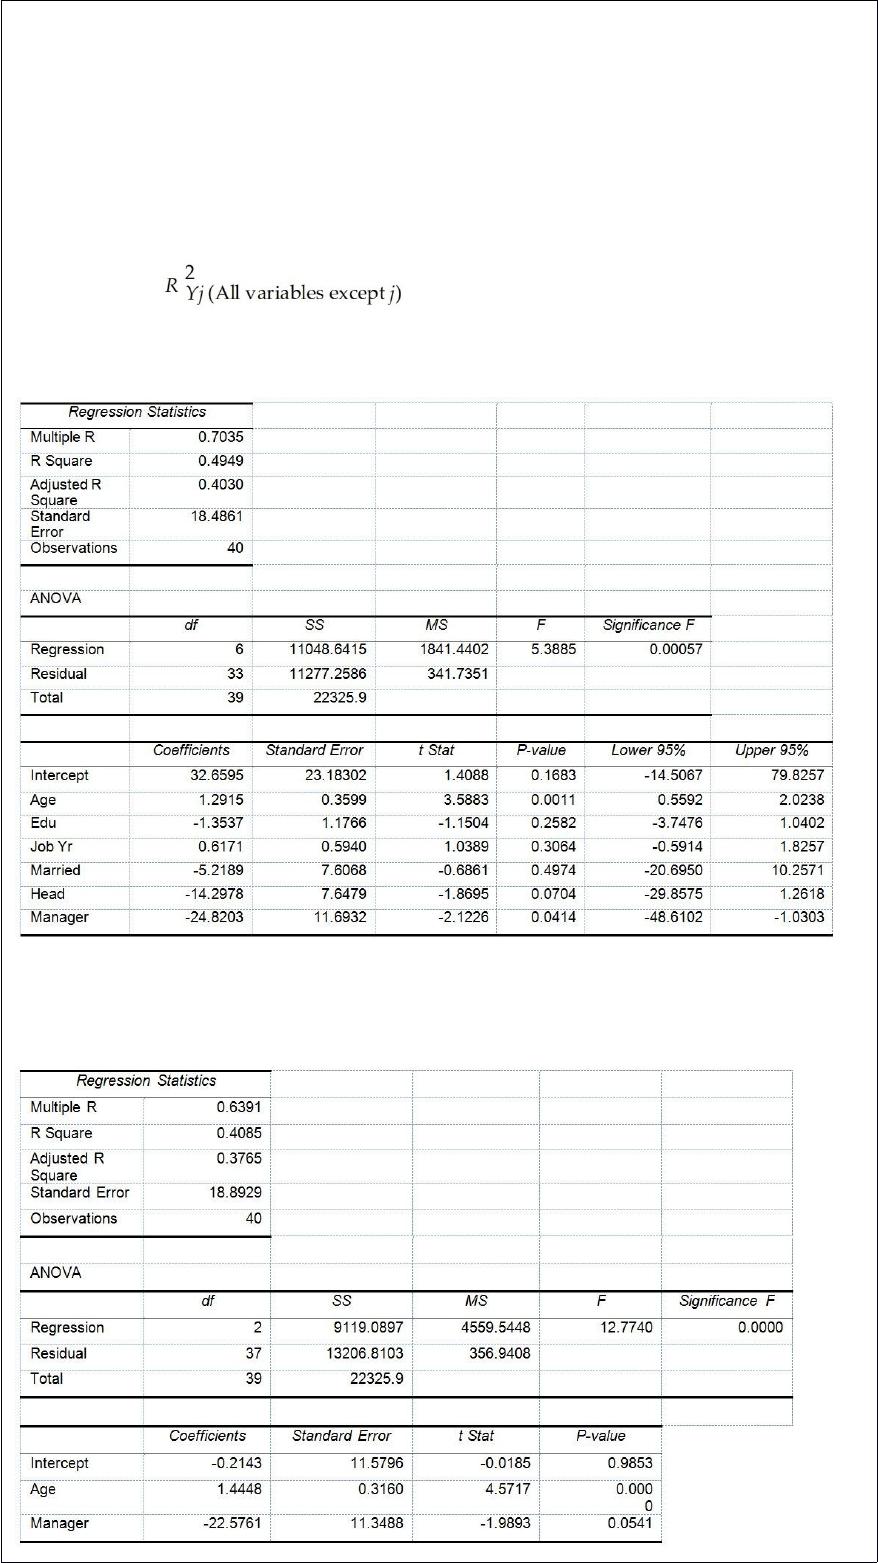
True or False: TABLE 17-10
Given below are results from the regression analysis where the dependent variable is
the number of weeks a worker is unemployed due to a layoff (Unemploy) and the
independent variables are the age of the worker (Age), the number of years of education
received (Edu), the number of years at the previous job (Job Yr), a dummy variable for
marital status (Married: 1 = married, 0 = otherwise), a dummy variable for head of
household (Head: 1 = yes, 0 = no) and a dummy variable for management position
(Manager: 1 = yes, 0 = no). We shall call this Model 1. The coefficient of partial
determination ( ) of each of the 6 predictors are, respectively,
0.2807, 0.0386, 0.0317, 0.0141, 0.0958, and 0.1201.
Model 2 is the regression analysis where the dependent variable is Unemploy and the
independent variables are Age and Manager. The results of the regression analysis are
given below:
Referring to Table 17-10, Model 1, the alternative hypothesis H1 : At least one of βj â
‰ 0 for j = 1, 2, 3, 4, 5, 6 implies that the number of weeks a worker is unemployed
due to a layoff is affected by all of the explanatory variables.
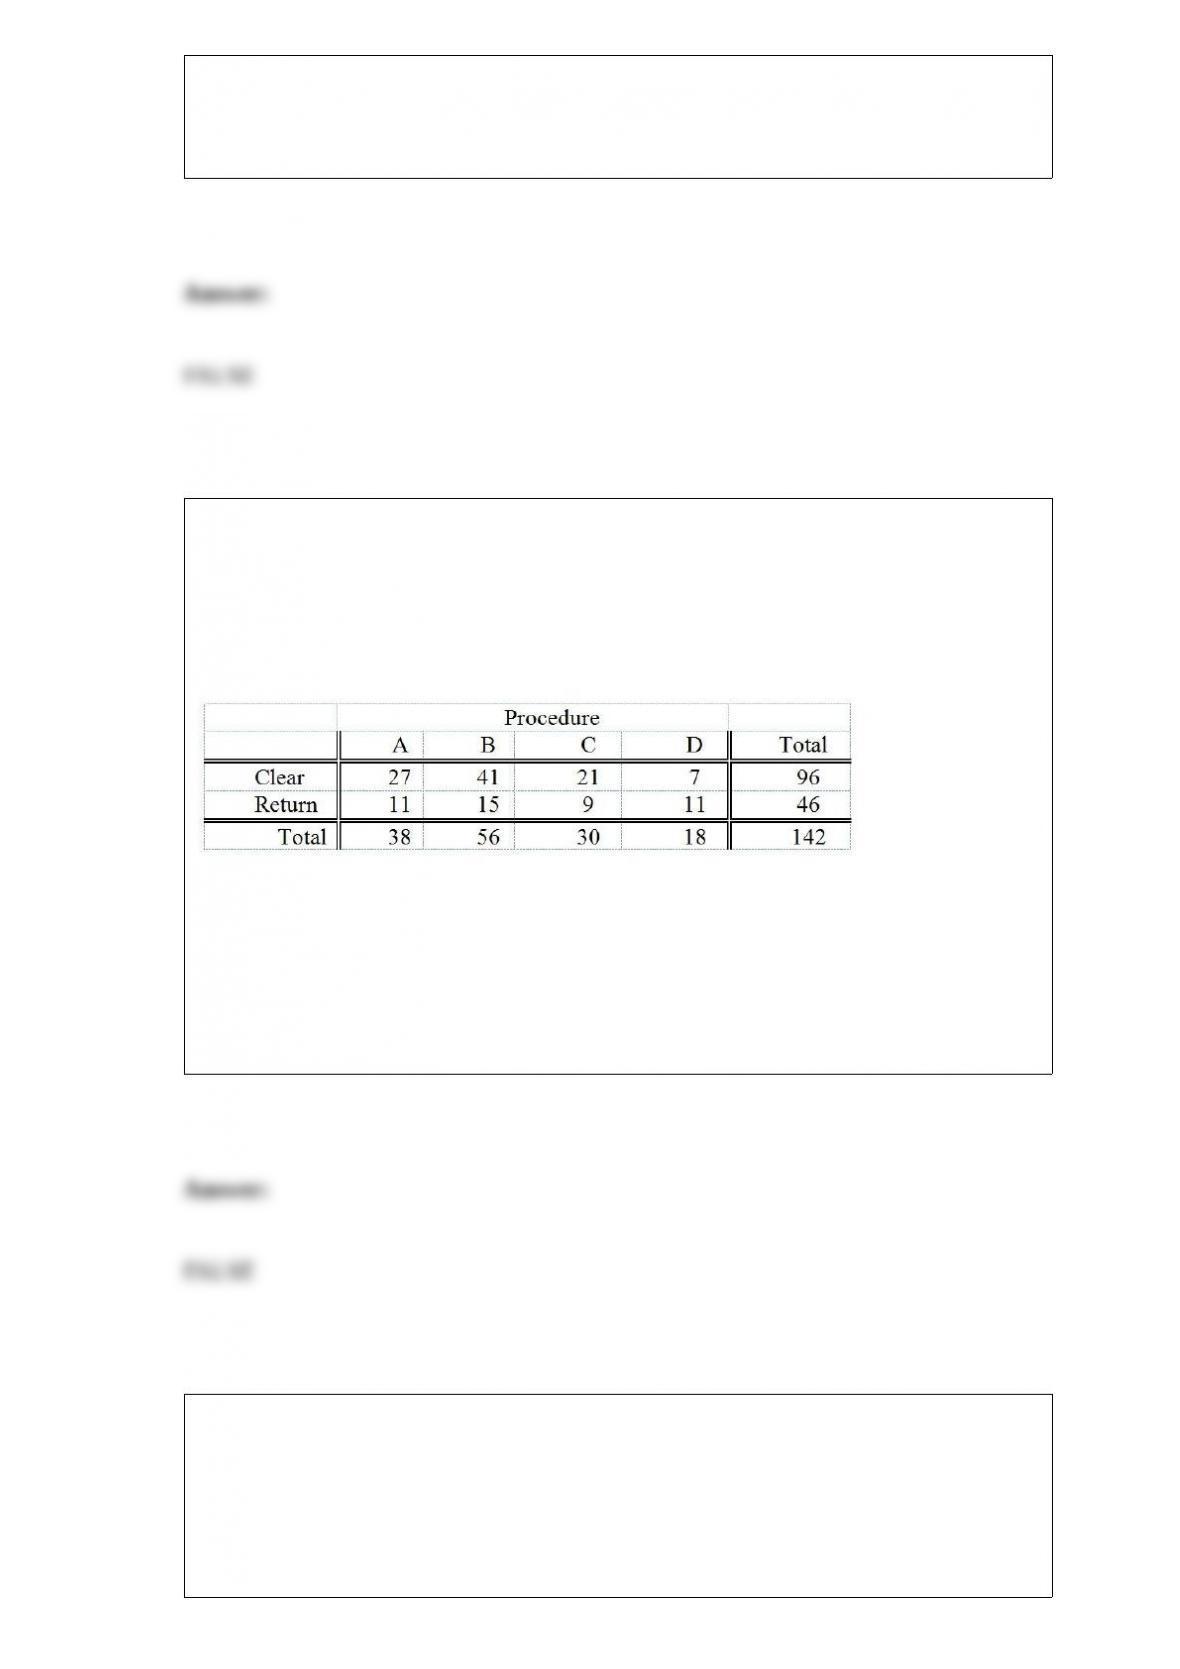
TABLE 12-5
Four surgical procedures currently are used to install pacemakers. If the patient does not
need to return for follow-up surgery, the operation is called a “clear” operation. A heart
center wants to compare the proportion of clear operations for the 4 procedures, and
collects the following numbers of patients from their own records:
They will use this information to test for a difference among the proportion of clear
operations using a chi-square test with a level of significance of 0.05.
True or False: Referring to Table 12-5, there is sufficient evidence to conclude that the
proportions between procedure A and procedure C are different at a 0.05 level of
significance.
TABLE 8-5
A sample of salary offers (in thousands of dollars) given to management majors is: 48,
51, 46, 52, 47, 48, 47, 50, 51, and 59. Using this data to obtain a 95% confidence
interval resulted in an interval from 47.19 to 52.61.
True or False: Referring to Table 8-5, it is possible that the mean of the population is
not between 47.19 and 52.61.
TABLE 14-15
The superintendent of a school district wanted to predict the
percentage of students passing a sixth-grade proficiency test. She
obtained the data on percentage of students passing the proficiency
test (% Passing), mean teacher salary in thousands of dollars
(Salaries), and instructional spending per pupil in thousands of dollars
(Spending) of 47 schools in the state.
Following is the multiple regression output with Y = % Passing as the
dependent variable, X1 = Salaries and X2 = Spending:
True or False: Referring to Table 14-15, there is suffcient evidence
that both of the explanatory variables are related to the percentage
of students passing the proficiency test at a 5% level of significance.
True or False: The confidence interval estimate of the population proportion is
constructed around the sample proportion.
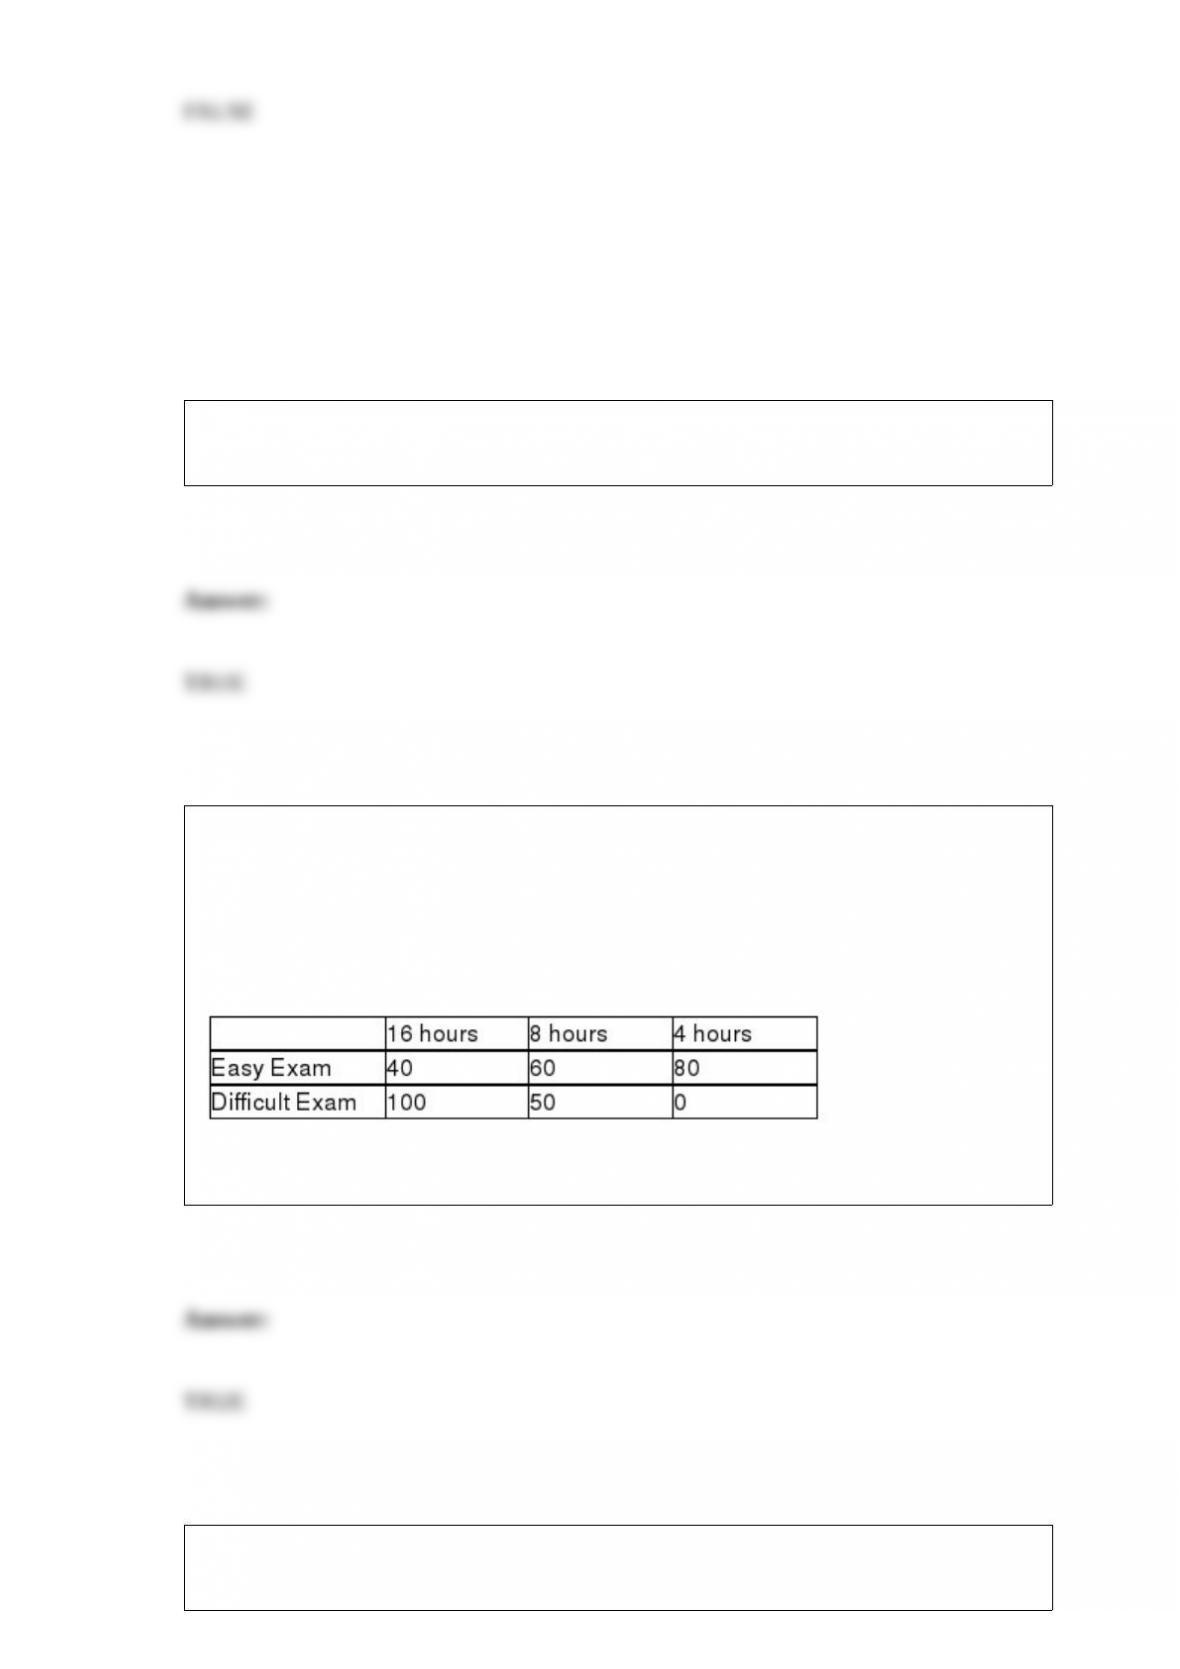
True or False: TABLE 19-6
A student wanted to find out the optimal strategy to study for a Business Statistics
exam. He constructed the following payoff table based on the mean amount of time he
needed to study every week for the course and the degree of difficulty of the exam.
From the information that he gathered from students who had taken the course, he
concluded that there was a 40% probability that the exam would be easy.
Referring to Table 19-6, the optimal strategy using the maximin criterion is to study 8
hours per week on average for the exam.
TABLE 16-10
Business closures in Laramie, Wyoming from 2007 to 2012 were:
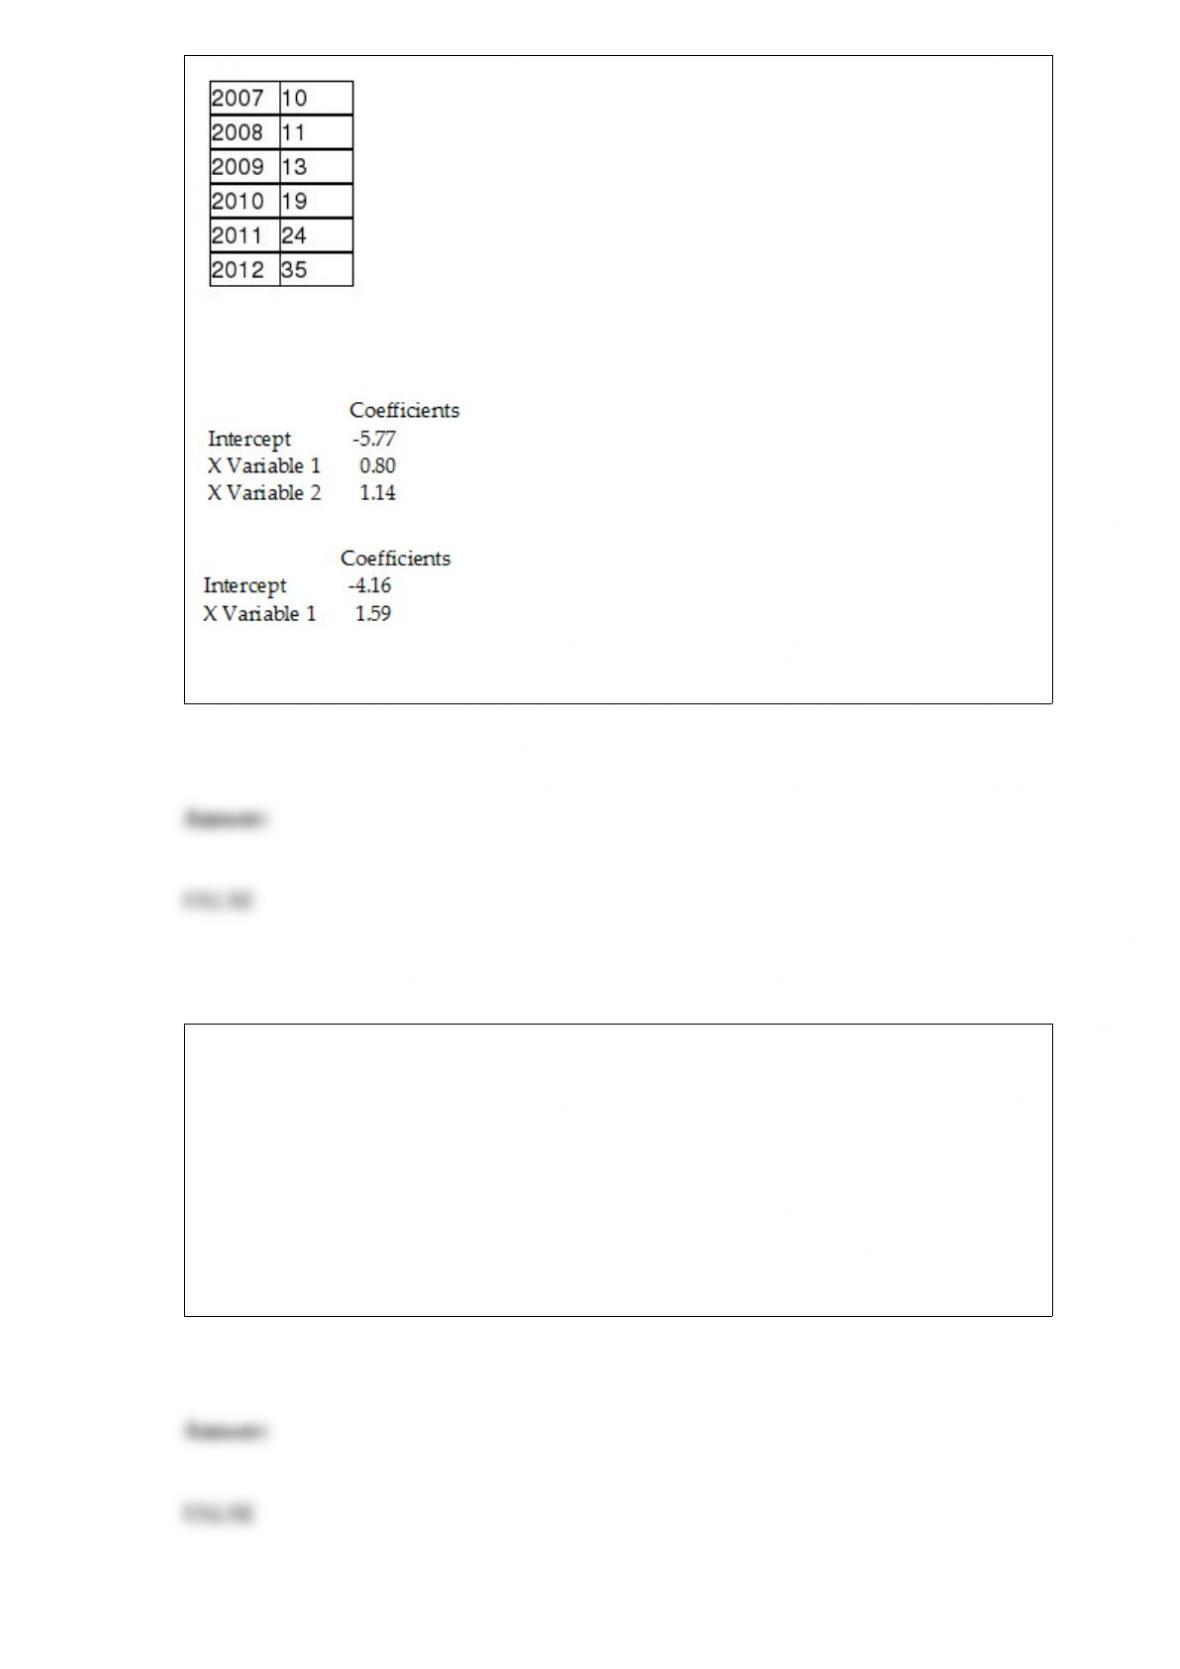
Microsoft Excel was used to fit both first-order and second-order autoregressive
models, resulting in the following partial outputs:
SUMMARY OUTPUT – 2nd Order Model
SUMMARY OUTPUT – 1st Order Model
True or False: Referring to Table 16-10, the values of the MAD for the two models
indicate that the first-order model should be used for forecasting.
TABLE 8-7
A hotel chain wants to estimate the mean number of rooms rented daily in a given
month. The population of rooms rented daily is assumed to be normally distributed for
each month with a standard deviation of 240 rooms. During February, a sample of 25
days has a sample mean of 370 rooms.
True or False: Referring to Table 8-7, we are 99% confident that between 246.36% and
493.64% of the rooms will be rented daily in a given month.
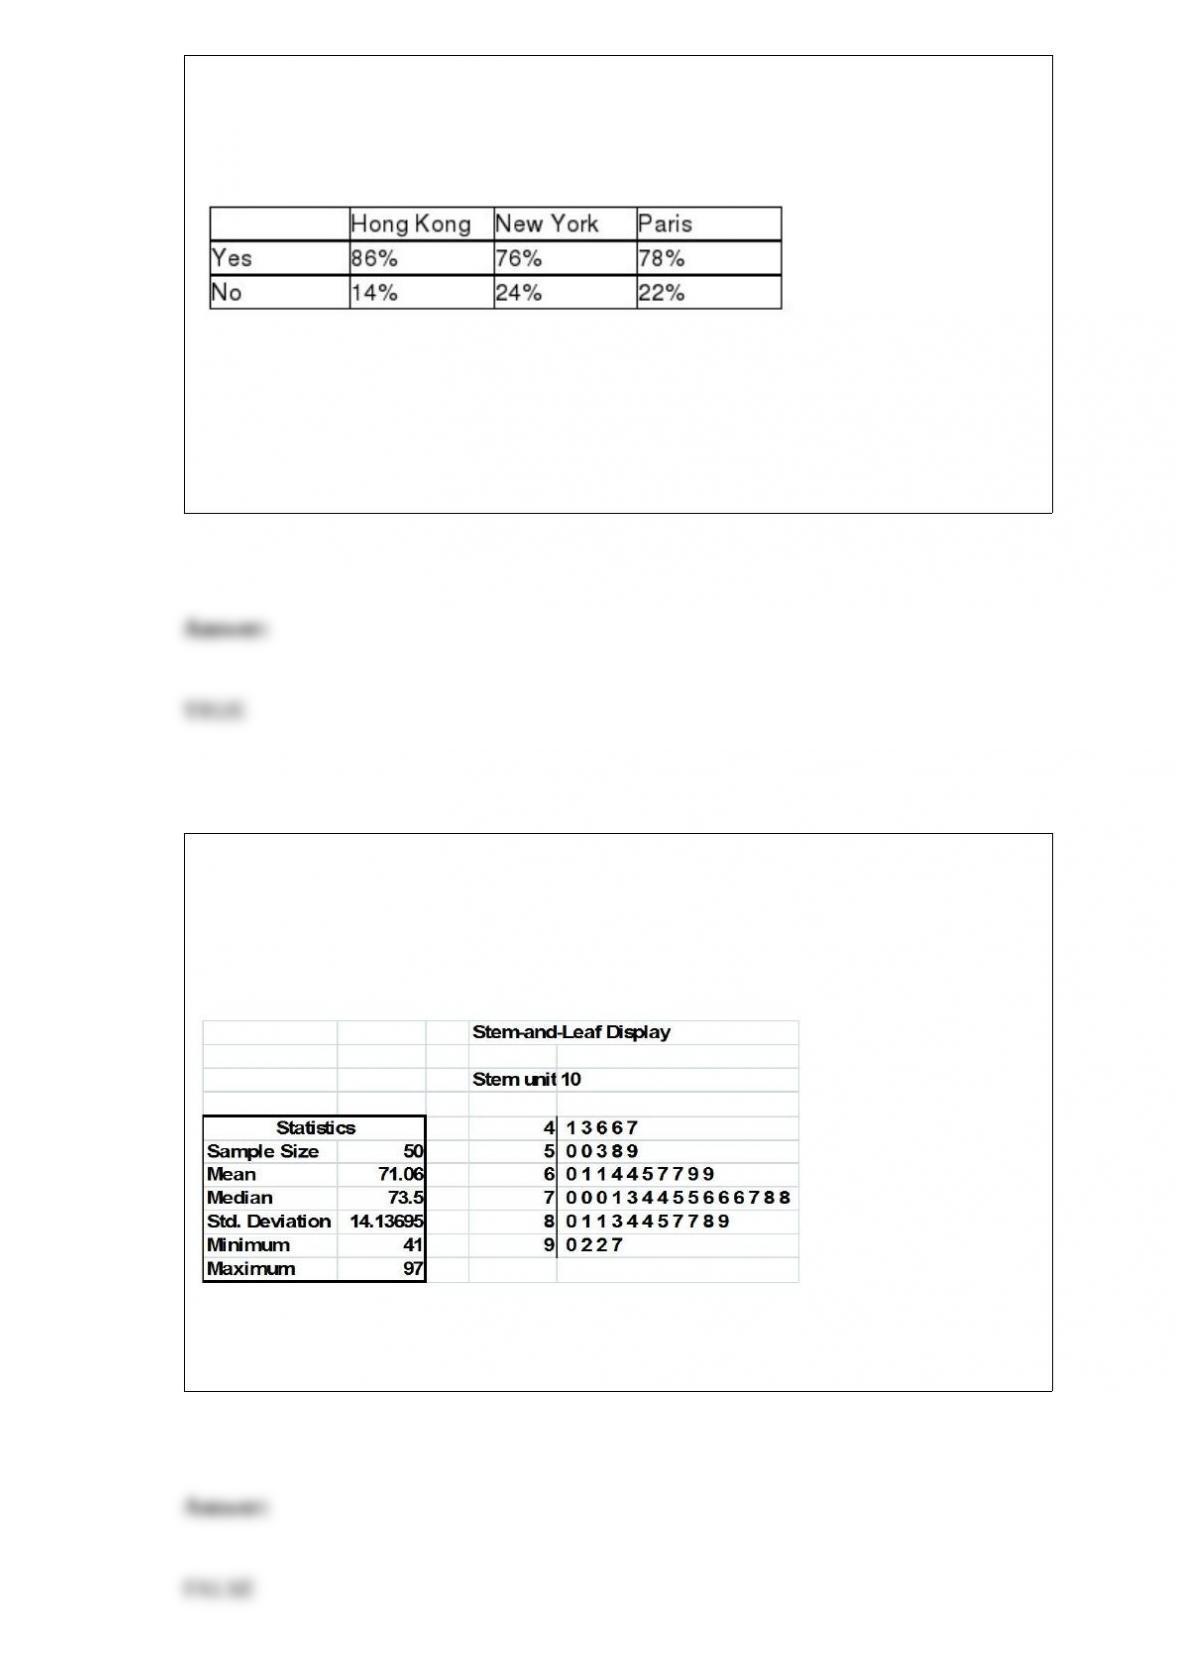
TABLE 12-7
Data on the percentage of 200 hotels in each of the three large cities across the world on
whether minibar charges are correctly posted at checkout are given below.
At the 0.05 level of significance, you want to know if there is evidence of a difference
in the proportion of hotels that correctly post minibar charges among the three cities.
True or False: Referring to Table 12-7, the decision made suggests that the 3 cities do
not all have the same proportion of hotels that correctly post minibar charges.
TABLE 2-18
The stem-and-leaf display below shows the result of a survey of 50 students on their
satisfaction with their school, with the higher scores representing a higher level of
satisfaction.
True or False: Referring to Table 2-18, if a student is randomly selected, his/her most
likely level of satisfaction will be in the 60s among the 40s, 50s, 60s, 70s, 80s and 90s.
True or False: The Z score of a value can never be negative.
True or False: An in-control process must be achieved before being able to estimate
process capability.
TABLE 13-10
The management of a chain electronic store would like to develop a model for
predicting the weekly sales (in thousands of dollars) for individual stores based on the
number of customers who made purchases. A random sample of 12 stores yields the
following results:
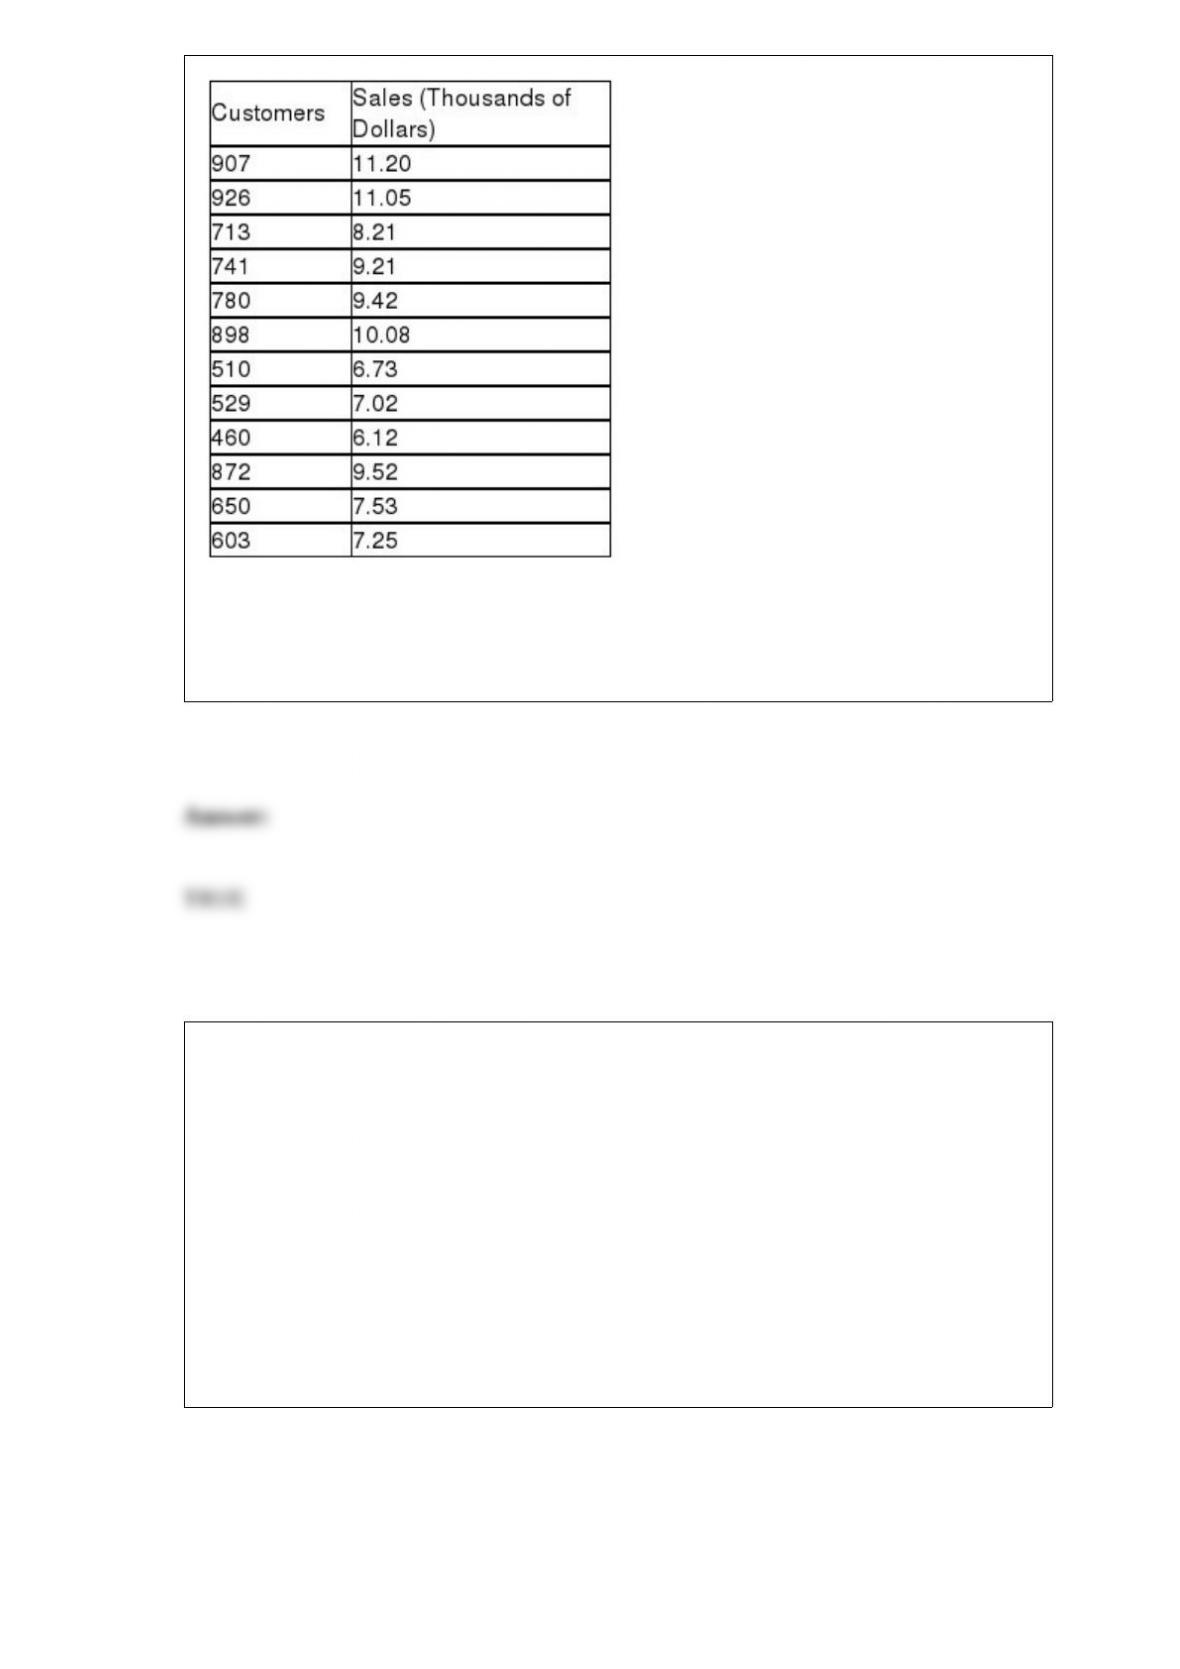
True or False: Referring to Table 13-10, the value of the F test statistic equals the
square of the t test statistic when testing whether the number of customers who make
purchases is a good predictor for weekly sales.
TABLE 14-19
The marketing manager for a nationally franchised lawn service
company would like to study the characteristics that differentiate
home owners who do and do not have a lawn service. A random
sample of 30 home owners located in a suburban area near a large
city was selected; 11 did not have a lawn service (code 0) and 19 had
a lawn service (code 1). Additional information available concerning
these 30 home owners includes family income (Income, in thousands
of dollars) and lawn size (Lawn Size, in thousands of square feet).
The PHStat output is given below:

True or False: Referring to Table 14-19, the null hypothesis that the
model is a good-fitting model cannot be rejected when allowing for a
5% probability of making a type I error.
Referring to Table 14-19, what is the estimated probability that a
home owner with a family income of $50,000 and a lawn size of 2,000
square feet will purchase a lawn service?
TABLE 14-19
The marketing manager for a nationally franchised lawn service
company would like to study the characteristics that differentiate
home owners who do and do not have a lawn service. A random
sample of 30 home owners located in a suburban area near a large
city was selected; 11 did not have a lawn service (code 0) and 19 had
a lawn service (code 1). Additional information available concerning
these 30 home owners includes family income (Income, in thousands
of dollars) and lawn size (Lawn Size, in thousands of square feet).
The PHStat output is given below:
A personal computer user survey was conducted. The number of years using a personal
computer is an example of a ________ numerical variable.
TABLE 7-7
Times spent studying by students in the week before final exams follow a normal
distribution with standard deviation 8 hours. A random sample of 4 students was taken
from a population of 50 in order to estimate the mean study time for the population of
all students. Use the finite population correction.
Referring to Table 7-7, 10% of all the samples of 4 will have a sample mean of at least
how many hours below the population mean?

Referring to Table 14-8, the analyst wants to use a t test to test for
the significance of the coefficient of X2. The p-value of the test is
________.TABLE 14-8
A financial analyst wanted to examine the relationship between salary
(in $1,000) and 2 variables: age
(X1 = Age) and experience in the field (X2 = Exper). He took a sample
of 20 employees and obtained the following Microsoft Excel output:
Also, the sum of squares due to the regression for the model that
includes only Age is 5022.0654 while the sum of squares due to the
regression for the model that includes only Exper is 125.9848.
If a researcher rejects a true null hypothesis, she has made a(n) ________ error.
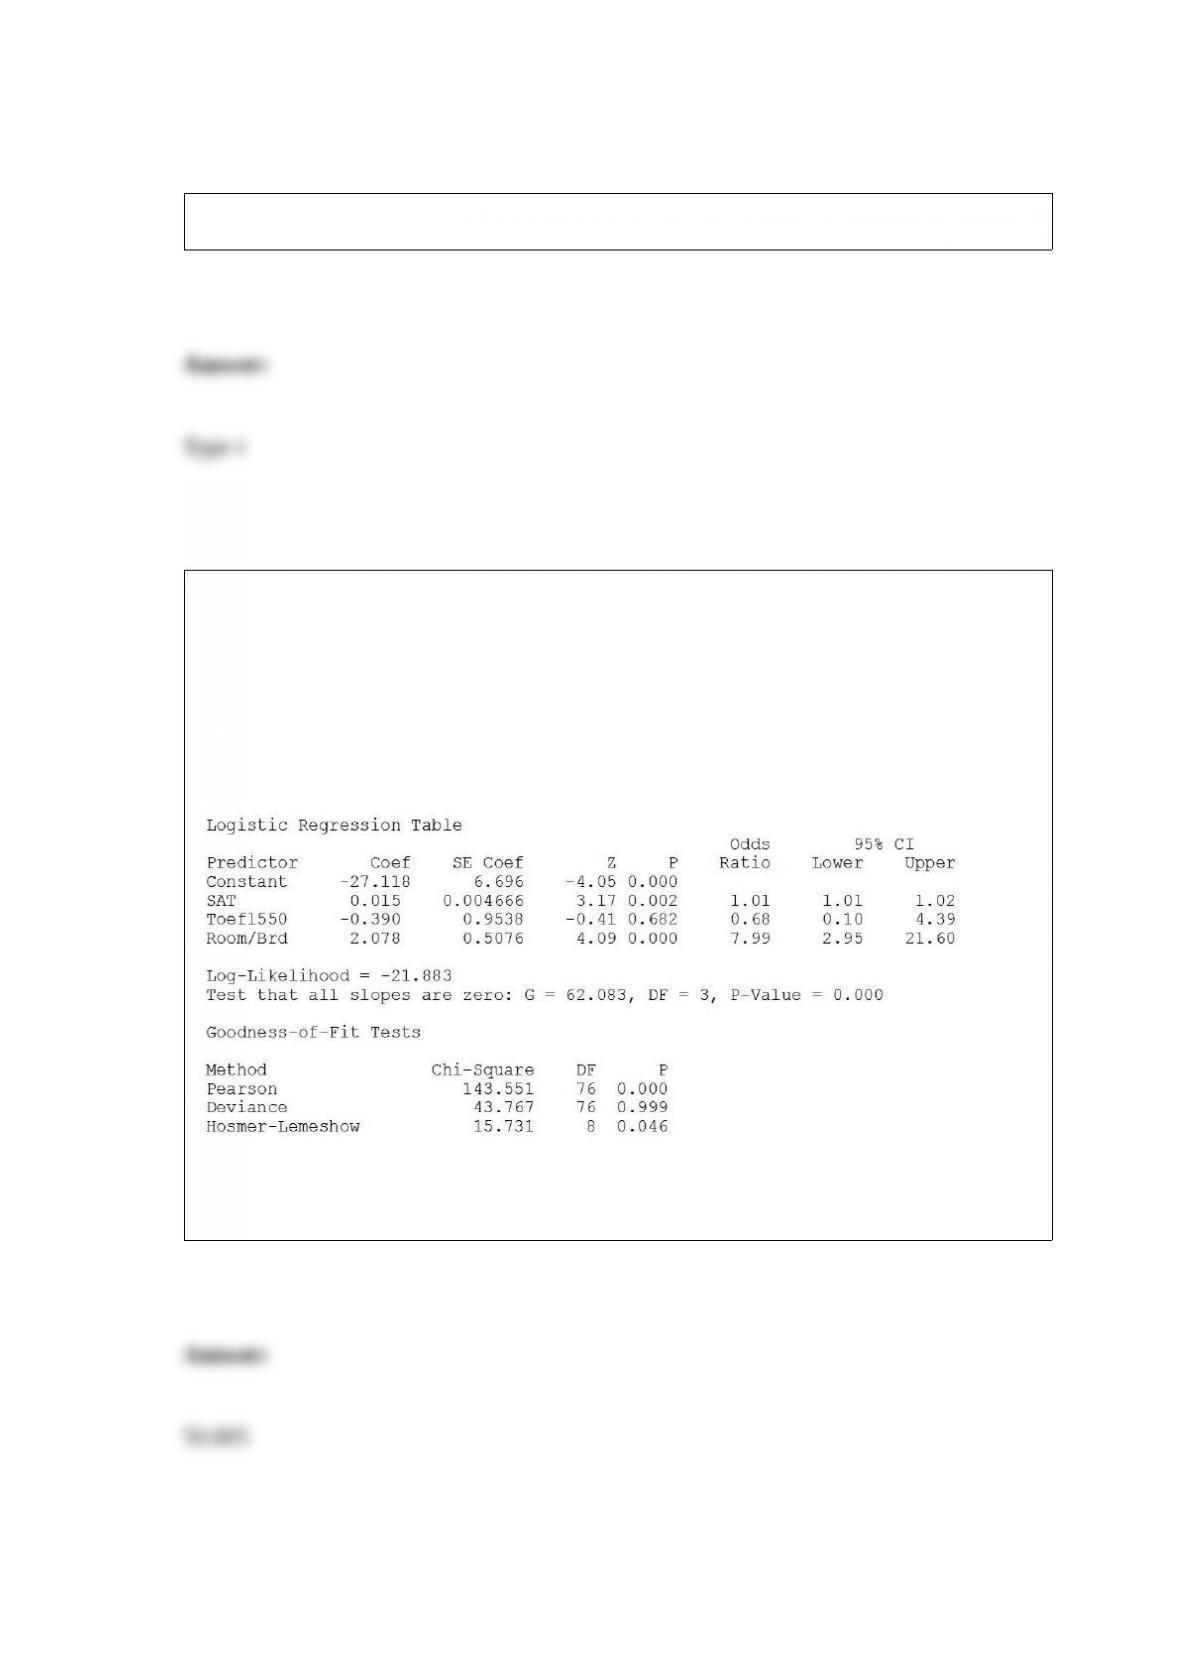
TABLE 17-11
A logistic regression model was estimated in order to predict the probability that a
randomly chosen university or college would be a private university using information
on mean total Scholastic Aptitude Test score (SAT) at the university or college, the
room and board expense measured in thousands of dollars (Room/Brd), and whether the
TOEFL criterion is at least 550 (Toefl550 = 1 if yes, 0 otherwise.) The dependent
variable, Y, is school type (Type = 1 if private and 0 otherwise).
Referring to Table 17-11, what is the estimated odds ratio for a school with a mean SAT
score of 1100, a TOEFL criterion that is not at least 550, and the room and board
expense of 7 thousand dollars?
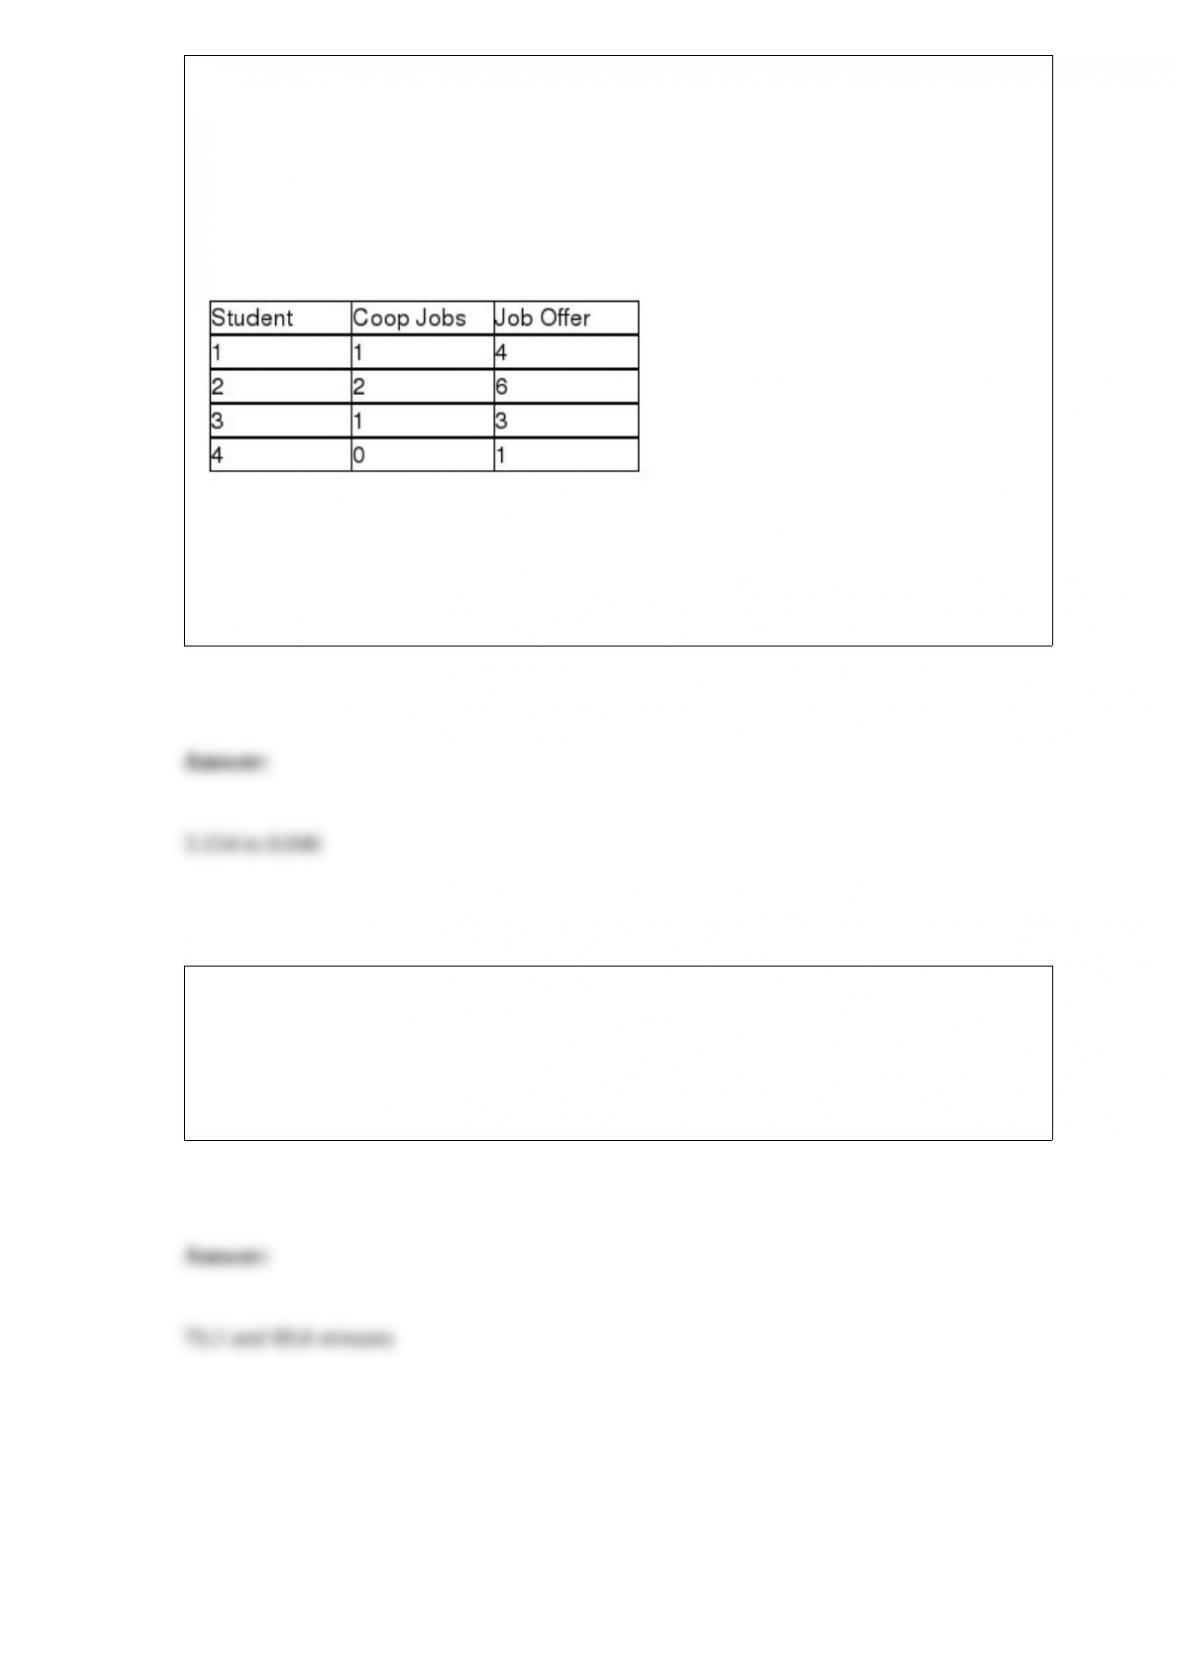
TABLE 13-3
The director of cooperative education at a state college wants to examine the effect of
cooperative education job experience on marketability in the work place. She takes a
random sample of 4 students. For these 4, she finds out how many times each had a
cooperative education job and how many job offers they received upon graduation.
These data are presented in the table below.
Referring to Table 13-3, suppose the director of cooperative education wants to
construct a 95% prediction interval for the number of job offers received by a student
who has had exactly two cooperative education jobs. The prediction interval is from
________ to ________.
A manufacturer of power tools claims that the mean amount of time required to
assemble their top-of-the-line table saw is 80 minutes with a standard deviation of 40
minutes. Suppose a random sample of 64 purchasers of this table saw is taken. So, the
middle 95% of the sample means based on sample sizes of 64 will be between
________ and ________.