
True or False: The stepwise regression approach takes into consideration all possible
models.
TABLE 14-17
Given below are results from the regression analysis where the
dependent variable is the number of weeks a worker is unemployed
due to a layo! (Unemploy) and the independent variables are the age
of the worker (Age) and a dummy variable for management position
(Manager: 1 = yes, 0 = no).
The results of the regression analysis are given below:
True or False: Referring to Table 14-17, we can conclude de.nitively
that, holding constant the e!ect of the other independent variables,
there is not a di!erence in the mean number of weeks a worker is
unemployed due to a layo! between a worker who is in a
management position and one who is not at a 10% level of
signi.cance if all we have is the information of the 95% con.dence
interval estimate for the di!erence in the mean number of weeks a
worker is unemployed due to a layo! between a worker who is in a
management position and one who is not.
True or False: If you have taken into account all relevant explanatory factors, the
residuals from a multiple regression model should be random.
True or False: The question “How many times have you abused illicit drugs in the last 6
months?” will most likely result in nonresponse error.
True or False: Theoretically, the mean, median, and the mode are all equal for a normal
distribution.
True or False: Each forecast using the method of exponential smoothing depends on all
the previous observations in the time series.
True or False: TABLE 17-8
The superintendent of a school district wanted to predict the percentage of students
passing a sixth-grade proficiency test. She obtained the data on percentage of students
passing the proficiency test (% Passing), daily mean of the percentage of students
attending class (% Attendance), mean teacher salary in dollars (Salaries), and
instructional spending per pupil in dollars (Spending) of 47 schools in the state.
Following is the multiple regression output with Y = % Passing as the dependent
variable, X1 = % Attendance, X2 = Salaries and X3 = Spending:
Referring to Table 17-8, you can conclude that instructional spending per pupil
individually has no impact on the mean percentage of students passing the proficiency
test, taking into account the effect of all the other independent variables, at a 1% level
of significance based solely on the 95% confidence interval estimate for β3.
TABLE 9-4
A drug company is considering marketing a new local anesthetic. The effective time of
the anesthetic the drug company is currently producing has a normal distribution with a
mean of 7.4 minutes with a standard deviation of 1.2 minutes. The chemistry of the new
anesthetic is such that the effective time should be normally distributed with the same
standard deviation, but the mean effective time may be lower. If it is lower, the drug
company will market the new anesthetic; otherwise, they will continue to produce the
older one. A sample size of 36 results in a sample mean of 7.1. A hypothesis test will be
done to help make the decision.
True or False: Referring to Table 9-4, the null hypothesis will be rejected with a level of
significance of 0.10.
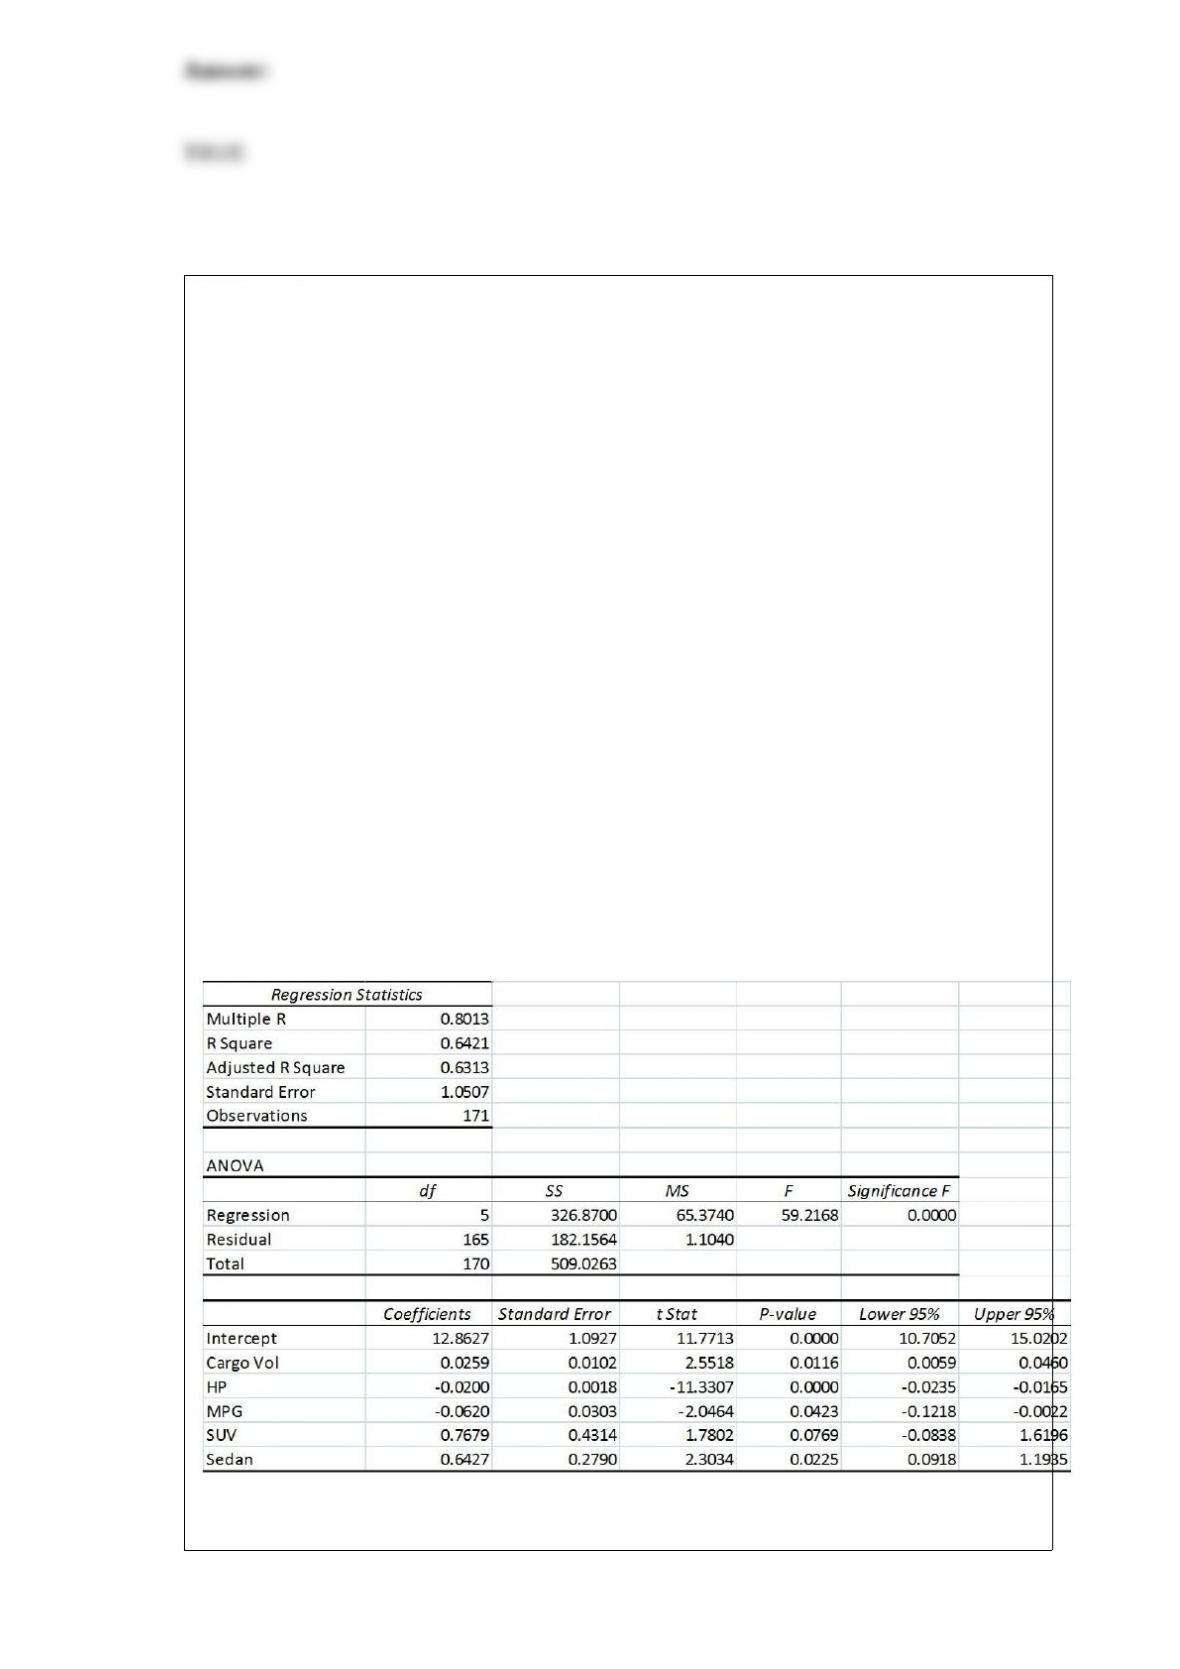
True or False: TABLE 17-9
What are the factors that determine the acceleration time (in sec.) from 0 to 60 miles per
hour of a car? Data on the following variables for 171 different vehicle models were
collected:
Accel Time: Acceleration time in sec.
Cargo Vol: Cargo volume in cu. ft.
HP: Horsepower
MPG: Miles per gallon
SUV: 1 if the vehicle model is an SUV with Coupe as the base when SUV and Sedan
are both 0
Sedan: 1 if the vehicle model is a sedan with Coupe as the base when SUV and Sedan
are both 0
The regression results using acceleration time as the dependent variable and the
remaining variables as the independent variables are presented below.
The various residual plots are as shown below.
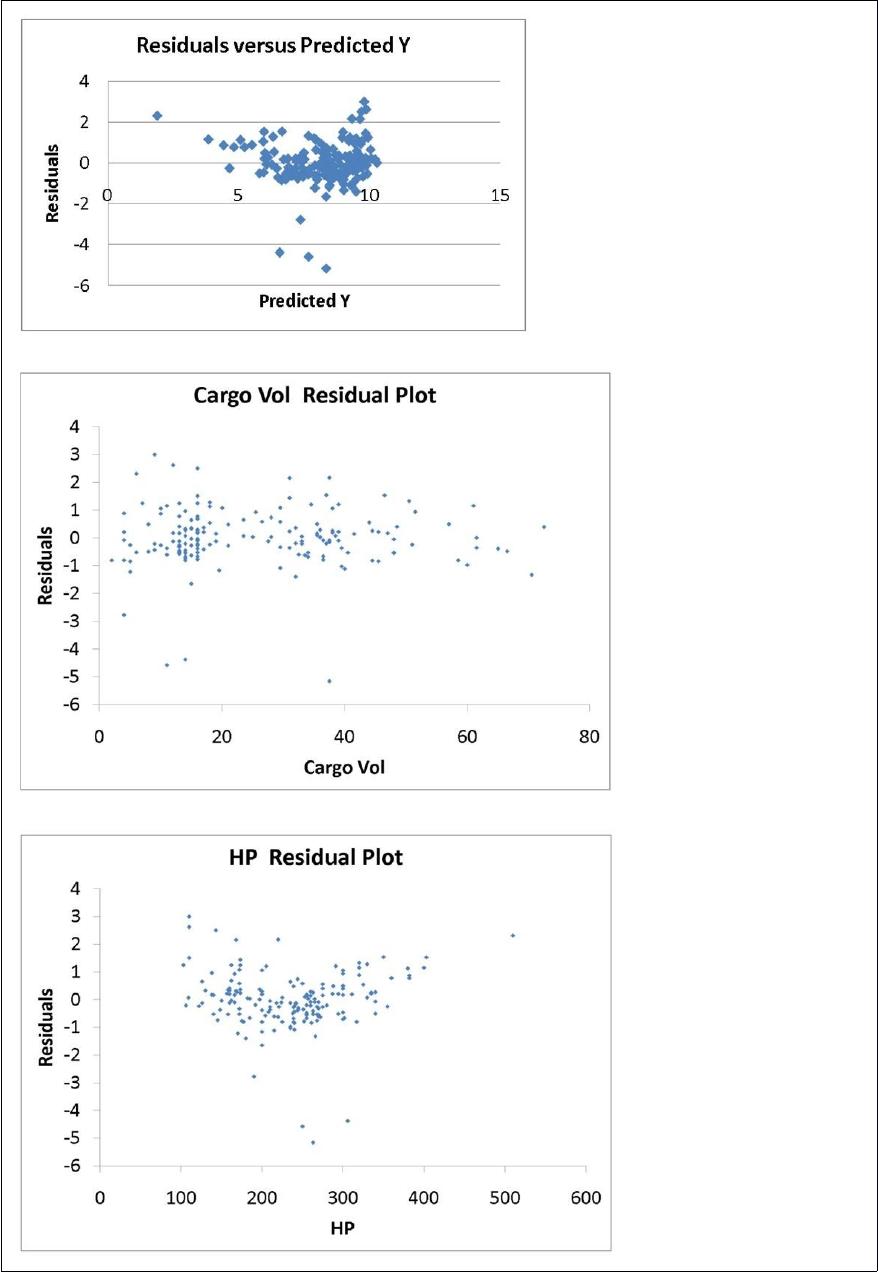
The coefficient of partial determination ( ) of each of the 5
predictors are, respectively, 0.0380, 0.4376, 0.0248, 0.0188, and 0.0312.
The coefficient of multiple determination for the regression model using each of the 5
variables Xj as the dependent variable and all other X variables as independent variables
( ) are, respectively, 0.7461, 0.5676, 0.6764, 0.8582, 0.6632.
Referring to Table 17-9, there is enough evidence to conclude that Cargo Vol makes a
significant contribution to the regression model in the presence of the other independent
variables at a 5% level of significance.
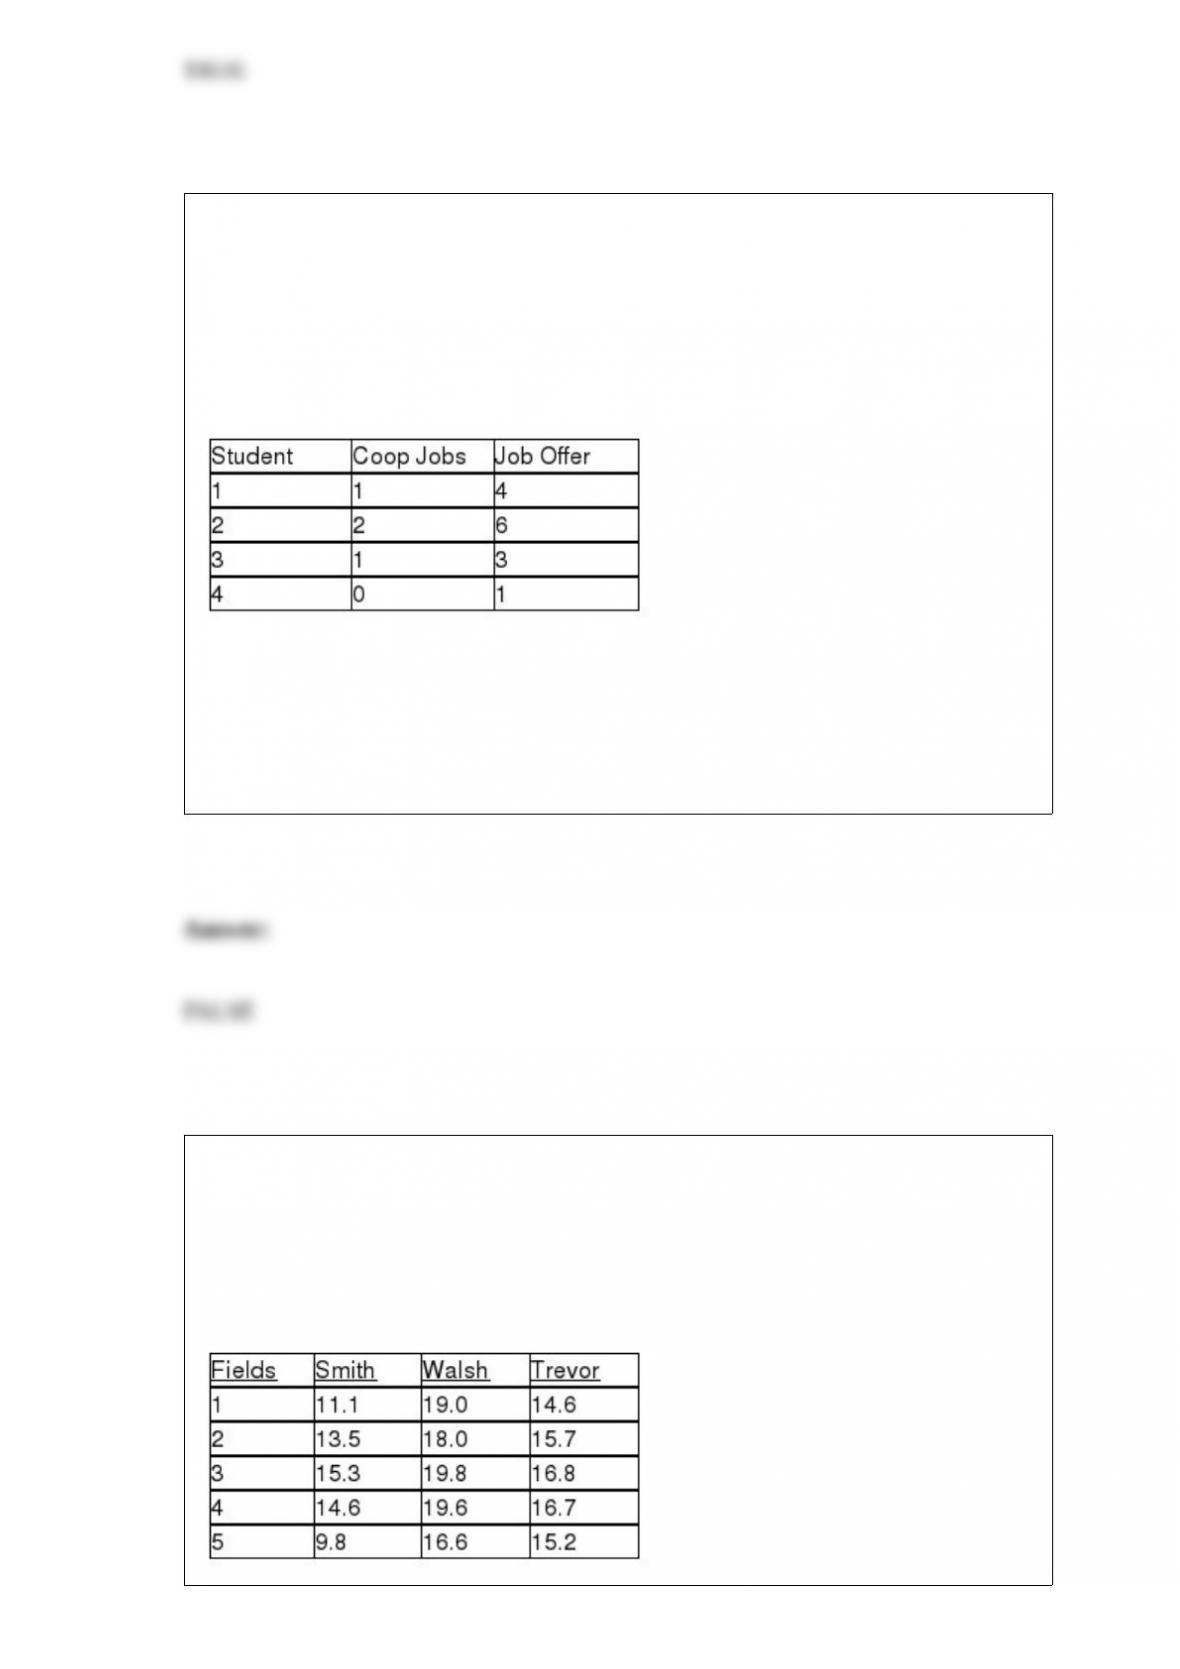
TABLE 13-3
The director of cooperative education at a state college wants to examine the effect of
cooperative education job experience on marketability in the work place. She takes a
random sample of 4 students. For these 4, she finds out how many times each had a
cooperative education job and how many job offers they received upon graduation.
These data are presented in the table below.
True or False: Referring to Table 13-3, suppose the director of cooperative education
wants to construct two 95% confidence interval estimates. One is for the mean number
of job offers received by students who have had exactly one cooperative education job
and one for students who have had two. The confidence interval for students who have
had one cooperative education job would be the wider of the two intervals.
TABLE 11-10
An agronomist wants to compare the crop yield of 3 varieties of chickpea seeds. She
plants all 3 varieties of the seeds on each of 5 different patches of fields. She then
measures the crop yield in bushels per acre. Treating this as a randomized block design,
the results are presented in the table that follows.
True or False: Referring to Table 11-10, the randomized block F test is valid only if
there is no interaction between the variety of seeds and the patches of fields.
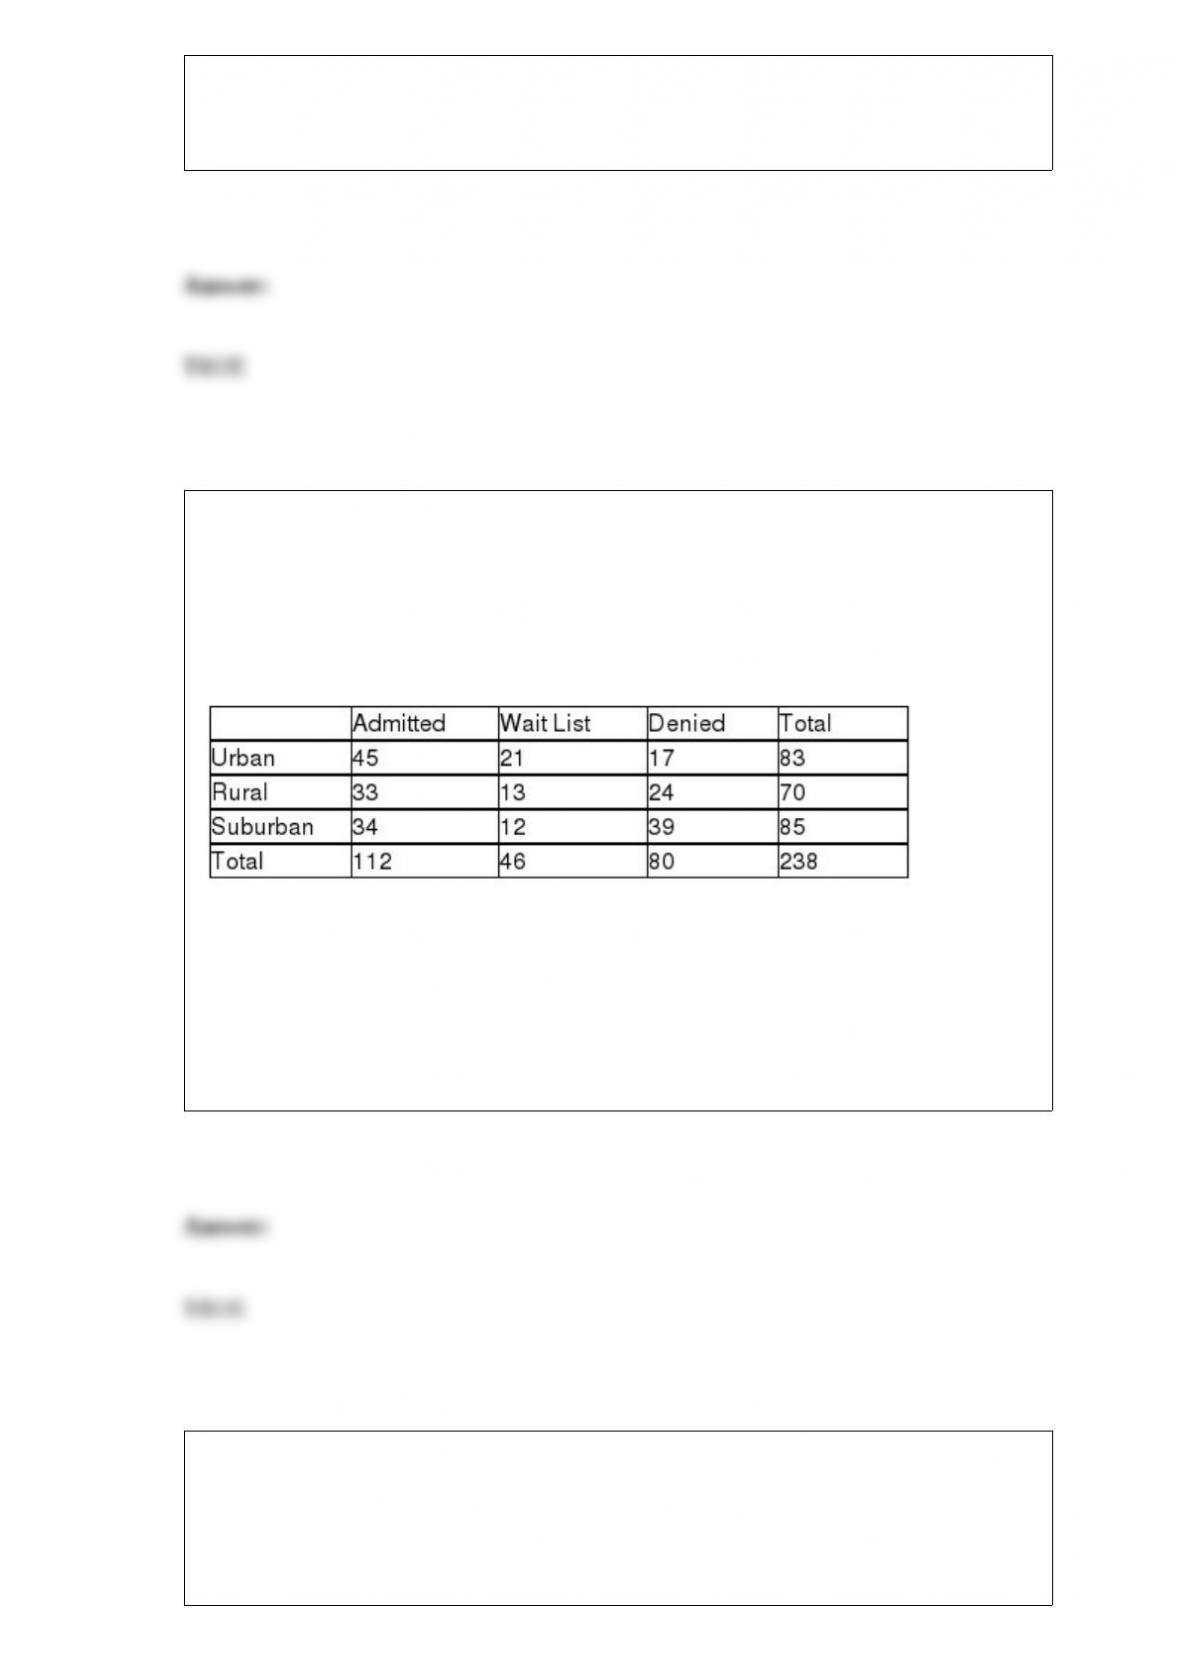
TABLE 12-11
The director of admissions at a state college is interested in seeing if admissions status
(admitted, waiting list, denied admission) at his college is independent of the type of
community in which an applicant resides. He takes a sample of recent admissions
decisions and forms the following table:
He will use this table to do a chi-square test of independence with a level of
significance of 0.01.
True or False: Referring to Table 12-11, the decision made suggests that admissions
status at the college is independent of the type of community in which an applicant
resides.
TABLE 11-11
A student team in a business statistics course designed an experiment to investigate
whether the brand of bubblegum used affected the size of bubbles they could blow. To
reduce the person-to-person variability, the students decided to use a randomized block
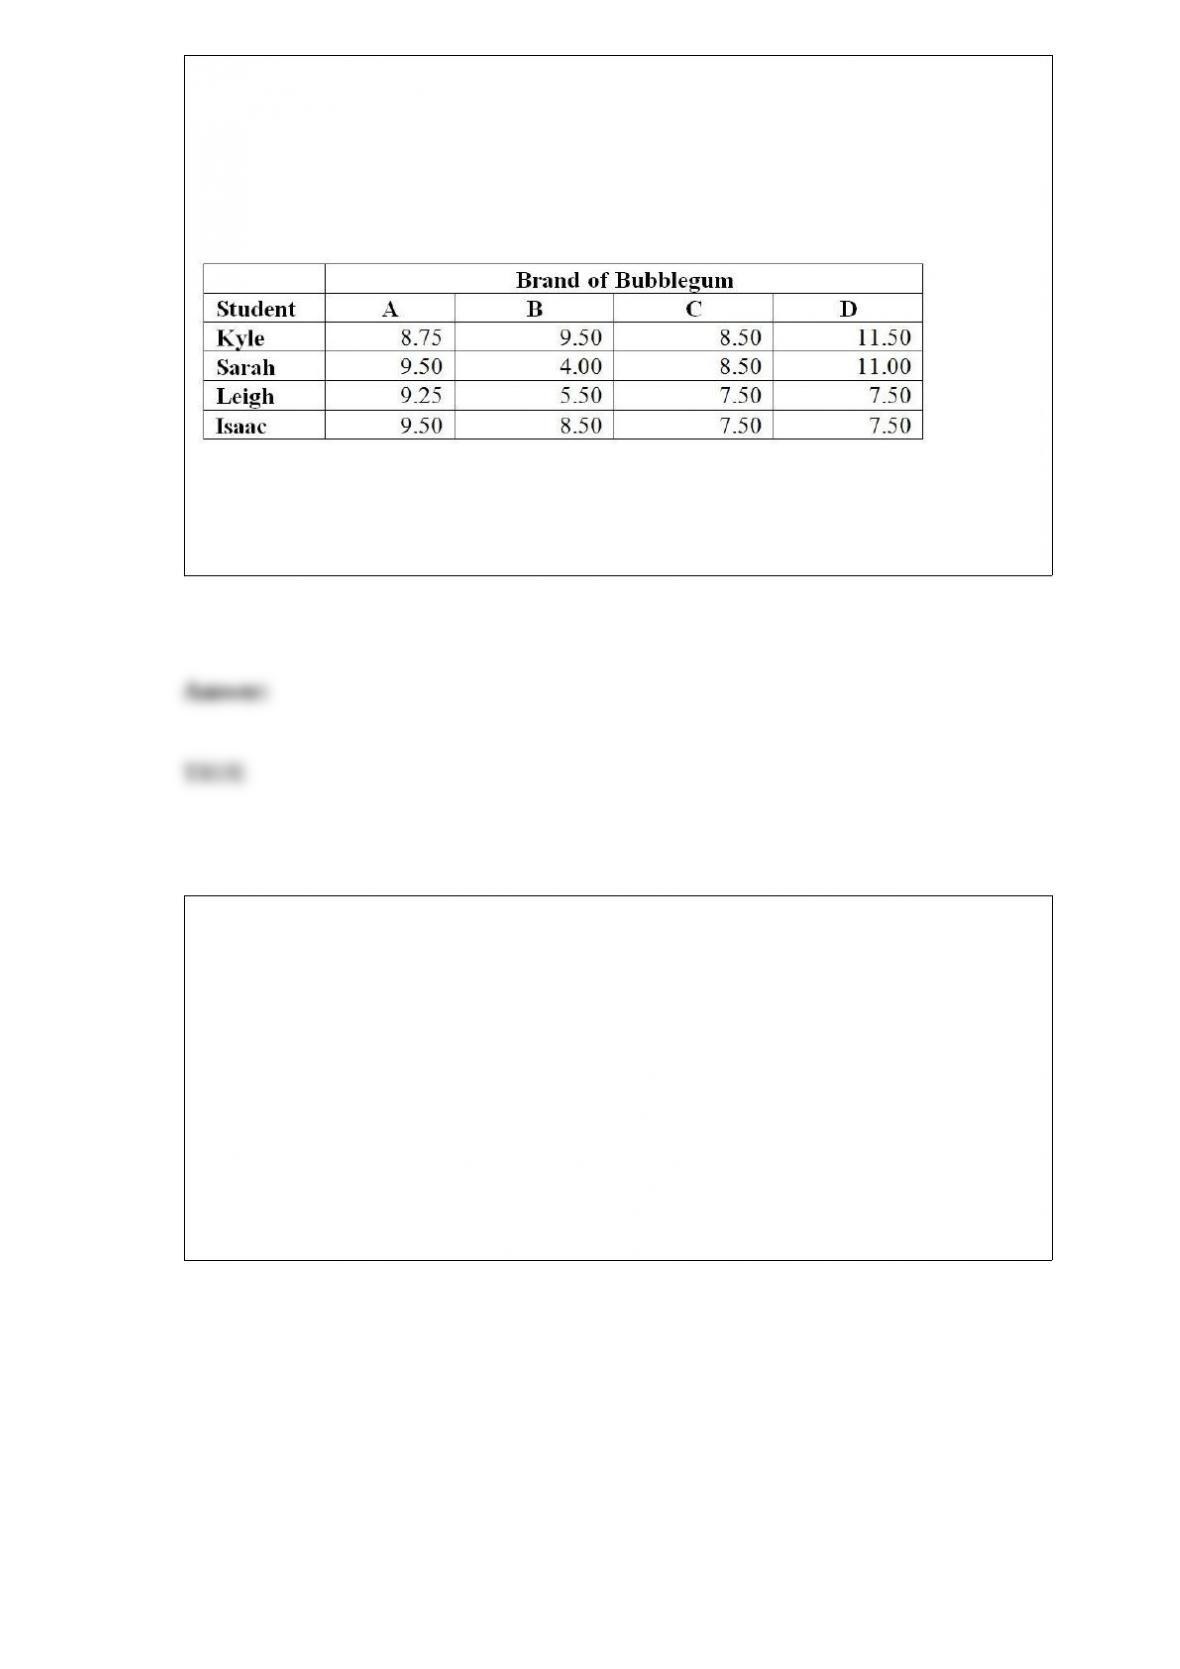
design using themselves as blocks.
Four brands of bubblegum were tested. A student chewed two pieces of a brand of gum
and then blew a bubble, attempting to make it as big as possible. Another student
measured the diameter of the bubble at its biggest point. The following table gives the
diameters of the bubbles (in inches) for the 16 observations.
True or False: Referring to Table 11-11, the randomized block F test is valid only if
there is no interaction between the diameters of the 4 brands of bubble gums and the 4
abilities of the students.
TABLE 14-15
The superintendent of a school district wanted to predict the
percentage of students passing a sixth-grade pro.ciency test. She
obtained the data on percentage of students passing the pro.ciency
test (% Passing), mean teacher salary in thousands of dollars
(Salaries), and instructional spending per pupil in thousands of dollars
(Spending) of 47 schools in the state.
Following is the multiple regression output with Y = % Passing as the
dependent variable, X1 = Salaries and X2 = Spending:
True or False: Referring to Table 14-15, you can conclude de.nitively
that mean teacher salary individually has no impact on the mean
percentage of students passing the pro.ciency test, taking into
account the e!ect of that instructional spending per pupil, at a 10%
level of signi.cance based solely on but not actually computing the
90% con.dence interval estimate for β1.
A Type II error is committed when
A) you reject a null hypothesis that is true.
B) you don’t reject a null hypothesis that is true.
C) you reject a null hypothesis that is false.
D) you don’t reject a null hypothesis that is false.
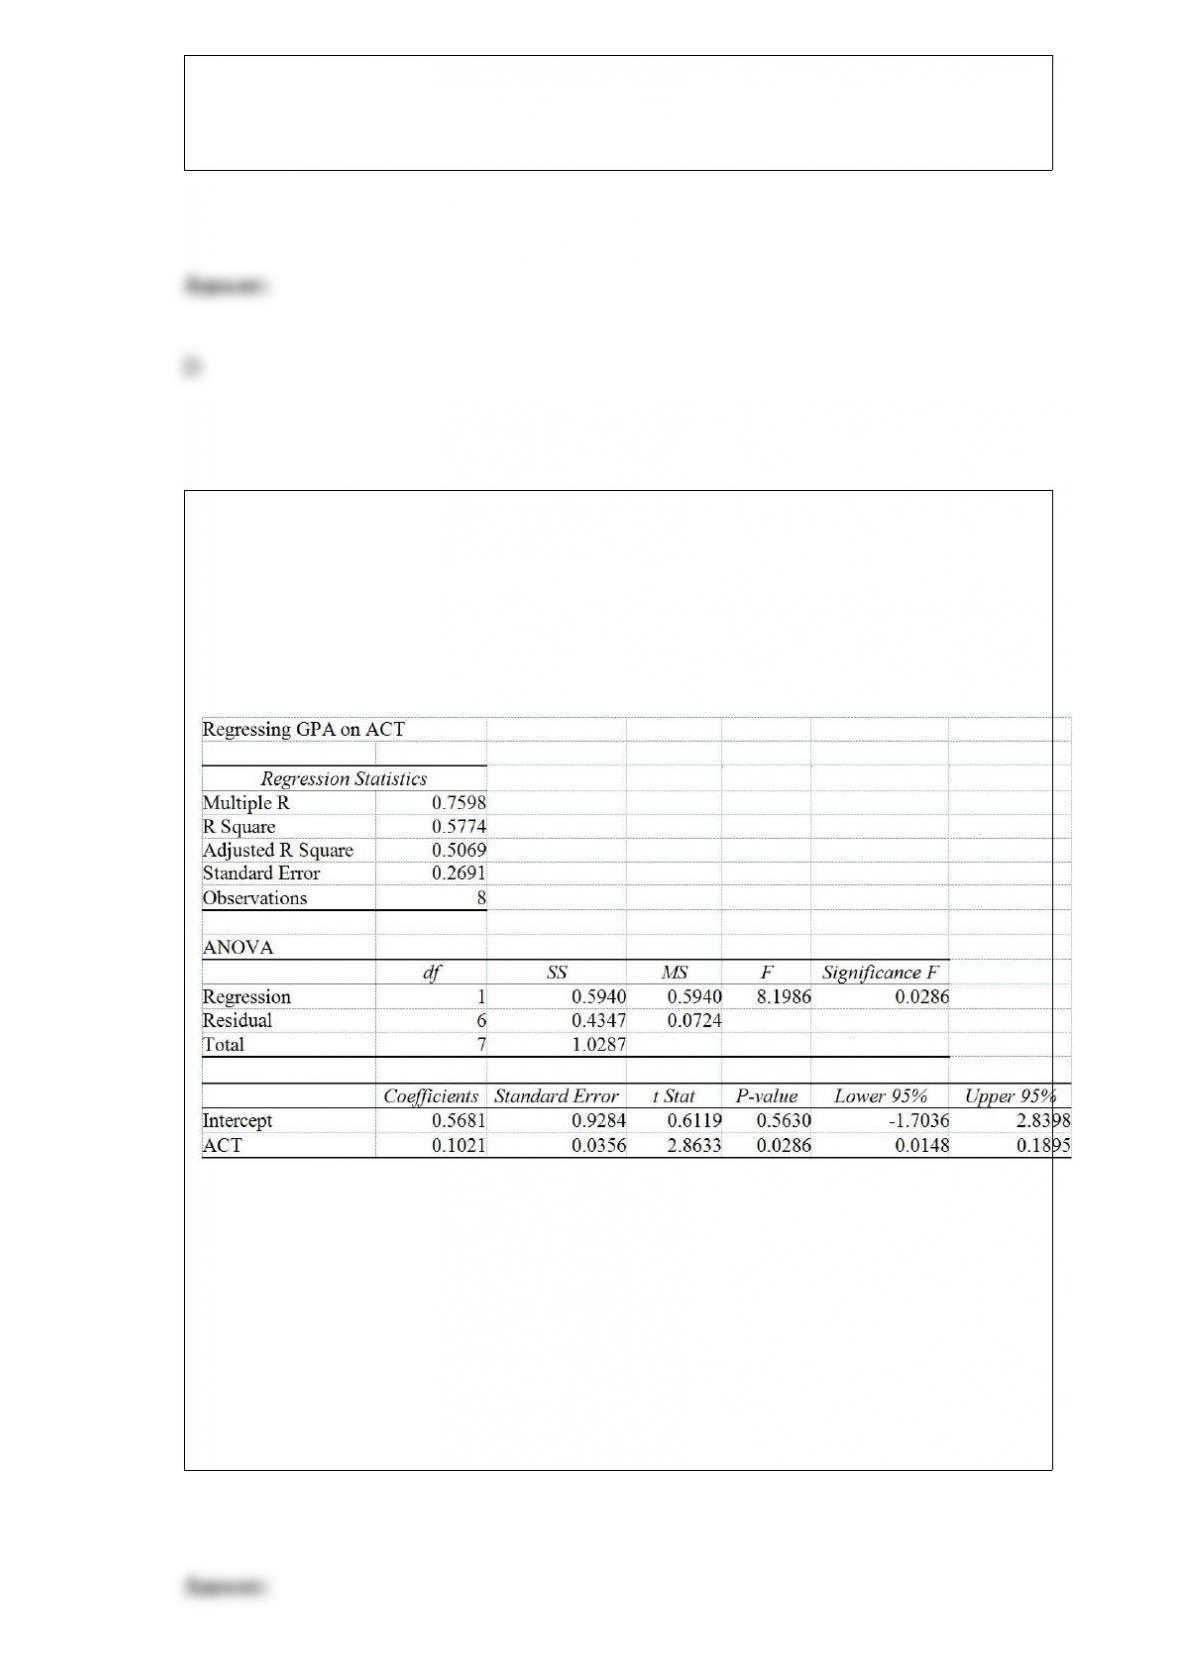
TABLE 13-8
It is believed that GPA (grade point average, based on a four point scale) should have a
positive linear relationship with ACT scores. Given below is the Excel output for
predicting GPA using ACT scores based on a data set of 8 randomly chosen students
from a Big-Ten university.
Referring to Table 13-8, what is the predicted value of GPA when ACT = 20?
A) 2.61
B) 2.66
C) 2.80
D) 3.12
If we know that the length of time it takes a college student to find a parking spot in the
library parking lot follows a normal distribution with a mean of 3.5 minutes and a
standard deviation of 1 minute, 75.8% of the college students will take more than how
many minutes when trying to find a parking spot in the library parking lot?
A) 2.8 minutes
B) 3.2 minutes
C) 3.4 minutes
D) 4.2 minutes
Data on the amount of money made in a year by 1,000 families in a small town were
collected. You want to know if the money made is normally distributed. Which of the
following would you use?
A) Bar chart
B) Scatter plot
C) Boxplot
D) Time-series plot
In perfectly symmetrical distributions, which of the following is NOT a correct
statement?

A) The distance from Q1 to Q2 equals the distance from Q2 to Q3.
B) The distance from the smallest observation to Q1 is the same as the distance from Q3
to the largest observation.
C) The distance from the smallest observation to Q2 is the same as the distance from Q2
to the largest observation.
D) The distance from Q1 to Q3 is half of the distance from the smallest to the largest
observation.
Which of the following is not true about business analytics?
A) It enables you to use statistical methods to analyze and explore data to uncover
unforeseen relationships.
B) It enables you to use management science methods to develop optimization models
that impact an organization’s strategy, planning, and operations.
C) It enables you to use complex mathematics to replace the need for organizational
decision making and problem solving.
D) It enables you to use information systems methods to collect and process data sets of
all sizes.
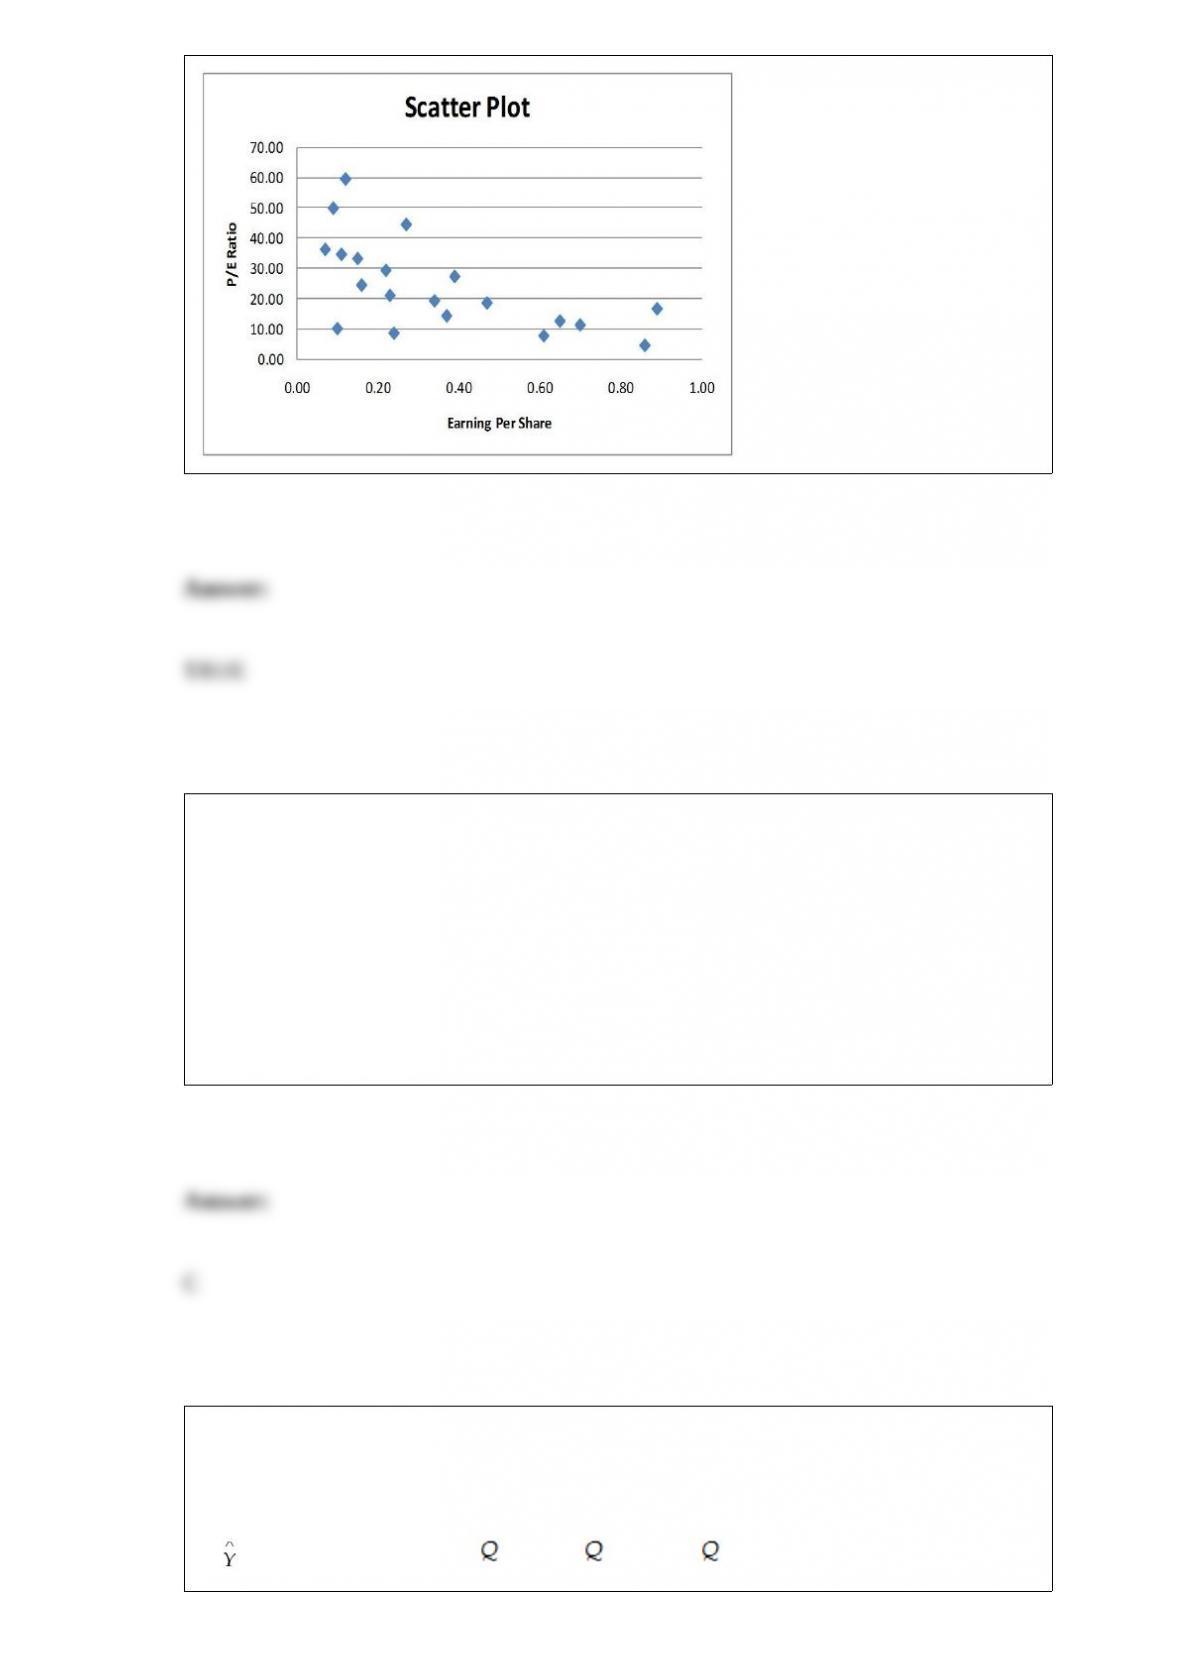
True or False: Given below is the scatter plot of the price/earnings ratio versus earnings
per share of 20 U.S. companies. There appears to be a negative relationship between
price/earnings ratio and earnings per share.
Which of the following would be an appropriate alternative hypothesis?
A) The mean of a population is equal to 55.
B) The mean of a sample is equal to 55.
C) The mean of a population is greater than 55.
D) The mean of a sample is greater than 55.
TABLE 16-14
A contractor developed a multiplicative time-series model to forecast the number of
contracts in future quarters, using quarterly data on number of contracts during the
3-year period from 2010 to 2012. The following is the resulting regression equation:
ln = 3.37 + 0.117 X – 0.083 1 + 1.28 2 + 0.617 3
where is the estimated number of contracts in a quarter
X is the coded quarterly value with X = 0 in the first quarter of 2010
1 is a dummy variable equal to 1 in the first quarter of a year and 0 otherwise
2 is a dummy variable equal to 1 in the second quarter of a year and 0 otherwise
3 is a dummy variable equal to 1 in the third quarter of a year and 0 otherwise
Referring to Table 16-14, to obtain a forecast for the fourth quarter of 2013 using the
model, which of the following sets of values should be used in the regression equation?
A) X = 15, 1 = 0, 2 = 0, 3 = 0
B) X = 15, 1 = 1, 2 = 0, 3 = 0
C) X = 16, 1 = 0, 2 = 0, 3 = 0
D) X = 16, 1 = 1, 2 = 0, 3 = 0
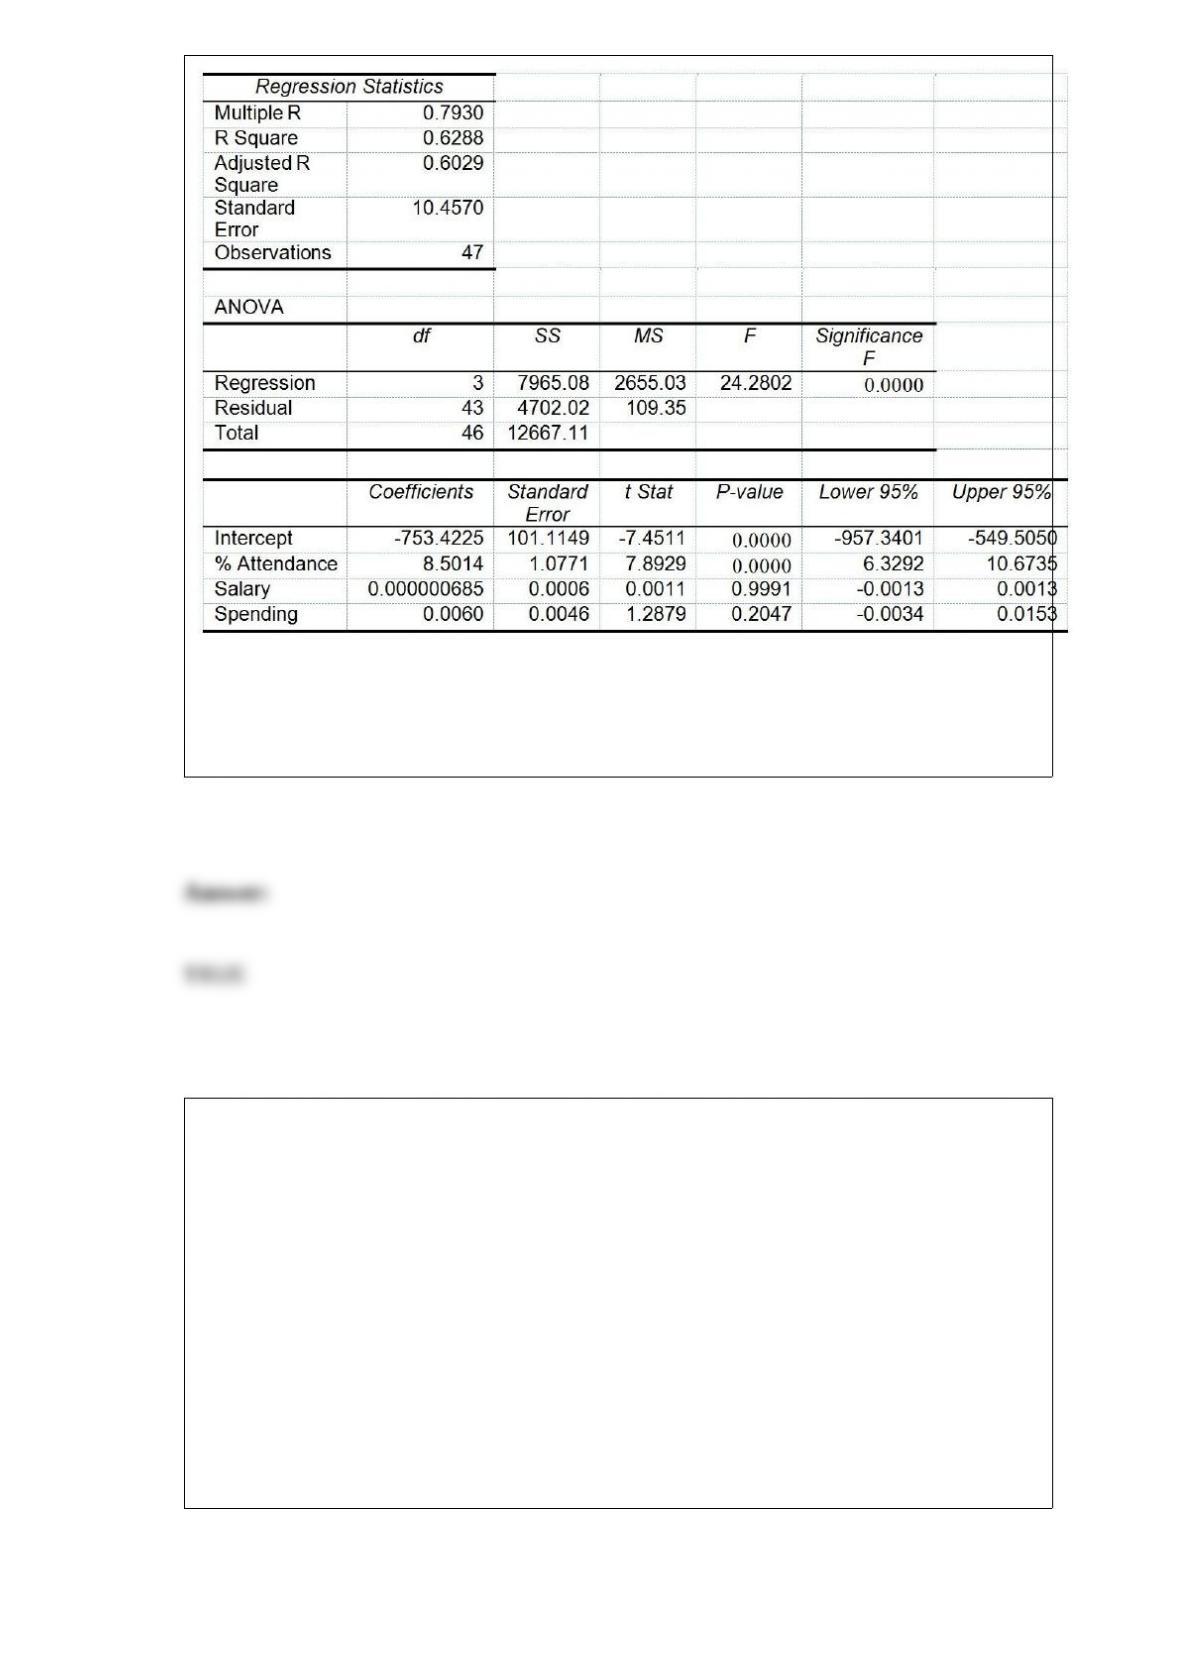
TABLE 17-8
The superintendent of a school district wanted to predict the percentage of students
passing a sixth-grade proficiency test. She obtained the data on percentage of students
passing the proficiency test (% Passing), daily mean of the percentage of students
attending class (% Attendance), mean teacher salary in dollars (Salaries), and
instructional spending per pupil in dollars (Spending) of 47 schools in the state.
Following is the multiple regression output with Y = % Passing as the dependent
variable, X1 = % Attendance, X2 = Salaries and X3 = Spending:
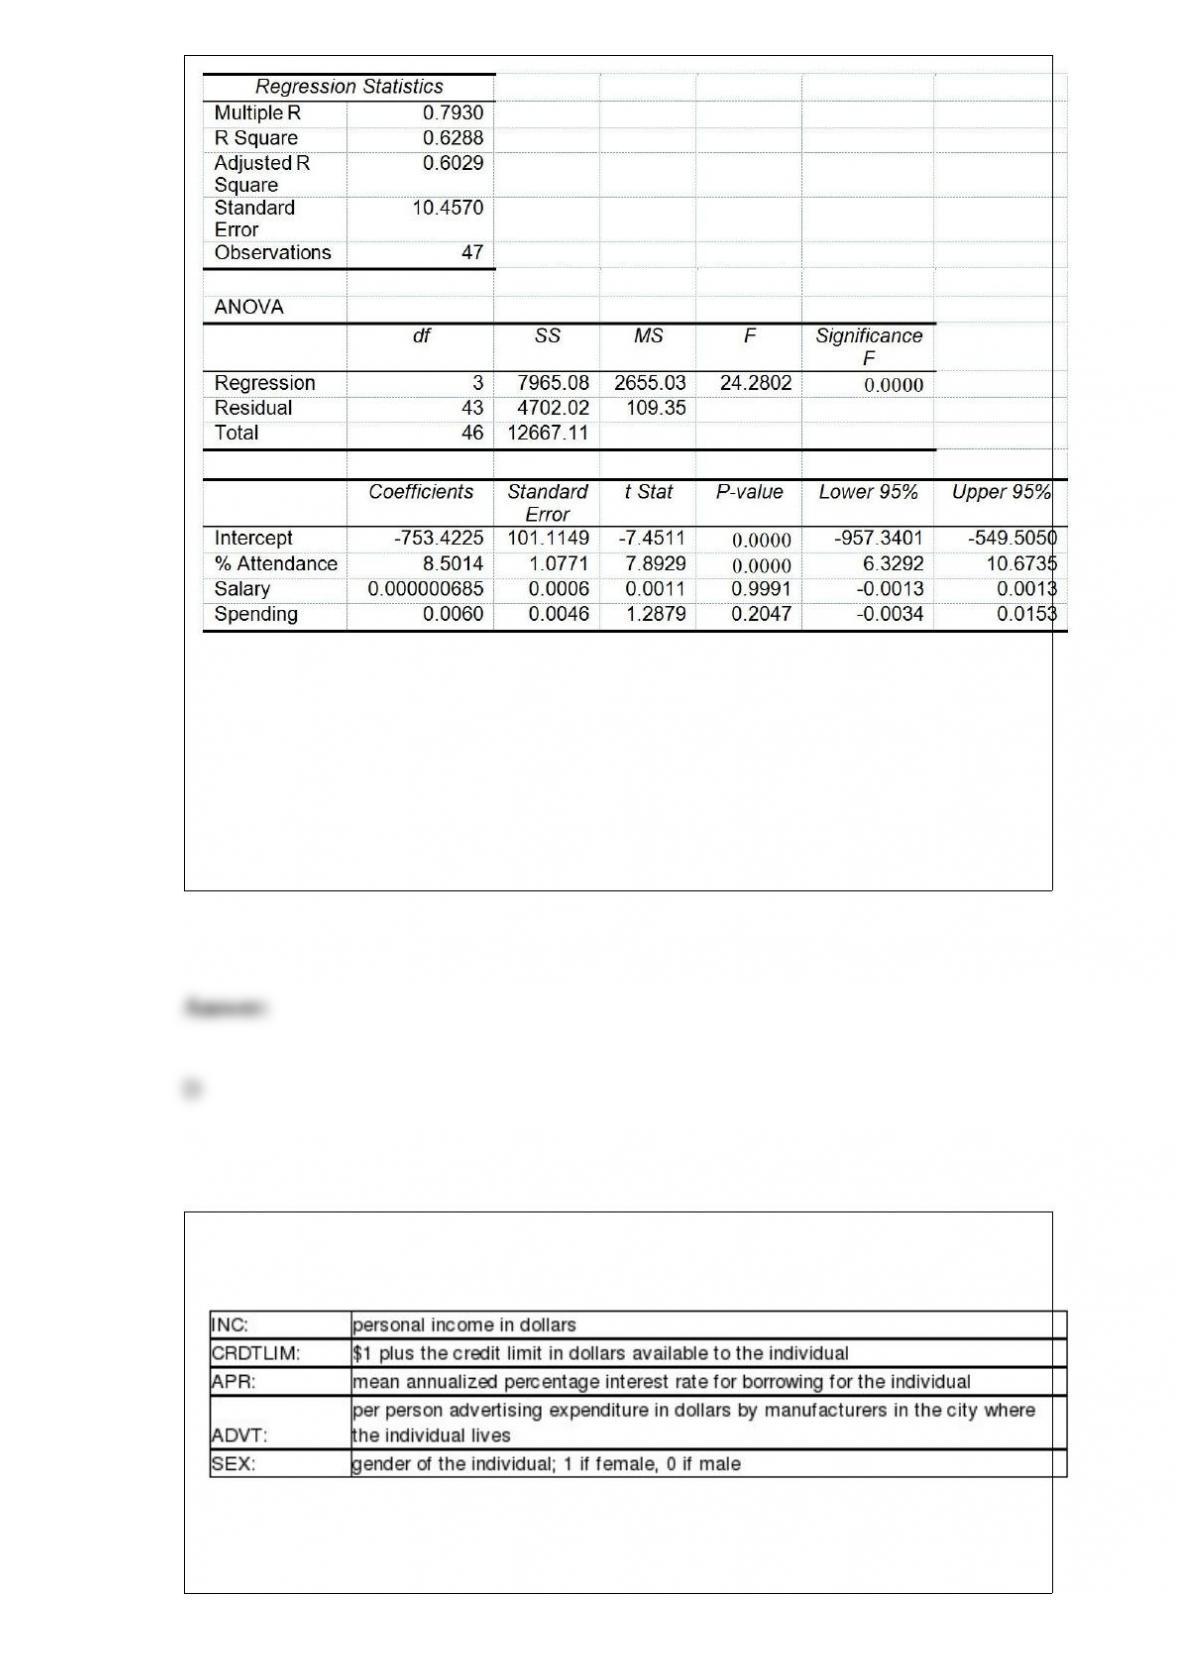
Referring to Table 17-8, which of the following is the correct alternative hypothesis to
determine whether there is a significant relationship between the percentage of students
passing the proficiency test and the entire set of explanatory variables?
A) H1 : β0 = β1 = β2 = β3 ≠0
B) H1 : β1 = β2 = β3 ≠0
C) H1 : At least one of βj ≠0 for j = 0, 1, 2, 3
D) H1 : At least one of βj ≠0 for j = 1, 2, 3
To explain personal consumption (CONS) measured in dollars, data is
collected for
A regression analysis was performed with CONS as the dependent
variable and CRDTLIM, APR, ADVT, and GENDER as the independent
variables. The estimated model was

What is the correct interpretation for the estimated coe>cient for
GENDER?
A) Holding the e!ect of the other independent variables constant,
mean personal consumption for females is estimated to be $0.39
higher than males.
B) Holding the e!ect of the other independent variables constant,
mean personal consumption for males is estimated to be $0.39
higher than females.
C) Holding the e!ect of the other independent variables constant,
mean personal consumption for females is estimated to be 0.39%
higher than males.
D) Holding the e!ect of the other independent variables constant,
mean personal consumption for males is estimated to be 0.39%
higher than females.
Referring to Table 14-10, to test the signi.cance of the multiple
regression model, what is the form of the null hypothesis?
TABLE 14-10
You worked as an intern at We Always Win Car Insurance Company
last summer. You notice that individual car insurance premiums
depend very much on the age of the individual and the number of
tra>c tickets received by the individual. You performed a regression
analysis in EXCEL and obtained the following partial information:

A) H0 : β1 = 0
B) H0 : β2= 0
C) H0 : β1 = β2 = 0
D) H0 : β0 = β1 = β2 = 0
To find out the potential impact of a new zoning law on a neighborhood, the legislators
conduct a focus group interview by inviting the members of the housing owners
association of that neighborhood. This is an example of a
A) systematic sample.
B) simple random sample.
C) judgment sample.
D) cluster sample.
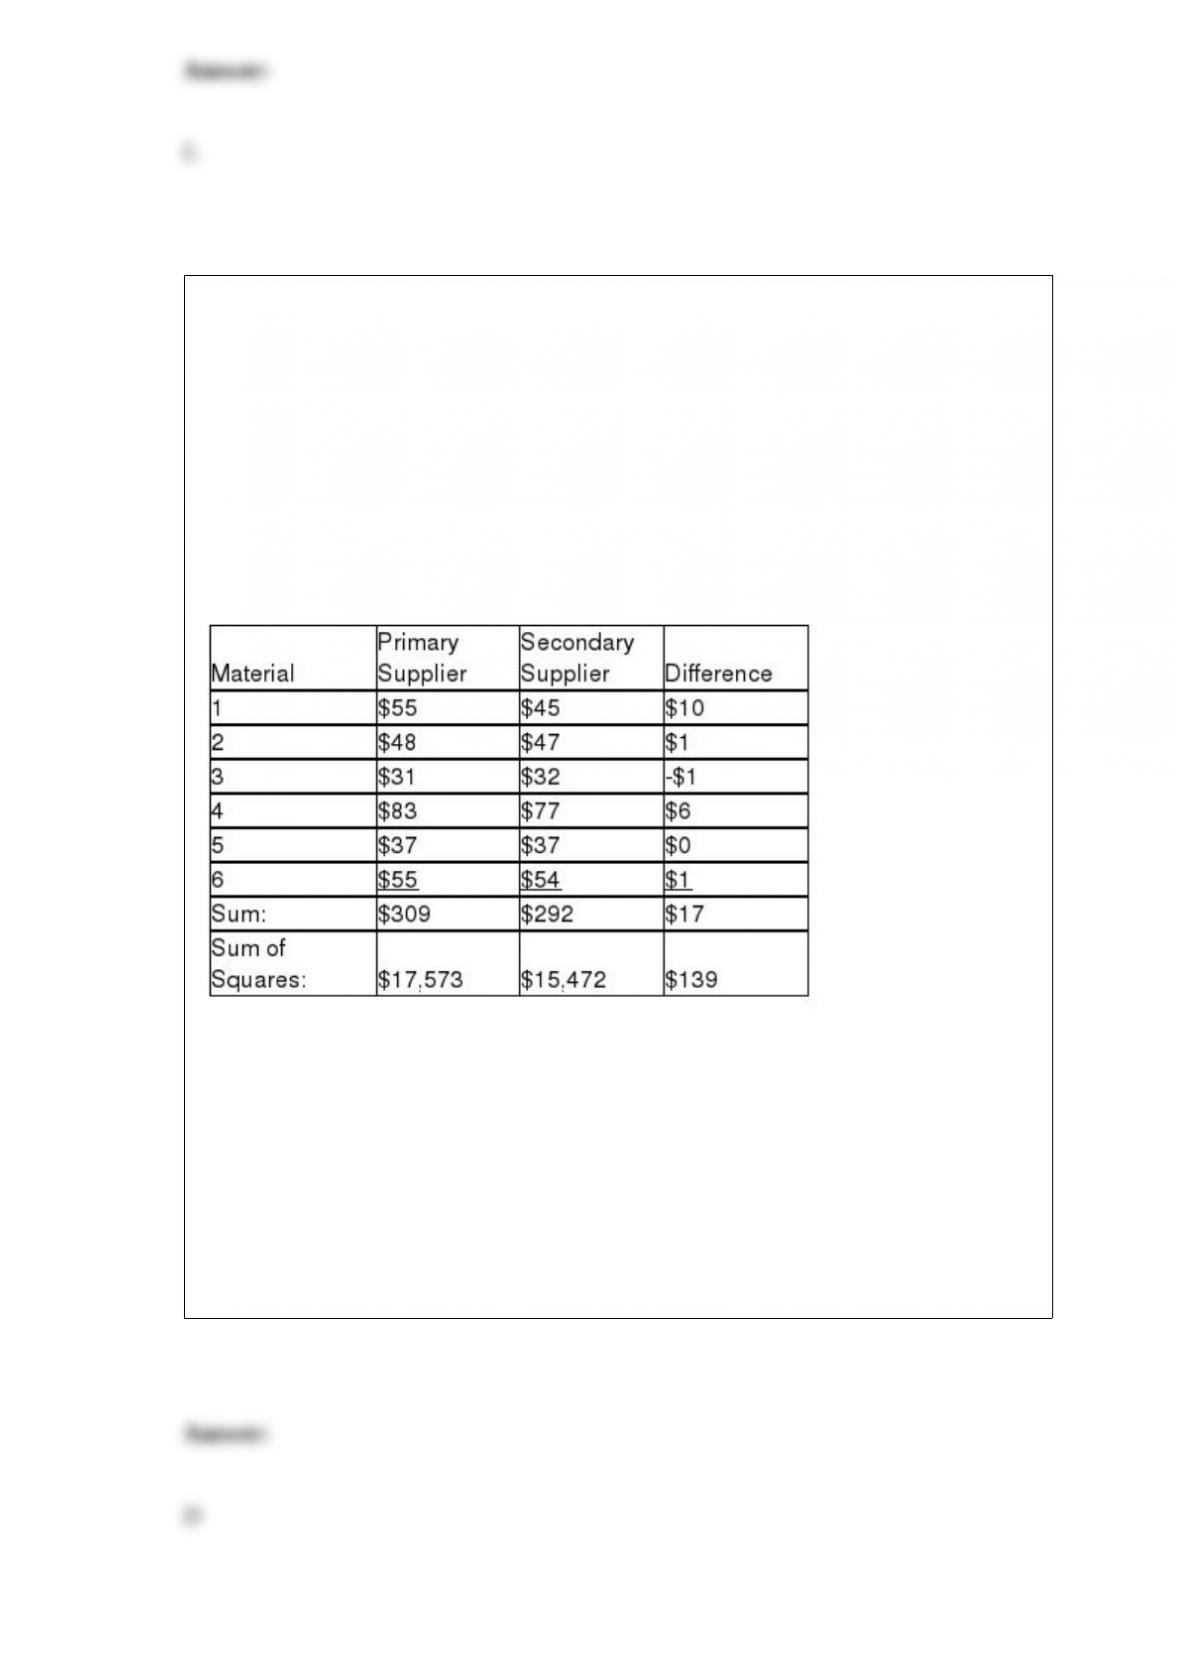
TABLE 10-7
A buyer for a manufacturing plant suspects that his primary supplier of raw materials is
overcharging. In order to determine if his suspicion is correct, he contacts a second
supplier and asks for the prices on various identical materials. He wants to compare
these prices with those of his primary supplier. The data collected is presented in the
table below, with some summary statistics presented (all of these might not be
necessary to answer the questions which follow). The buyer believes that the
differences are normally distributed and will use this sample to perform an appropriate
test at a level of significance of 0.01.
Referring to Table 10-7, the test to perform is a
A) pooled-variance t test for differences between two means.
B) separate-variance t test for differences between two means.
C) Z test for the difference between two proportions.
D) paired t test for the mean difference.
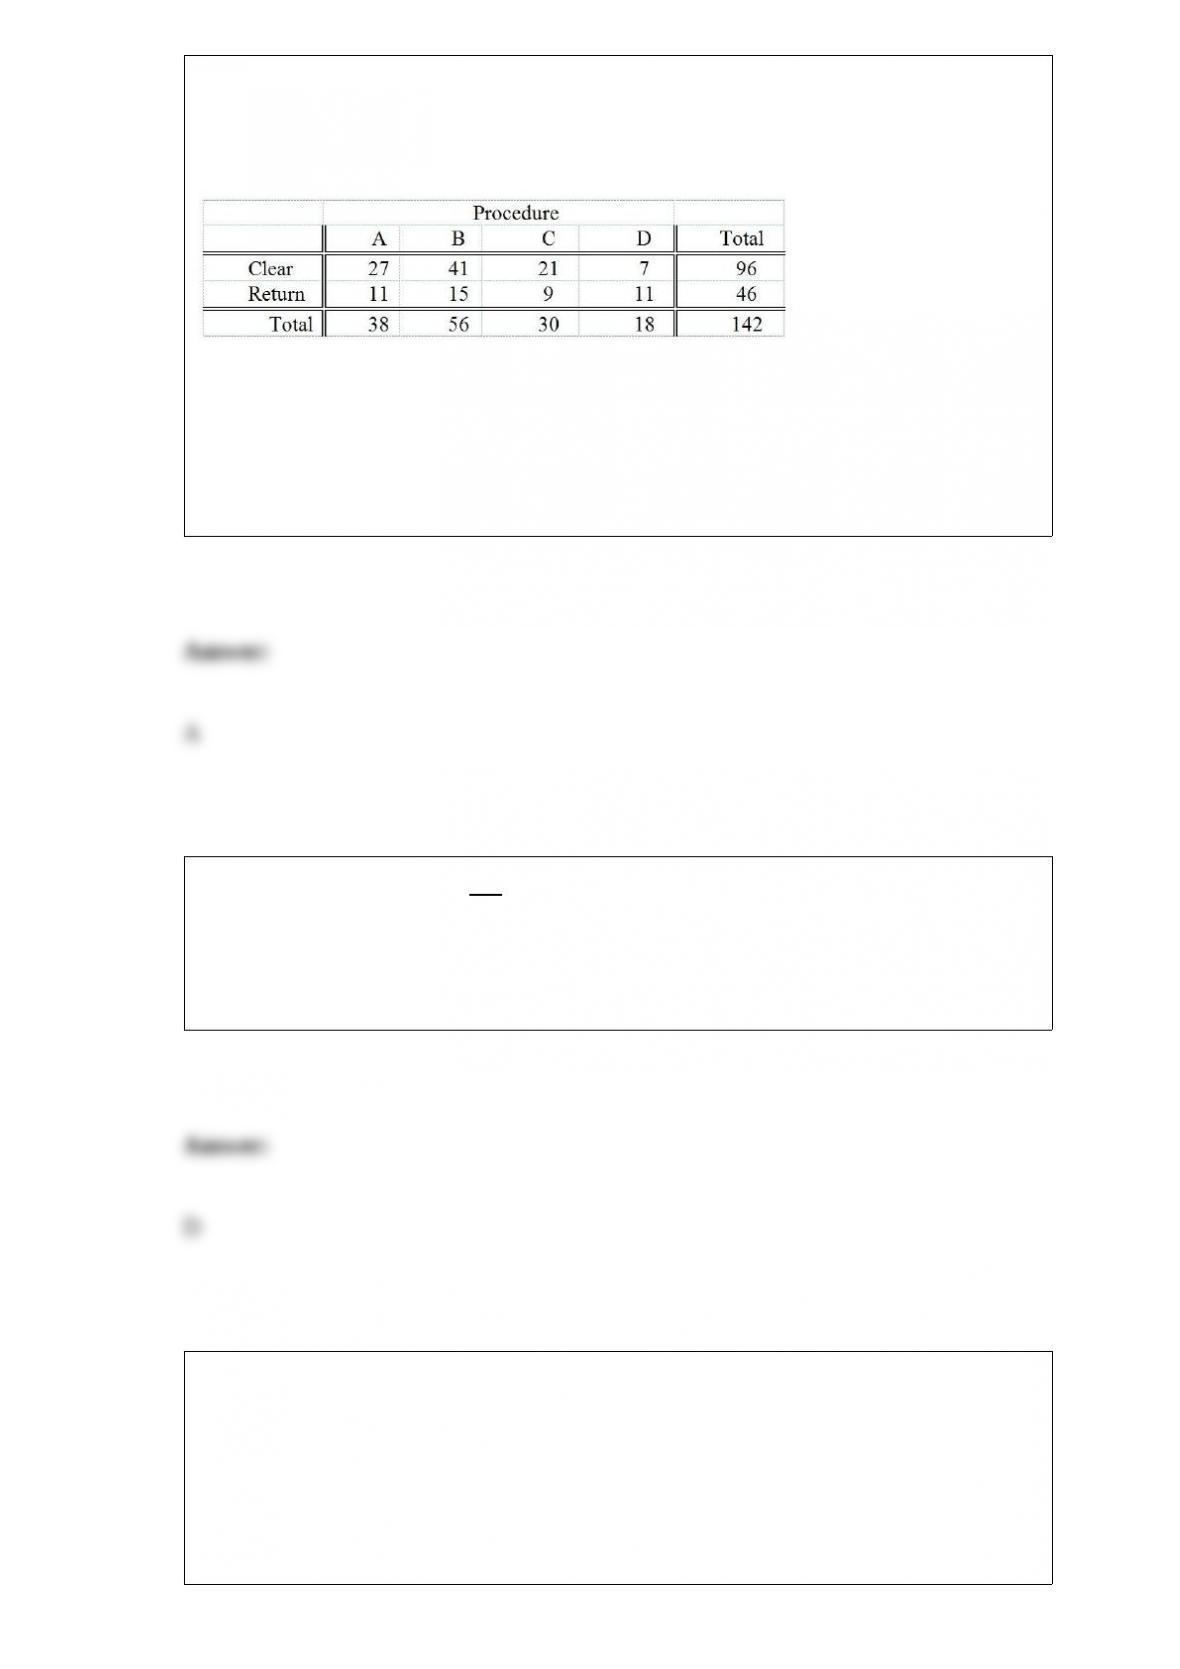
Four surgical procedures currently are used to install pacemakers. If the patient does not
need to return for follow-up surgery, the operation is called a “clear” operation. A heart
center wants to compare the 4 procedures, and collects the following numbers of
patients from their own records:
Which of the following tests will be the most appropriate to find out whether the 4
procedures are equally effective?
A) χ2 test for difference in proportions
B) Z test for difference in proportions
C) One-way ANOVA F test for differences among more than two means
D) McNemar test
Which of the following will not change a nonlinear model into a linear model?
A) Quadratic regression model
B) Logarithmic transformation
C) Square-root transformation
D) Variance inflationary factor
Which of the following would be an appropriate alternative hypothesis?
A) The population proportion is less than 0.65.
B) The sample proportion is less than 0.65.
C) The population proportion is not less than 0.65.

D) The sample proportion is not less than 0.65.
Which of the following is a “robust” test procedure against the violation of distribution
assumptions?
A) X2 test of independence
B) McNemar test for the difference between two proportions
C) X2 test for the differences among more than two proportions
D) Wilcoxon rank sum test for difference in medians
A researcher randomly sampled 30 graduates, 18 males and 12 females, of an MBA
program and recorded data concerning their starting salaries. Of primary interest to the
researcher was the effect of gender on starting salaries. Statistics of the mean salaries of
the females and males in the sample were computed. The sample standard deviations
suggest that the variability of starting salaries of the two groups is almost the same.
Suppose the starting salaries from both groups can be considered as normally
distributed. Which of the following tests will be the most appropriate?
A) Pooled-variance t test
B) Separate-variance t test
C) Paired t test
D) Wilcoxon rank sum test.
Referring to Table 14-16, what is the correct interpretation for the estimated coefficient
for X1?
A) As the 0 to 60 miles per hour acceleration time increases by one second, the mean
engine size will decrease by an estimated 0.0005 c.c. without taking into consideration
the other independent variable included in the model.
B) As the engine size increases by one c.c., the mean 0 to 60 miles per hour acceleration
time will decrease by an estimated 0.0005 seconds without taking into consideration the
other independent variable included in the model.
C) As the 0 to 60 miles per hour acceleration time increases by one second, the mean
engine size will decrease by an estimated 0.0005 c.c. taking into consideration the other
independent variable included in the model.
D) As the engine size increases by one c.c., the mean 0 to 60 miles per hour
acceleration time will decrease by an estimated 0.0005 seconds taking into
consideration the other independent variable included in the model.
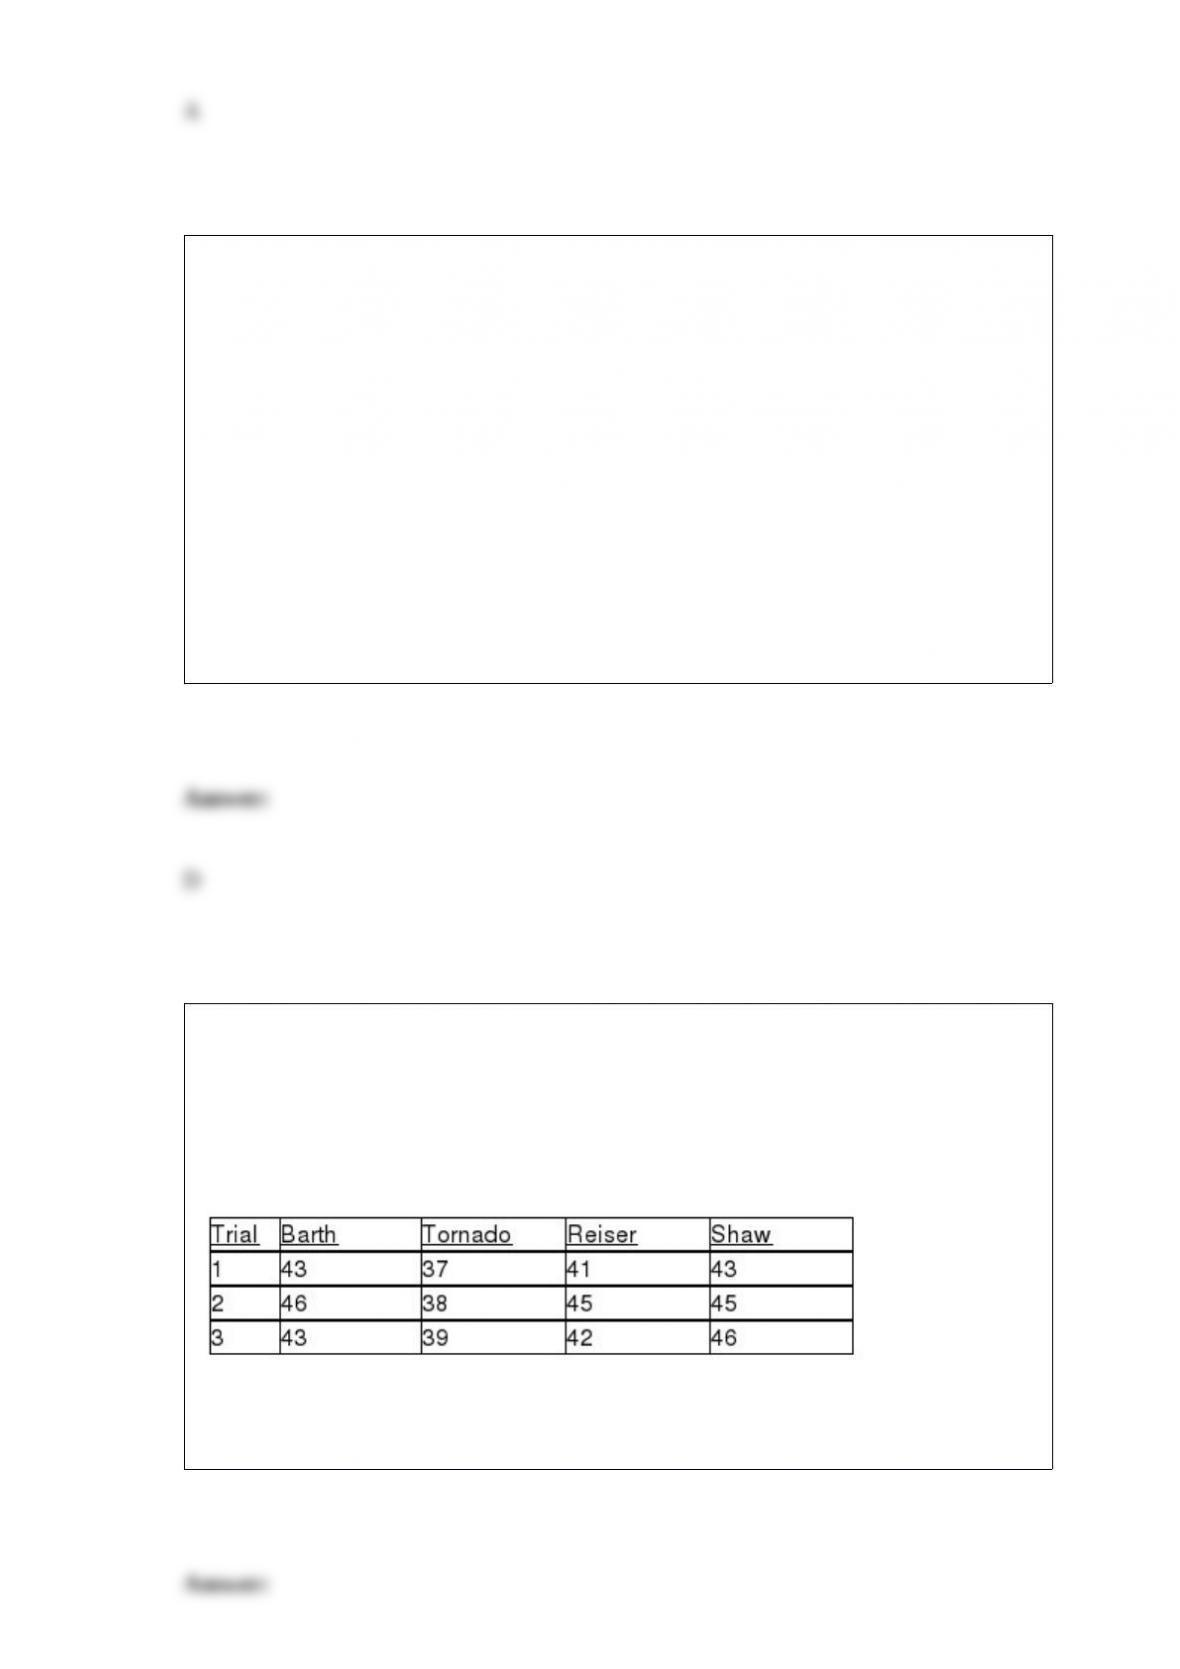
TABLE 12-16
As part of an evaluation program, a sporting goods retailer wanted to compare the
downhill coasting speeds of 4 brands of bicycles. She took 3 of each brand and
determined their maximum downhill speeds. The results are presented in miles per hour
in the table below.
Referring to Table 12-16, the calculation of the Kruskal-Wallis test statistic H involves
ranking the observations. Construct a table containing these ranks.
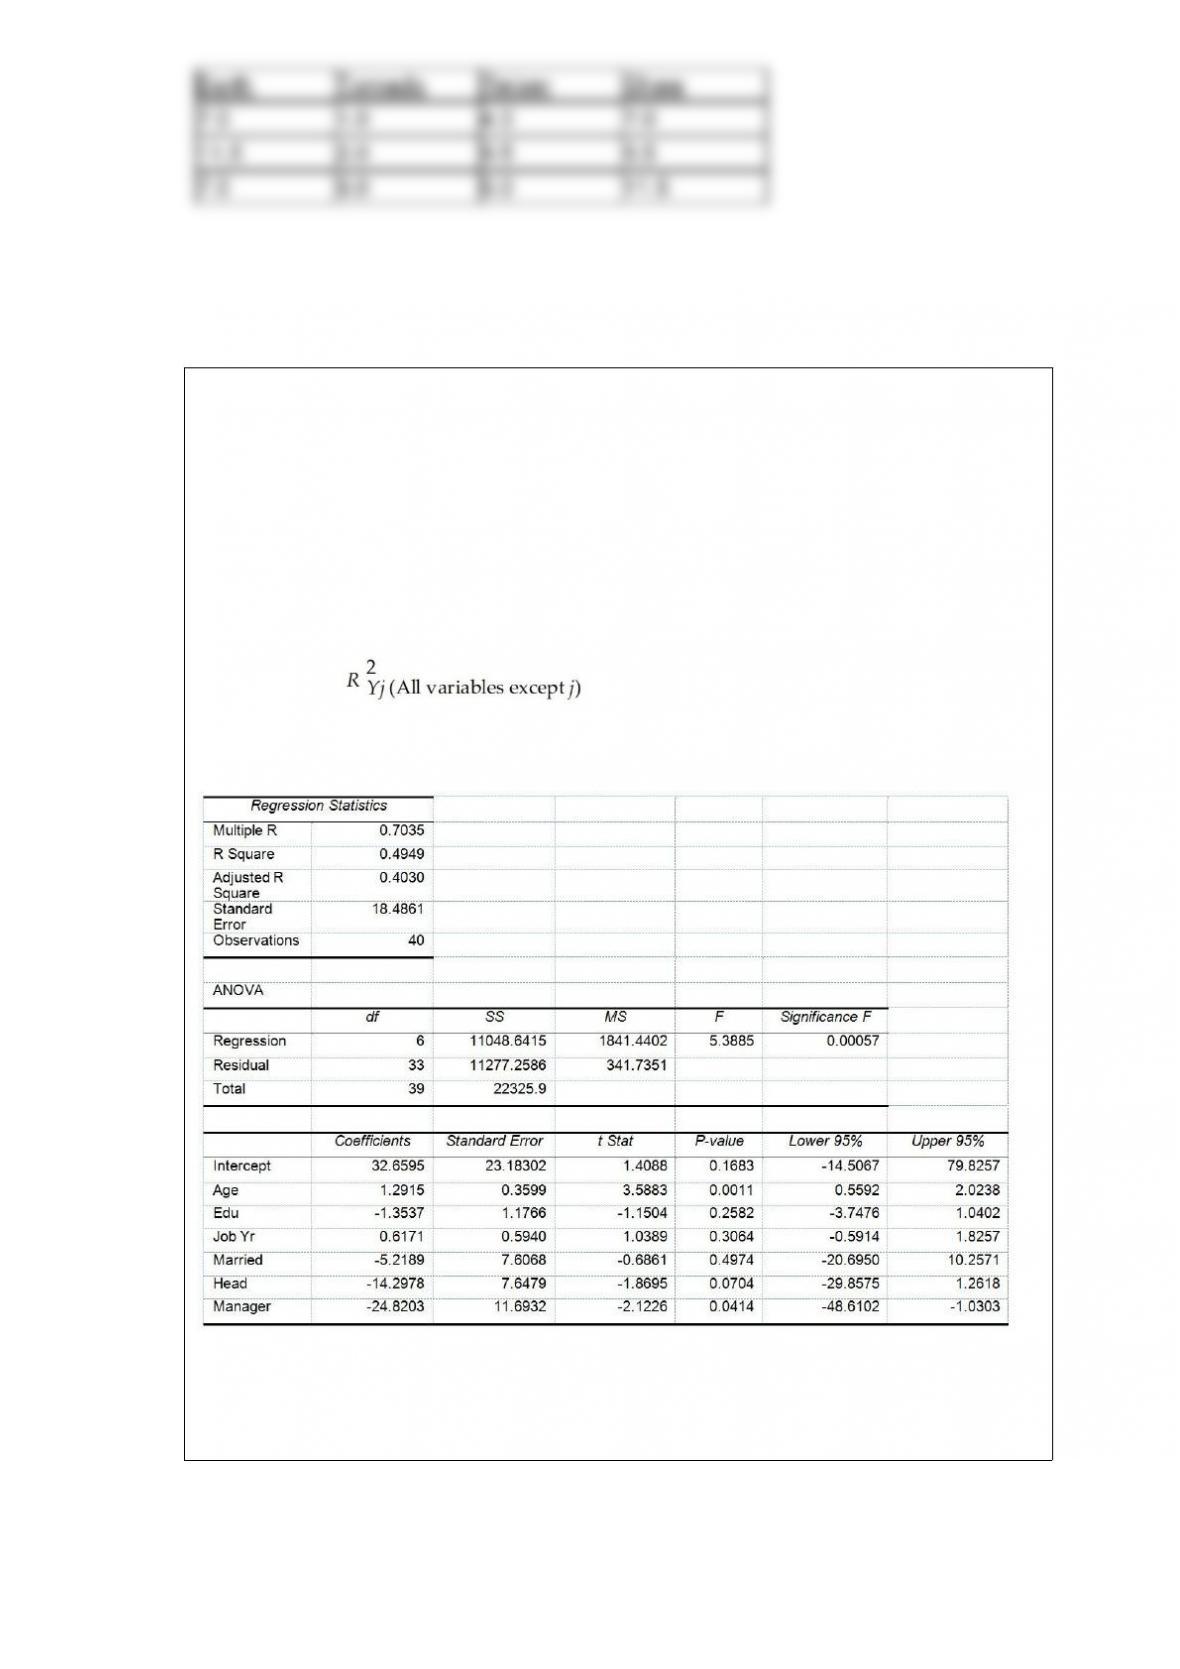
TABLE 17-10
Given below are results from the regression analysis where the dependent variable is
the number of weeks a worker is unemployed due to a layoff (Unemploy) and the
independent variables are the age of the worker (Age), the number of years of education
received (Edu), the number of years at the previous job (Job Yr), a dummy variable for
marital status (Married: 1 = married, 0 = otherwise), a dummy variable for head of
household (Head: 1 = yes, 0 = no) and a dummy variable for management position
(Manager: 1 = yes, 0 = no). We shall call this Model 1. The coefficient of partial
determination ( ) of each of the 6 predictors are, respectively,
0.2807, 0.0386, 0.0317, 0.0141, 0.0958, and 0.1201.
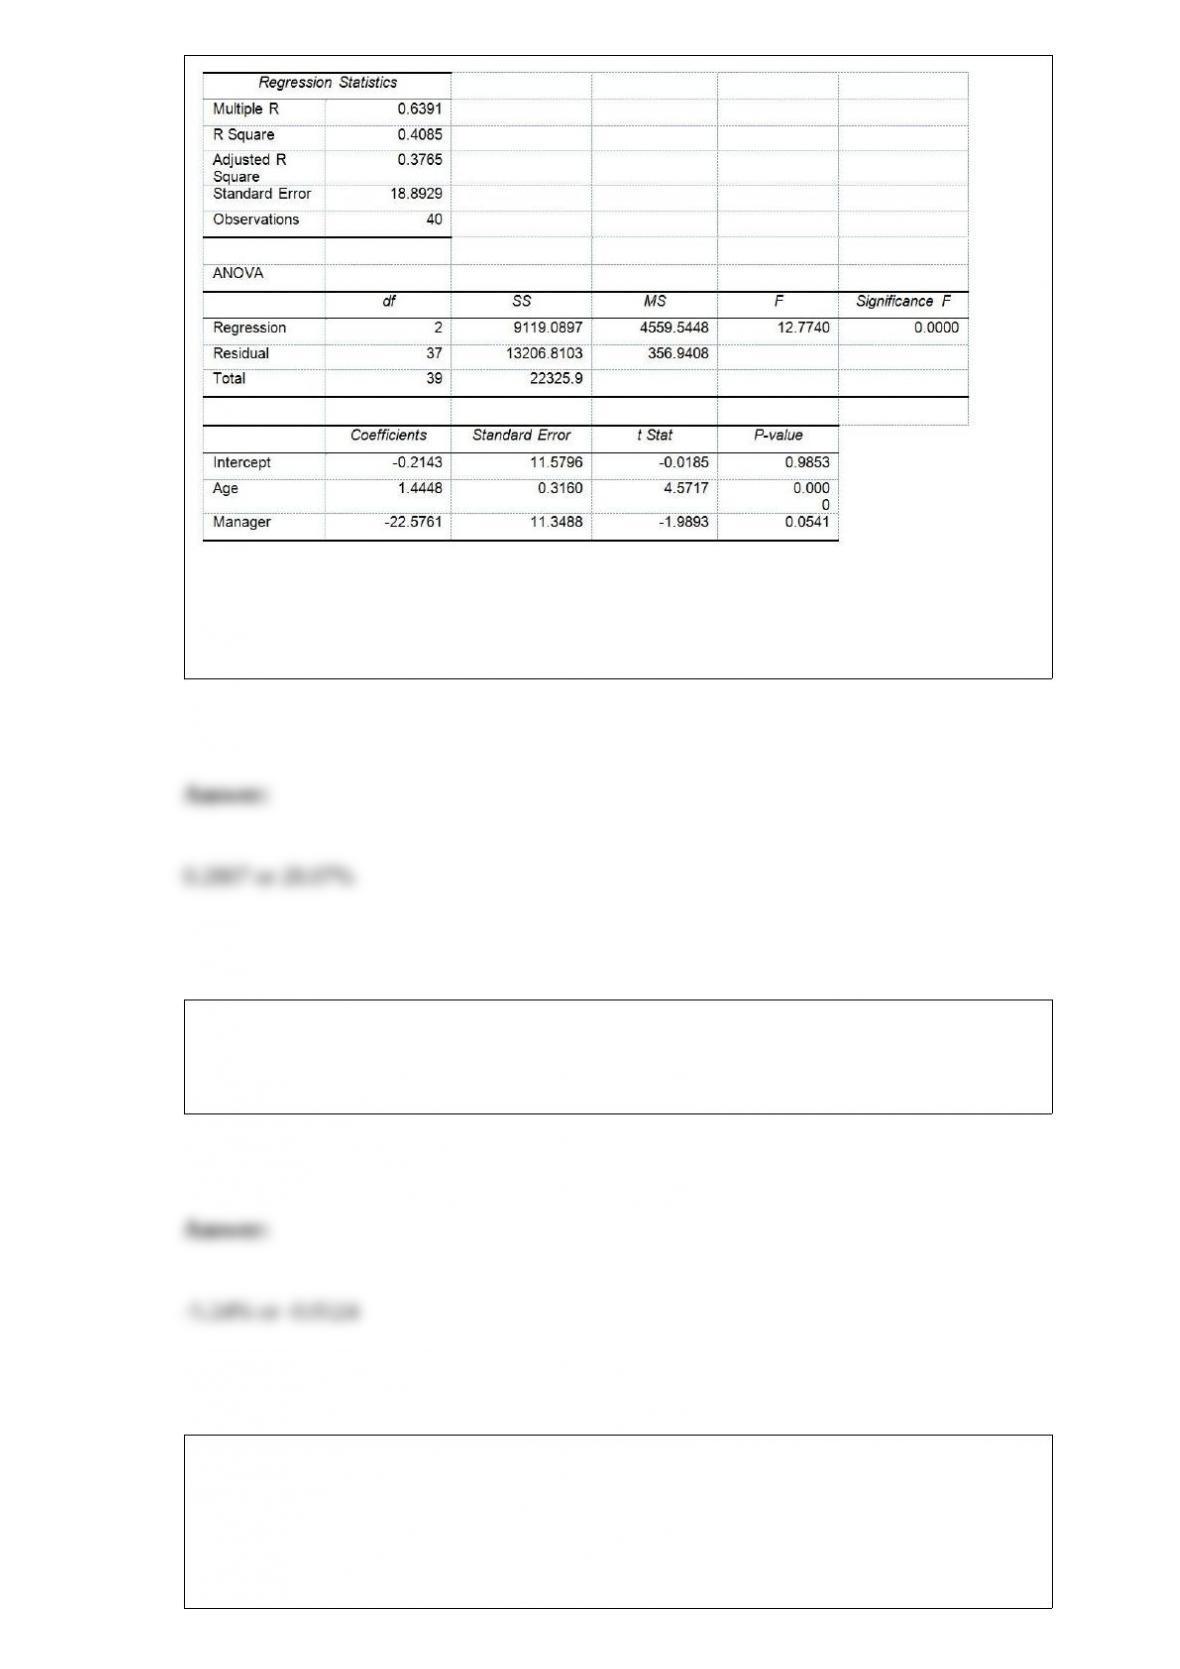
Model 2 is the regression analysis where the dependent variable is Unemploy and the
independent variables are Age and Manager. The results of the regression analysis are
given below:
Referring to Table 17-10, Model 1, ________ of the variation in the number of weeks a
worker is unemployed due to a layoff can be explained by the age of the worker while
controlling for the other independent variables.
The 12-month rate of returns over a three-year period of a particular stock is 0.099,
-0.289, and 0.089. The geometric mean rate of return per year for this stock is
________.
TABLE 7-5
According to an article, 19% of the entire population in a developing country has
high-speed access to the Internet. Random sample sizes of 200 are selected from the
country’s population.
Referring to Table 7-5, among all the random sample sizes of 200, ________% will
have between 9% and 29% who have high-speed access to the Internet.
The Human Resources Director of a large corporation wishes to develop an employee
benefits package and decides to select 500 employees from a list of all (N = 40,000)
workers in order to study their preferences for the various components of a potential
package. The 500 employees who will participate in this study constitute the ________.
There are 10 finalists at a national dog show. How many different orders of finishing
can there be for all the 10 finalists?
TABLE 13-10
The management of a chain electronic store would like to develop a model for
predicting the weekly sales (in thousands of dollars) for individual stores based on the
number of customers who made purchases. A random sample of 12 stores yields the
following results:
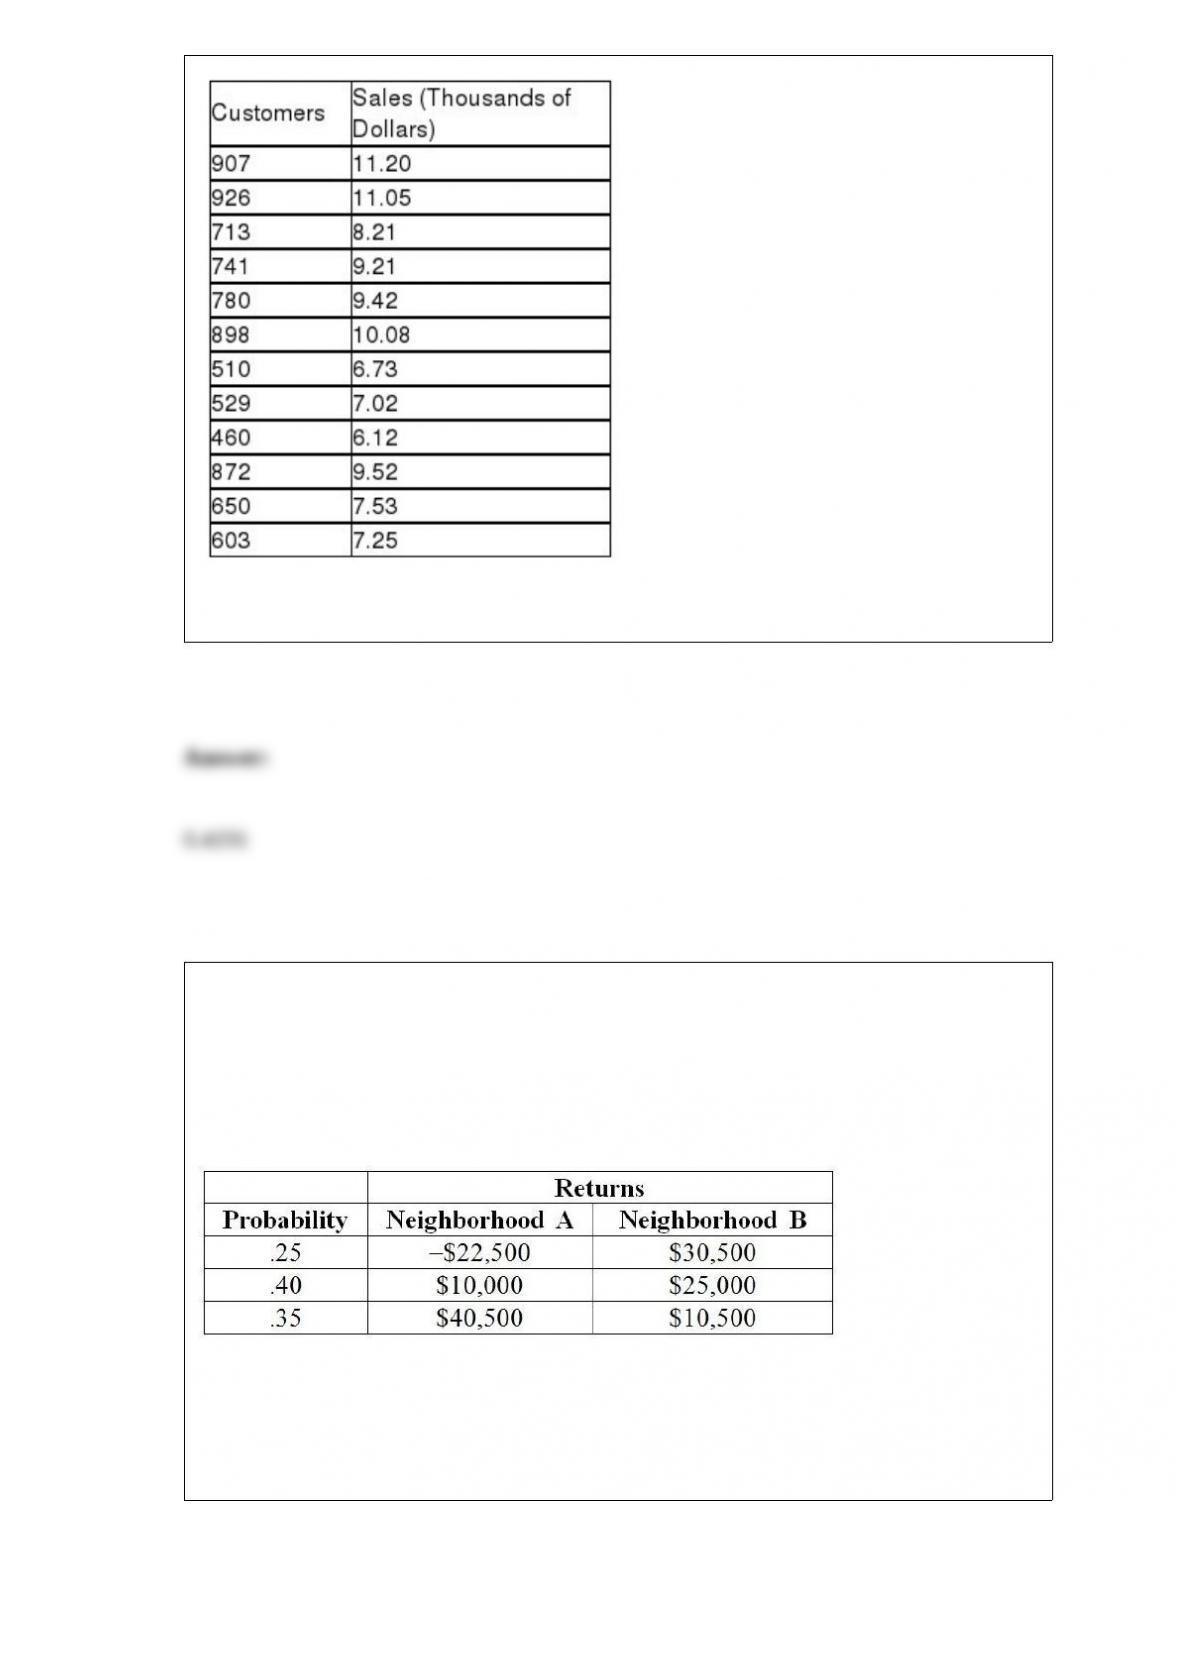
Referring to Table 13-10, what is the value of the standard error of the estimate?
TABLE 5-7
There are two houses with almost identical characteristics available for investment in
two different neighborhoods with drastically different demographic composition. The
anticipated gain in value when the houses are sold in 10 years has the following
probability distribution:
Referring to Table 5-7, if your investment preference is to maximize your expected
return and not worry at all about the risk that you have to take, will you choose a
portfolio that will consist of 10%, 30%, 50%, 70%, or 90% of your money on the house
in neighborhood A and the remaining on the house in neighborhood B?
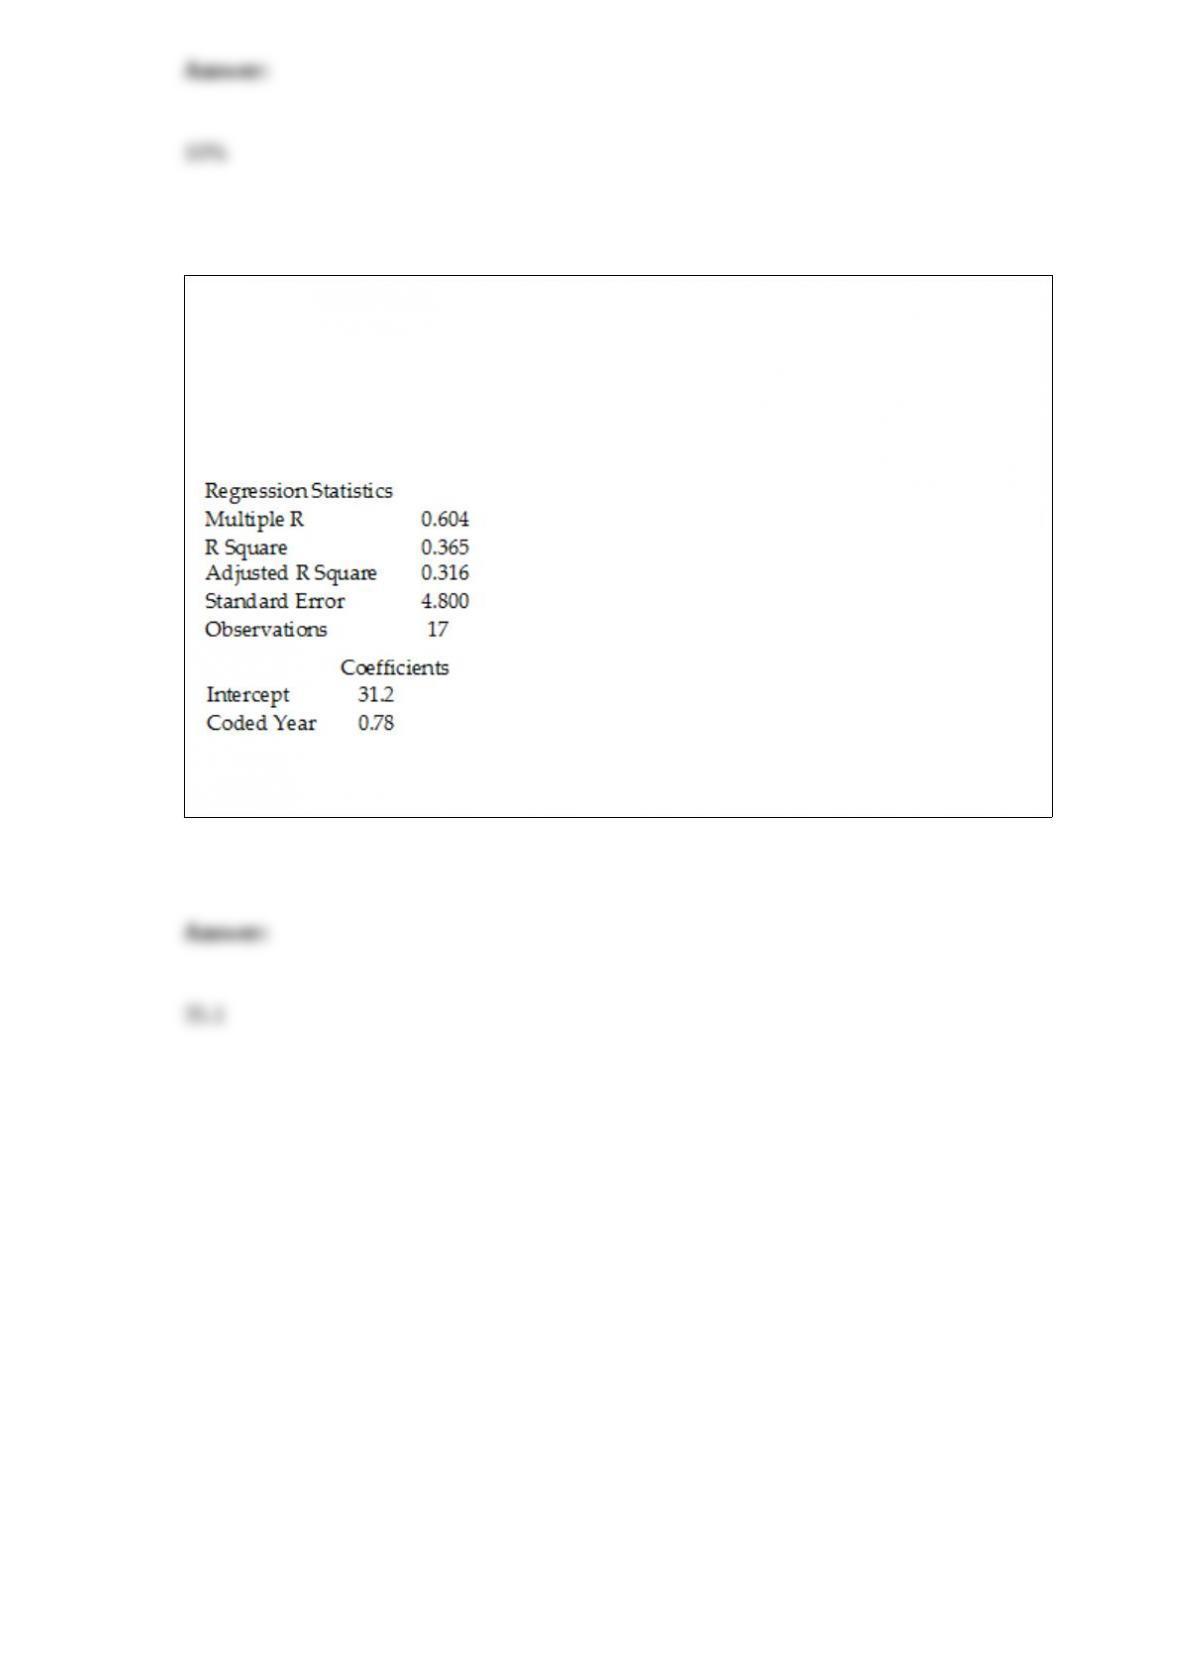
TABLE 16-6
The president of a chain of department stores believes that her stores’ total sales have
been showing a linear trend since 1993. She uses Microsoft Excel to obtain the partial
output below. The dependent variable is sales (in millions of dollars), while the
independent variable is coded years, where 1993 is coded as 0, 1994 is coded as 1, etc.
SUMMARY OUTPUT
Referring to Table 16-6, the fitted trend value (in millions of dollars) for 1998 is
________.