Unlock document.
This document is partially blurred.
Unlock all pages and 1 million more documents.
Get Access
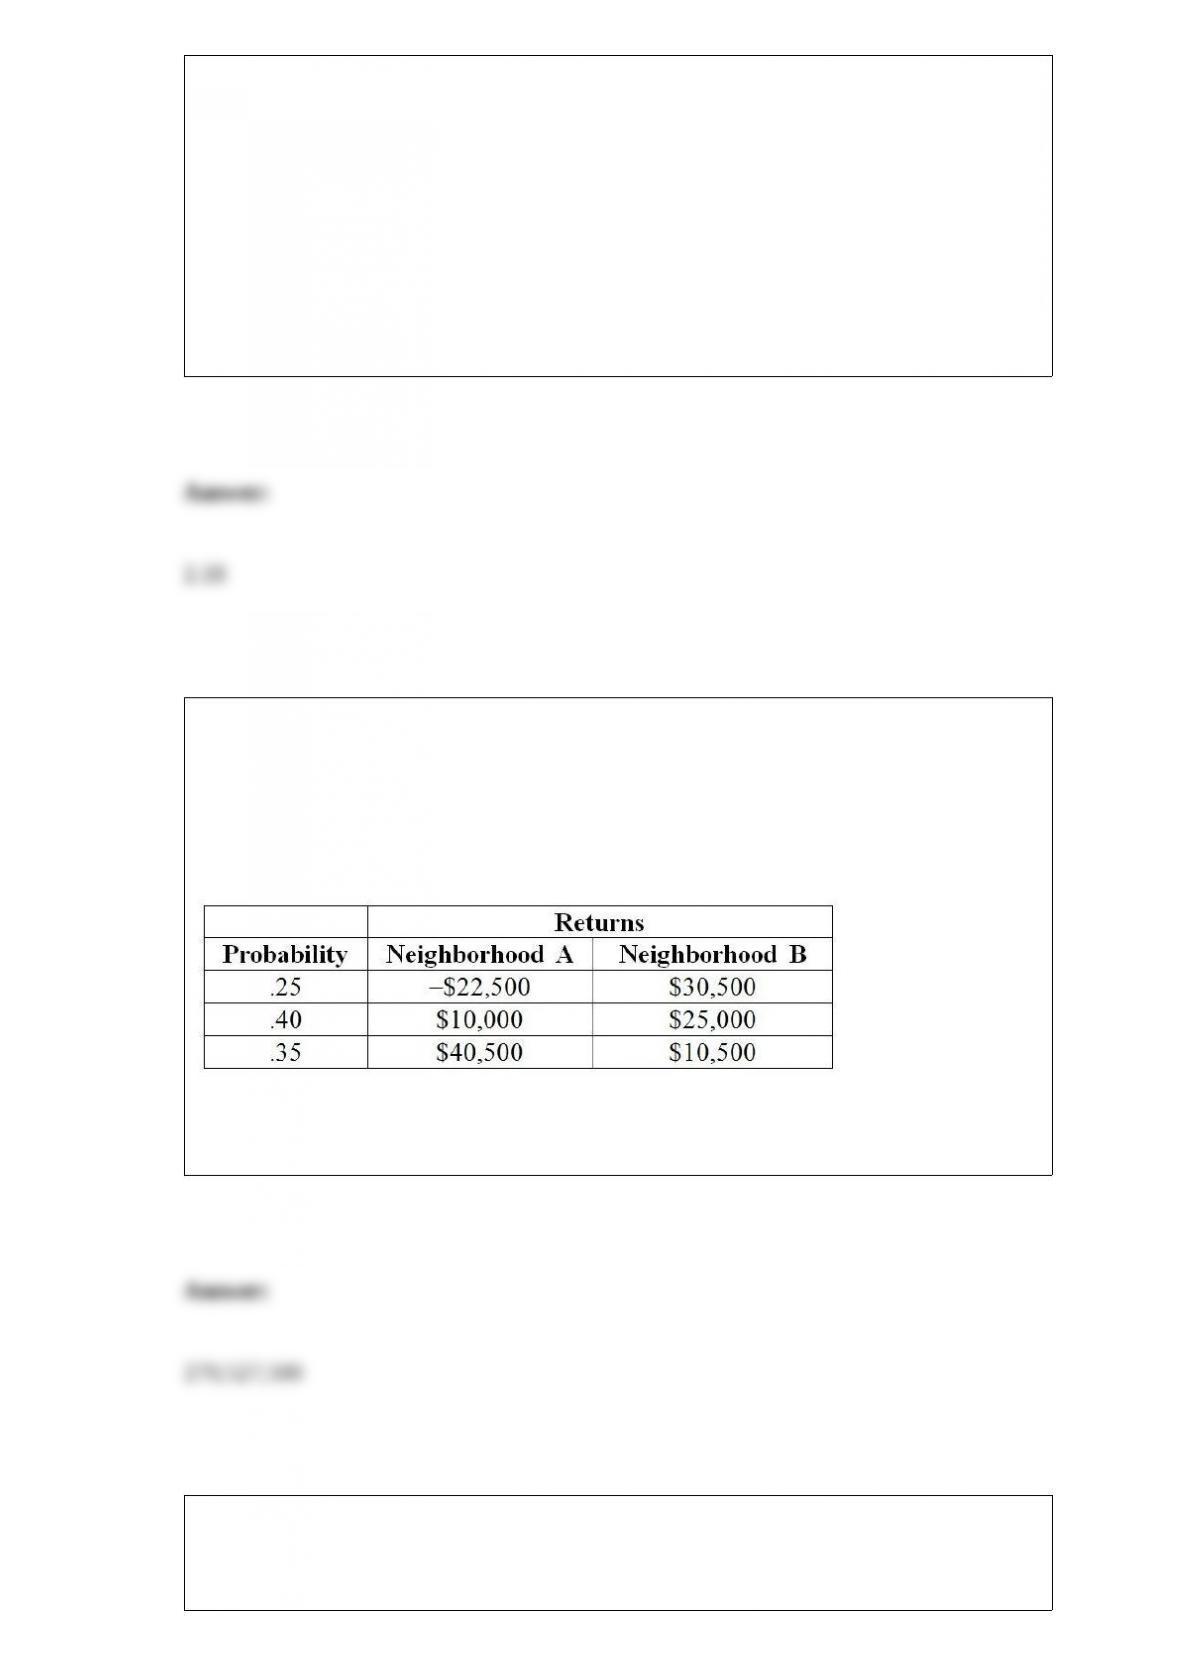
TABLE 9-3
An appliance manufacturer claims to have developed a compact microwave oven that
consumes a mean of no more than 250 W. From previous studies, it is believed that
power consumption for microwave ovens is normally distributed with a population
standard deviation of 15 W. A consumer group has decided to try to discover if the
claim appears true. They take a sample of 20 microwave ovens and find that they
consume a mean of 257.3 W.
Referring to Table 9.3, the value of the test statistic is ________.
TABLE 5-7
There are two houses with almost identical characteristics available for investment in
two different neighborhoods with drastically different demographic composition. The
anticipated gain in value when the houses are sold in 10 years has the following
probability distribution:
Referring to Table 5-7, what is the total variance of value gain if you invest in both
houses?
TABLE 9-11
An appliance manufacturer claims to have developed a compact microwave oven that
consumes a population mean of no more than 250 W. From previous studies, it is
believed that power consumption for microwave ovens is normally distributed with a
population standard deviation of 15 W. If there is evidence that the population mean
consumption is greater than 250 W, the manufacturer will be unable to make the claim.
Referring to Table 9-11, if you select a sample of 20 compact microwave ovens and are
willing to have a level of significance of 0.05, the probability of making a Type II error
is ________ if the mean power consumption of all such microwave ovens is in fact 248
W.
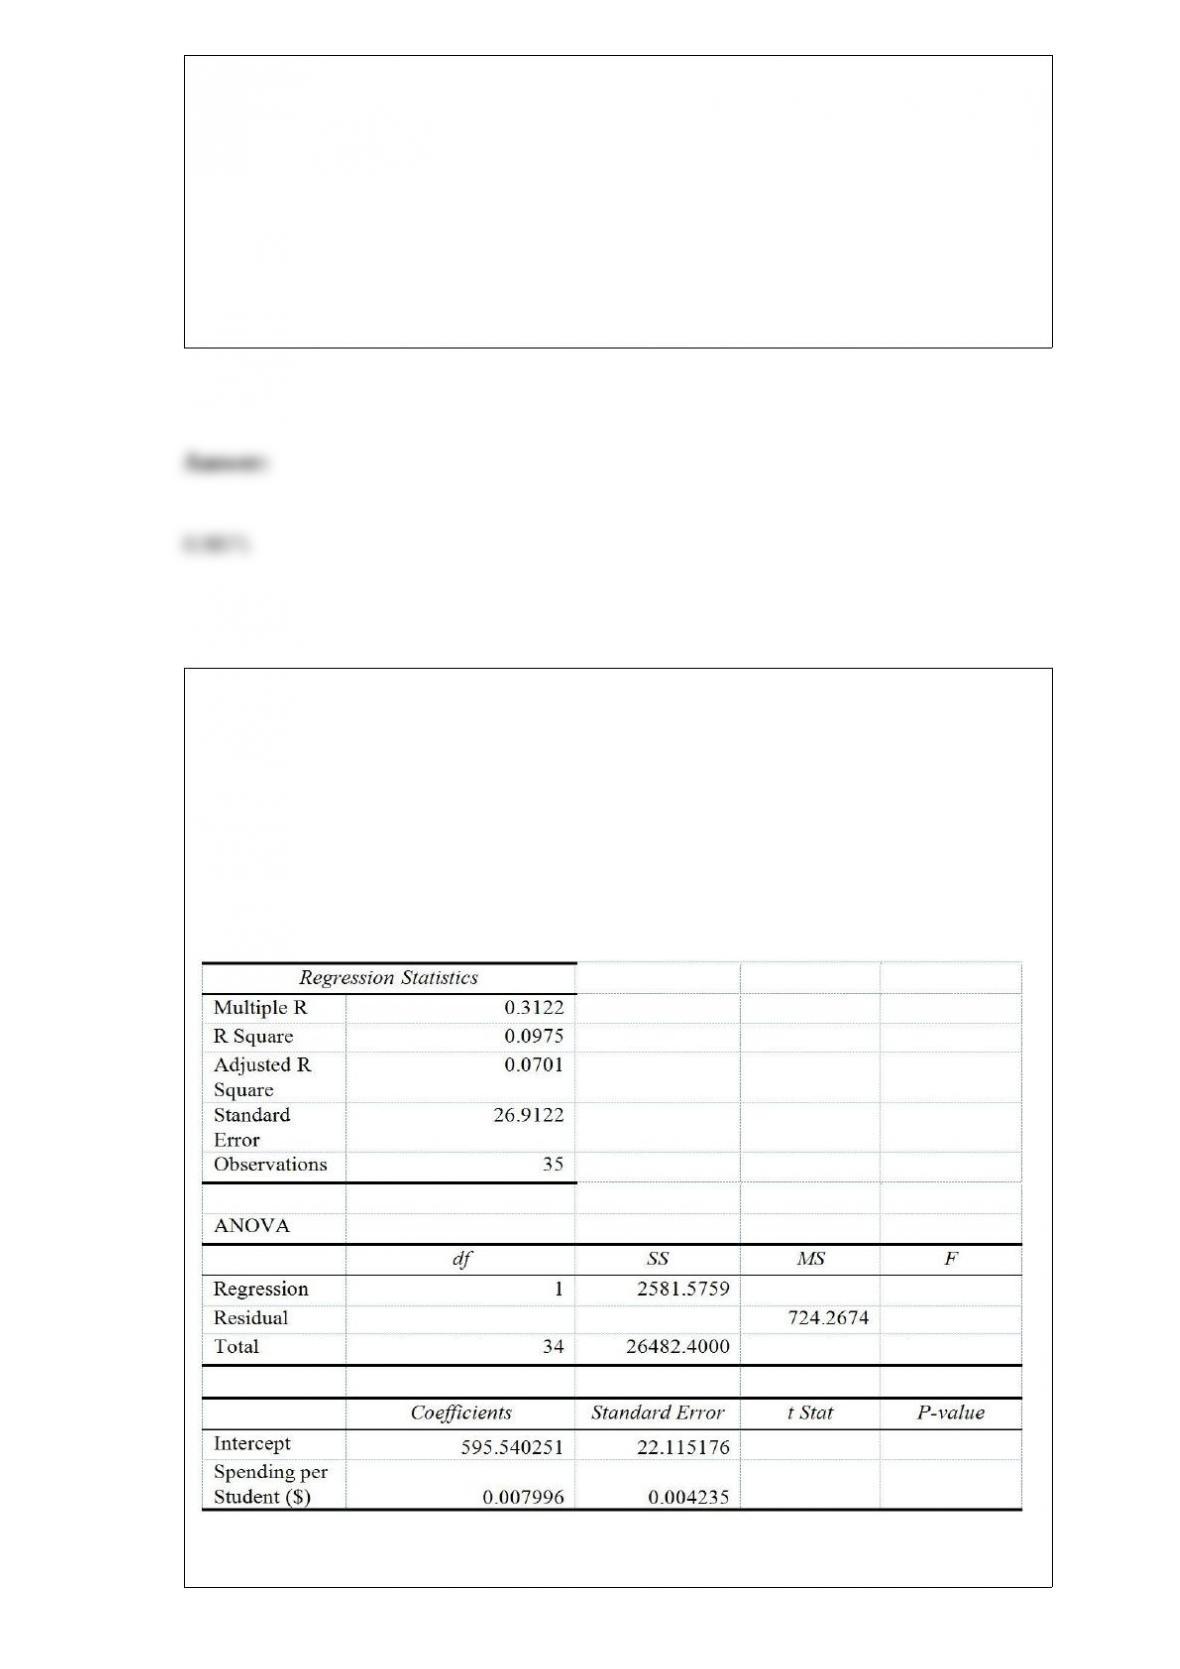
TABLE 13-13
In this era of tough economic conditions, voters increasingly ask the question: "Is the
educational achievement level of students dependent on the amount of money the state
in which they reside spends on education?" The partial computer output below is the
result of using spending per student ($) as the independent variable and composite score
which is the sum of the math, science and reading scores as the dependent variable on
35 states that participated in a study. The table includes only partial results.
Referring to Table 13-13, the p-value of the measured t test statistic to test whether

composite score depends linearly on spending per student is ________.
Referring to Table 14-10, to test the signiticance of the multiple
regression model, the p-value of the test statistic in the sample is
________.
TABLE 14-10
You worked as an intern at We Always Win Car Insurance Company
last summer. You notice that individual car insurance premiums
depend very much on the age of the individual and the number of
traffic tickets received by the individual. You performed a regression
analysis in EXCEL and obtained the following partial information:


