TABLE 17-12
The marketing manager for a nationally franchised lawn service company would like to
study the characteristics that differentiate home owners who do and do not have a lawn
service. A random sample of 30 home owners located in a suburban area near a large
city was selected; 15 did not have a lawn service (code 0) and 15 had a lawn service
(code 1). Additional information available concerning these 30 home owners includes
family income (Income, in thousands of dollars), lawn size (Lawn Size, in thousands of
square feet), attitude toward outdoor recreational activities (Attitude 0 = unfavorable, 1
= favorable), number of teenagers in the household (Teenager), and age of the head of
the household (Age).
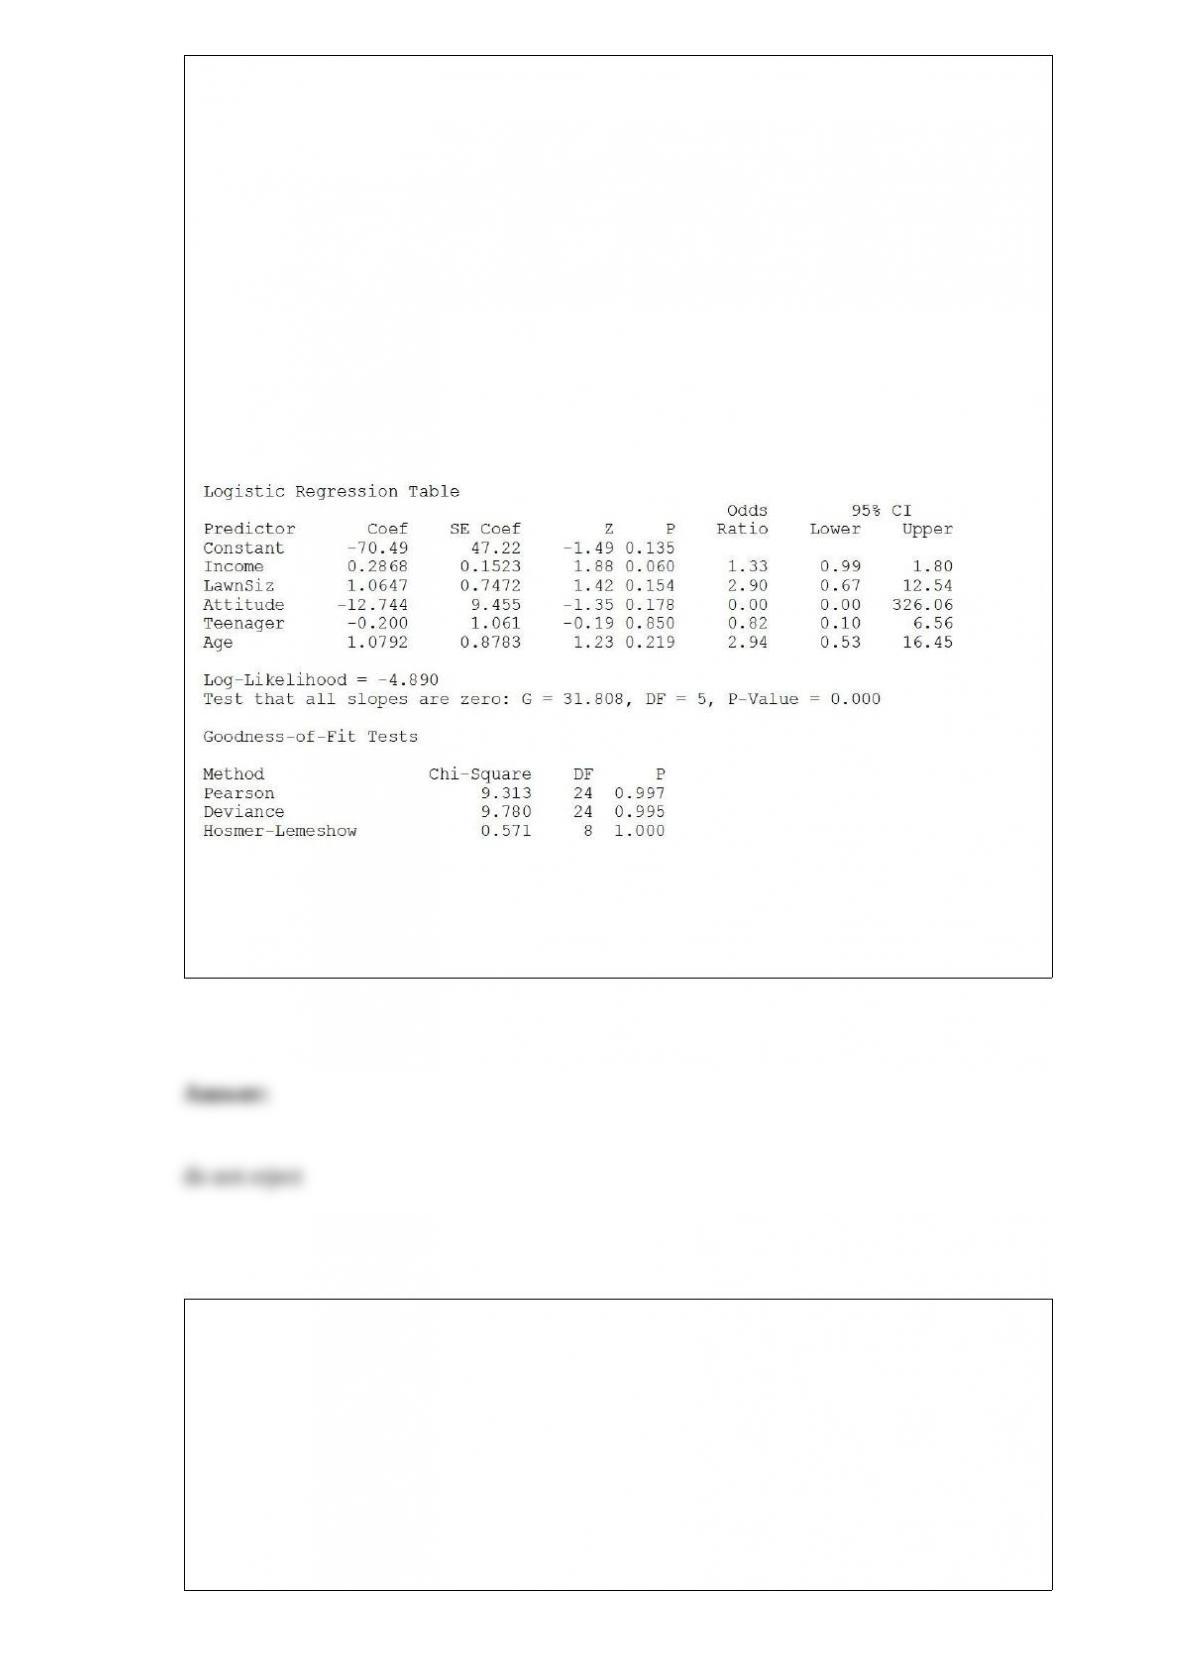
The Minitab output is given below:
Referring to Table 17-12, what should be the decision (‘reject’ or ‘do not reject’) on the
null hypothesis when testing whether Attitude makes a significant contribution to the
model in the presence of the other independent variables at a 0.05 level of significance?
TABLE 9-7
A major home improvement store conducted its biggest brand recognition campaign in
the company’s history. A series of new television advertisements featuring well-known
entertainers and sports figures were launched. A key metric for the success of television
advertisements is the proportion of viewers who “like the ads a lot”. A study of 1,189
adults who viewed the ads reported that 230 indicated that they “like the ads a lot.” The
percentage of a typical television advertisement receiving the “like the ads a lot” score
is believed to be 22%. Company officials wanted to know if there is evidence that the
series of television advertisements are less successful than the typical ad (i.e. if there is
evidence that the population proportion of “like the ads a lot” for the company’s ads is
less than 0.22) at a 0.01 level of significance.
Referring to Table 9-7, what critical value should the company officials use to
determine the rejection region?
TABLE 11-3
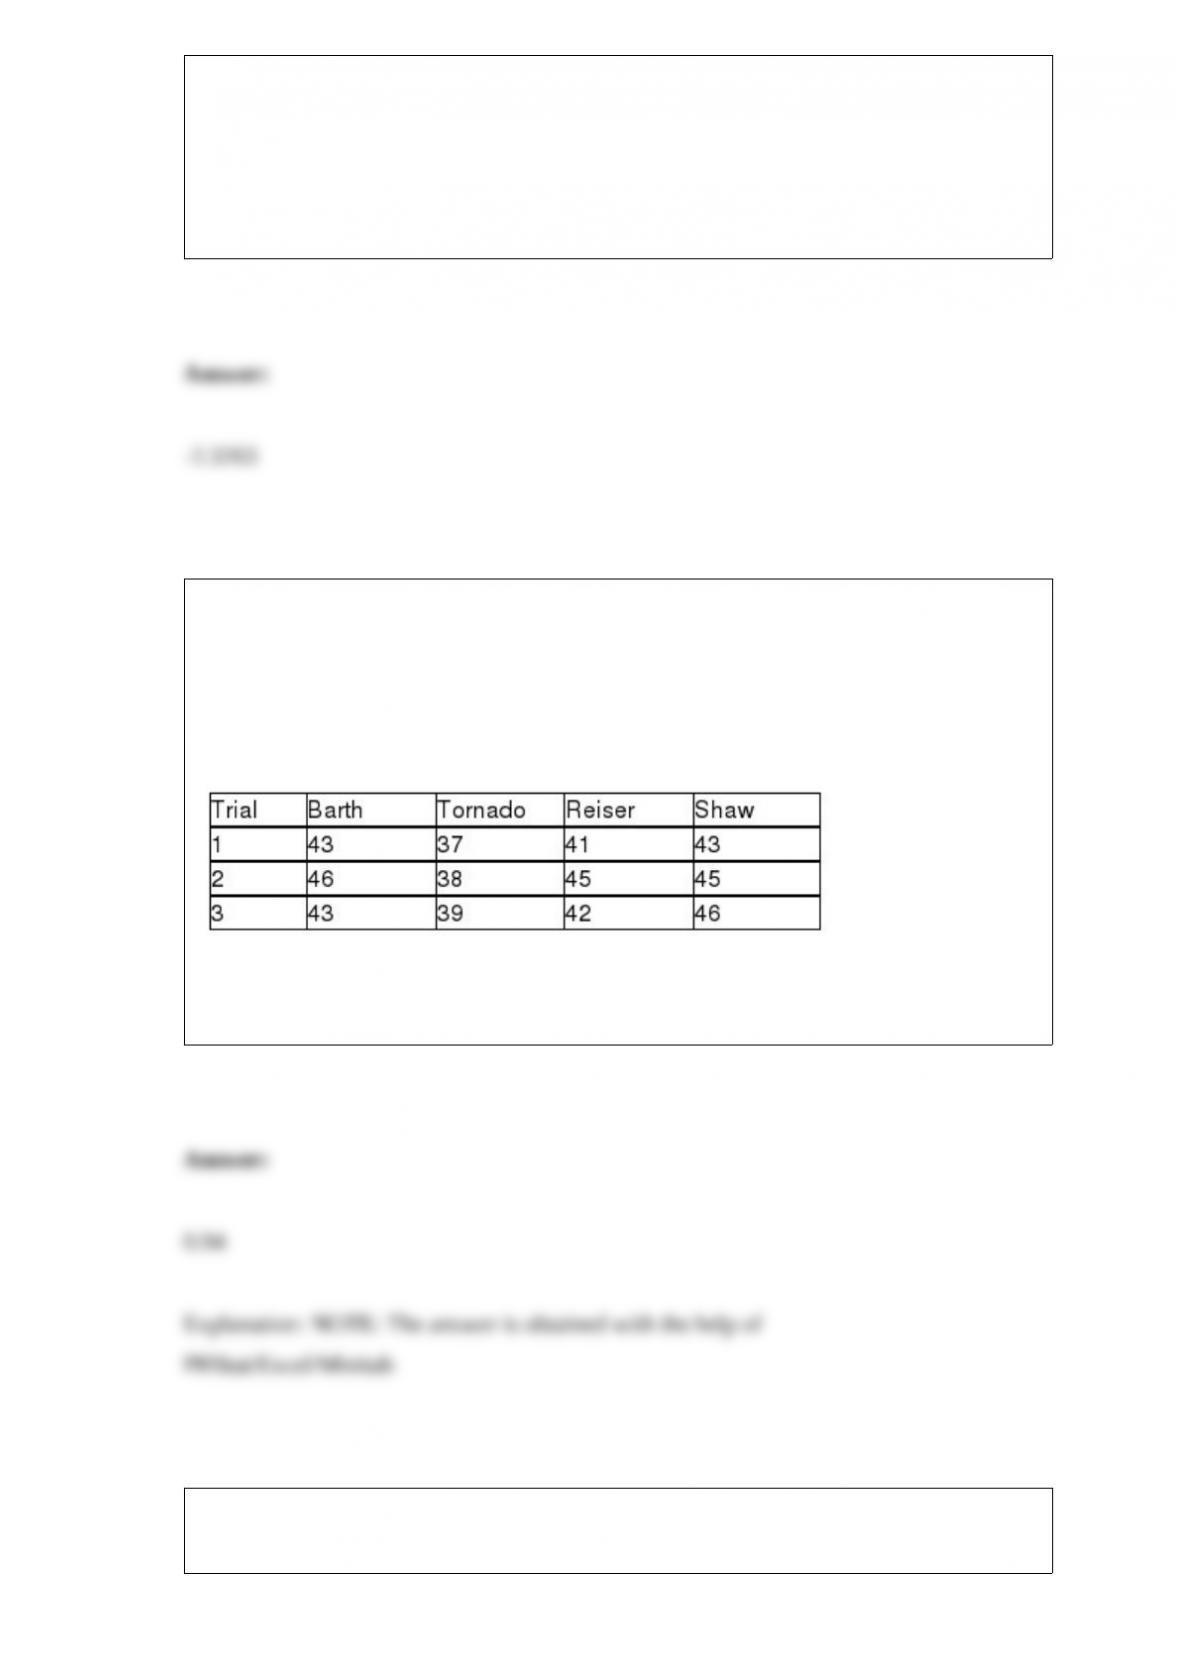
As part of an evaluation program, a sporting goods retailer wanted to compare the
downhill coasting speeds of 4 brands of bicycles. She took 3 of each brand and
determined their maximum downhill speeds. The results are presented in miles per hour
in the table below.
Referring to Table 11-3, what is the p-value of the test statistic for Levene’s test for
homogeneity of variances?
The point halfway between the boundaries of each class interval in a grouped frequency
distribution is called the ________.

TABLE 5-11
Subscribers to Investment Advice White Letters perform security transactions at the rate
of five trades per month. Assume that one of the subscribers performs transactions at
this rate and the probability of a transaction for any two months is the same and the
number of transactions in one month is independent of the number of transactions in
another month.
Referring to Table 5-11, what is the probability that more than two security transactions
will be conducted in one month?
TABLE 6-3
Suppose the time interval between two consecutive defective light bulbs from a
production line has a uniform distribution over an interval from 0 to 90 minutes.
Referring to Table 6-3, what is the probability that the time interval between two
consecutive defective light bulbs will be between 10 and 20 minutes?
If X has a binomial distribution with n = 5 and p = 0.1, then P(X = 2) = ________.
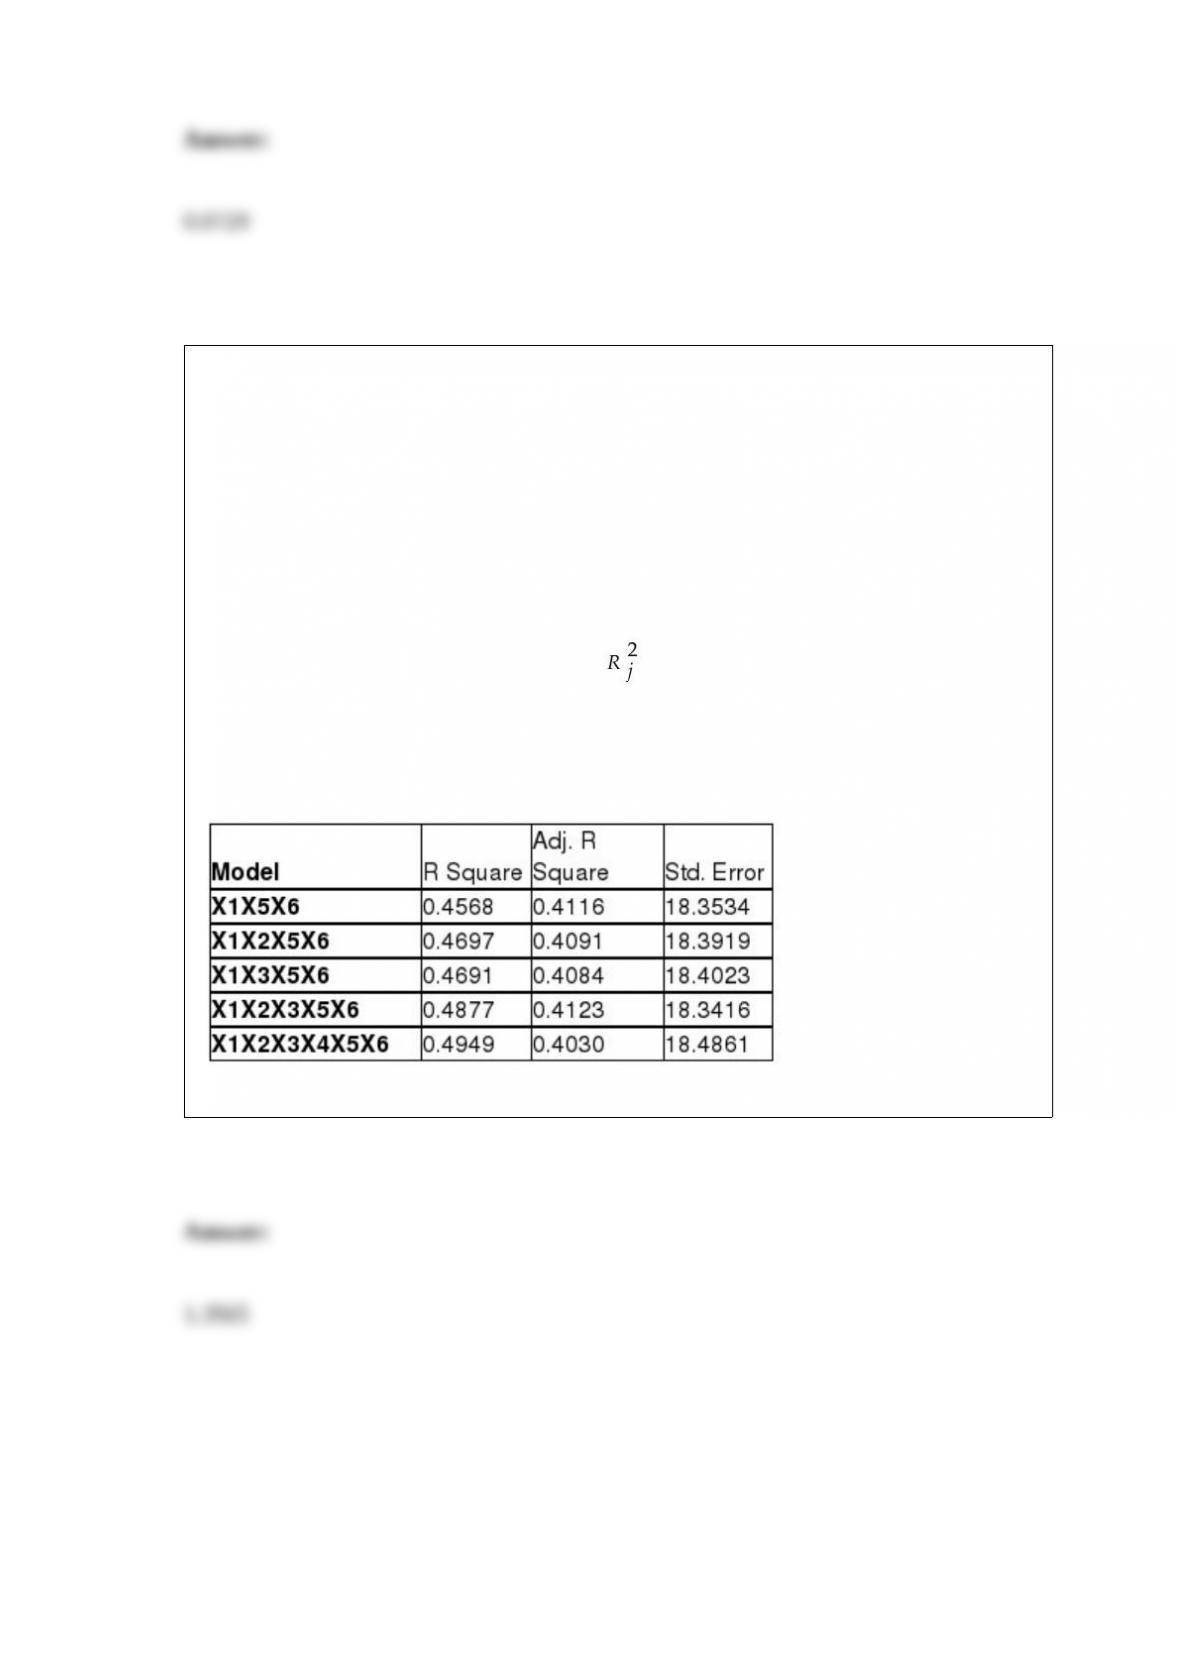
TABLE 15-6
Given below are results from the regression analysis on 40 observations where the
dependent variable is the number of weeks a worker is unemployed due to a layoff (Y)
and the independent variables are the age of the worker (X1), the number of years of
education received (X2), the number of years at the previous job (X3), a dummy variable
for marital status (X4: 1 = married, 0 = otherwise), a dummy variable for head of
household (X5: 1 = yes, 0 = no) and a dummy variable for management position (X6: 1
= yes, 0 = no).
The coefficient of multiple determination ( ) for the regression model using each of
the 6 variables Xj as the dependent variable and all other X variables as independent
variables are, respectively, 0.2628, 0.1240, 0.2404, 0.3510, 0.3342 and 0.0993.
The partial results from best-subset regression are given below:
Referring to Table 15-6, what is the value of the variance inflationary factor of Age?