TABLE 8-12
A random sample of 100 stores from a large chain of 500 garden supply stores was
selected to determine the mean number of lawnmowers sold at an end-of-season
clearance sale. The sample results indicated a mean of 6 and a standard deviation of 2
lawnmowers sold. A 95% confidence interval (5.623 to 6.377) was established based on
these results.
True or False: Referring to Table 8-12, we do not know for sure whether the true
population mean is between 5.623 and 6.377 lawnmowers sold.
True or False: When an explanatory variable is dropped from a multiple regression
model, the coefficient of multiple determination can increase.
True or False: If the distribution of a data set were perfectly symmetrical, the distance
from Q1 to the median would always equal the distance from Q3 to the median in a
boxplot.
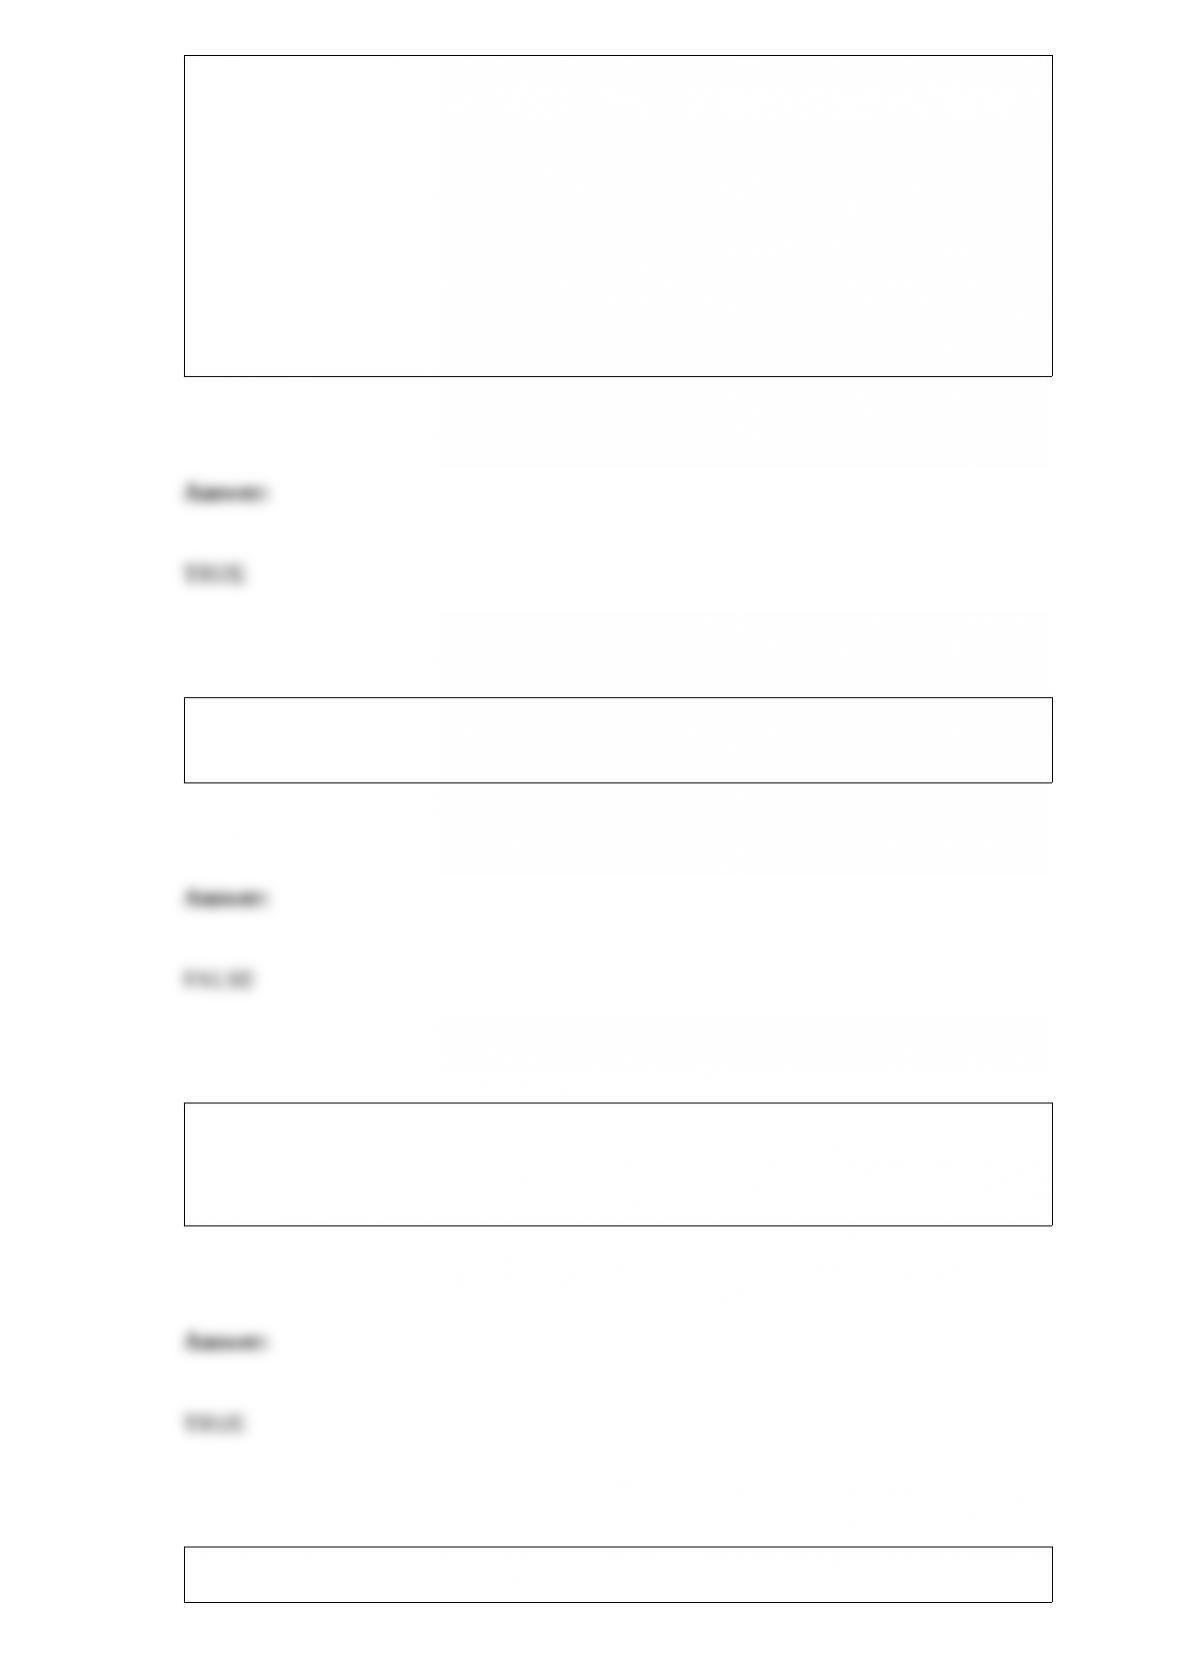
TABLE 13-12
The manager of the purchasing department of a large saving and loan organization
would like to develop a model to predict the amount of time (measured in hours) it
takes to record a loan application. Data are collected from a sample of 30 days, and the
number of applications recorded and completion time in hours is recorded. Below is the
regression output:
True or False: Referring to Table 13-12, you can be 95% confident that the mean
amount of time needed to record one additional loan application is somewhere between
0.0109 and 0.0143 hours.
True or False: “Big data” is a concrete concept with a precise operational definition.
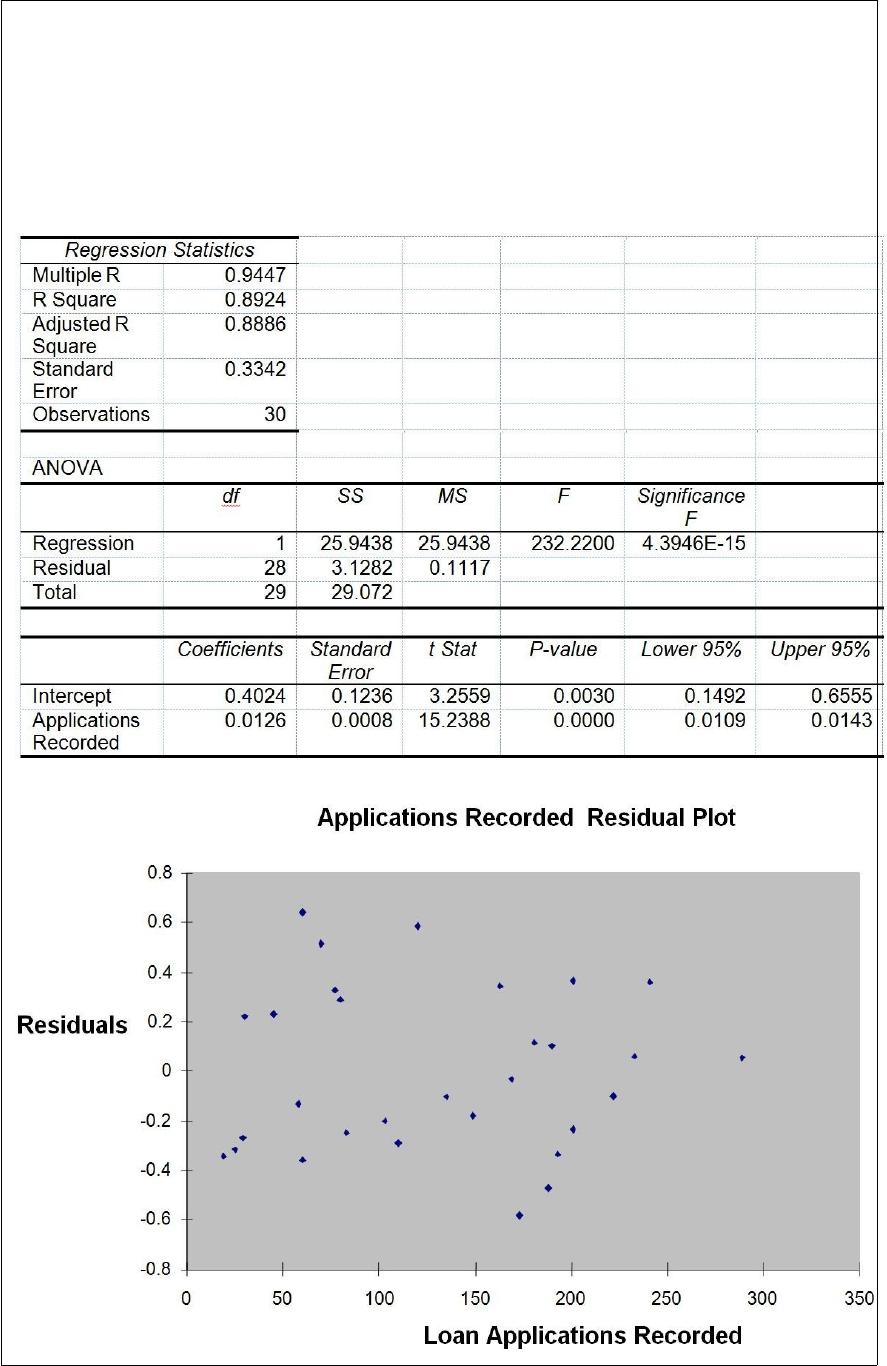
Based on the residual plot below, you will conclude that there might be a violation of
which of the following assumptions?
A) Linearity of the relationship
B) Normality of errors
C) Homoscedasticity
D) Independence of errors
TABLE 15-4
The superintendent of a school district wanted to predict the percentage of students
passing a sixth-grade proficiency test. She obtained the data on percentage of students
passing the proficiency test (% Passing), daily mean of the percentage of students
attending class (% Attendance), mean teacher salary in dollars (Salaries), and
instructional spending per pupil in dollars (Spending) of 47 schools in the state.
Let Y = % Passing as the dependent variable, X1 = % Attendance, X2 = Salaries and X3
= Spending.
The coefficient of multiple determination ( ) of each of the 3 predictors with all the
other remaining predictors are, respectively, 0.0338, 0.4669, and 0.4743.
The output from the best-subset regressions is given below:
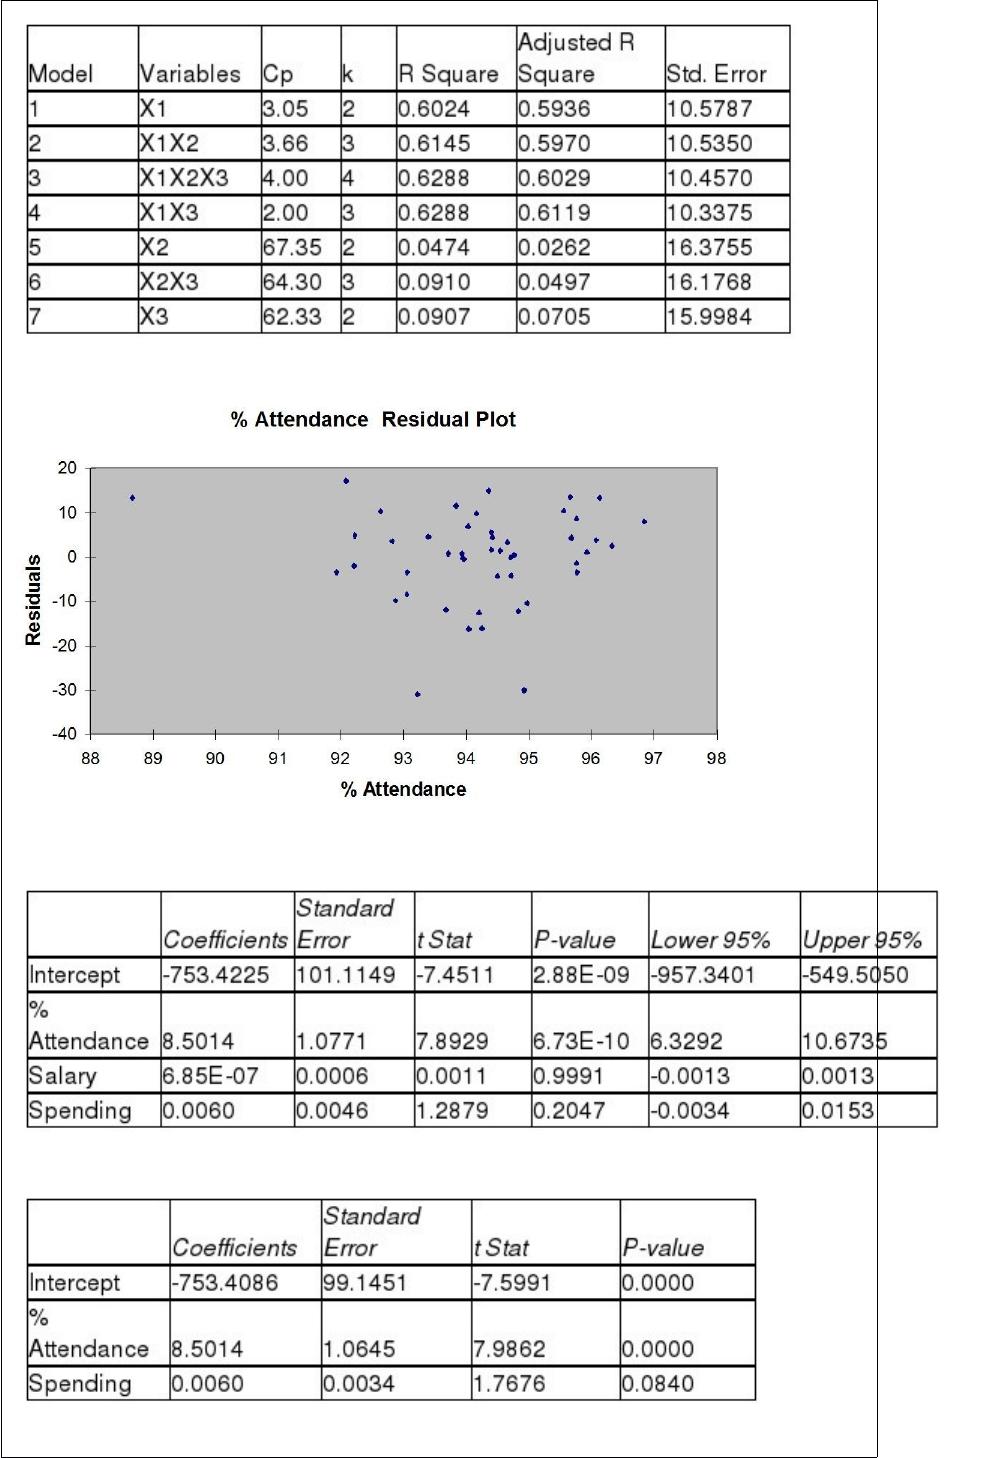
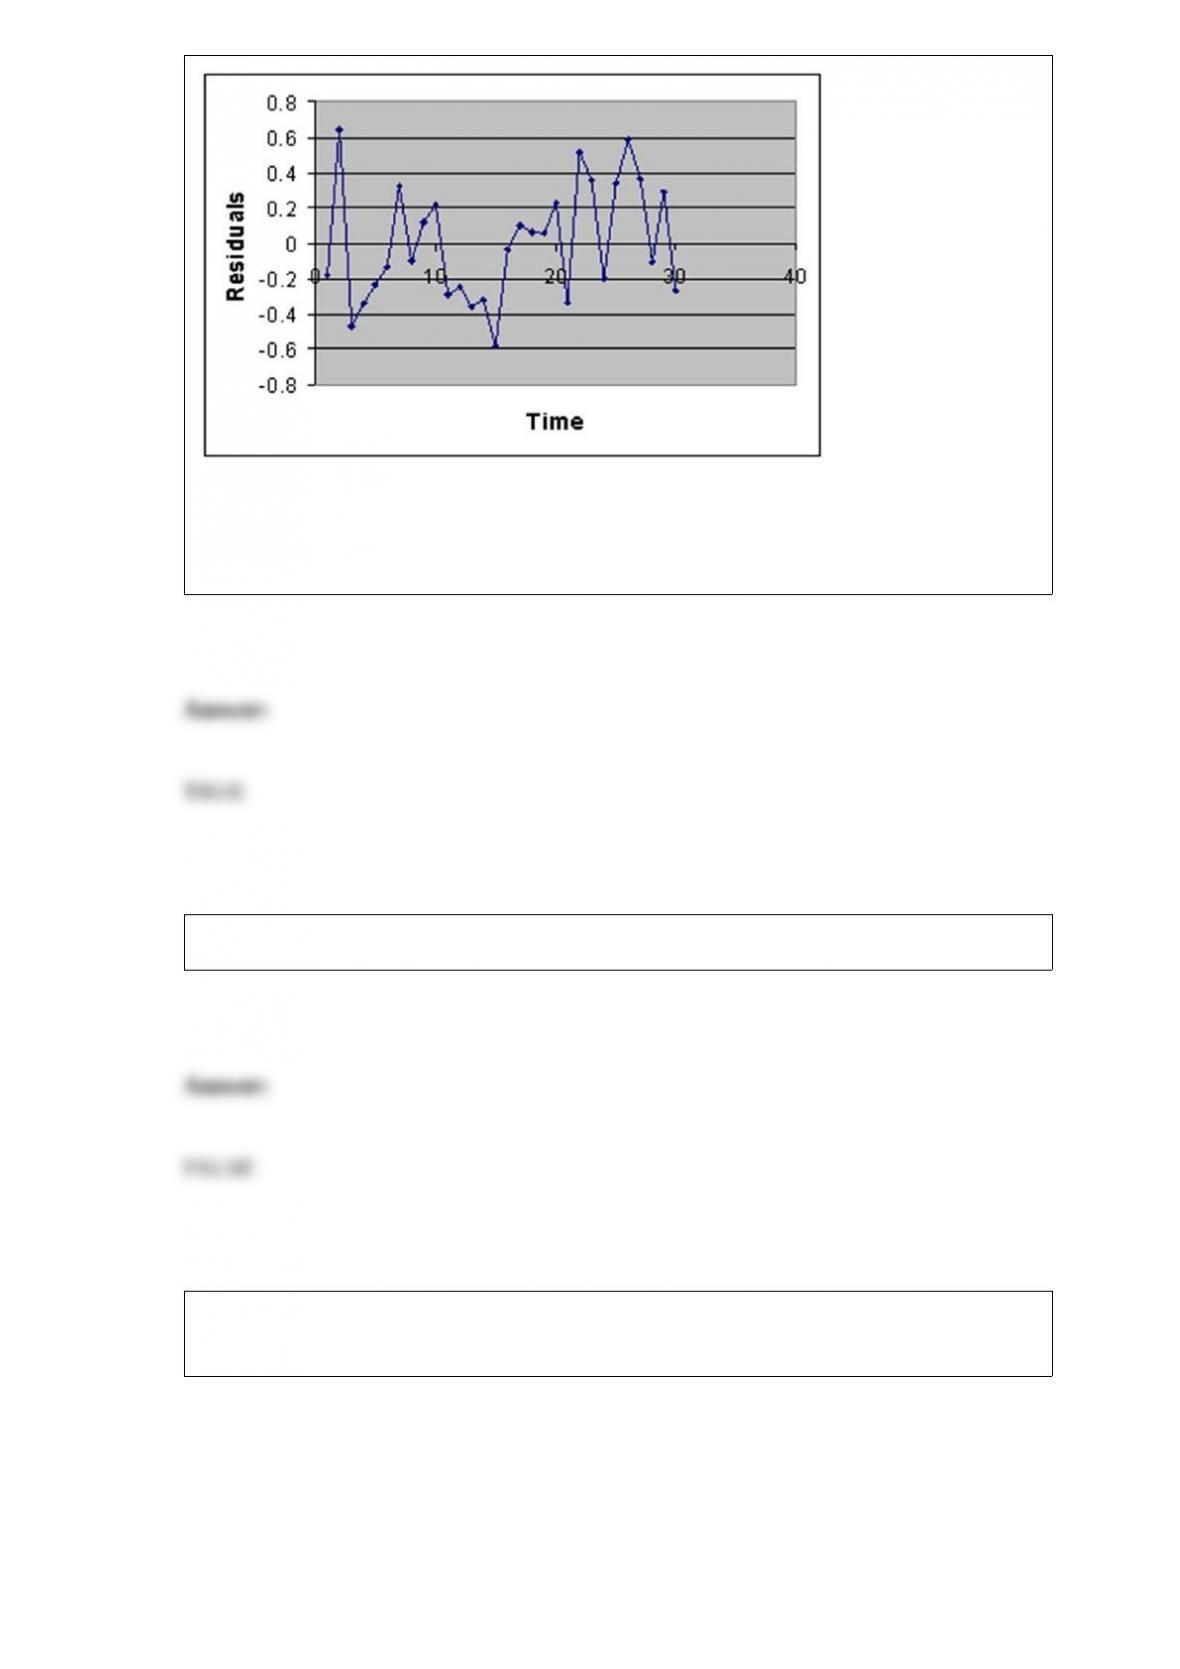
Following is the residual plot for % Attendance:
Following is the output of several multiple regression models:
Model (I):
Model (II):
Model (III):
Referring to Table 15-4, the better model using a 5% level of significance derived from
the “best” model above is
A) X1.
B) X3.
C) X1, X3.
D) X1, X2, X3.
TABLE 9-2
A student claims that he can correctly identify whether a person is a business major or
an agriculture major by the way the person dresses. Suppose in actuality that if someone
is a business major, he can correctly identify that person as a business major 87% of the
time. When a person is an agriculture major, the student will incorrectly identify that
person as a business major 16% of the time. Presented with one person and asked to
identify the major of this person (who is either a business or an agriculture major), he
considers this to be a hypothesis test with the null hypothesis being that the person is a
business major and the alternative that the person is an agriculture major.
Referring to Table 9-2, what is the value of ?
A) 0.13
B) 0.16
C) 0.84
D) 0.87
For a given level of significance ( ), if the sample size n is increased, the probability of
a Type II error ( )
A) will decrease.
B) will increase.
C) will remain the same.
D) cannot be determined.
TABLE 17-1
A real estate builder wishes to determine how house size (House) is influenced by
family income (Income), family size (Size), and education of the head of household
(School). House size is measured in hundreds of square feet, income is measured in
thousands of dollars, and education is in years. The builder randomly selected 50
families and ran the multiple regression. Microsoft Excel output is provided below:
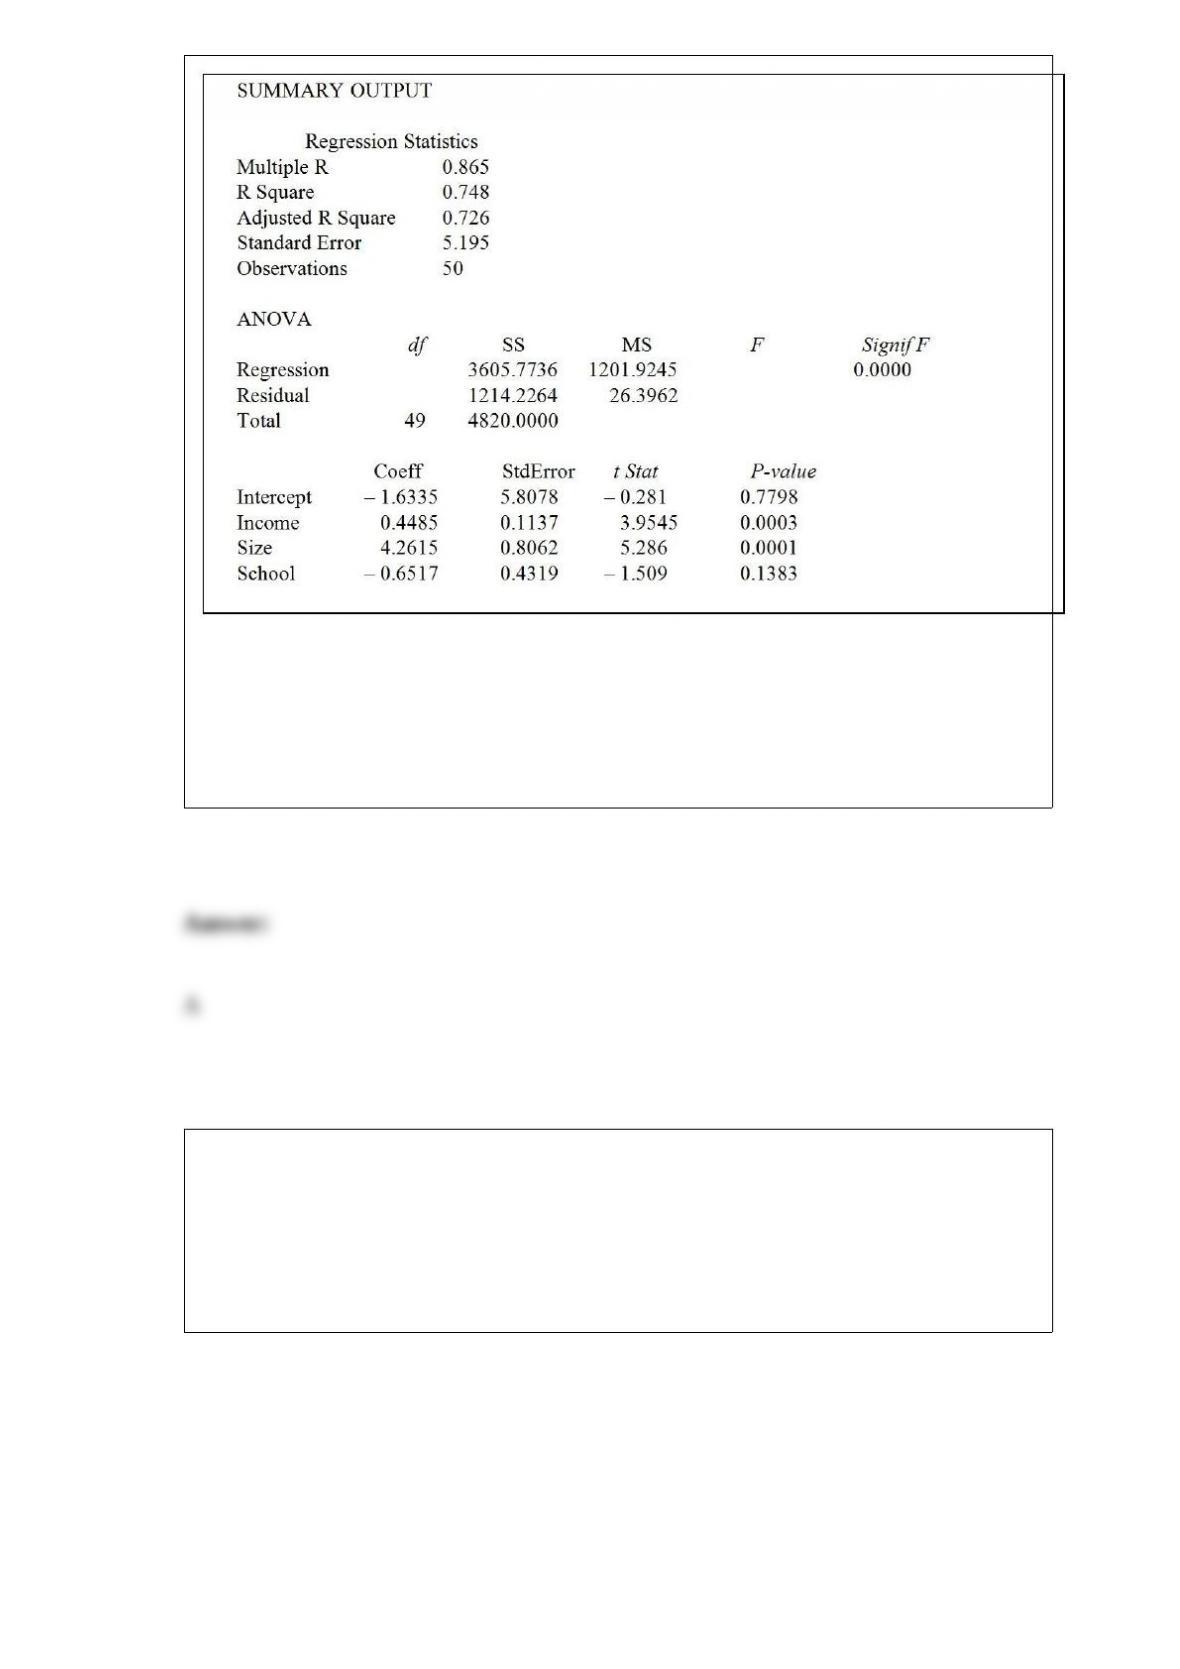
Referring to Table 17-1, which of the following values for the level of significance is
the smallest for which the regression model as a whole is significant?
A) 0.0005
B) 0.001
C) 0.01
D) 0.05
TABLE 17-1
A real estate builder wishes to determine how house size (House) is influenced by
family income (Income), family size (Size), and education of the head of household
(School). House size is measured in hundreds of square feet, income is measured in
thousands of dollars, and education is in years. The builder randomly selected 50
families and ran the multiple regression. Microsoft Excel output is provided below:
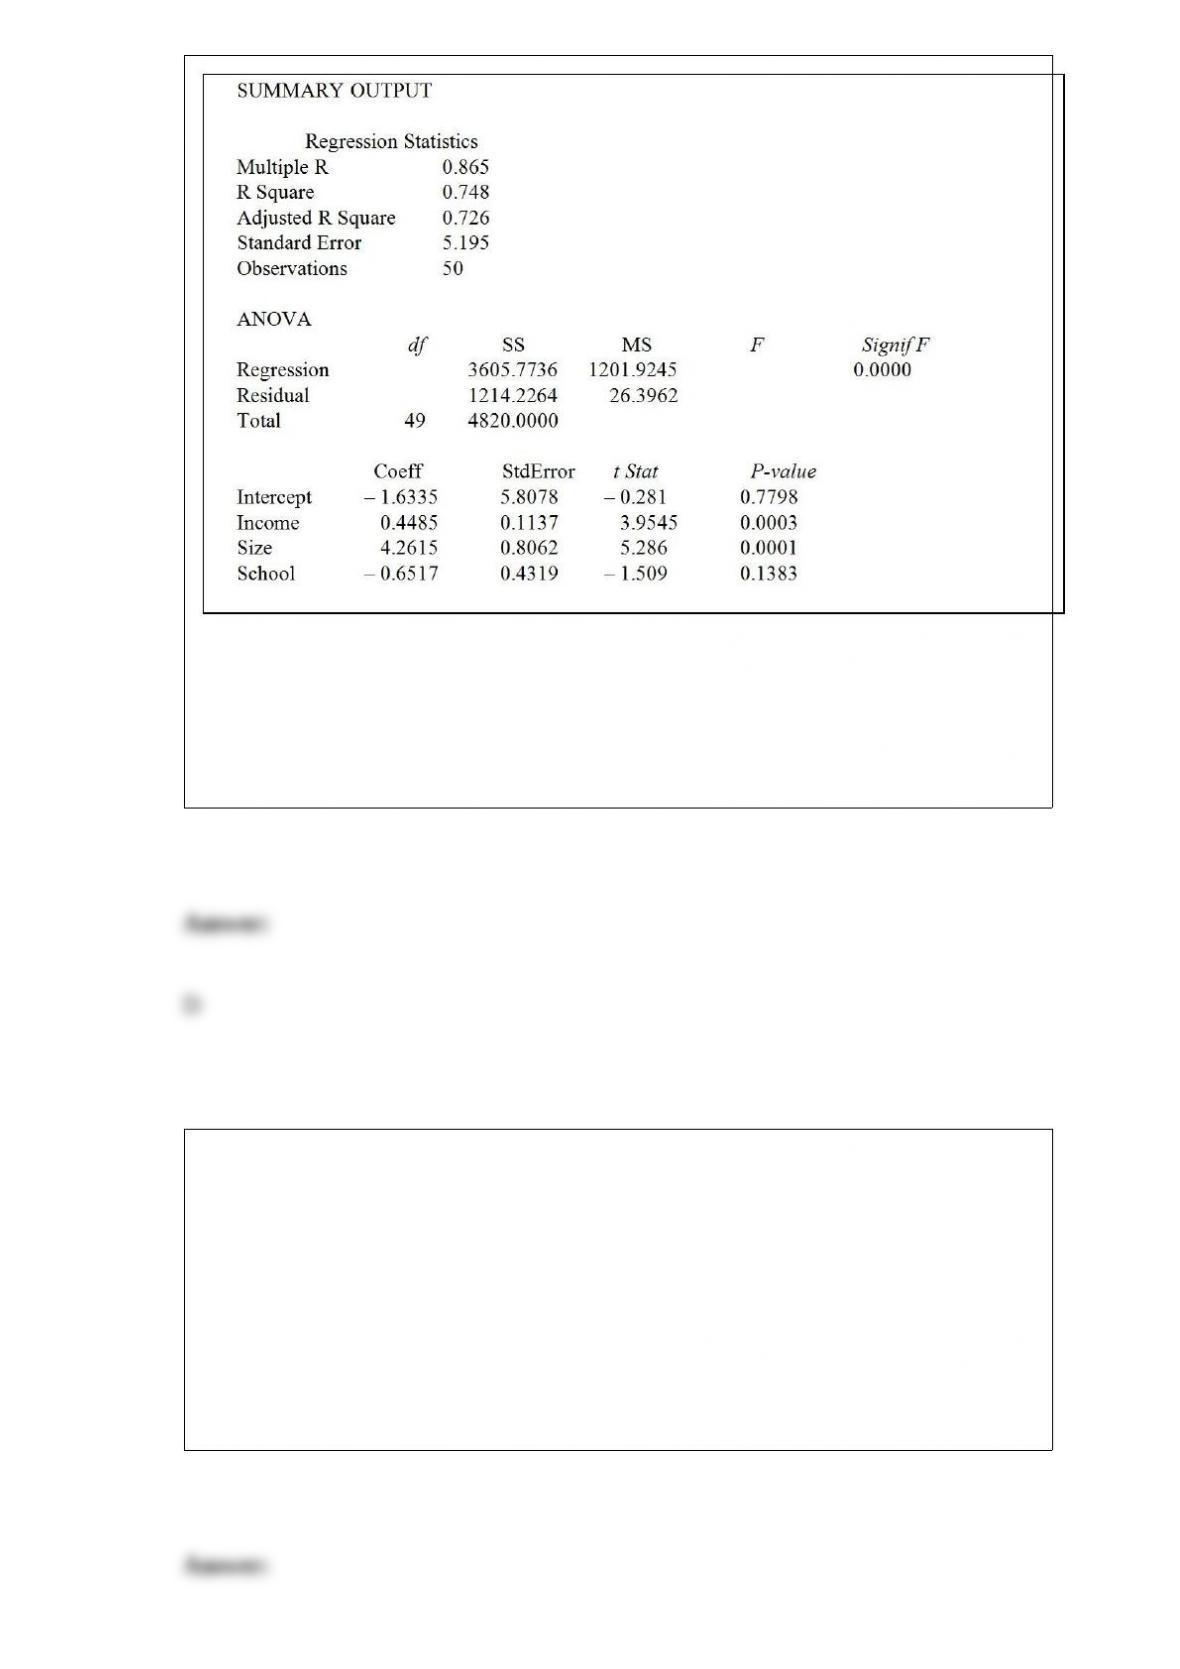
Referring to Table 17-1, suppose the builder wants to test whether the coefficient on
School is significantly different from 0. What is the value of the relevant t-statistic?
A) 5.286
B) 5.195
C) 3.945
D) -1.509
Blossom’s Flowers purchases roses for sale for Valentine’s Day. The roses are purchased
for $10 a dozen and are sold for $20 a dozen. Any roses not sold on Valentine’s Day can
be sold for $5 per dozen. The owner will purchase 1 of 3 amounts of roses for
Valentine’s Day: 100, 200, or 400 dozen roses. Given 0.2, 0.4, and 0.6 are the
probabilities for the sale of 100, 200, or 400 dozen roses, respectively, then the optimal
EMV for buying roses is
A) $700.
B) $900.
C) $1,700.
D) $1,900.
Referring to Table 14-19, which of the following is the correct
expression for the estimated model?
TABLE 14-19
The marketing manager for a nationally franchised lawn service
company would like to study the characteristics that differentiate
home owners who do and do not have a lawn service. A random
sample of 30 home owners located in a suburban area near a large
city was selected; 11 did not have a lawn service (code 0) and 19 had
a lawn service (code 1). Additional information available concerning
these 30 home owners includes family income (Income, in thousands
of dollars) and lawn size (Lawn Size, in thousands of square feet).
The PHStat output is given below:
A) Y = -7.8562 + 0.0304 Income + 1.2804 LawnSize
B) = -7.8562 + 0.0304 Income + 1.2804 LawnSize
C) In (odds ratio) = -7.8562 + 0.0304 Income + 1.2804 LawnSize
D) In (estimated odds ratio) = -7.8562 + 0.0304 Income + 1.2804
LawnSize
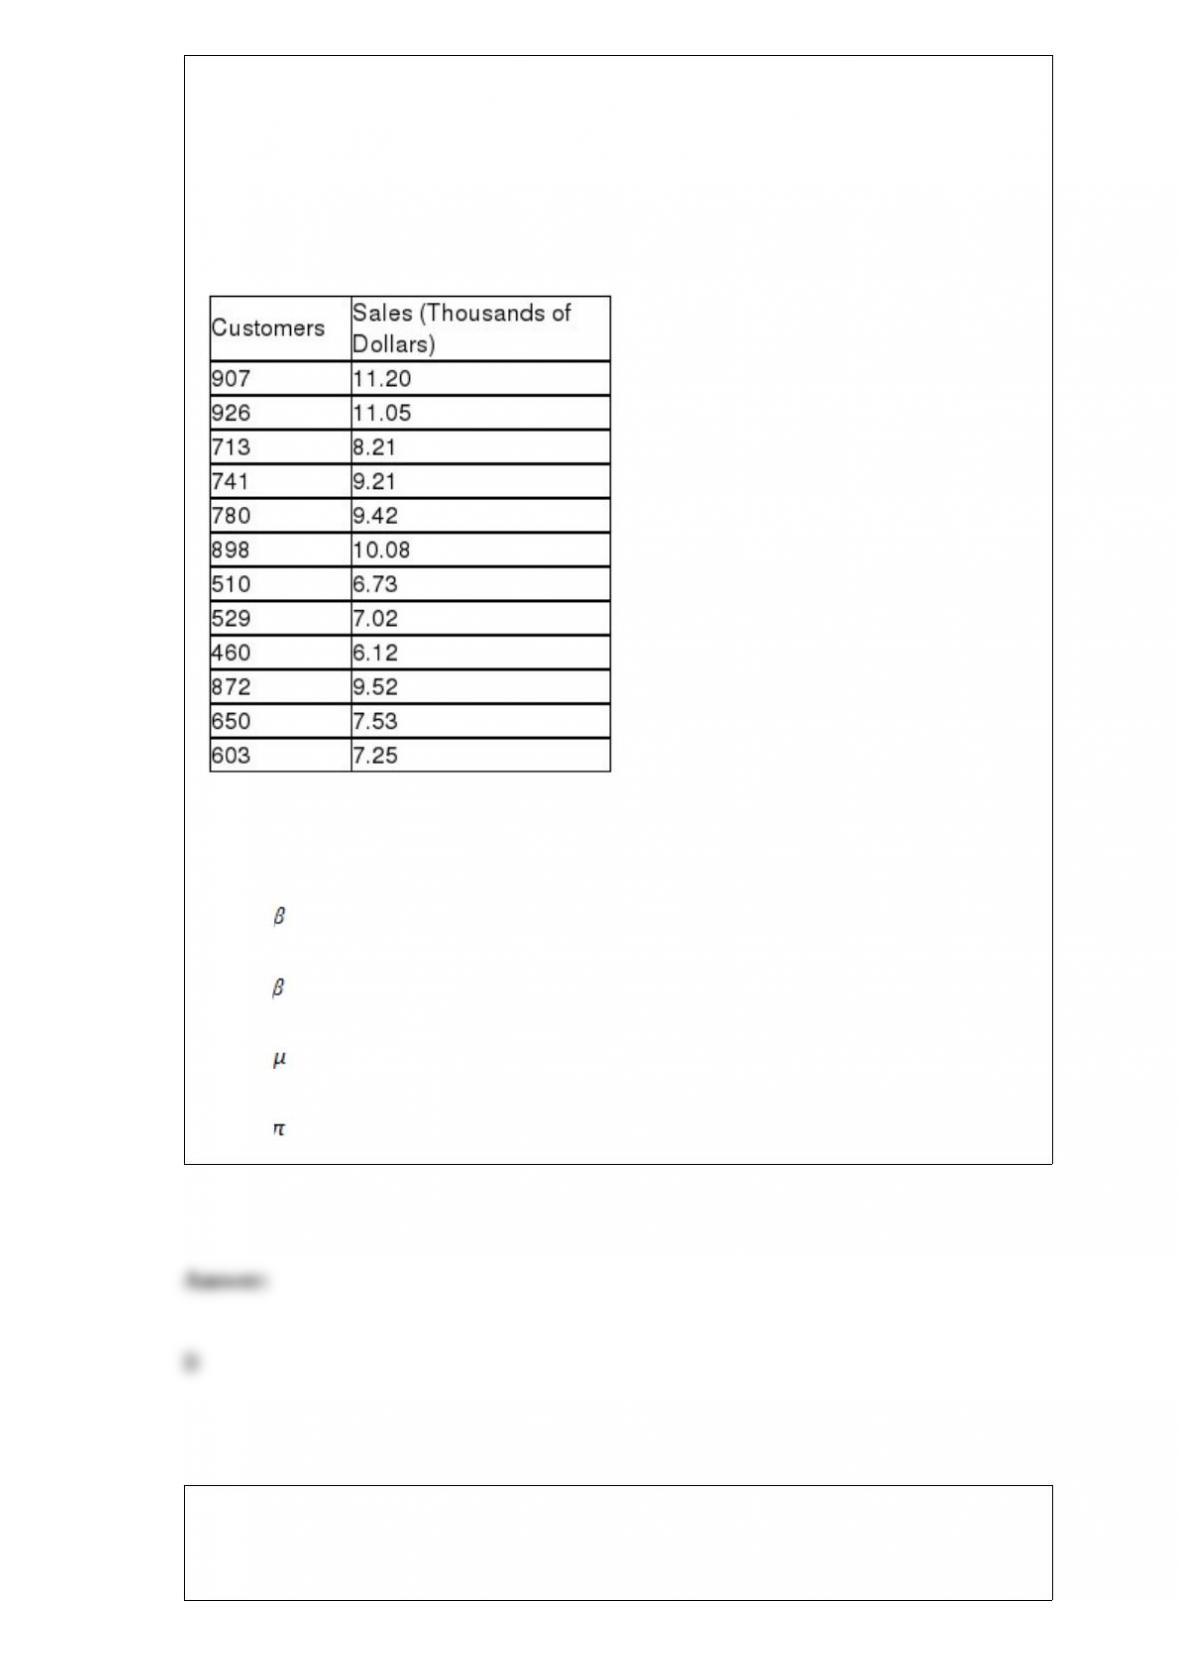
TABLE 13-10
The management of a chain electronic store would like to develop a model for
predicting the weekly sales (in thousands of dollars) for individual stores based on the
number of customers who made purchases. A random sample of 12 stores yields the
following results:
Referring to Table 13-10, which is the correct null hypothesis for testing whether the
number of customers who make a purchase affects weekly sales?
A) H0 : 0 = 0
B) H0 : 1 = 0
C) H0 : = 0
D) H0 : = 0
The evening host of a dinner dance reached into a bowl, mixed all the tickets around,
and selected the ticket to award the grand door prize. What sampling method was used?
A) simple random sample
B) systematic sample
C) stratified sample
D) cluster sample
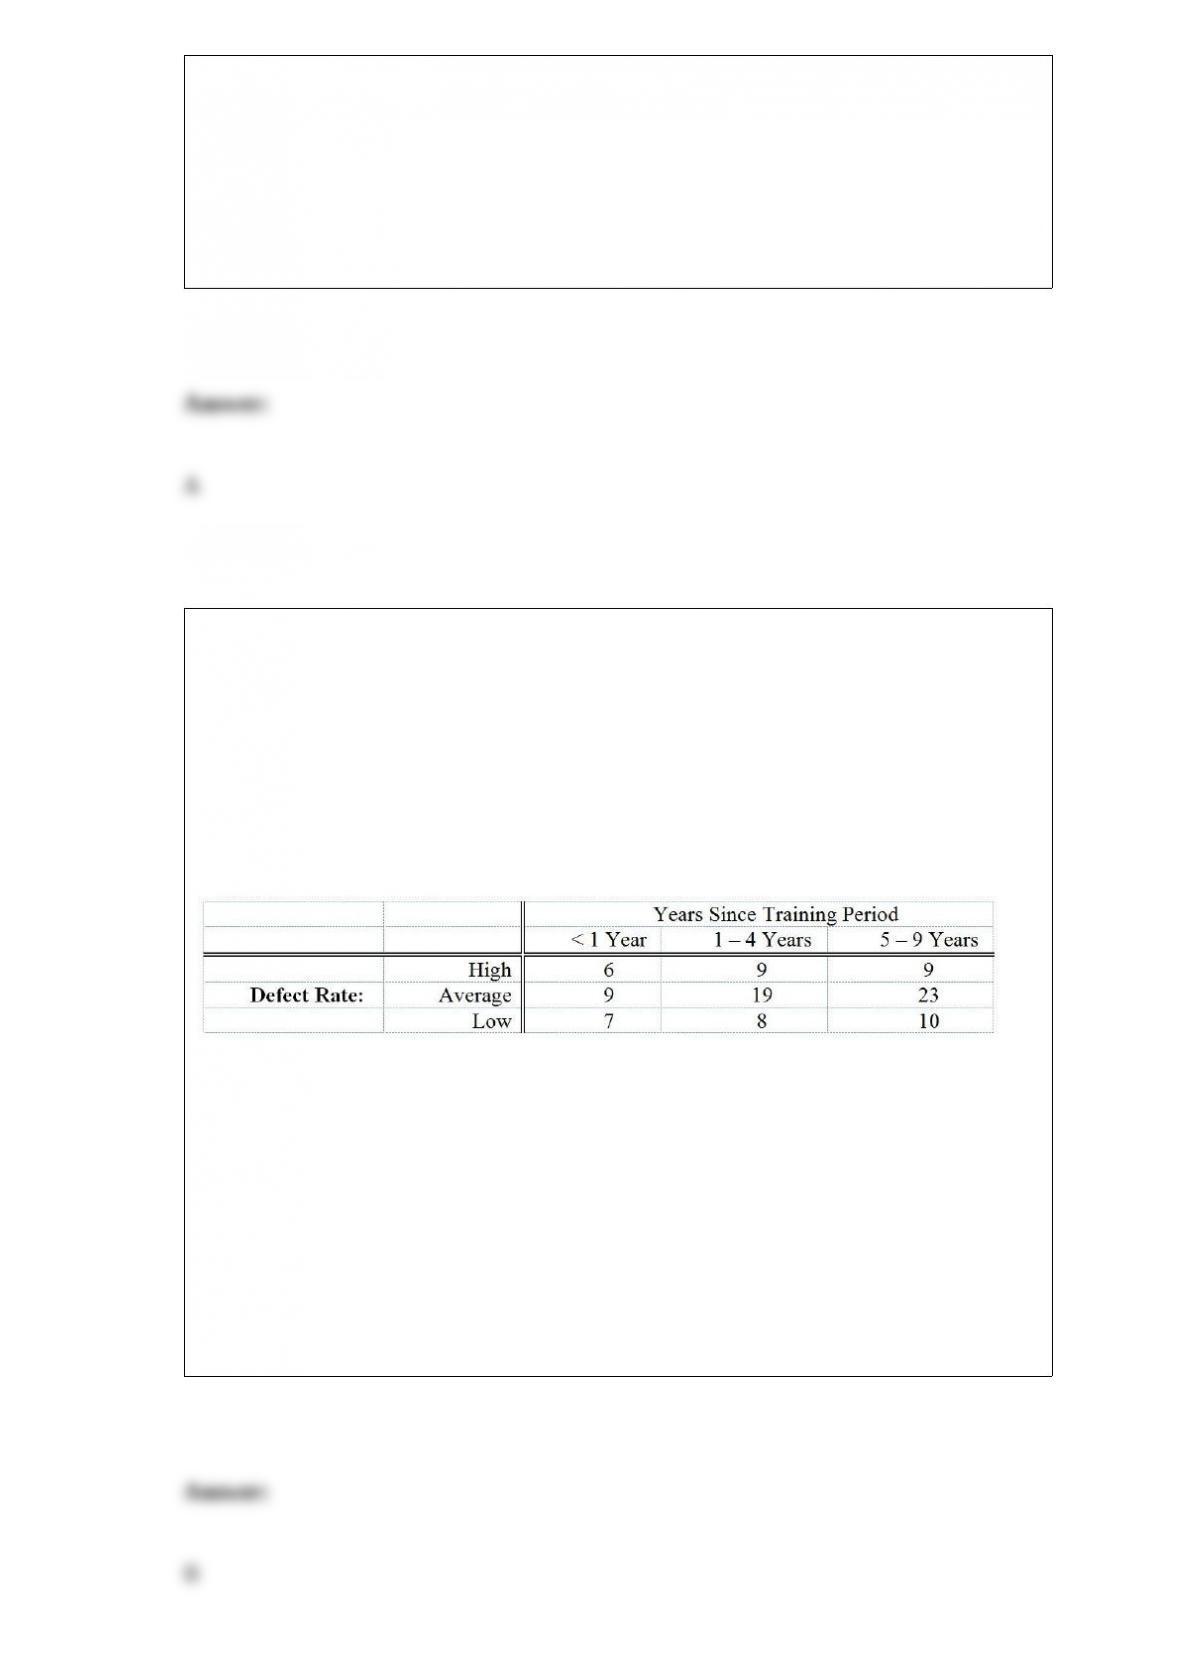
TABLE 12-10
One criterion used to evaluate employees in the assembly section of a large factory is
the number of defective pieces per 1,000 parts produced. The quality control
department wants to find out whether there is a relationship between years of
experience and defect rate. Since the job is repetitious, after the initial training period
any improvement due to a learning effect might be offset by a loss of motivation. A
defect rate is calculated for each worker in a yearly evaluation. The results for 100
workers are given in the table below.
Referring to Table 12-10, what is the expected number of employees with 1 to 4 years
of training time and a high defect rate?
A) 12.00
B) 8.64
C) 6.67
D) 6.00

Referring to Table 14-17, which of the following is a correct
statement?
TABLE 14-17
Given below are results from the regression analysis where the
dependent variable is the number of weeks a worker is unemployed
due to a layo% (Unemploy) and the independent variables are the age
of the worker (Age) and a dummy variable for management position
(Manager: 1 = yes, 0 = no).
The results of the regression analysis are given below:
A) On average, a worker who is a year older is estimated to stay
jobless shorter by approximately 0.2143 weeks while holding
constant the effect of the manager dummy variable.
B) On average, a worker who is a year older is estimated to stay
jobless longer by approximately 0.2143 weeks while holding constant
the effect of the manager dummy variable.
C) On average, a worker who is a year older is estimated to stay
jobless shorter by approximately 1.4448 weeks while holding
constant the effect of the manager dummy variable.
D) On average, a worker who is a year older is estimated to stay
jobless longer by approximately 1.4448 weeks while holding constant
the effect of the manager dummy variable.
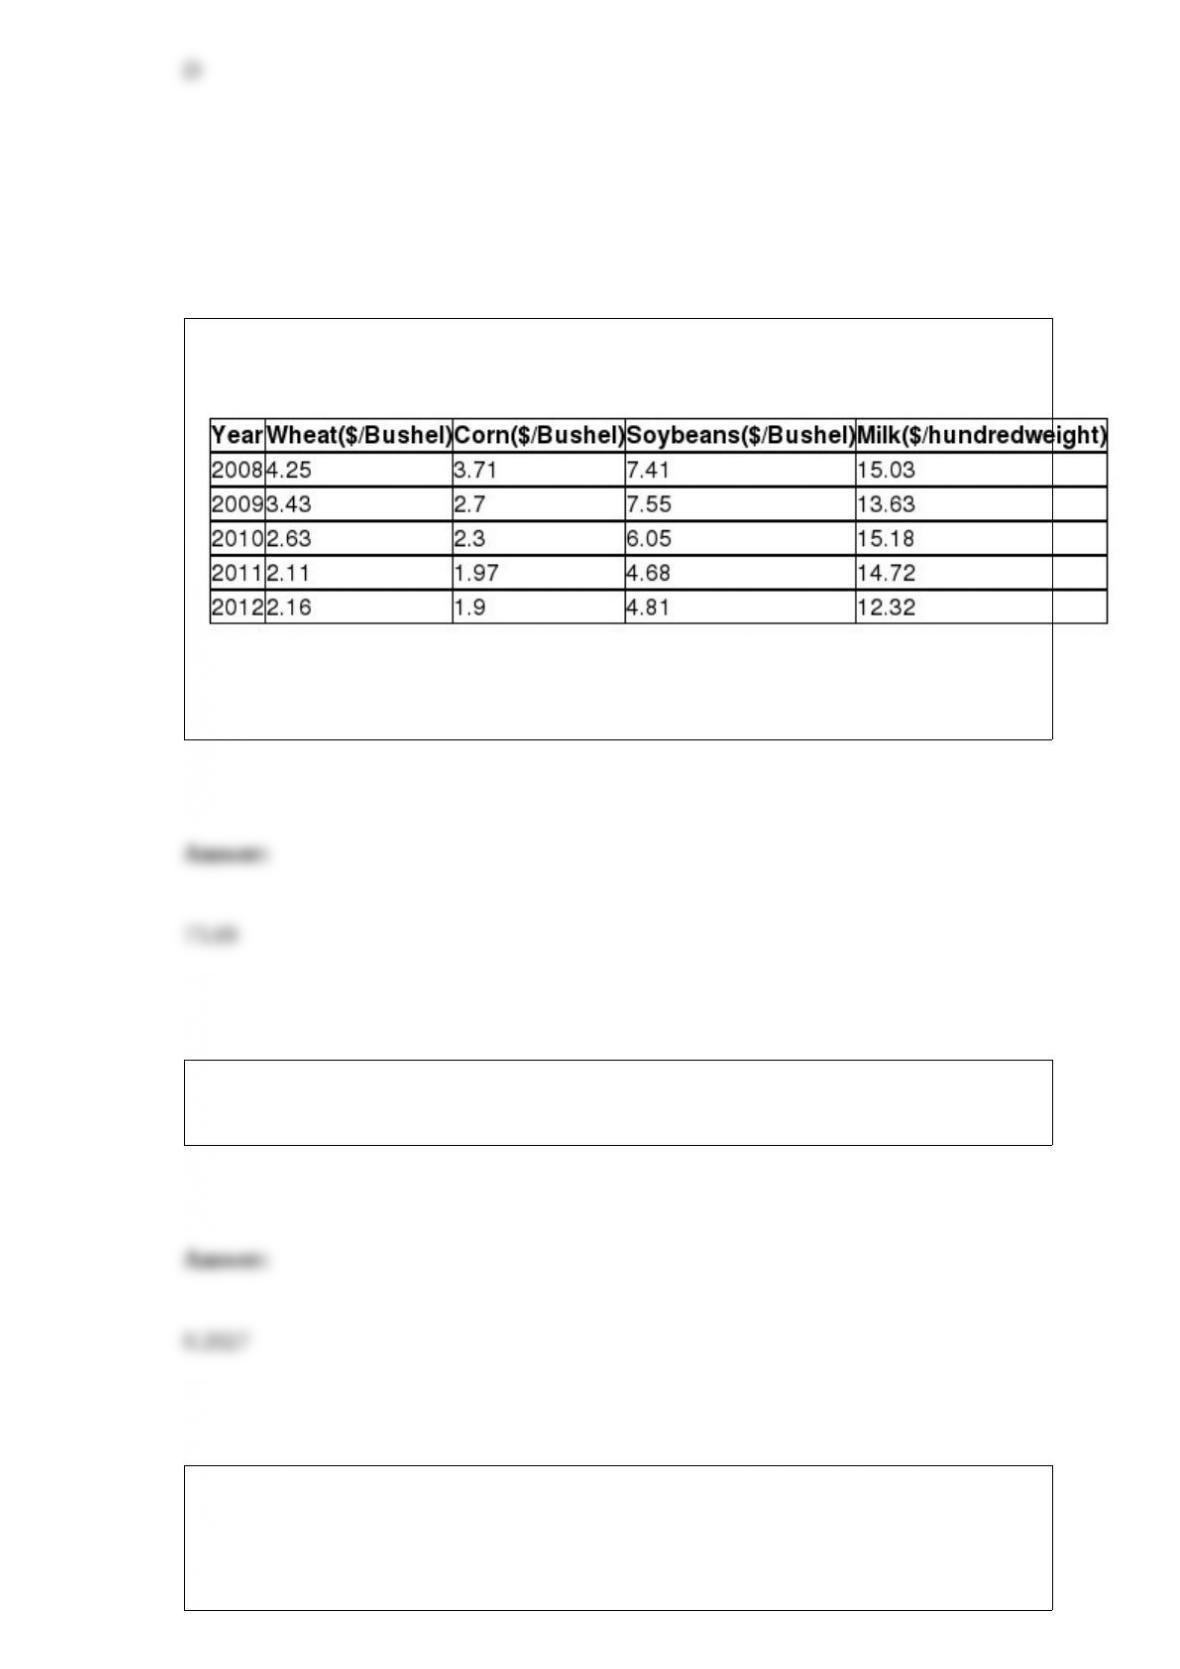
TABLE 16-16
Given below are the prices of a basket of four food items from 2008 to 2012.
Referring to Table 16-16, what is the Laspeyres price index for the basket of four food
items in 2012 that consisted of 50 bushels of wheat, 30 bushels of corn, 40 bushels of
soybeans and 80 hundredweight of milk in 2008 using 2008 as the base year?
The number of 911 calls in Butte, Montana, has a Poisson distribution with a mean of
10 calls a day. The probability of seven or eight 911 calls in a day is ________.
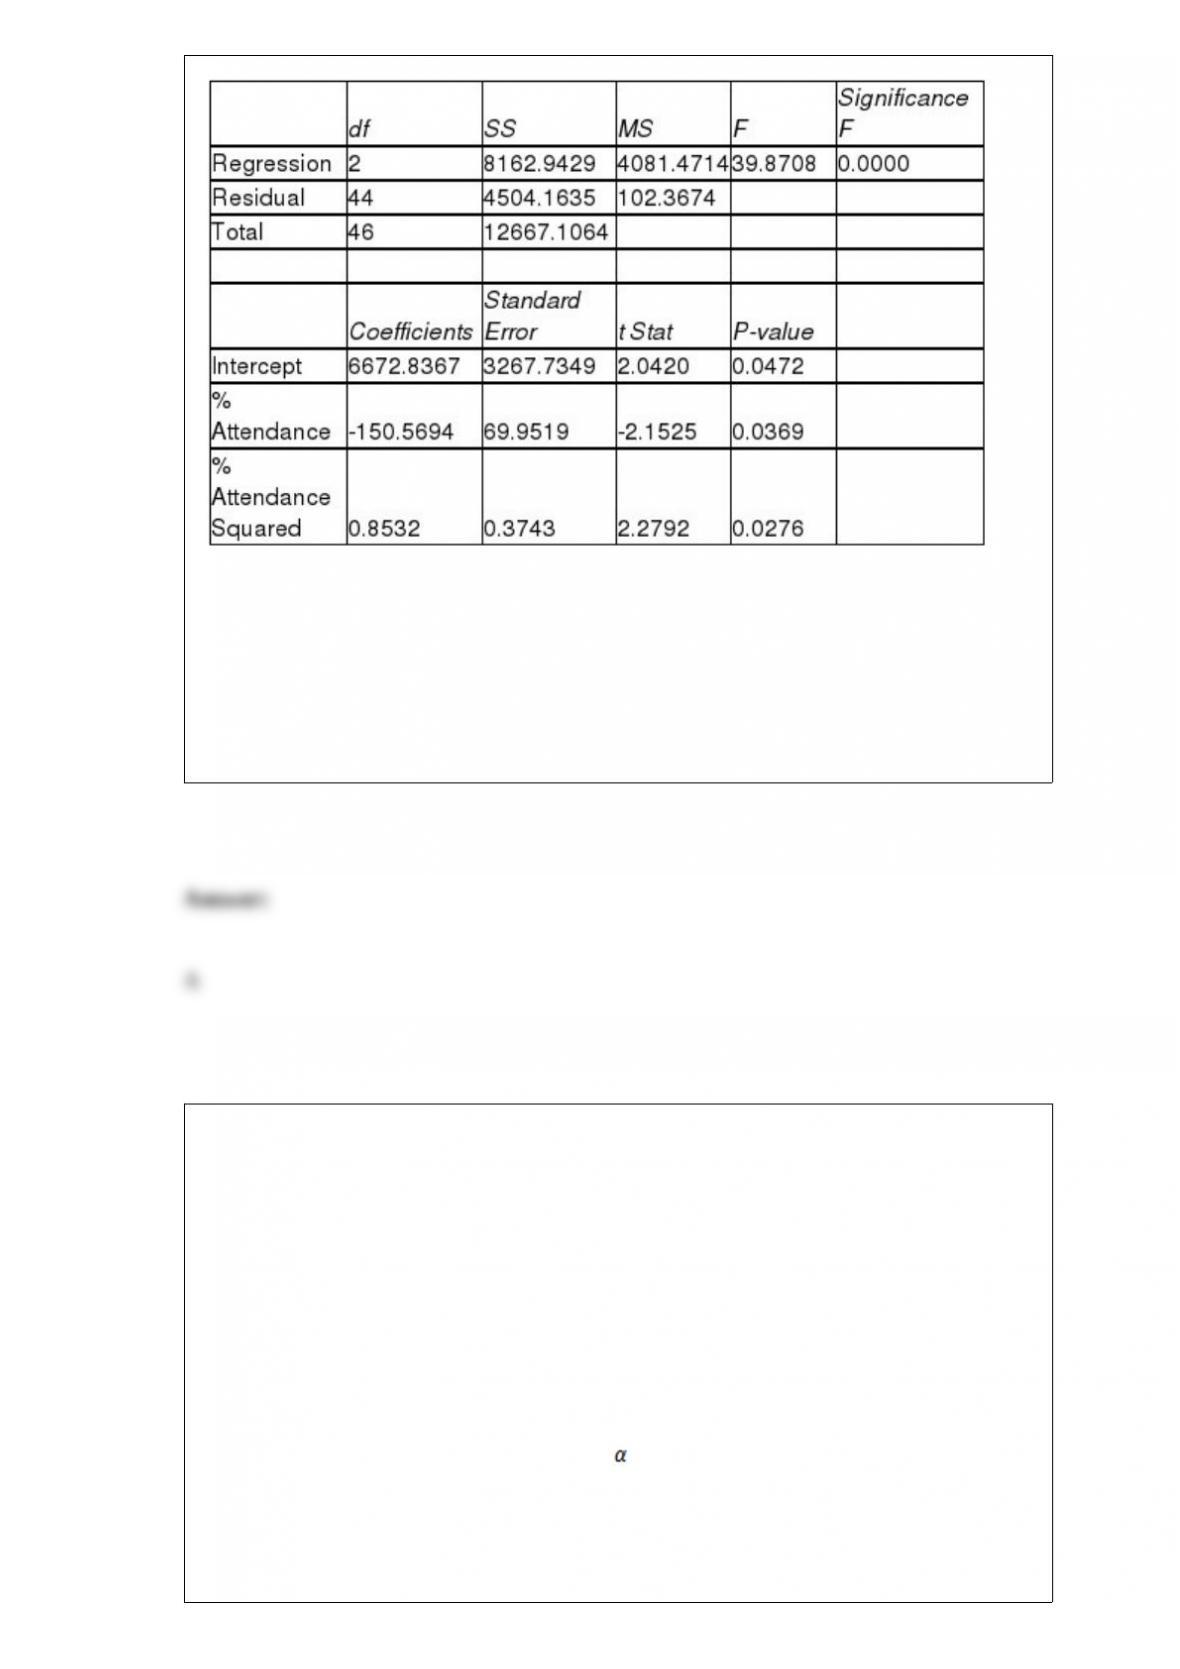
TABLE 17-8
The superintendent of a school district wanted to predict the percentage of students
passing a sixth-grade proficiency test. She obtained the data on percentage of students
passing the proficiency test (% Passing), daily mean of the percentage of students
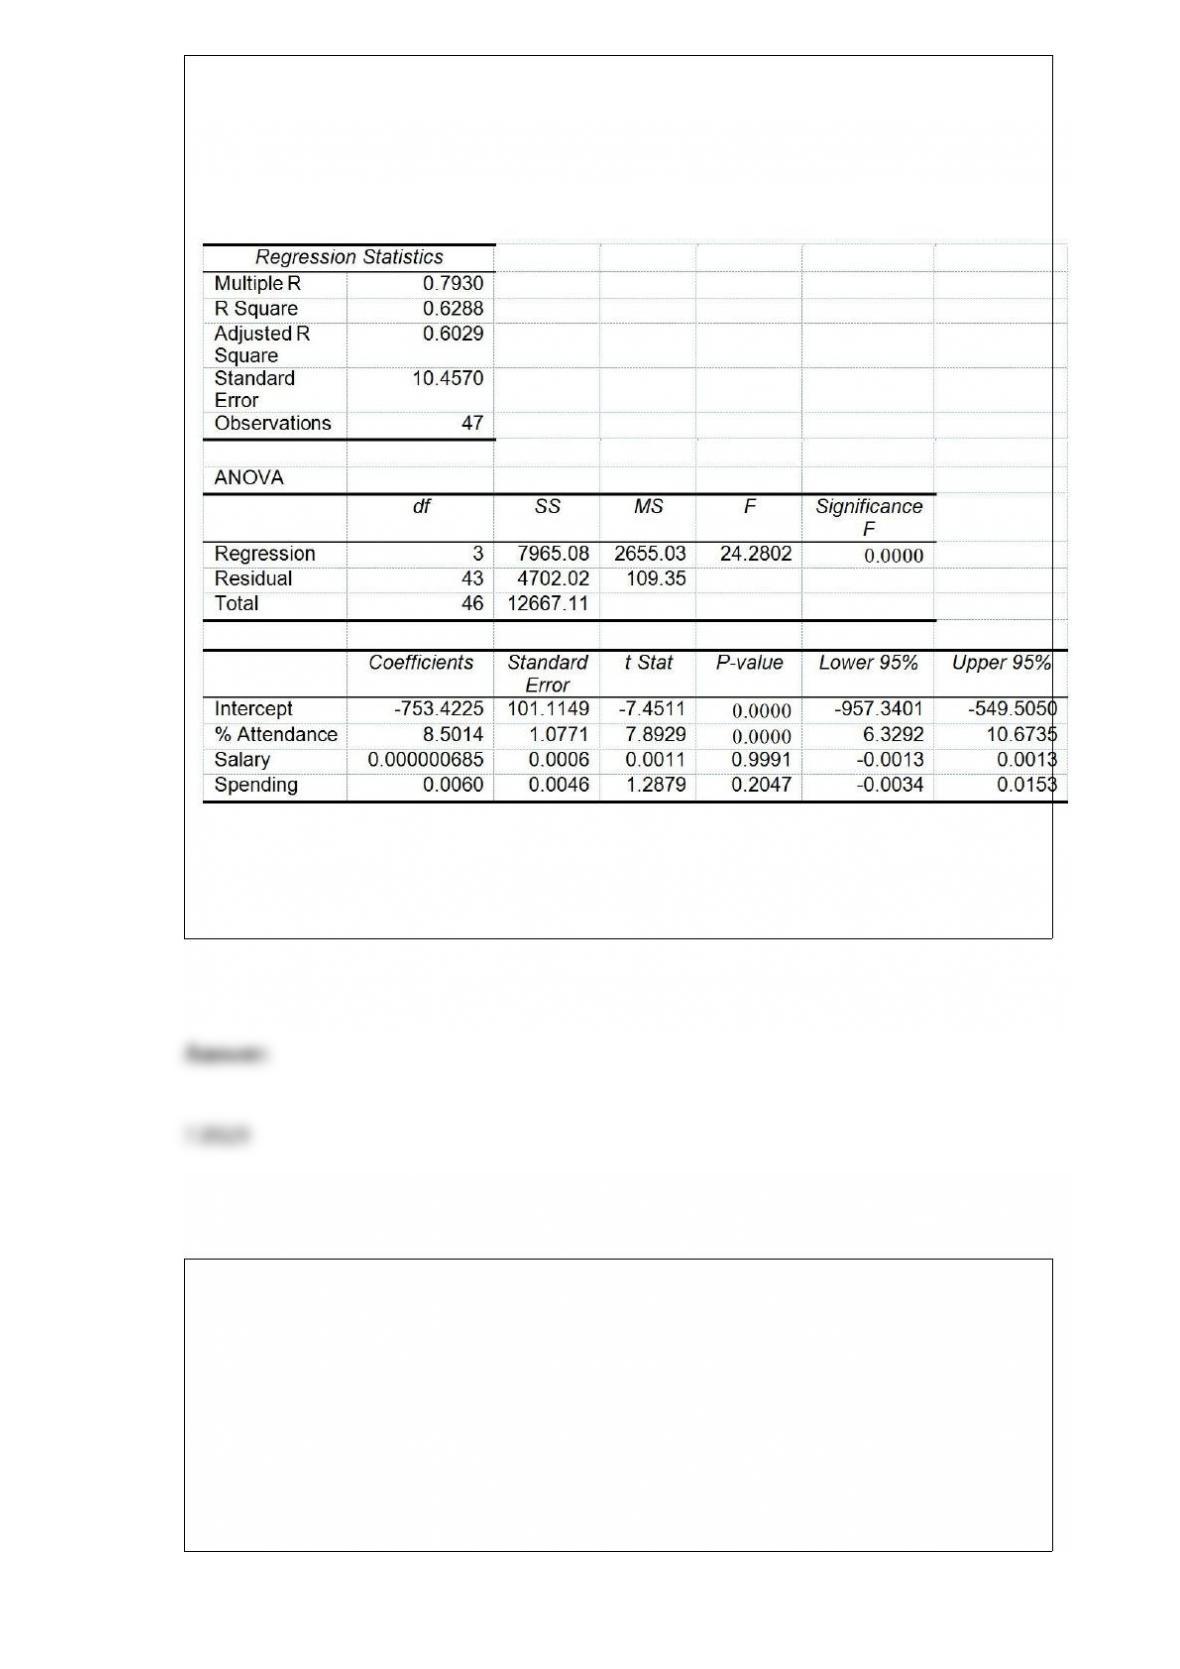
attending class (% Attendance), mean teacher salary in dollars (Salaries), and
instructional spending per pupil in dollars (Spending) of 47 schools in the state.
Following is the multiple regression output with Y = % Passing as the dependent
variable, X1 = % Attendance, X2 = Salaries and X3 = Spending:
Referring to Table 17-8, what is the value of the test statistic when testing whether the
daily mean of the percentage of students attending class has any effect on the
percentage of students passing the proficiency test, taking into account the effect of all
the other independent variables?
TABLE 4-8
According to the record of the registrar’s office at a state university, 35% of the students
are freshman, 25% are sophomore, 16% are junior and the rest are senior. Among the
freshmen, sophomores, juniors and seniors, the portion of students who live in the
dormitory are, respectively, 80%, 60%, 30% and 20%.
Referring to Table 4-8, determine whether the class status of a student and whether the
student lives in a dormitory are independent.
In a game called Taxation and Evasion, a player rolls a pair of dice. If on any turn the
sum is 7, 11, or 12, the player gets audited. Otherwise, she avoids taxes. Suppose a
player takes 5 turns at rolling the dice. The probability that she gets audited once is
________.
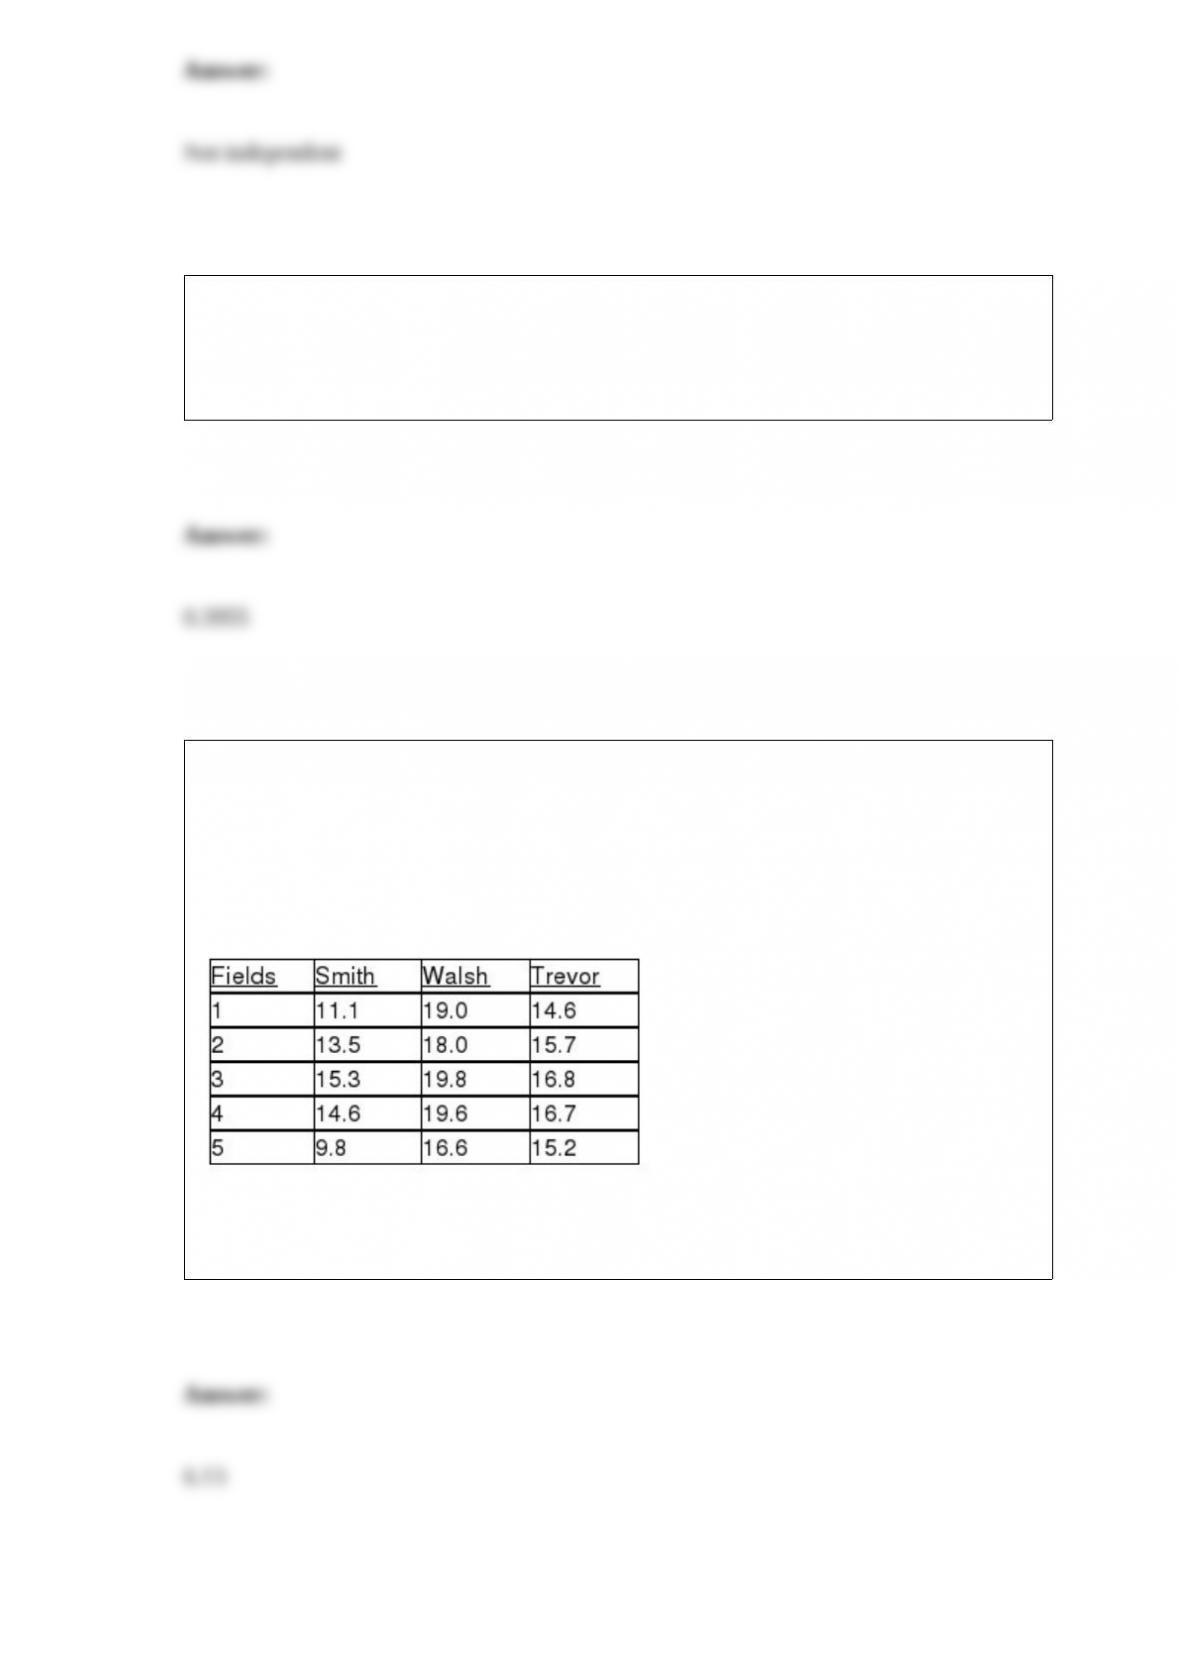
TABLE 11-10
An agronomist wants to compare the crop yield of 3 varieties of chickpea seeds. She
plants all 3 varieties of the seeds on each of 5 different patches of fields. She then
measures the crop yield in bushels per acre. Treating this as a randomized block design,
the results are presented in the table that follows.
Referring to Table 11-10, what is the value of the F test statistic for testing the block
effects?
TABLE 7-2
The mean selling price of new homes in a small town over a year was $115,000. The
population standard deviation was $25,000. A random sample of 100 new home sales
from this city was taken.
Referring to Table 7-2, what is the probability that the sample mean selling price was
between $114,000 and $116,000?