True or False: A boxplot is a graphical representation of a five-number summary.
True or False: Suppose = 50 and = 10 for a population. In a sample where n = 100 is
randomly taken, 90% of all possible sample means will fall between 49 and 51.
True or False: TABLE 17-10
Given below are results from the regression analysis where the dependent variable is
the number of weeks a worker is unemployed due to a layoff (Unemploy) and the
independent variables are the age of the worker (Age), the number of years of education
received (Edu), the number of years at the previous job (Job Yr), a dummy variable for
marital status (Married: 1 = married, 0 = otherwise), a dummy variable for head of
household (Head: 1 = yes, 0 = no) and a dummy variable for management position
(Manager: 1 = yes, 0 = no). We shall call this Model 1. The coefficient of partial
determination ( ) of each of the 6 predictors are, respectively,
0.2807, 0.0386, 0.0317, 0.0141, 0.0958, and 0.1201.
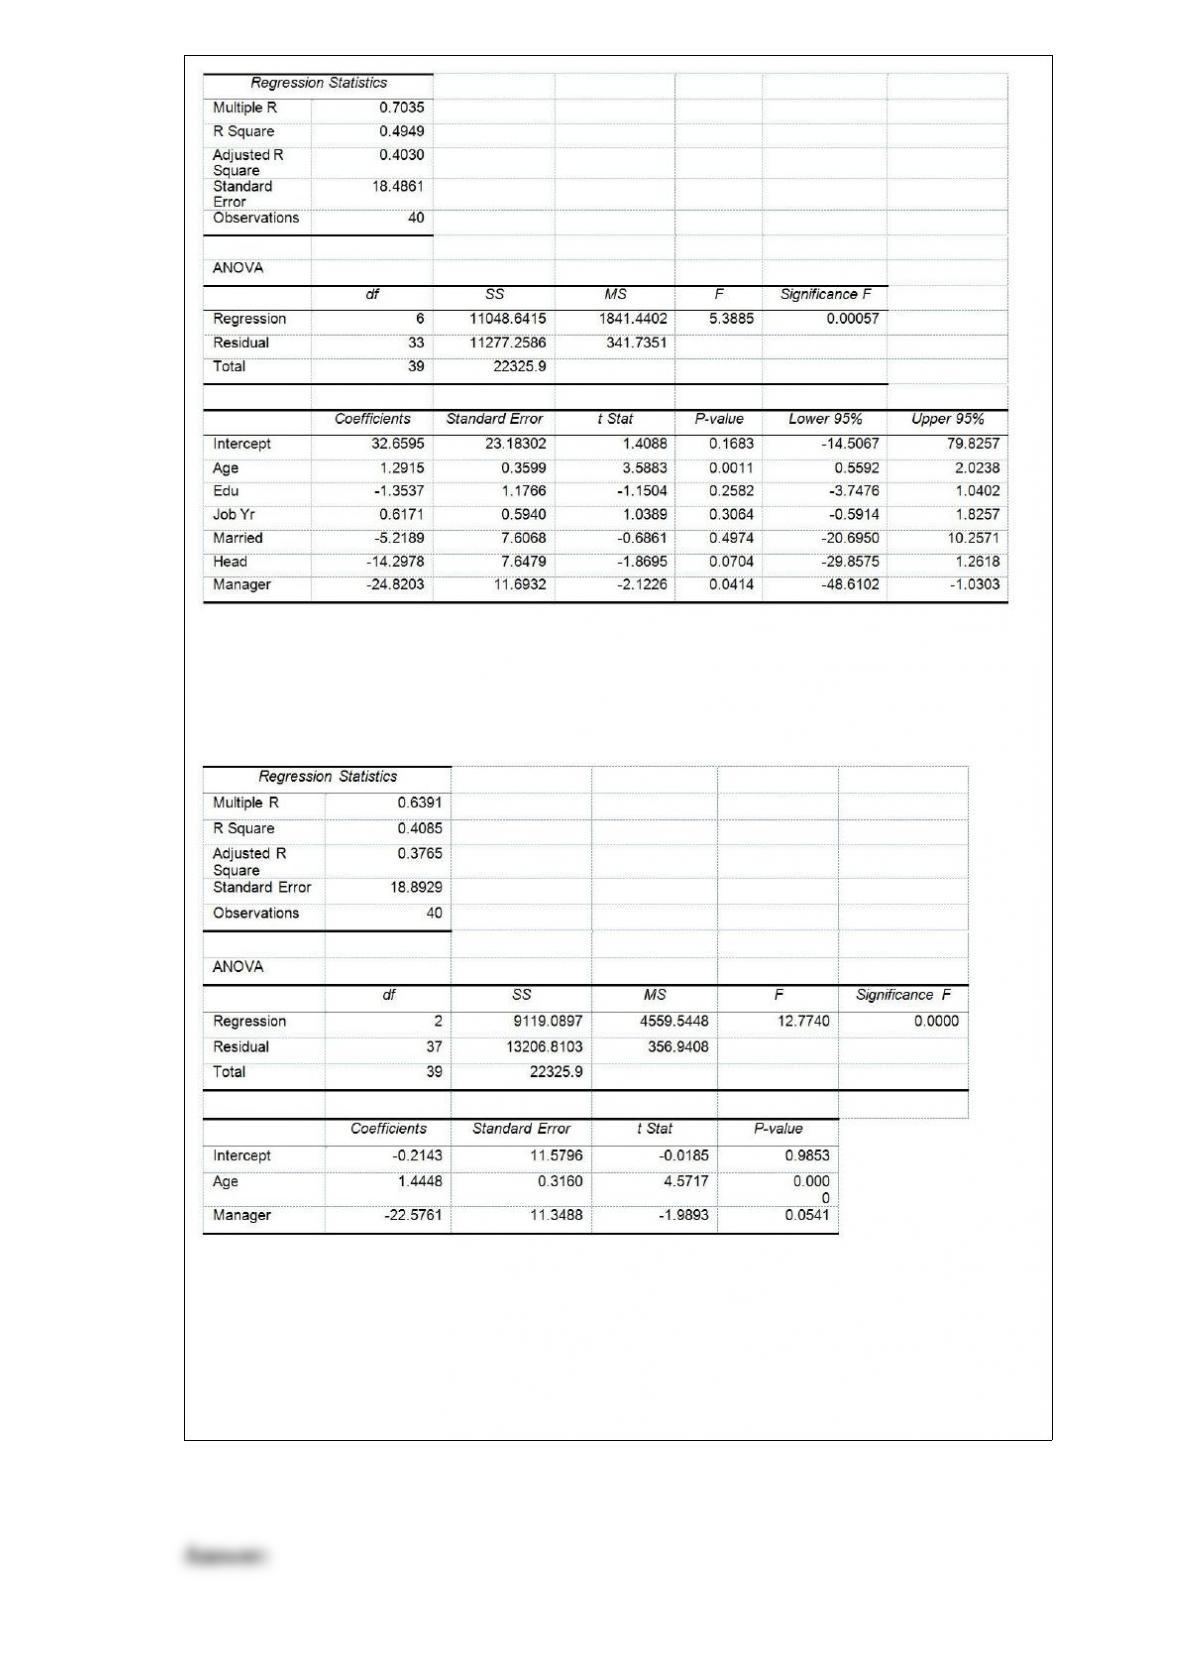
Model 2 is the regression analysis where the dependent variable is Unemploy and the
independent variables are Age and Manager. The results of the regression analysis are
given below:
Referring to Table 17-10, Model 1, you can conclude that, holding constant the effect of
the other independent variables, the number of years of education received has no
impact on the mean number of weeks a worker is unemployed due to a layoff at a 5%
level of significance if we use only the information of the 95% confidence interval
estimate forβ2.
True or False: The Guidelines for Developing Visualizations recommend labeling all
axes only when it is possible.
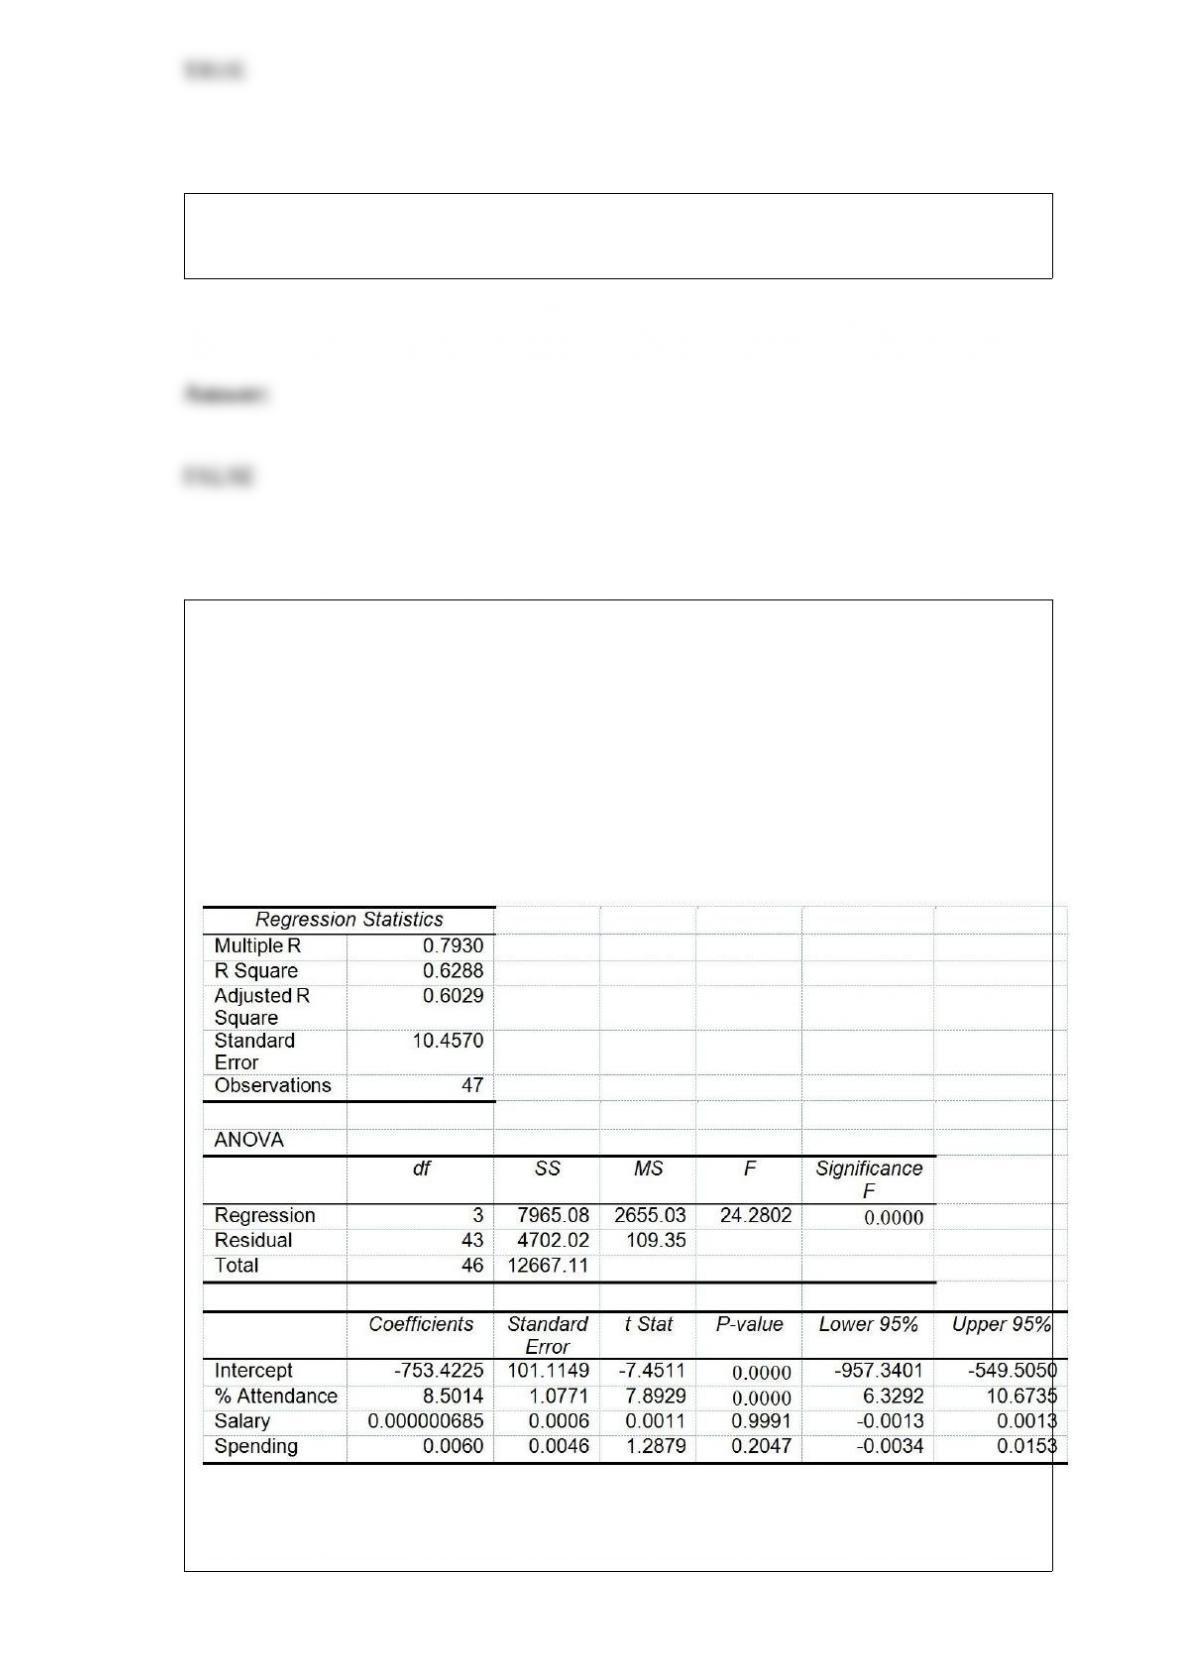
True or False: TABLE 17-8
The superintendent of a school district wanted to predict the percentage of students
passing a sixth-grade proficiency test. She obtained the data on percentage of students
passing the proficiency test (% Passing), daily mean of the percentage of students
attending class (% Attendance), mean teacher salary in dollars (Salaries), and
instructional spending per pupil in dollars (Spending) of 47 schools in the state.
Following is the multiple regression output with Y = % Passing as the dependent
variable, X1 = % Attendance, X2 = Salaries and X3 = Spending:
Referring to Table 17-8, there is sufficient evidence that the percentage of students
passing the proficiency test depends on at least one of the explanatory variables at a 5%
level of significance.
TABLE 7-4
According to a survey, only 15% of customers who visited the website of a major retail
store made a purchase. Random sample sizes of 50 are selected.
True or False: Referring to Table 7-4, the requirements for using a normal distribution
to approximate a binomial distribution is fulfilled.
True or False: When the F test is used for ANOVA, the rejection region is always in the
right tail.
True or False: A statistic is usually used to provide an estimate for a usually unobserved
parameter.
True or False: TABLE 17-5
You worked as an intern at We Always Win Car Insurance Company last summer. You
notice that individual car insurance premiums depend very much on the age of the
individual, the number of traffic tickets received by the individual, and the population
density of the city in which the individual lives. You performed a regression analysis in
EXCEL and obtained the following information:
Referring to Table 17-5, to test the significance of the multiple regression model, the
null hypothesis should be rejected while allowing for 1% probability of committing a
type I error.
TABLE 11-8
An important factor in selecting database software is the time required for a user to
learn how to use the system. To evaluate three potential brands (A, B and C) of database
software, a company designed a test involving five different employees. To reduce
variability due to differences among employees, each of the five employees is trained
on each of the three different brands. The amount of time (in hours) needed to learn
each of the three different brands is given below:
Below is the Excel output for the randomized block design:
True or False: Referring to Table 11-8, the randomized block F test is valid only if the
population of the amount of time needed has the same variance for the 3 brands.
TABLE 8-12
A random sample of 100 stores from a large chain of 500 garden supply stores was
selected to determine the mean number of lawnmowers sold at an end-of-season
clearance sale. The sample results indicated a mean of 6 and a standard deviation of 2
lawnmowers sold. A 95% confidence interval (5.623 to 6.377) was established based on
these results.
True or False: Referring to Table 8-12, there are 10 possible samples of 100 stores that
can be selected out of the population of 1,000 stores.

In a perfectly symmetrical bell-shaped “normal” distribution,
A) the arithmetic mean equals the median.
B) the median equals the mode.
C) the arithmetic mean equals the mode.
D) All of the above.
TABLE 17-8
The superintendent of a school district wanted to predict the percentage of students
passing a sixth-grade proficiency test. She obtained the data on percentage of students
passing the proficiency test (% Passing), daily mean of the percentage of students
attending class (% Attendance), mean teacher salary in dollars (Salaries), and
instructional spending per pupil in dollars (Spending) of 47 schools in the state.
Following is the multiple regression output with Y = % Passing as the dependent
variable, X1 = % Attendance, X2 = Salaries and X3 = Spending:
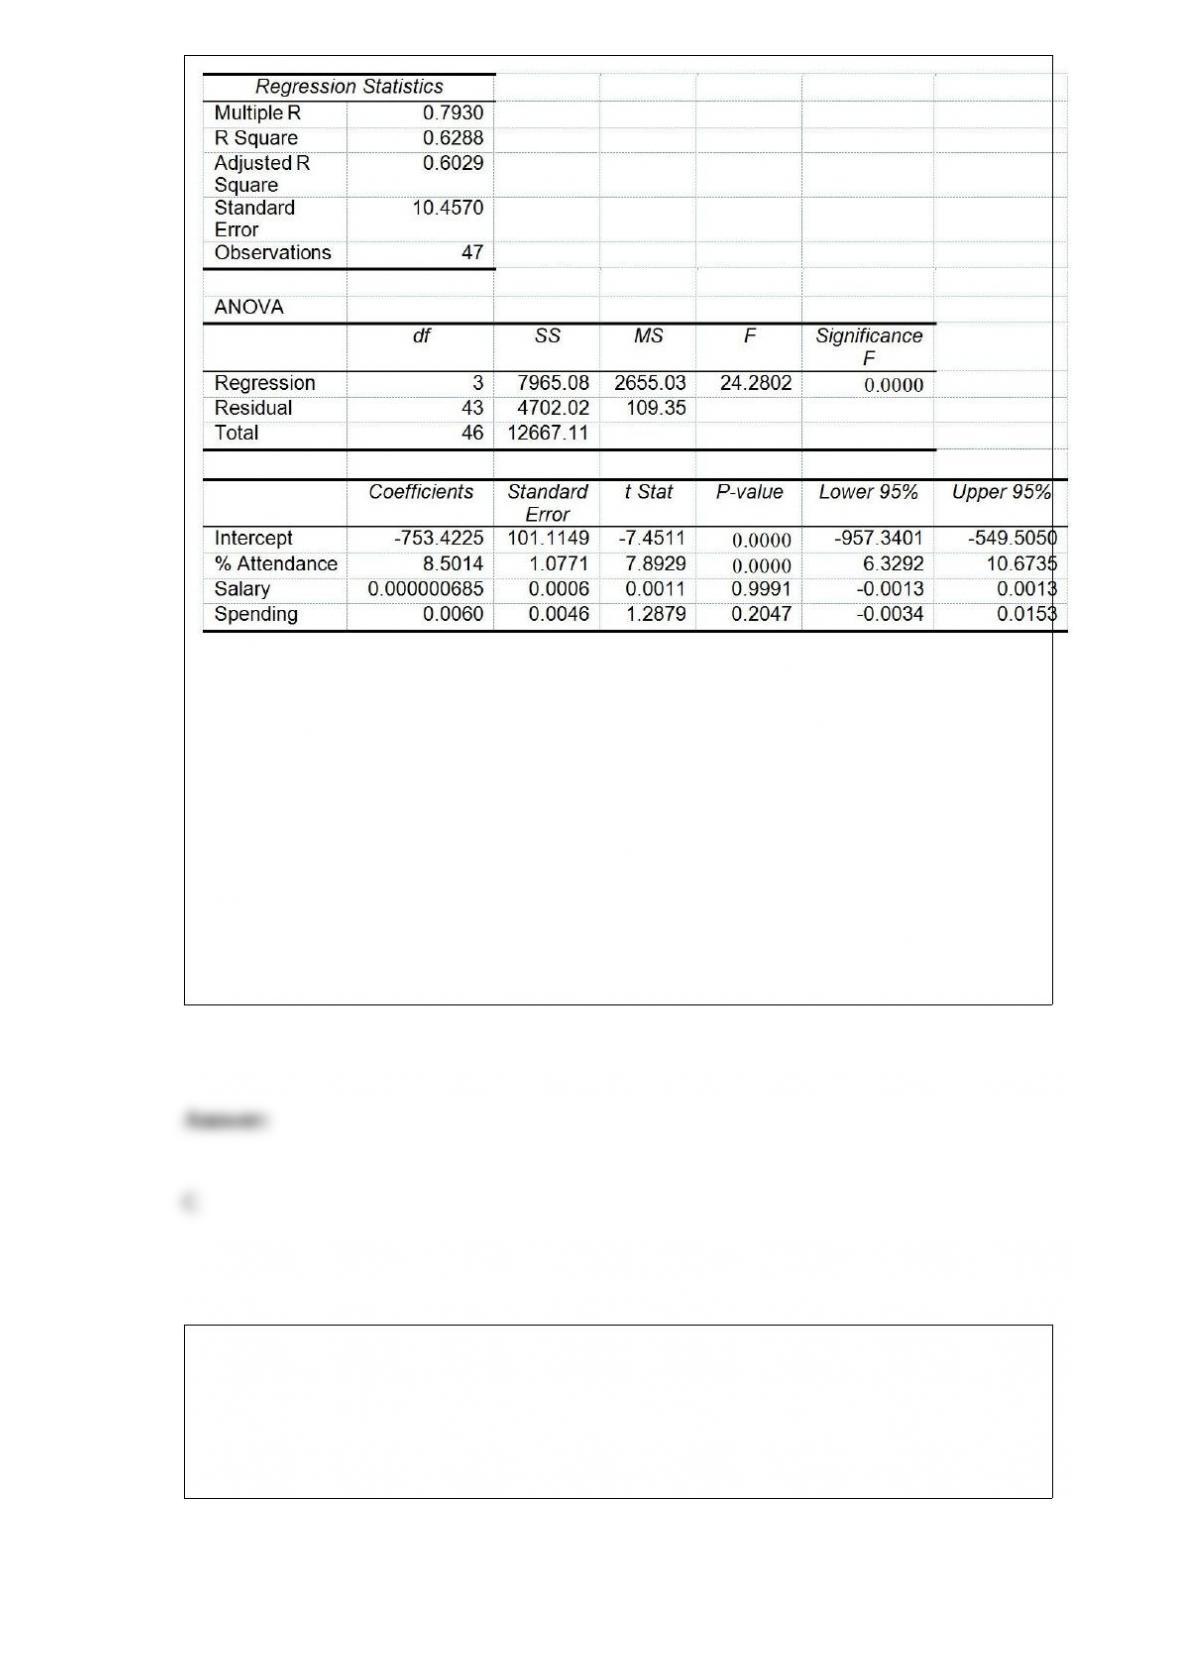
Referring to Table 17-8, which of the following is a correct statement?
A) The mean percentage of students passing the proficiency test is estimated to go up
by 8.50% when daily average of percentage of students attending class increases by 1%.
B) The daily mean of the percentage of students attending class is expected to go up by
an estimated 8.50% when the percentage of students passing the proficiency test
increases by 1%.
C) The mean percentage of students passing the proficiency test is estimated to go up
by 8.50% when daily average of the percentage of students attending class increases by
1% holding constant the effects of all the remaining independent variables.
D) The daily mean of the percentage of students attending class is expected to go up by
an estimated 8.50% when the percentage of students passing the proficiency test
increases by 1% holding constant the effects of all the remaining independent variables.
TABLE 18-6
The maker of a packaged candy wants to evaluate the quality of her production process.
On each of 16 consecutive days, she samples 600 bags of candy and determines the
number in each day’s sample that she considers to be of poor quality. The data that she
developed follow.
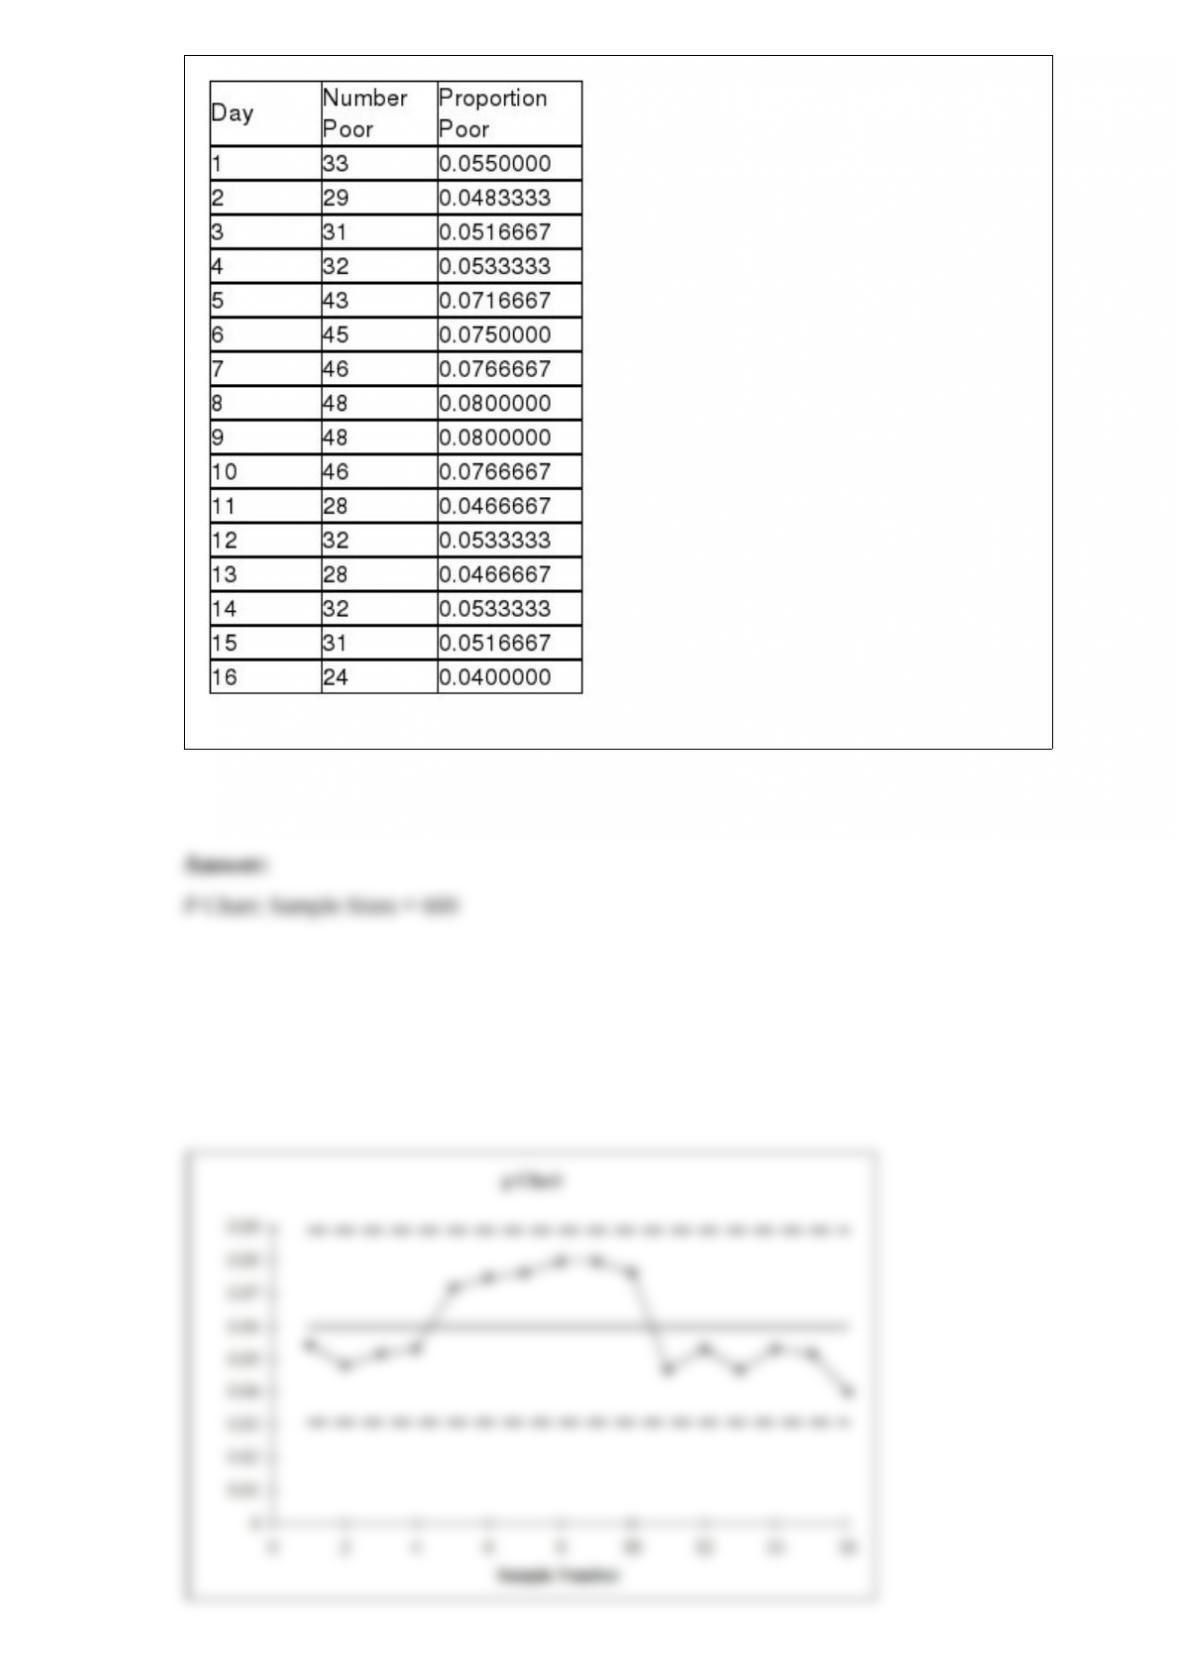
Referring to Table 18-6, construct a p control chart for these data.
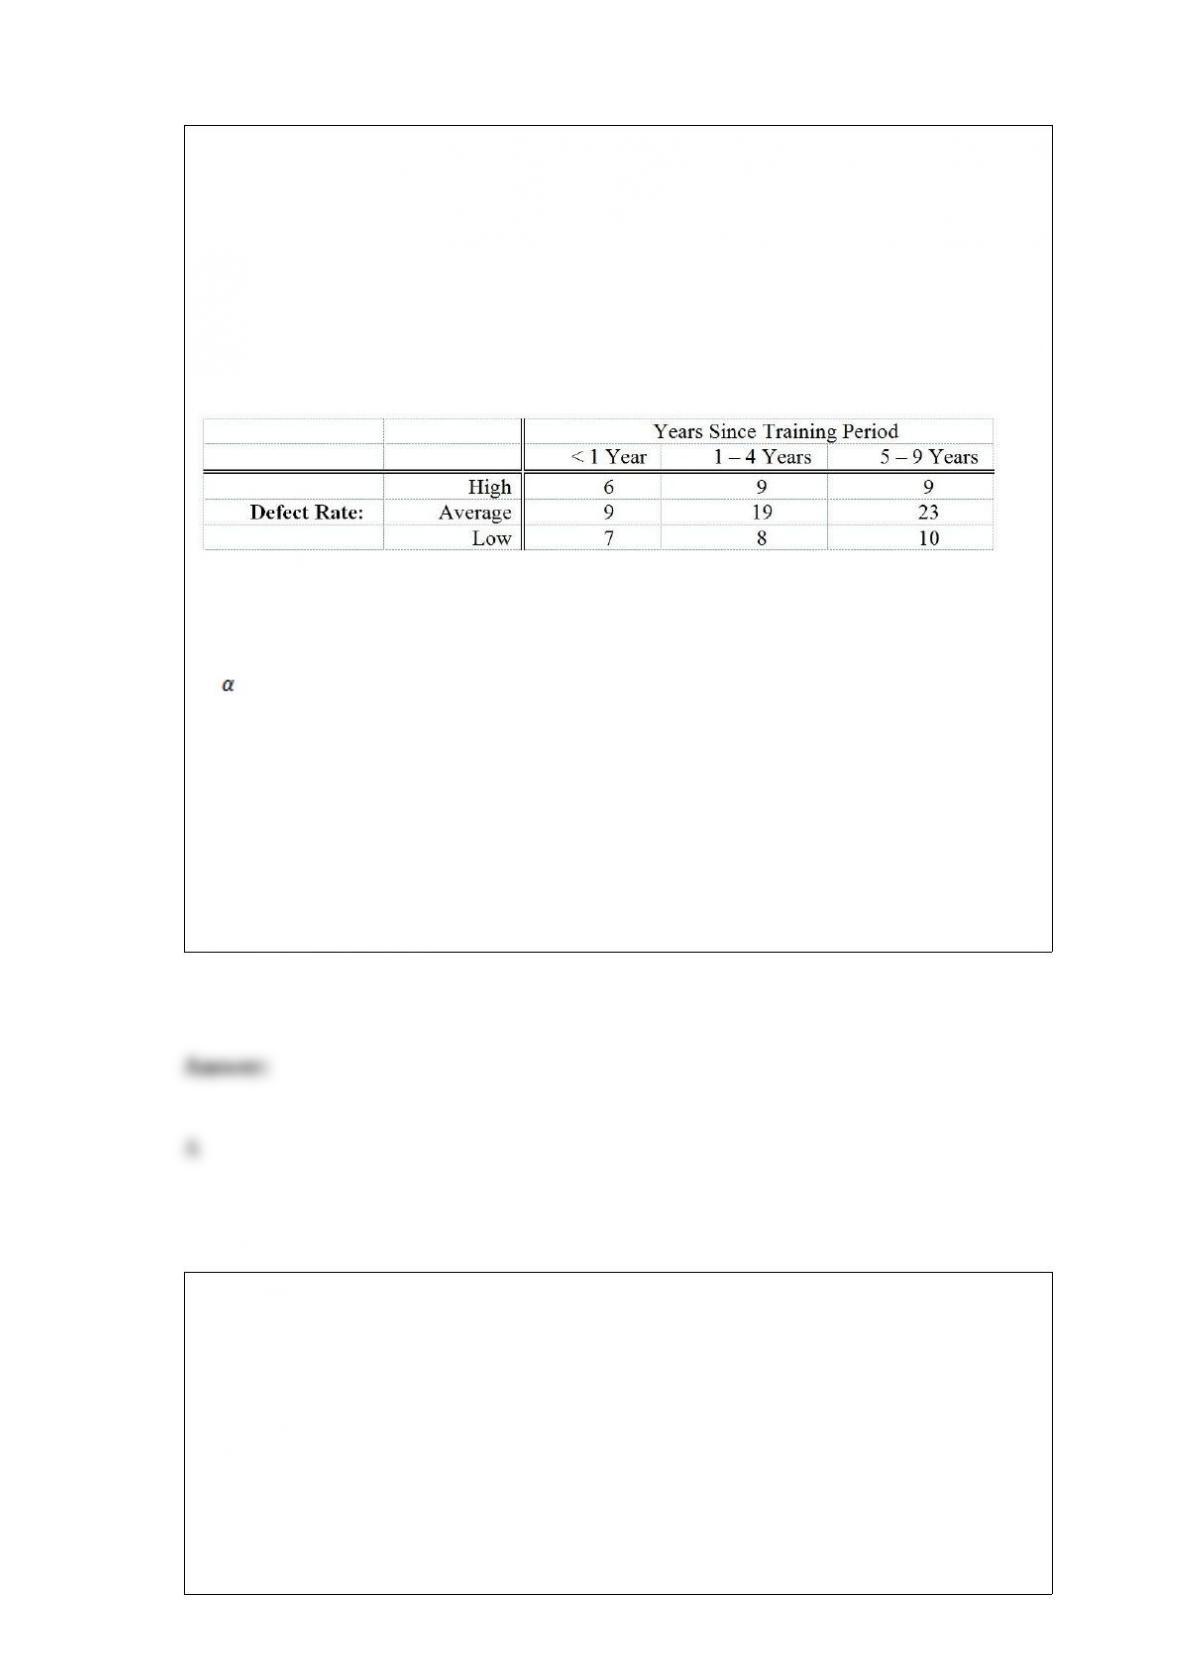
TABLE 12-10
One criterion used to evaluate employees in the assembly section of a large factory is
the number of defective pieces per 1,000 parts produced. The quality control
department wants to find out whether there is a relationship between years of
experience and defect rate. Since the job is repetitious, after the initial training period
any improvement due to a learning effect might be offset by a loss of motivation. A
defect rate is calculated for each worker in a yearly evaluation. The results for 100
workers are given in the table below.
Referring to Table 12-10, a test was conducted to determine if a relationship exists
between defect rate and years of experience. Which of the following p-values would
indicate that defect rate and years of experience are dependent? Assume you are testing
at = 0.05.
A) 0.045
B) 0.055
C) 0.074
D) 0.080
The head librarian at the Library of Congress has asked her assistant for an interval
estimate of the mean number of books checked out each day. The assistant provides the
following interval estimate: from 740 to 920 books per day. If the head librarian knows
that the population standard deviation is 150 books checked out per day, and she asked
her assistant to use 25 days of data to construct the interval estimate, what confidence
level can she attach to the interval estimate?
A) 99.7%
B) 99.0%
C) 98.0%
D) 95.4%
TABLE 6-7
A company has 125 personal computers. The probability that any one of them will
require repair on a given day is 0.15.
Referring to Table 6-7, which of the following is one of the properties required so that
the binomial distribution can be used to compute the probability that no more than 2
computers will require repair on a given day?
A) The number of personal computers the company owns on a given day is fixed.
B) The probability that a computer that will require repair in the morning is the same as
that in the afternoon.
C) The number of computers that will require repair in the morning is independent of
the number of computers that will require repair in the afternoon.
D) The probability that two or more computers that will require repair in a given day
approaches zero.
A company has 2 machines that produce widgets. An older machine produces 23%
defective widgets, while the new machine produces only 8% defective widgets. In
addition, the new machine produces 3 times as many widgets as the older machine
does. What is the probability that a randomly chosen widget produced by the company
is defective?
A) 0.078
B) 0.1175
C) 0.156
D) 0.310
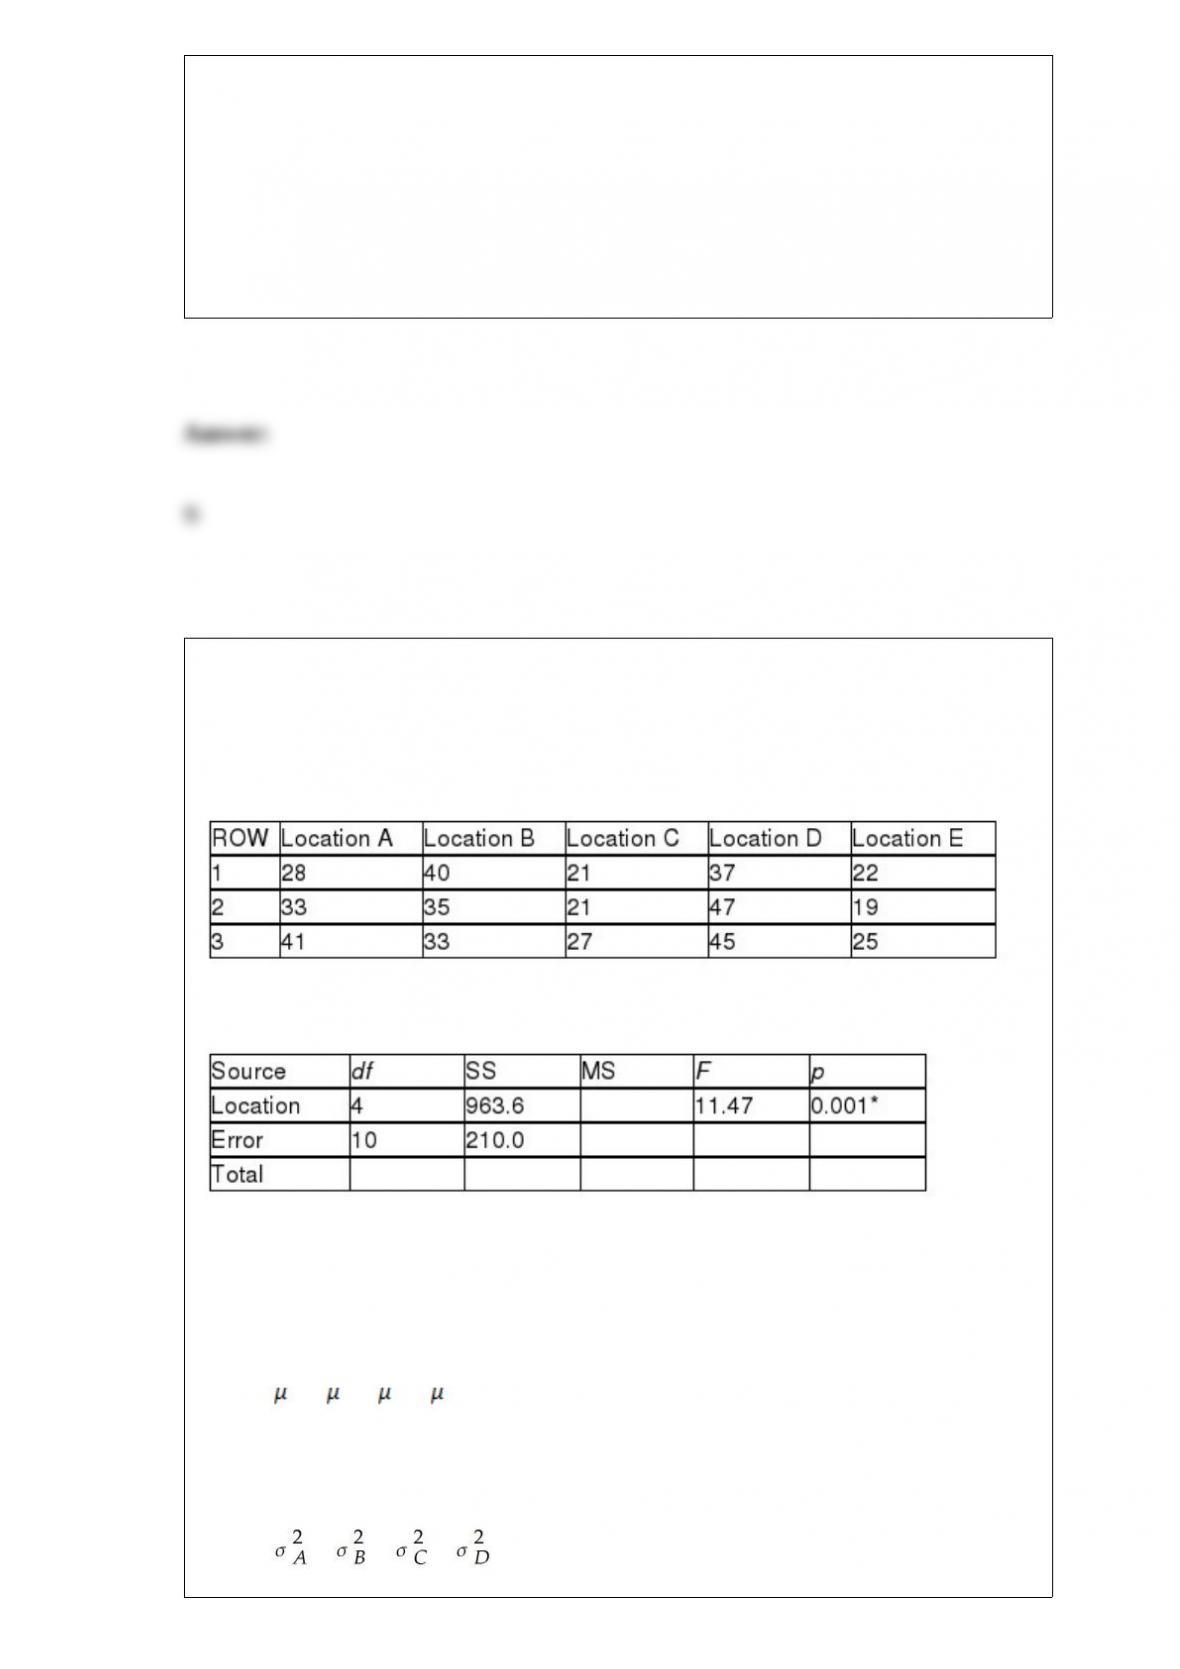
TABLE 11-5
A hotel chain has identically small sized resorts in 5 locations in different small islands.
The data that follow resulted from analyzing the hotel occupancies on randomly
selected days in the 5 locations.
Analysis of Variance
* or p < 0.005, tabular value
Referring to Table 11-5, the null hypothesis for Levene’s test for homogeneity of
variances is
A) H0 : A = B = C = D.
B) H0 : MA = MB = MC = MD.
C) H0 : = = = .

D) H0 : A = B = C = D.
The owner of a local nightclub has recently surveyed a random sample of n = 250
customers of the club. She would now like to determine whether or not the mean age of
her customers is more than 30. If so, she plans to alter the entertainment to appeal to an
older crowd. If not, no entertainment changes will be made. Which of the following
tests will you perform to help her make a decision?
A) t test for the mean
B) Z test for the proportion
C) Pooled-variance t test
D) Separate-variance t test
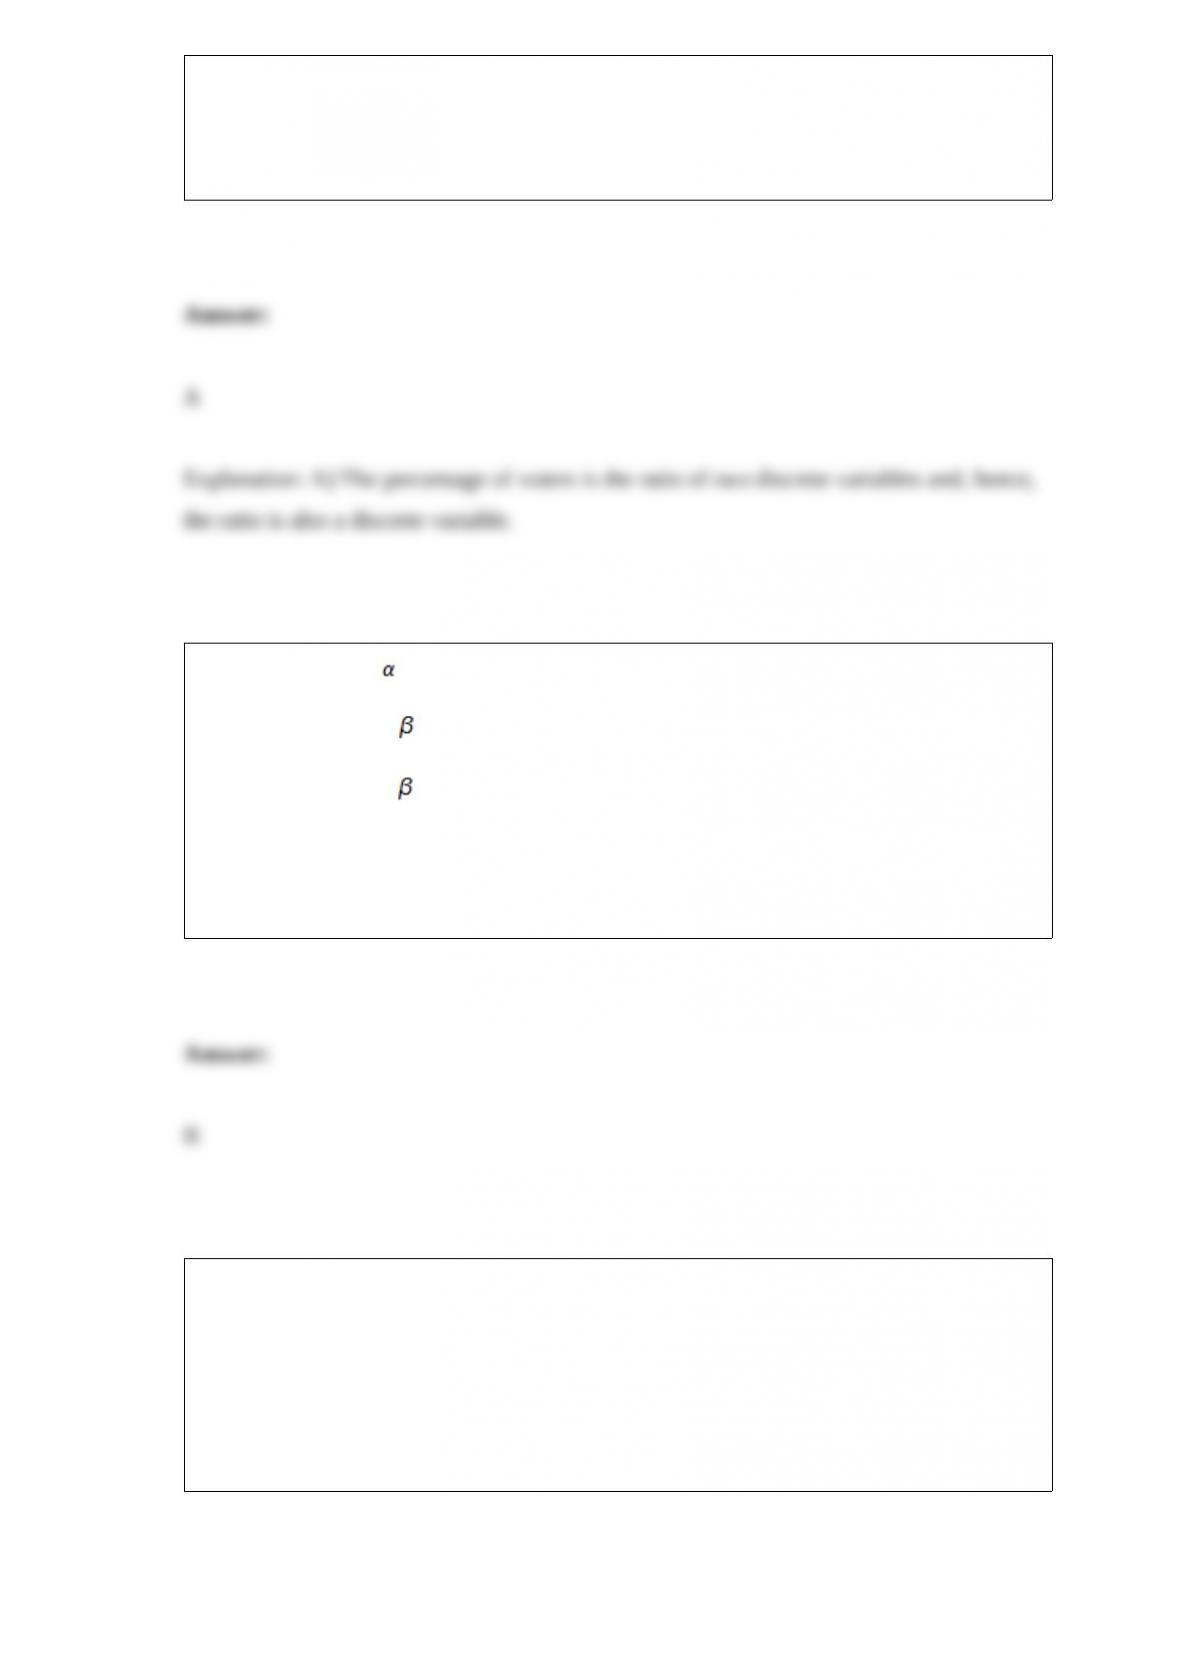
TABLE 17-7
As a project for his business statistics class, a student examined the factors that
determined parking meter rates throughout the campus area. Data were collected for the
price per hour of parking, blocks to the quadrangle, and one of the three jurisdictions:
on campus, in downtown and off campus, or outside of downtown and off campus. The
population regression model hypothesized is
Yi= α + β1X1i + β2X2i + β3X3i + ε
where
Y is the meter price
X1 is the number of blocks to the quad
X2 is a dummy variable that takes the value 1 if the meter is located in downtown and
off campus and the value 0 otherwise
X3 is a dummy variable that takes the value 1 if the meter is located outside of
downtown and off campus, and the value 0 otherwise
The following Excel results are obtained.
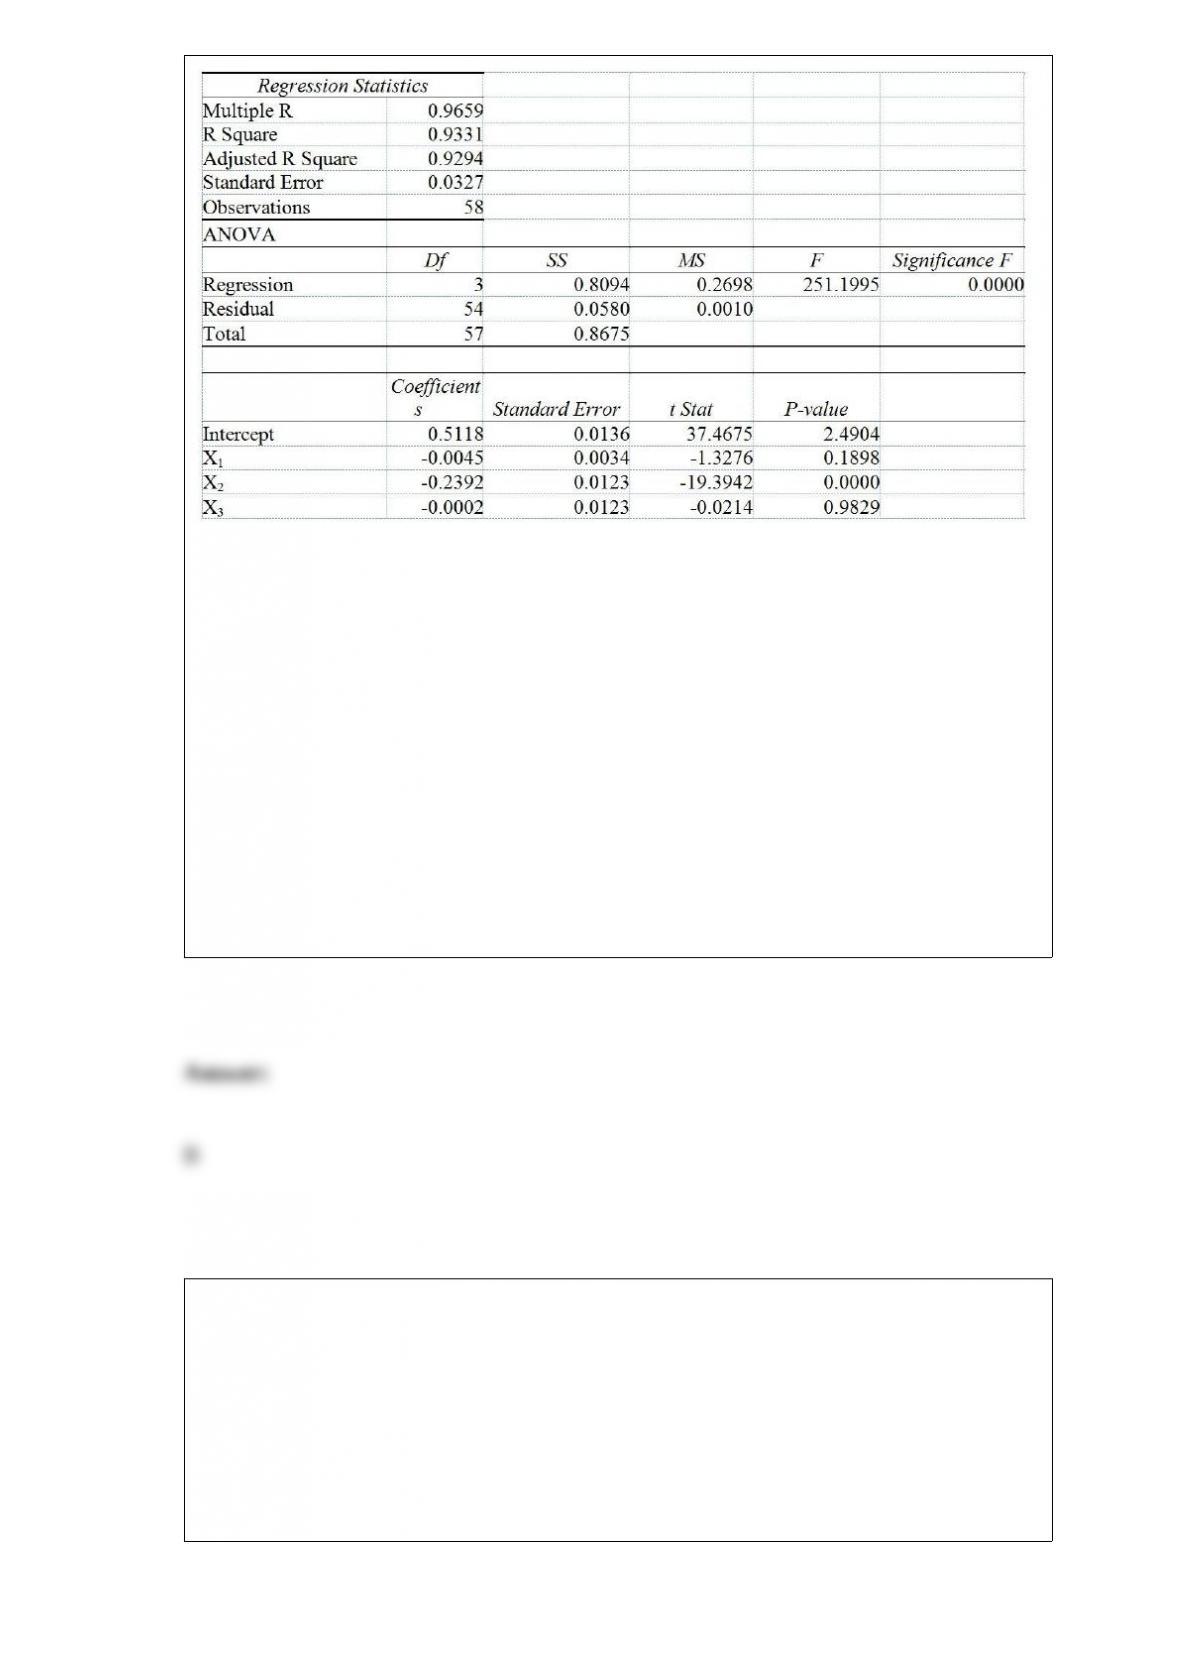
Referring to Table 17-7, what is the correct interpretation for the estimated coefficient
for X2?
A) Holding the effect of the other independent variables constant, the estimated mean
difference in costs between parking on campus, and parking outside of downtown and
off campus is -$0.24 per hour.
B) Holding the effect of the other independent variables constant, the estimated mean
difference in costs between parking in downtown and off campus, and parking on
campus is -$0.24 per hour.
C) Holding the effect of the other independent variables constant, the estimated mean
difference in costs between parking in downtown and off campus, and parking outside
of downtown and off campus is -$0.24 per hour.
D) Holding the effect of the other independent variables constant, the estimated mean
difference in costs between parking in downtown and off campus, and parking either
outside of downtown and off campus or on campus is -$0.24 per hour.
TABLE 13-11
A computer software developer would like to use the number of downloads (in
thousands) for the trial version of his new shareware to predict the amount of revenue
(in thousands of dollars) he can make on the full version of the new shareware.
Following is the output from a simple linear regression along with the residual plot and
normal probability plot obtained from a data set of 30 different sharewares that he has
developed:
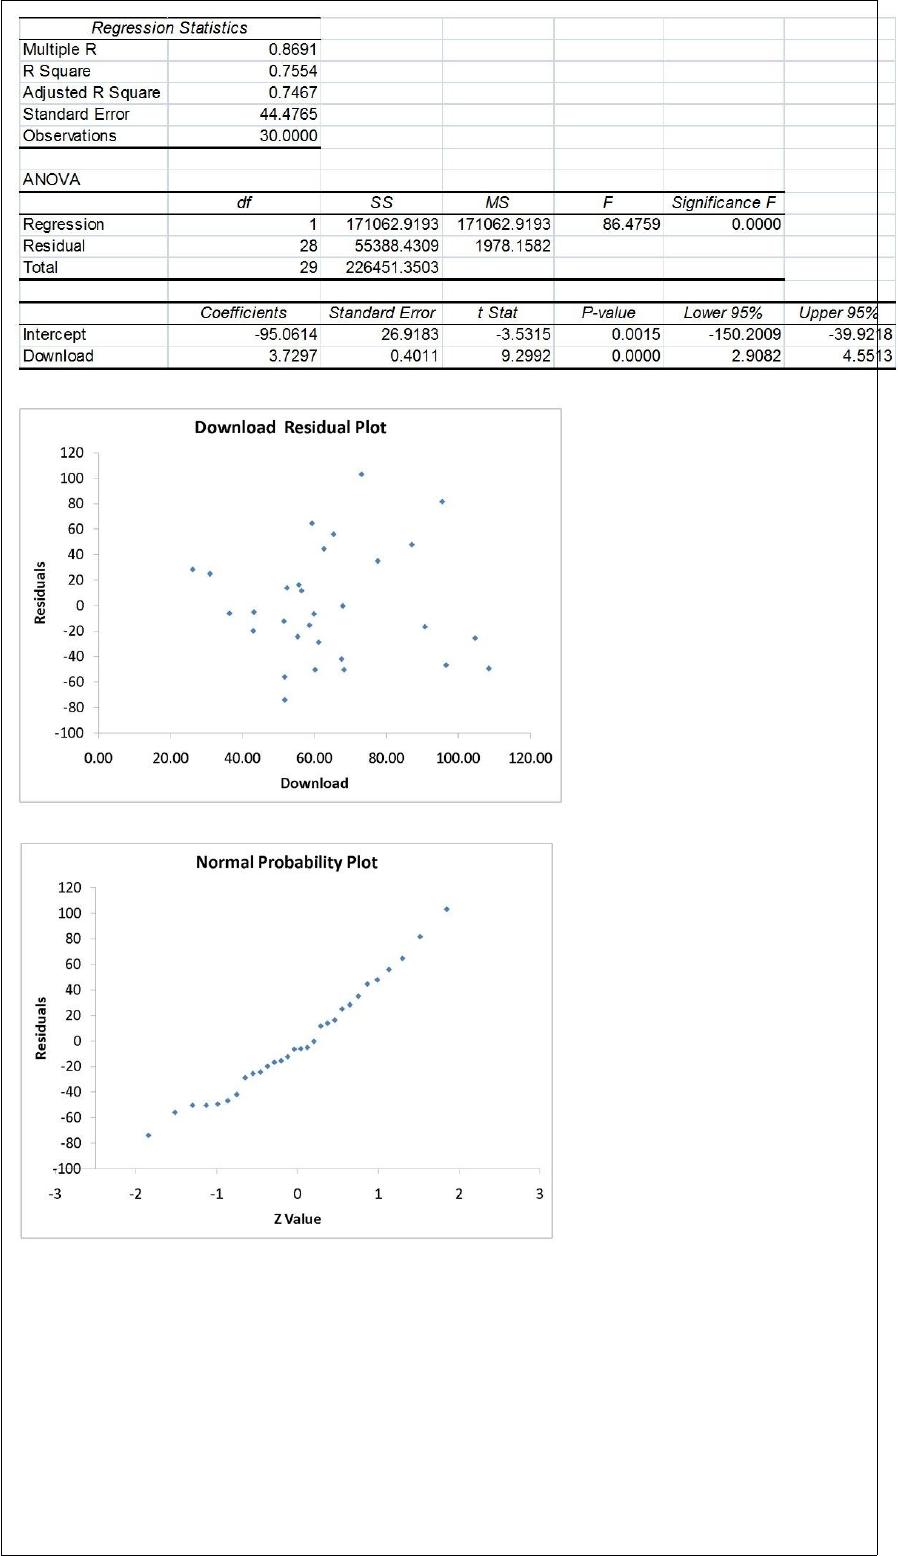
Referring to Table 13-11, which of the following is the correct interpretation for the
coefficient of determination?
A) 74.67% of the variation in revenue can be explained by the variation in the number
of downloads.
B) 75.54% of the variation in revenue can be explained by the variation in the number
of downloads.

C) 74.67% of the variation in the number of downloads can be explained by the
variation in revenue.
D) 75.54% of the variation in the number of downloads can be explained by the
variation in revenue.
Private colleges and universities rely on money contributed by individuals and
corporations for their operating expenses. Much of this money is put into a fund called
an endowment, and the college spends only the interest earned by the fund. A recent
survey of 8 private colleges in the United States collected information on the
endowment amount. Based on this information, which of the following will you
construct to learn about the mean endowment of all private colleges in the United
States?
A) Confidence interval estimate for the total using the Student’s t distribution
B) Confidence interval estimate for the mean using the Student’s t distribution
C) Confidence interval estimate for the proportion using the standard normal
distribution
D) Confidence interval estimate for the difference between two means using the
standard normal distribution
TABLE 1-2
A Wall Street Journal poll asked 2,150 adults in the United States a series of questions
to find out their view on the U.S. economy.
Referring to Table 1-2, the possible responses to the question “How satisfied are you
with the U.S. economy today with 1 = very satisfied, 2 = moderately satisfied, 3 =
neutral, 4 = moderately dissatisfied and 5 = very dissatisfied?” are values from a
A) discrete variable.

B) continuous variable.
C) categorical variable.
D) table of random numbers.
Most analysts focus on the cost of tuition as the way to measure the cost of a college
education. But incidentals, such as textbook costs, are rarely considered. A researcher at
Drummand University wishes to estimate the textbook costs of first-year students at
Drummand. To do so, she monitored the textbook cost of 250 first-year students and
found that their average textbook cost was $600 per semester. Identify the population of
interest to the researcher.
A) all Drummand University students
B) all college students
C) all first-year Drummand University students
D) the 250 students that were monitored
TABLE 17-10
Given below are results from the regression analysis where the dependent variable is
the number of weeks a worker is unemployed due to a layoff (Unemploy) and the
independent variables are the age of the worker (Age), the number of years of education
received (Edu), the number of years at the previous job (Job Yr), a dummy variable for
marital status (Married: 1 = married, 0 = otherwise), a dummy variable for head of
household (Head: 1 = yes, 0 = no) and a dummy variable for management position
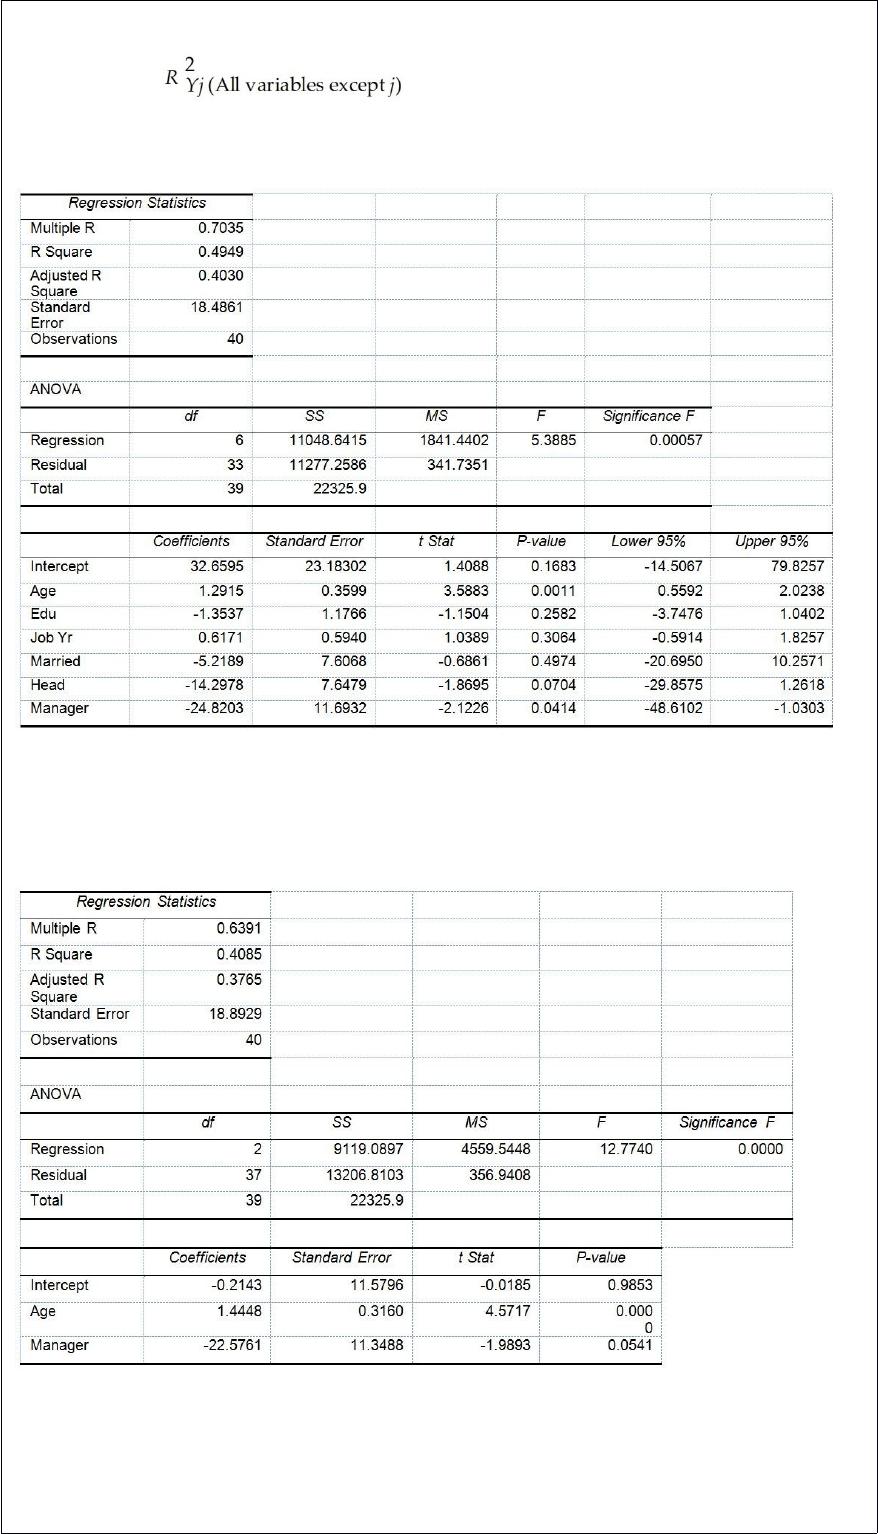
(Manager: 1 = yes, 0 = no). We shall call this Model 1. The coefficient of partial
determination ( ) of each of the 6 predictors are, respectively,
0.2807, 0.0386, 0.0317, 0.0141, 0.0958, and 0.1201.
Model 2 is the regression analysis where the dependent variable is Unemploy and the
independent variables are Age and Manager. The results of the regression analysis are
given below:
Referring to Table 17-10, Model 1, which of the following is the correct null hypothesis
to determine whether there is a significant relationship between the number of weeks a
worker is unemployed due to a layoff and the entire set of explanatory variables?
A) H0 : β0 = β1 = β2= β3 = β4 = β5 = β6 = 0
B) H0 : β1 = β2= β3 = β4 = β5 = β6 = 0
C) H0 : β0 = β1 = β2= β3 = β4 = β5 = β6
D)H0 : β1 = β2= β3 = β4 = β5 = β6
An interaction term in a multiple regression model may be used when
A) the coefficient of determination is small.
B) there is a curvilinear relationship between the dependent and independent variables.
C) neither one of 2 independent variables contribute significantly to the regression
model.
D) the relationship between X1 and Y changes for differing values of X2.
TABLE 17-12
The marketing manager for a nationally franchised lawn service company would like to
study the characteristics that differentiate home owners who do and do not have a lawn
service. A random sample of 30 home owners located in a suburban area near a large
city was selected; 15 did not have a lawn service (code 0) and 15 had a lawn service
(code 1). Additional information available concerning these 30 home owners includes
family income (Income, in thousands of dollars), lawn size (Lawn Size, in thousands of
square feet), attitude toward outdoor recreational activities (Attitude 0 = unfavorable, 1
= favorable), number of teenagers in the household (Teenager), and age of the head of
the household (Age).
The Minitab output is given below:
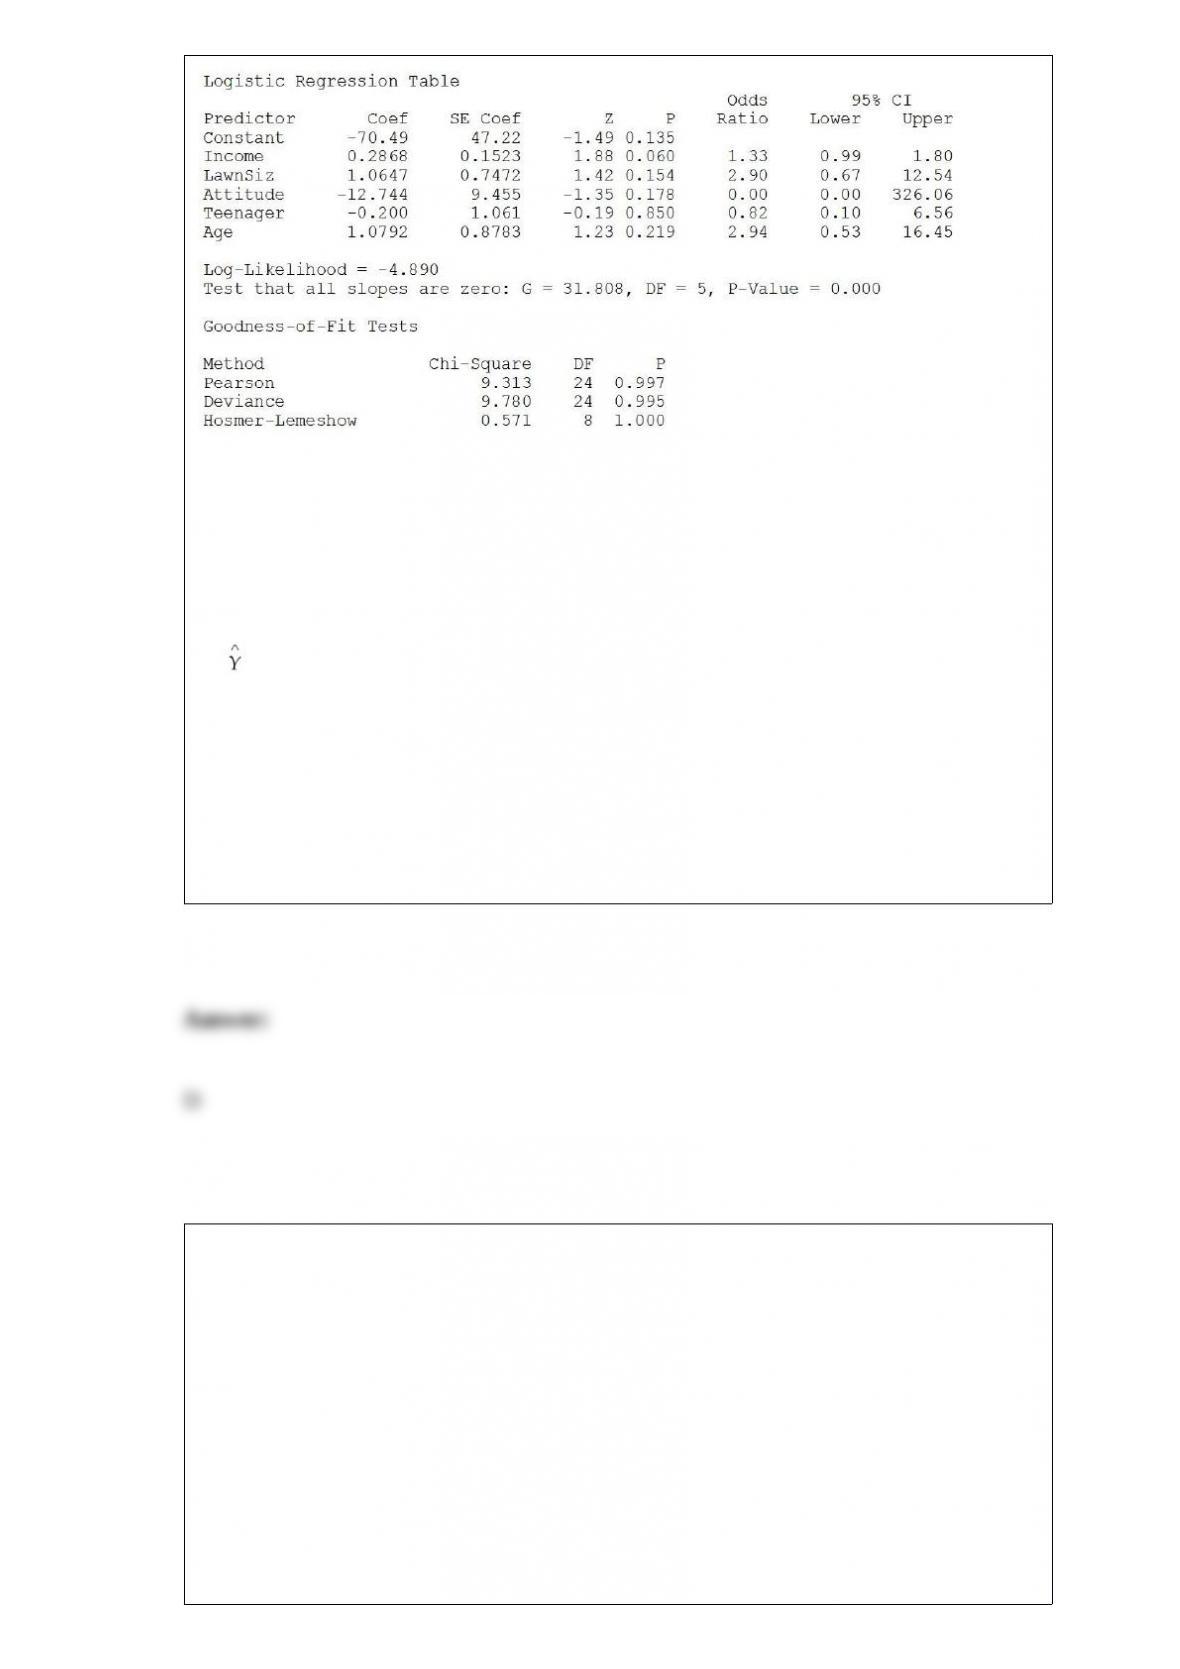
Referring to Table 17-12, which of the following is the correct expression for the
estimated model?
A) Y = -70.49 + 0.268 Income + 1.0647 LawnSize – 12.744 Attitude – 0.200 Teenager +
1.0792 Age
B) = -70.49 + 0.268 Income + 1.0647 LawnSize – 12.744 Attitude – 0.200 Teenager +
1.0792 Age
C) ln (odds ratio) = -70.49 + 0.268 Income + 1.0647 LawnSize – 12.744 Attitude – 0.200
Teenager + 1.0792 Age
D) ln (estimated odds ratio) = -70.49 + 0.268 Income + 1.0647 LawnSize – 12.744
Attitude – 0.200 Teenager + 1.0792 Age
TABLE 1-2
A Wall Street Journal poll asked 2,150 adults in the United States a series of questions
to find out their view on the U.S. economy.
Referring to Table 1-2, the possible responses to the question “How many out of every
10 U.S. voters do you think feel that the U.S. economy is in good shape?” are values
from a
A) discrete numerical variable.
B) continuous numerical variable.
C) categorical variable.
D) table of random numbers.
If the Type I error ( ) for a given test is to be decreased, then for a fixed sample size n,
A) the Type II error ( ) will also decrease.
B) the Type II error ( ) will increase.
C) the power of the test will increase.
D) a one-tail test must be utilized.
TABLE 7-4
According to a survey, only 15% of customers who visited the website of a major retail
store made a purchase. Random sample sizes of 50 are selected.
Referring to Table 7-4, the mean of all the sample proportions of customers who will
make a purchase after visiting the website is ________.
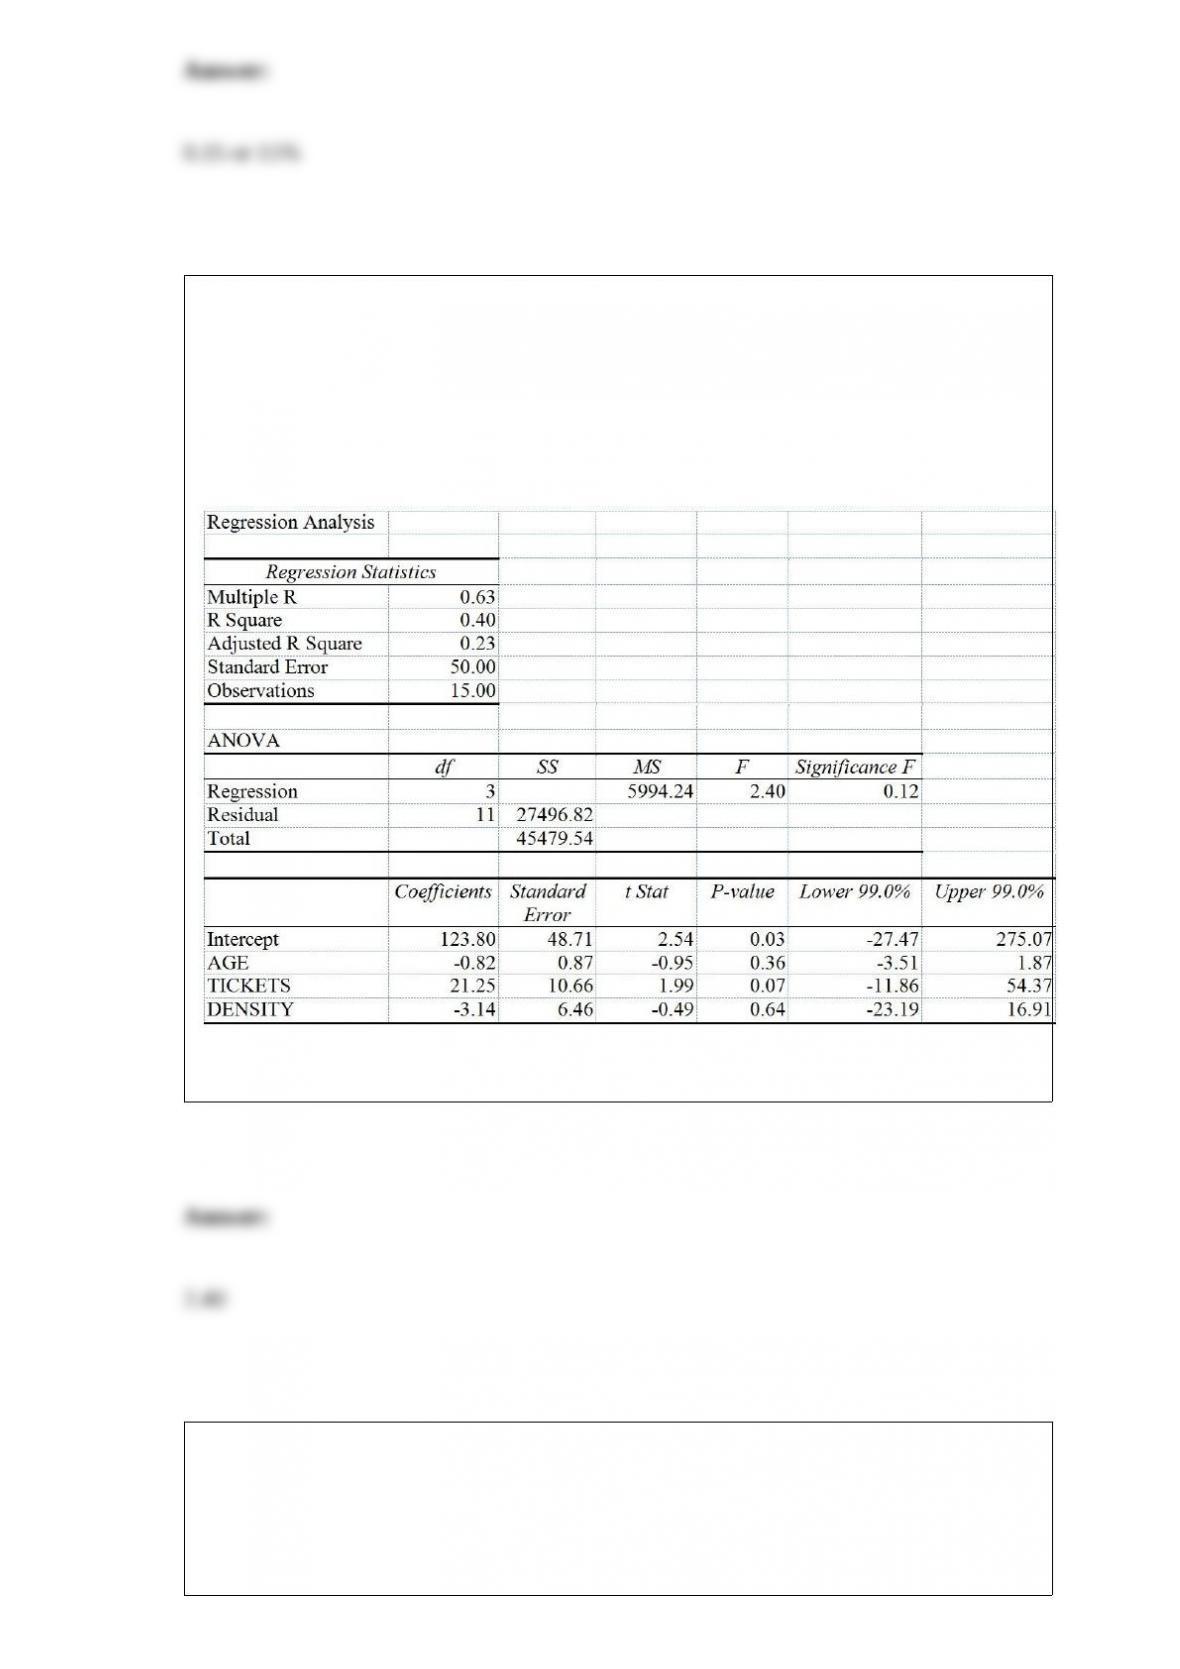
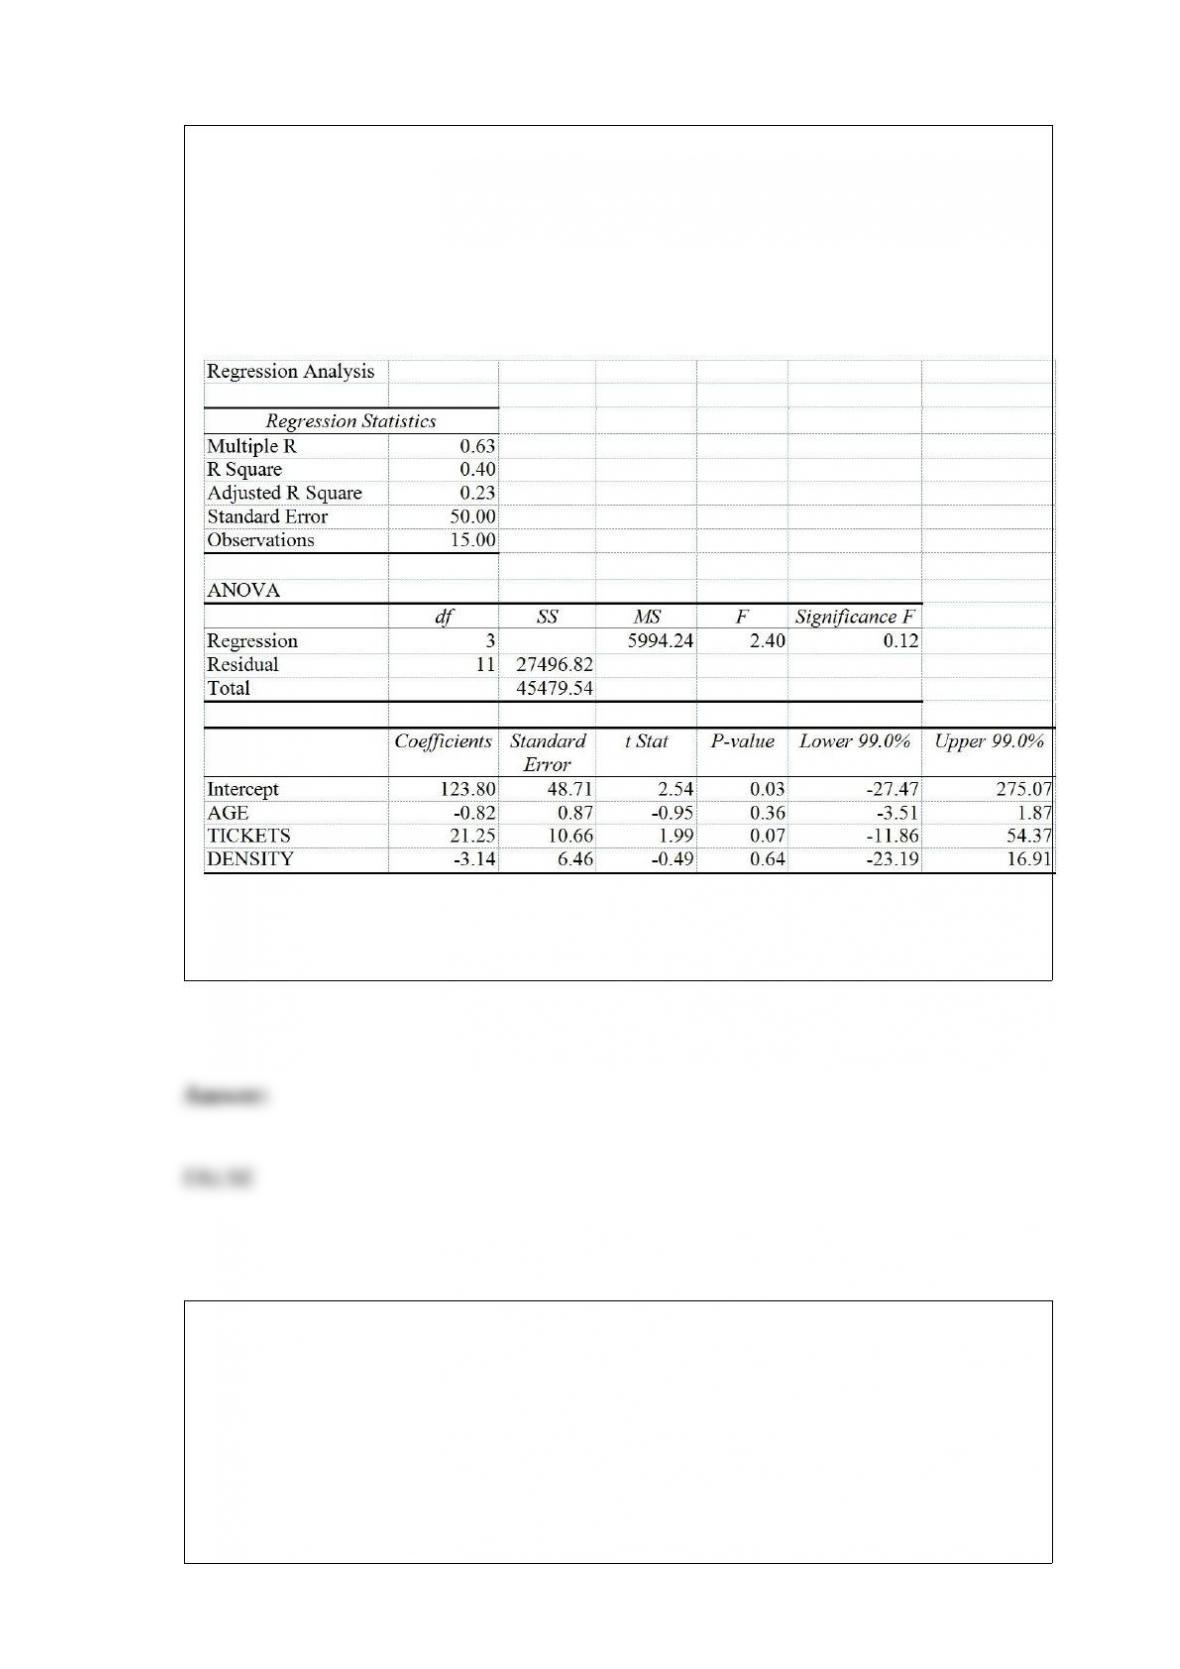
TABLE 17-5
You worked as an intern at We Always Win Car Insurance Company last summer. You
notice that individual car insurance premiums depend very much on the age of the
individual, the number of traffic tickets received by the individual, and the population
density of the city in which the individual lives. You performed a regression analysis in
EXCEL and obtained the following information:
Referring to Table 17-5, to test the significance of the multiple regression model, the
value of the test statistic is ________.
TABLE 17-11
A logistic regression model was estimated in order to predict the probability that a
randomly chosen university or college would be a private university using information
on mean total Scholastic Aptitude Test score (SAT) at the university or college, the
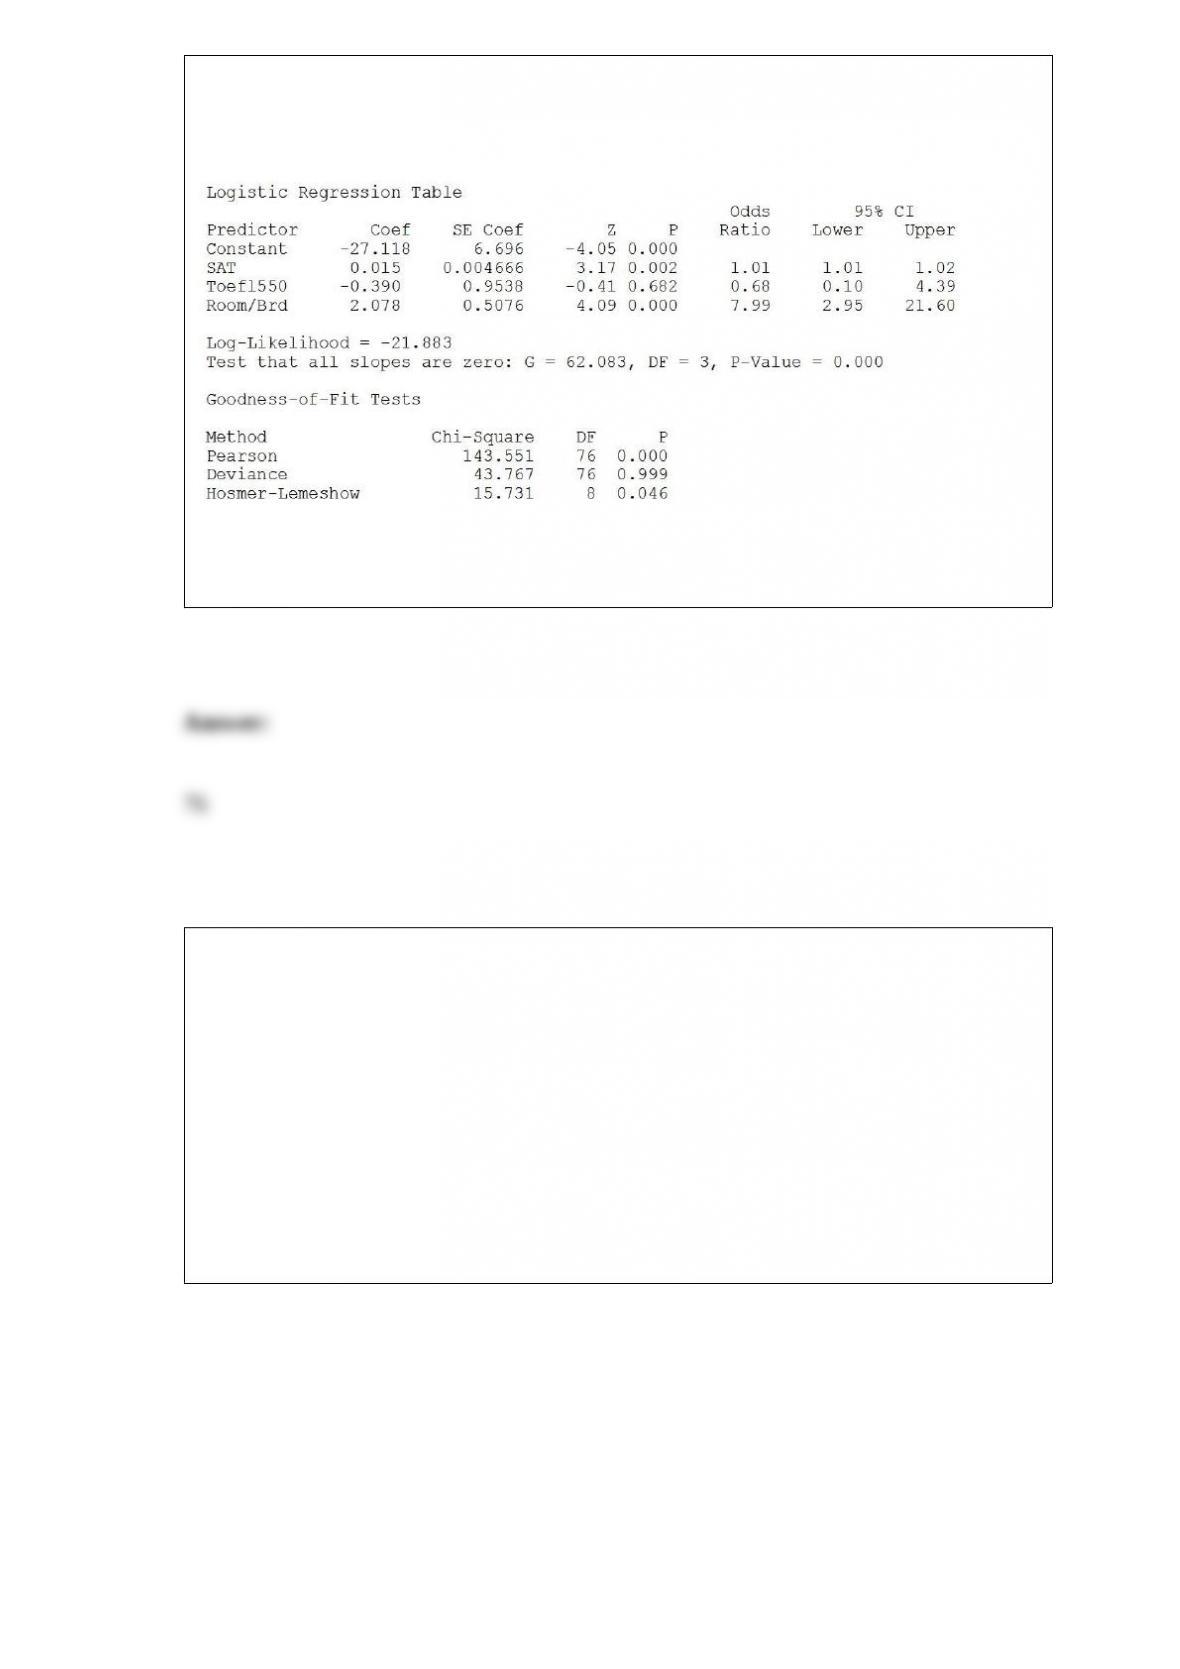
room and board expense measured in thousands of dollars (Room/Brd), and whether the
TOEFL criterion is at least 550 (Toefl550 = 1 if yes, 0 otherwise.) The dependent
variable, Y, is school type (Type = 1 if private and 0 otherwise).
Referring to Table 17-11, what are the degrees of freedom for the chi-square
distribution when testing whether the model is a good-fitting model?
Referring to Table 14-6, the value of the partial F test statistic is ________ for
H0 : Variable X2 does not significantly improve the model after variable X1 has been
included
H1 : Variable X2 significantly improves the model after variable X1 has been included
TABLE 14-6
One of the most common questions of prospective house buyers pertains to the cost of
heating in dollars (Y). To provide its customers with information on that matter, a large
real estate firm used the following 2 variables to predict heating costs: the daily
minimum outside temperature in degrees of Fahrenheit (X1) and the amount of
insulation in inches (X2). Given below is EXCEL output of the regression model.
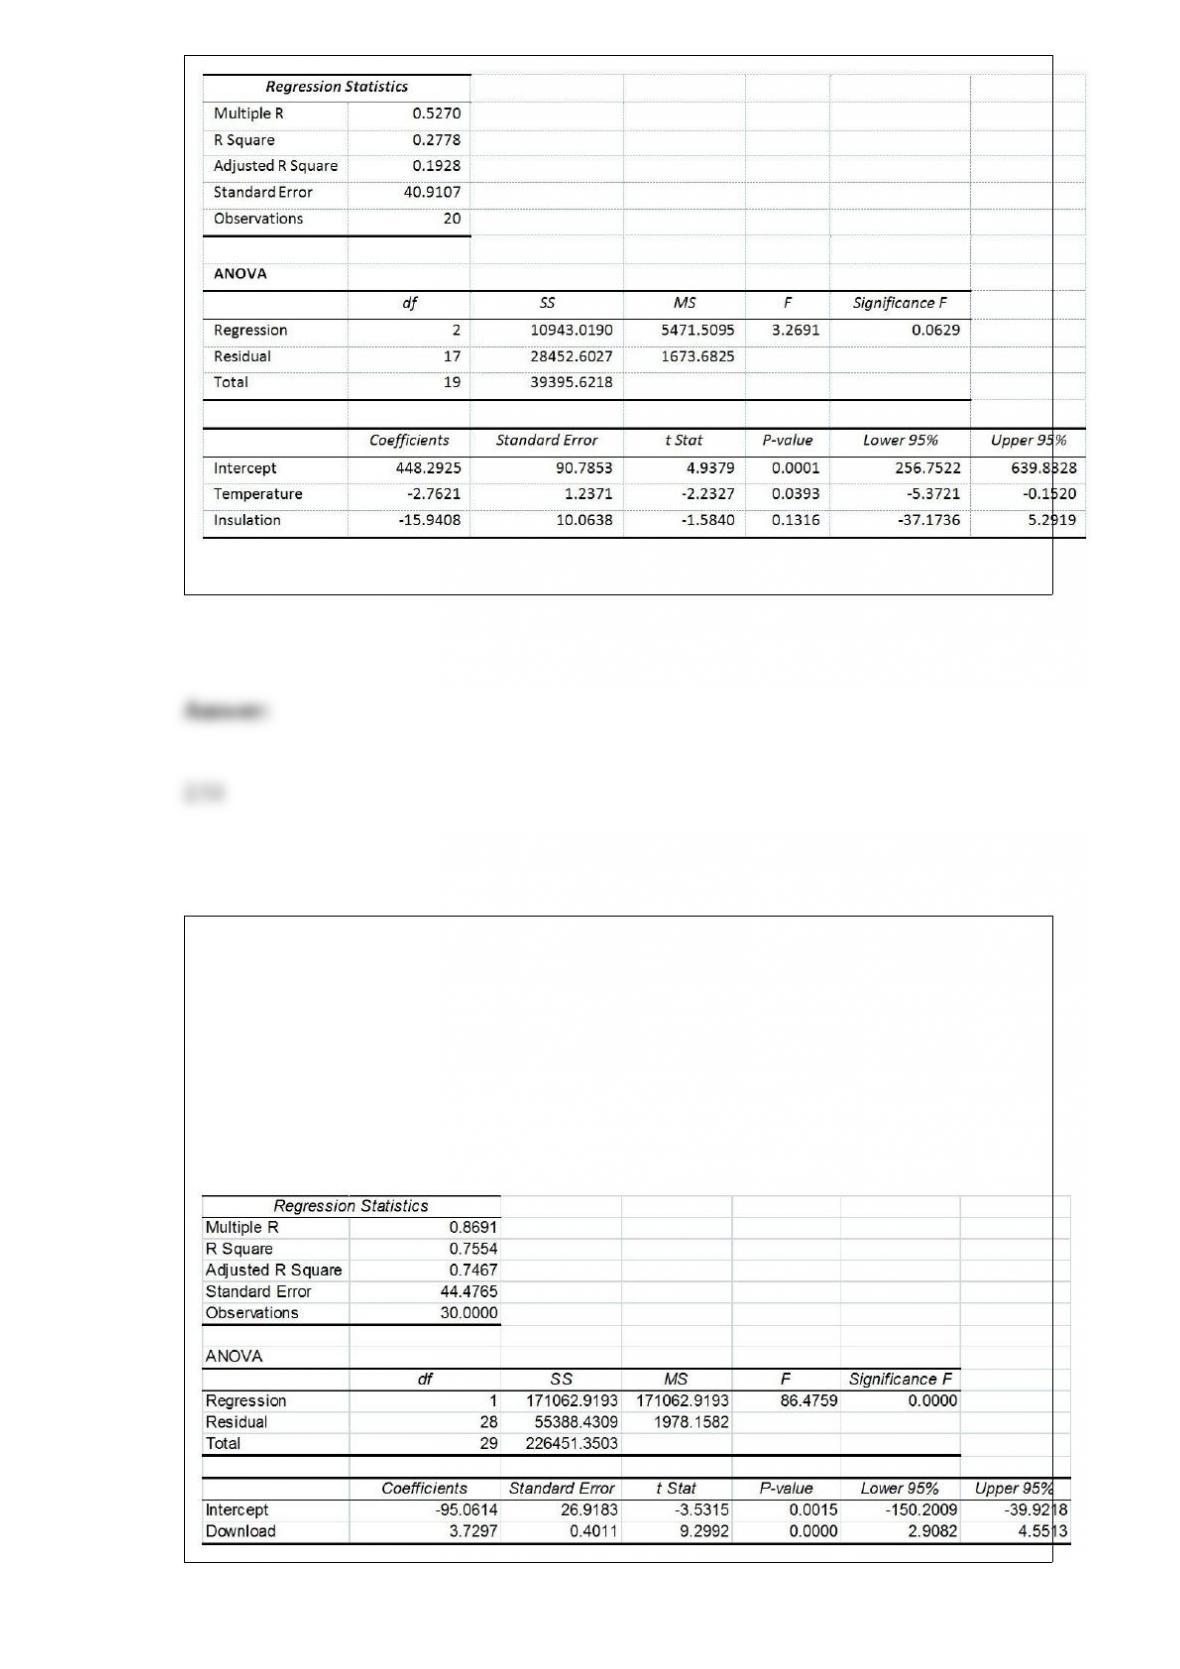
Also SSR (X1∣ X2) = 8343.3572 and SSR (X2∣ X1) = 4199.2672
TABLE 13-11
A computer software developer would like to use the number of downloads (in
thousands) for the trial version of his new shareware to predict the amount of revenue
(in thousands of dollars) he can make on the full version of the new shareware.
Following is the output from a simple linear regression along with the residual plot and
normal probability plot obtained from a data set of 30 different sharewares that he has
developed:
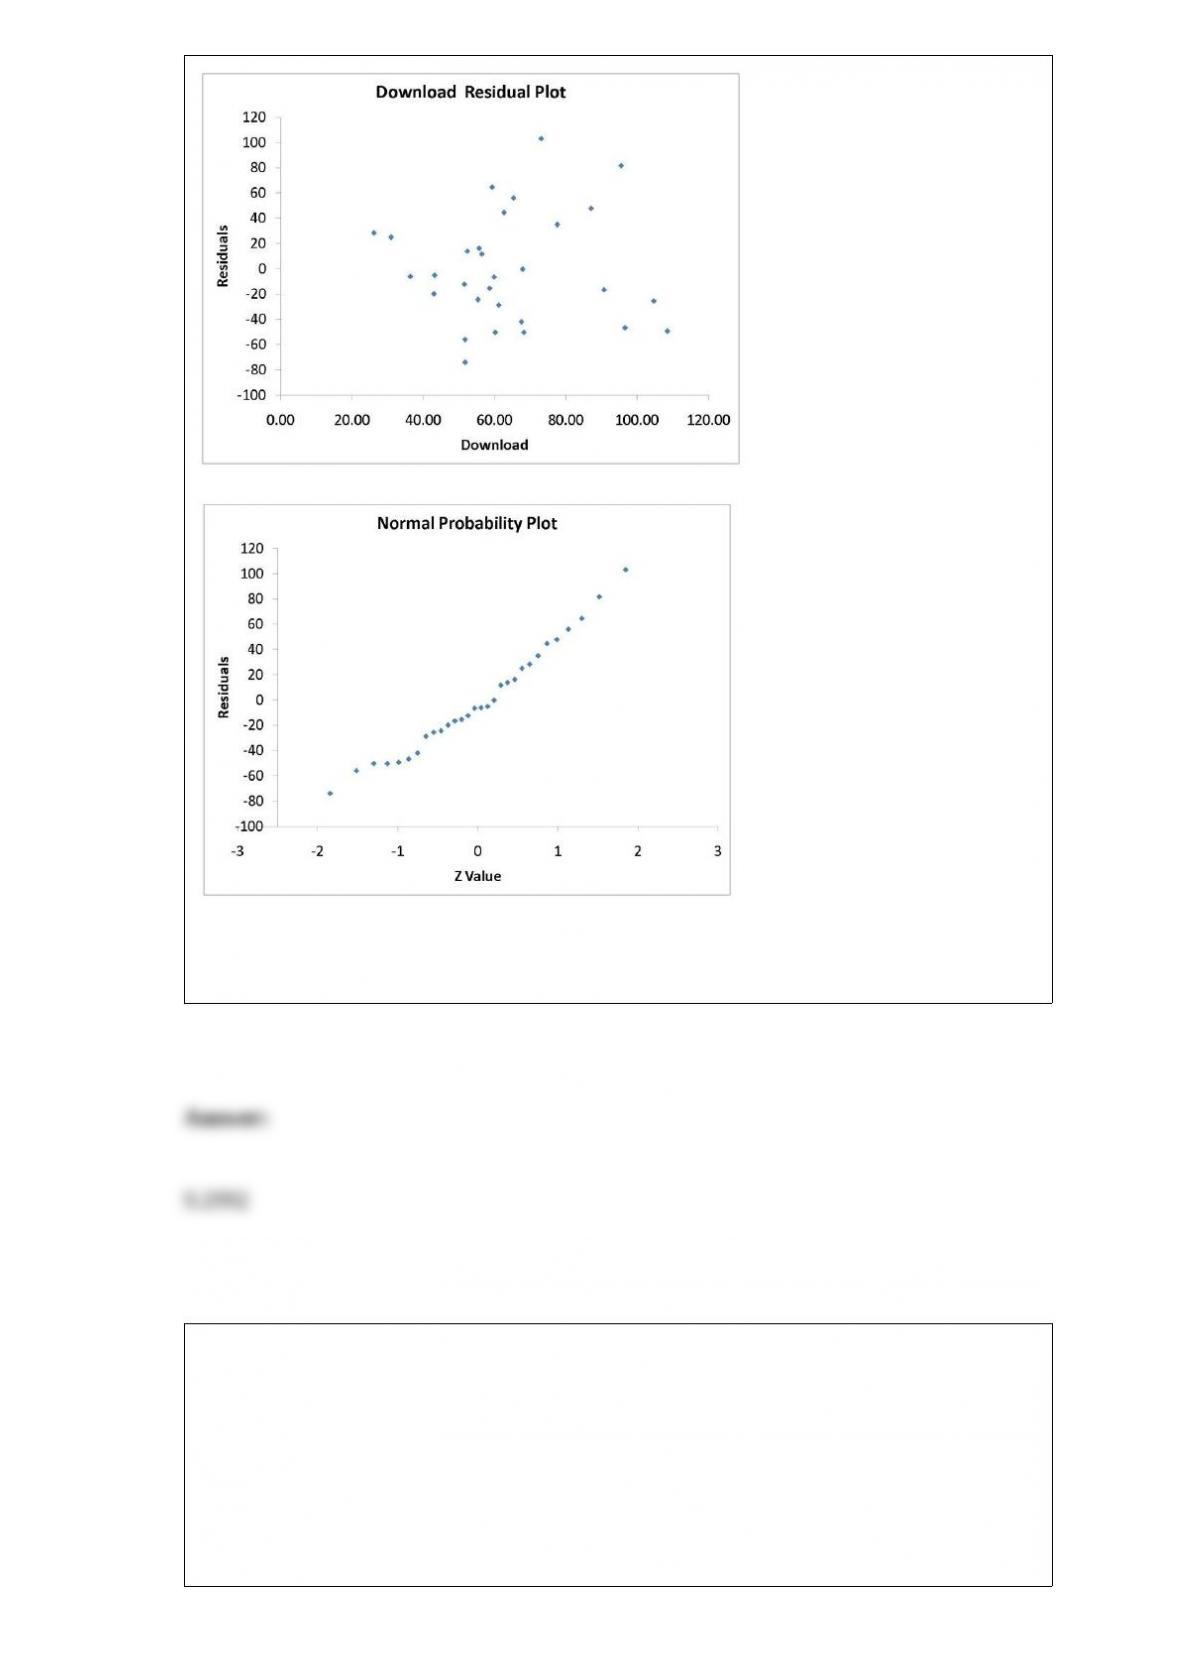
Referring to Table 13-11, what is the value of the test statistic for testing whether there
is a linear relationship between revenue and the number of downloads?
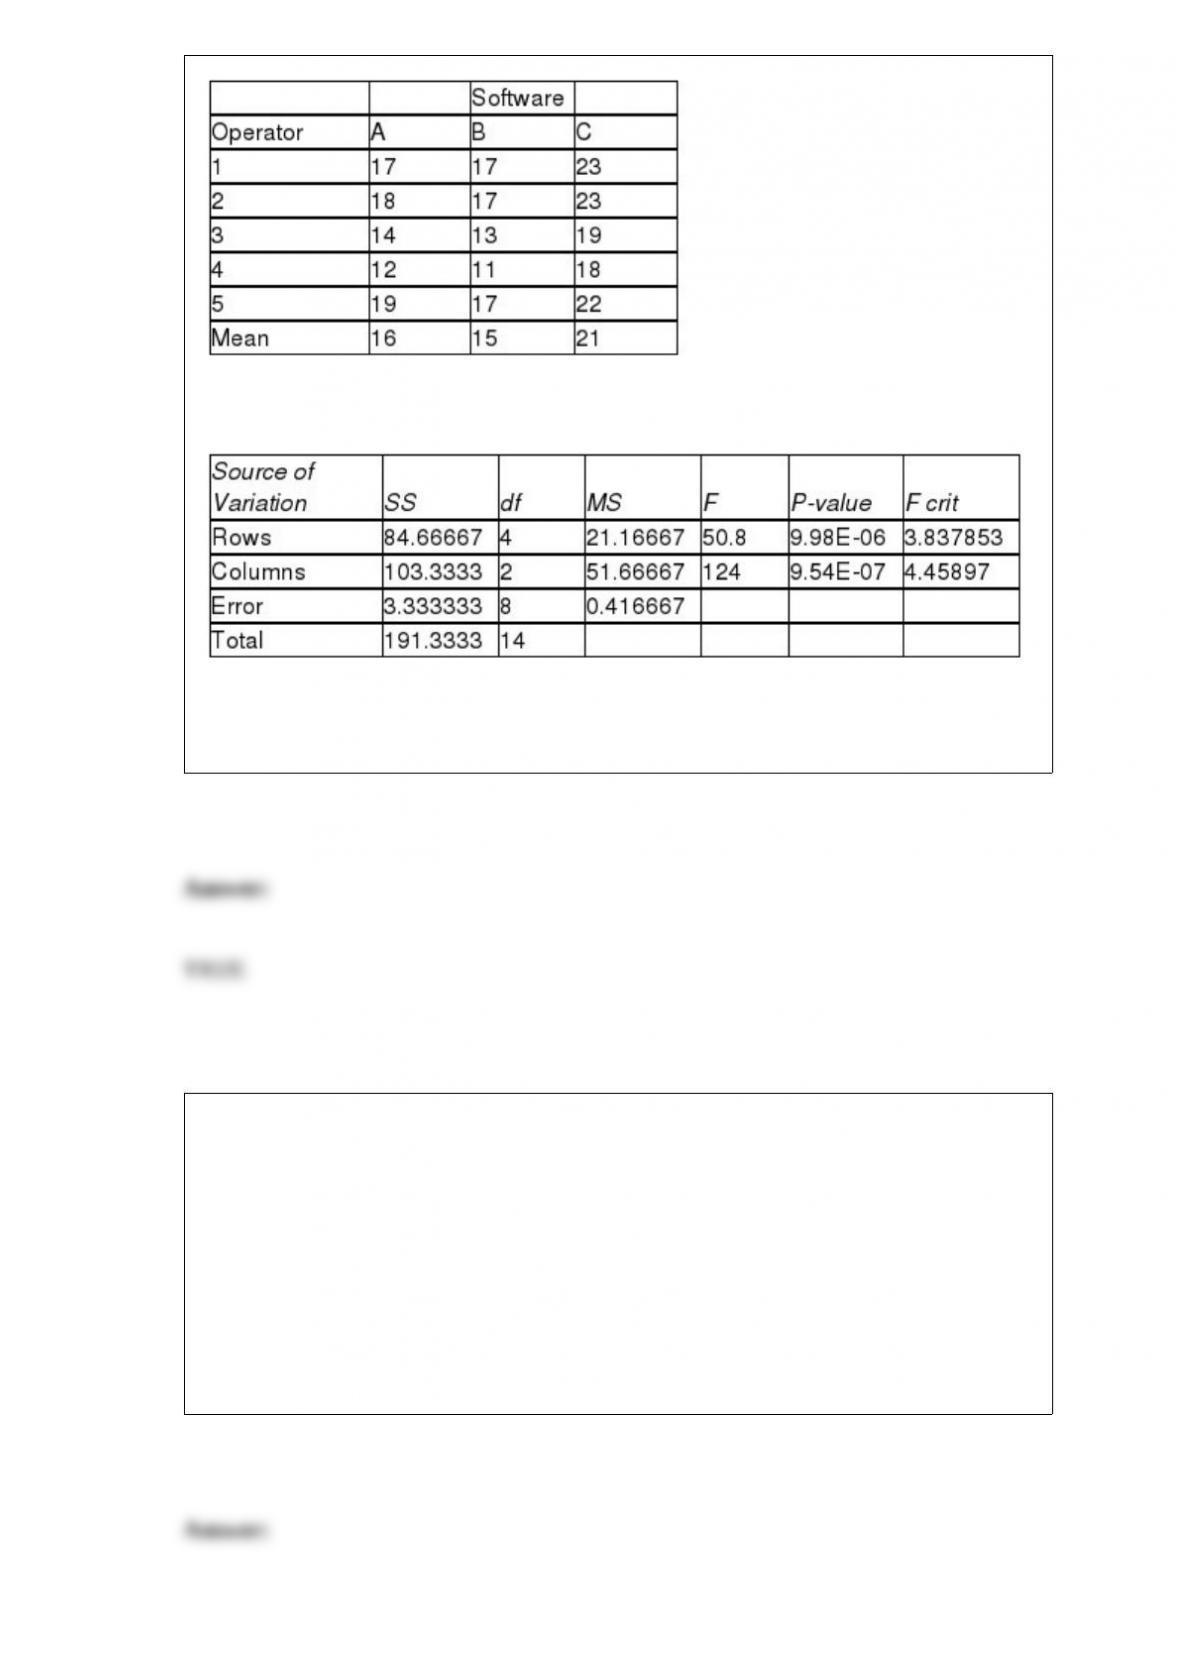
TABLE 11-8
An important factor in selecting database software is the time required for a user to
learn how to use the system. To evaluate three potential brands (A, B and C) of database
software, a company designed a test involving five different employees. To reduce
variability due to differences among employees, each of the five employees is trained
on each of the three different brands. The amount of time (in hours) needed to learn
each of the three different brands is given below:
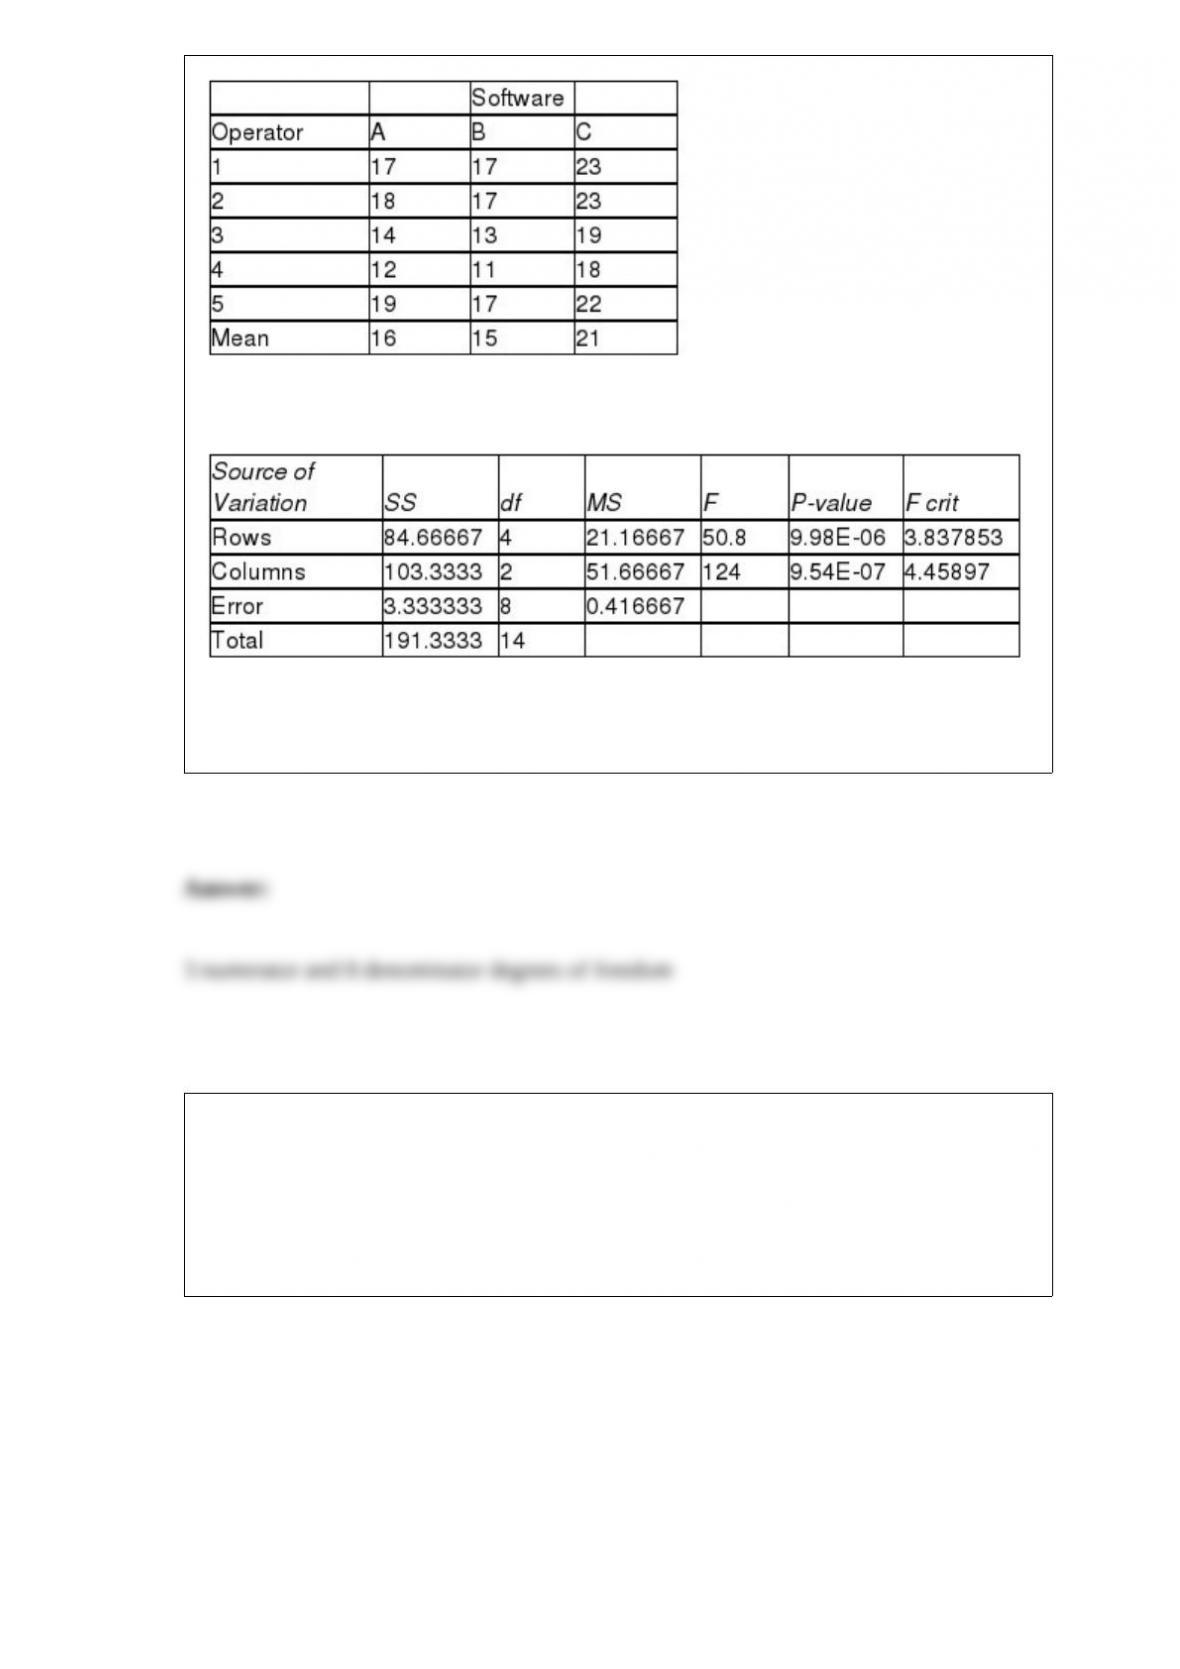
Below is the Excel output for the randomized block design:
Referring to Table 11-8, what are the degrees of freedom of the Studentized range
distribution for the Tukey multiple comparison procedure?
TABLE 18-9
The manufacturer of canned food constructed control charts and analyzed several
quality characteristics. One characteristic of interest is the weight of the filled cans. The
lower specification limit for weight is 2.95 pounds. The table below provides the range
and mean of the weights of five cans tested every fifteen minutes during a day’s
production.
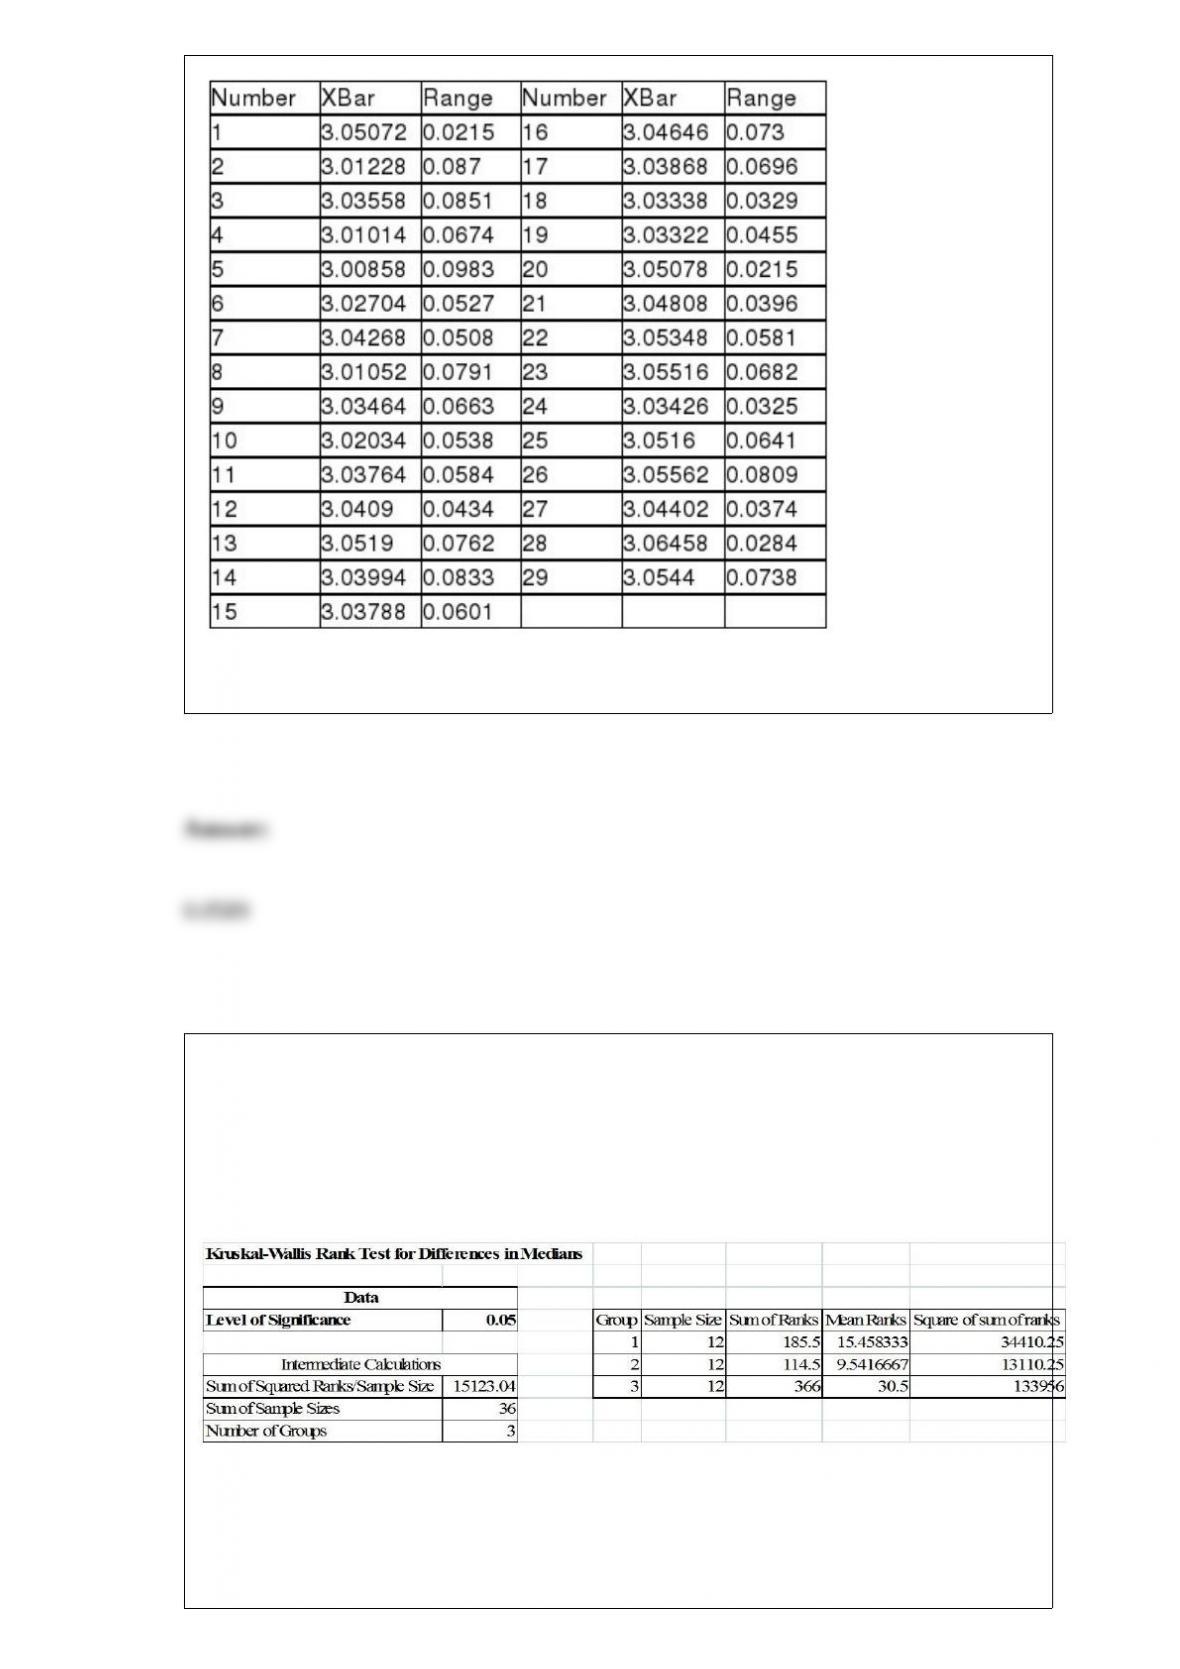
Referring to Table 18-9, an R chart is to be constructed for the weight. The center line
of this R chart is located at ________.
TABLE 12-17
Three new different models of compact SUVs have just arrived at the market. You are
interested in comparing the gas mileage performance of all three models to see if they
are the same. A partial computer output for twelve compact SUVs of each model is
given below:
You are told that the gas mileage population distributions for all three models are not
normally distributed.
Referring to Table 12-17, what is the value of the Kruskal-Wallis test statistic?