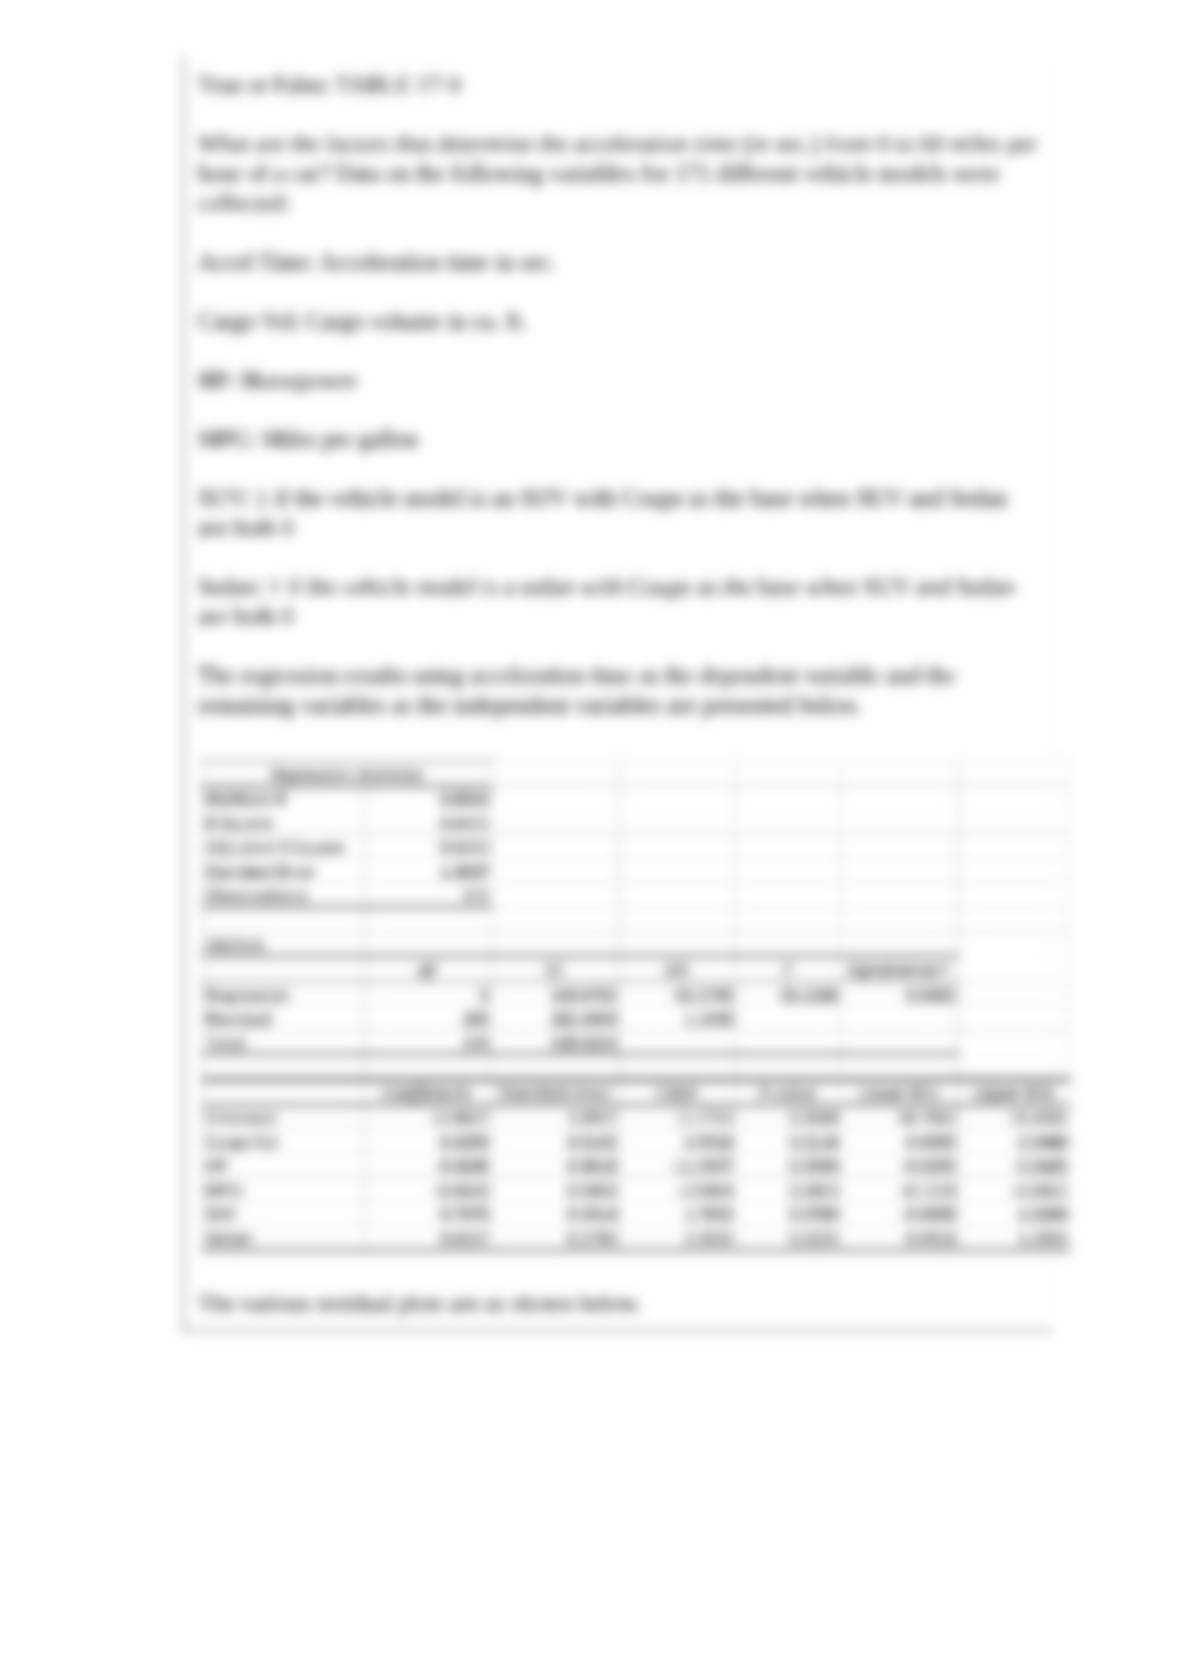
True or False: TABLE 17-9
What are the factors that determine the acceleration time (in sec.) from 0 to 60 miles per
hour of a car? Data on the following variables for 171 different vehicle models were
collected:
Accel Time: Acceleration time in sec.
Cargo Vol: Cargo volume in cu. ft.
HP: Horsepower
MPG: Miles per gallon
SUV: 1 if the vehicle model is an SUV with Coupe as the base when SUV and Sedan
are both 0
Sedan: 1 if the vehicle model is a sedan with Coupe as the base when SUV and Sedan
are both 0
The regression results using acceleration time as the dependent variable and the
remaining variables as the independent variables are presented below.
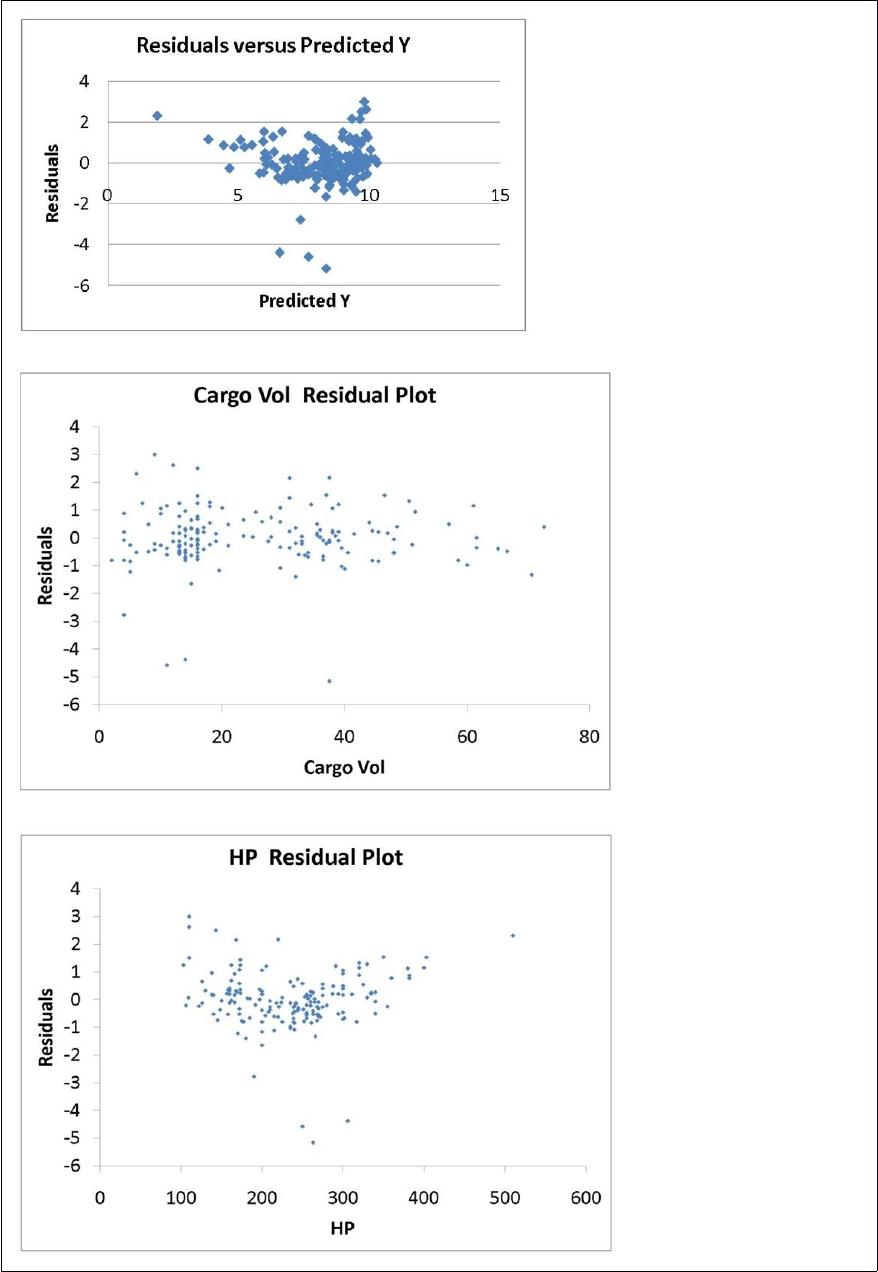
The various residual plots are as shown below.
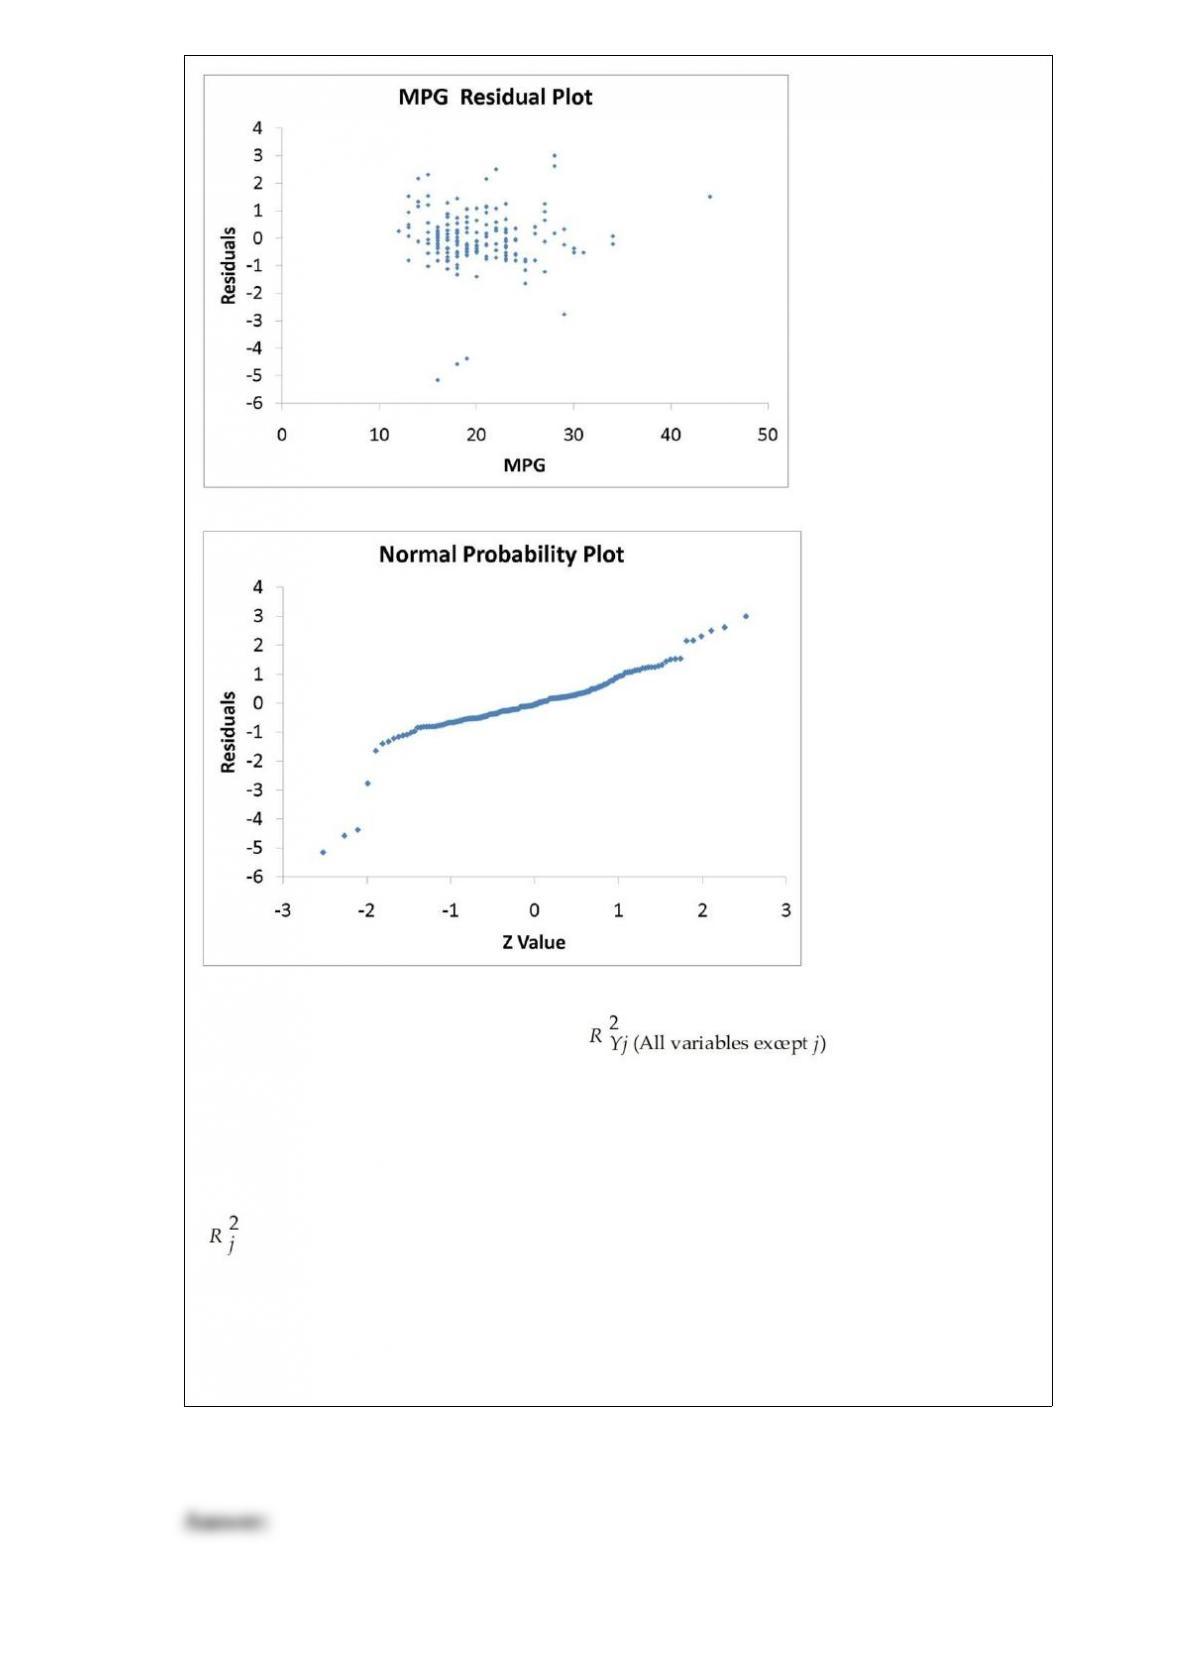
The coefficient of partial determination ( ) of each of the 5
predictors are, respectively, 0.0380, 0.4376, 0.0248, 0.0188, and 0.0312.
The coefficient of multiple determination for the regression model using each of the 5
variables Xj as the dependent variable and all other X variables as independent variables
( ) are, respectively, 0.7461, 0.5676, 0.6764, 0.8582, 0.6632.
Referring to Table 17-9, there is enough evidence to conclude that MPG makes a
significant contribution to the regression model in the presence of the other independent
variables at a 5% level of significance.
True or False: As a general rule, one can use the normal distribution to approximate a
binomial distribution whenever the sample size is at least 30.
True or False: In graphing two categorical data, the side-by-side bar chart is best suited
when comparing joint responses.
True or False: Marital status is an example of a numerical variable.
True or False: TABLE 17-10
Given below are results from the regression analysis where the dependent variable is
the number of weeks a worker is unemployed due to a layoff (Unemploy) and the
independent variables are the age of the worker (Age), the number of years of education
received (Edu), the number of years at the previous job (Job Yr), a dummy variable for
marital status (Married: 1 = married, 0 = otherwise), a dummy variable for head of
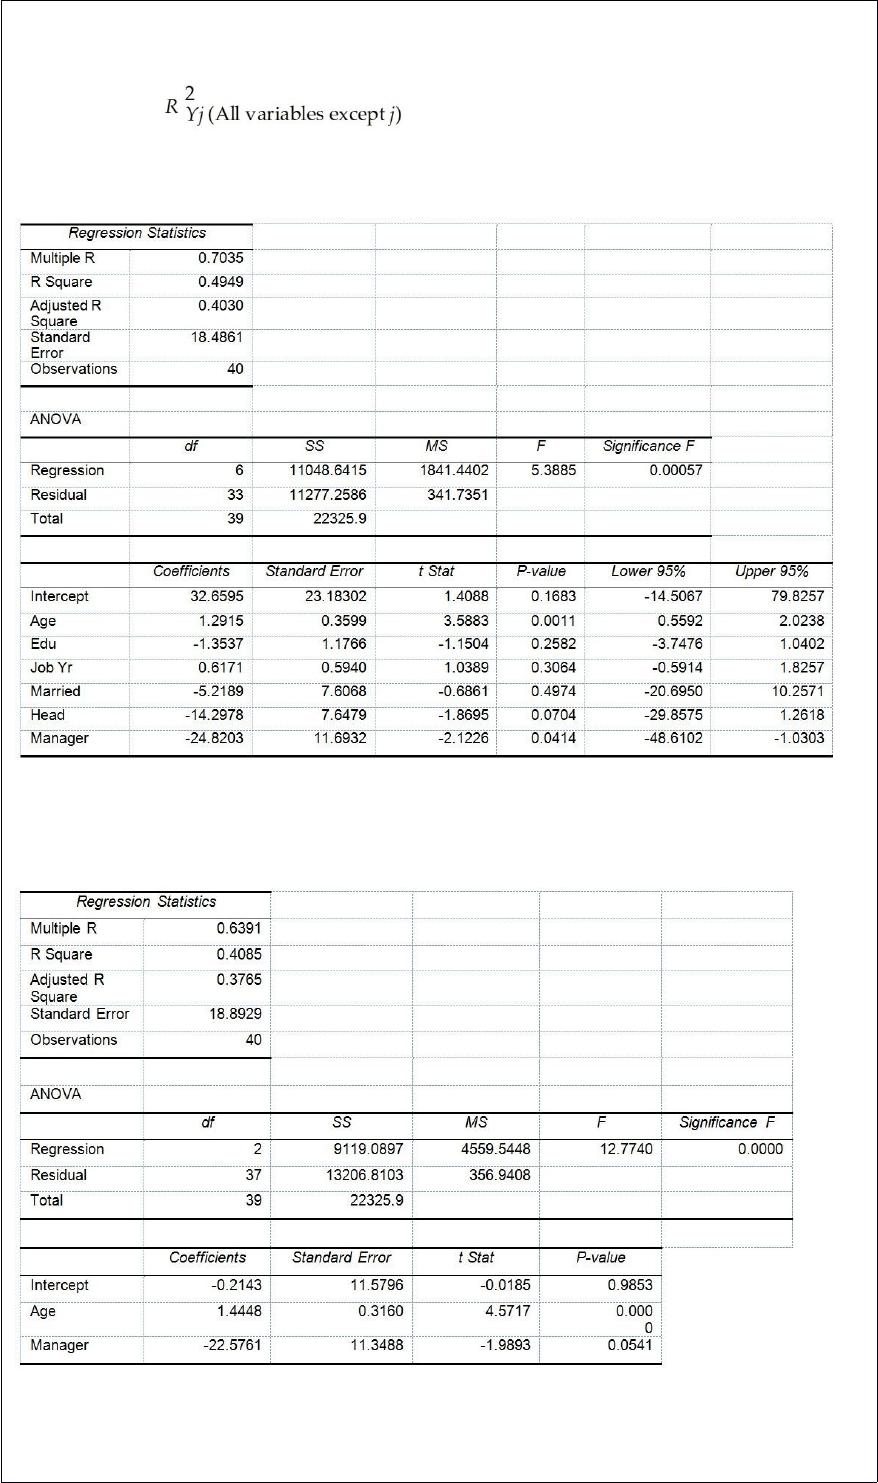
household (Head: 1 = yes, 0 = no) and a dummy variable for management position
(Manager: 1 = yes, 0 = no). We shall call this Model 1. The coefficient of partial
determination ( ) of each of the 6 predictors are, respectively,
0.2807, 0.0386, 0.0317, 0.0141, 0.0958, and 0.1201.
Model 2 is the regression analysis where the dependent variable is Unemploy and the
independent variables are Age and Manager. The results of the regression analysis are
given below:
Referring to Table 17-10, Model 1, the alternative hypothesis H1 : At least one of βj â
‰ 0 for j = 1, 2, 3, 4, 5, 6 implies that the number of weeks a worker is unemployed
due to a layoff is affected by at least one of the explanatory variables.
True or False: Apple Computer, Inc. collected information on the age of their
customers. Suppose the youngest customer was 12 and the oldest was 72. To study the
percentage of their customers who are below a certain age, it can use an ogive.
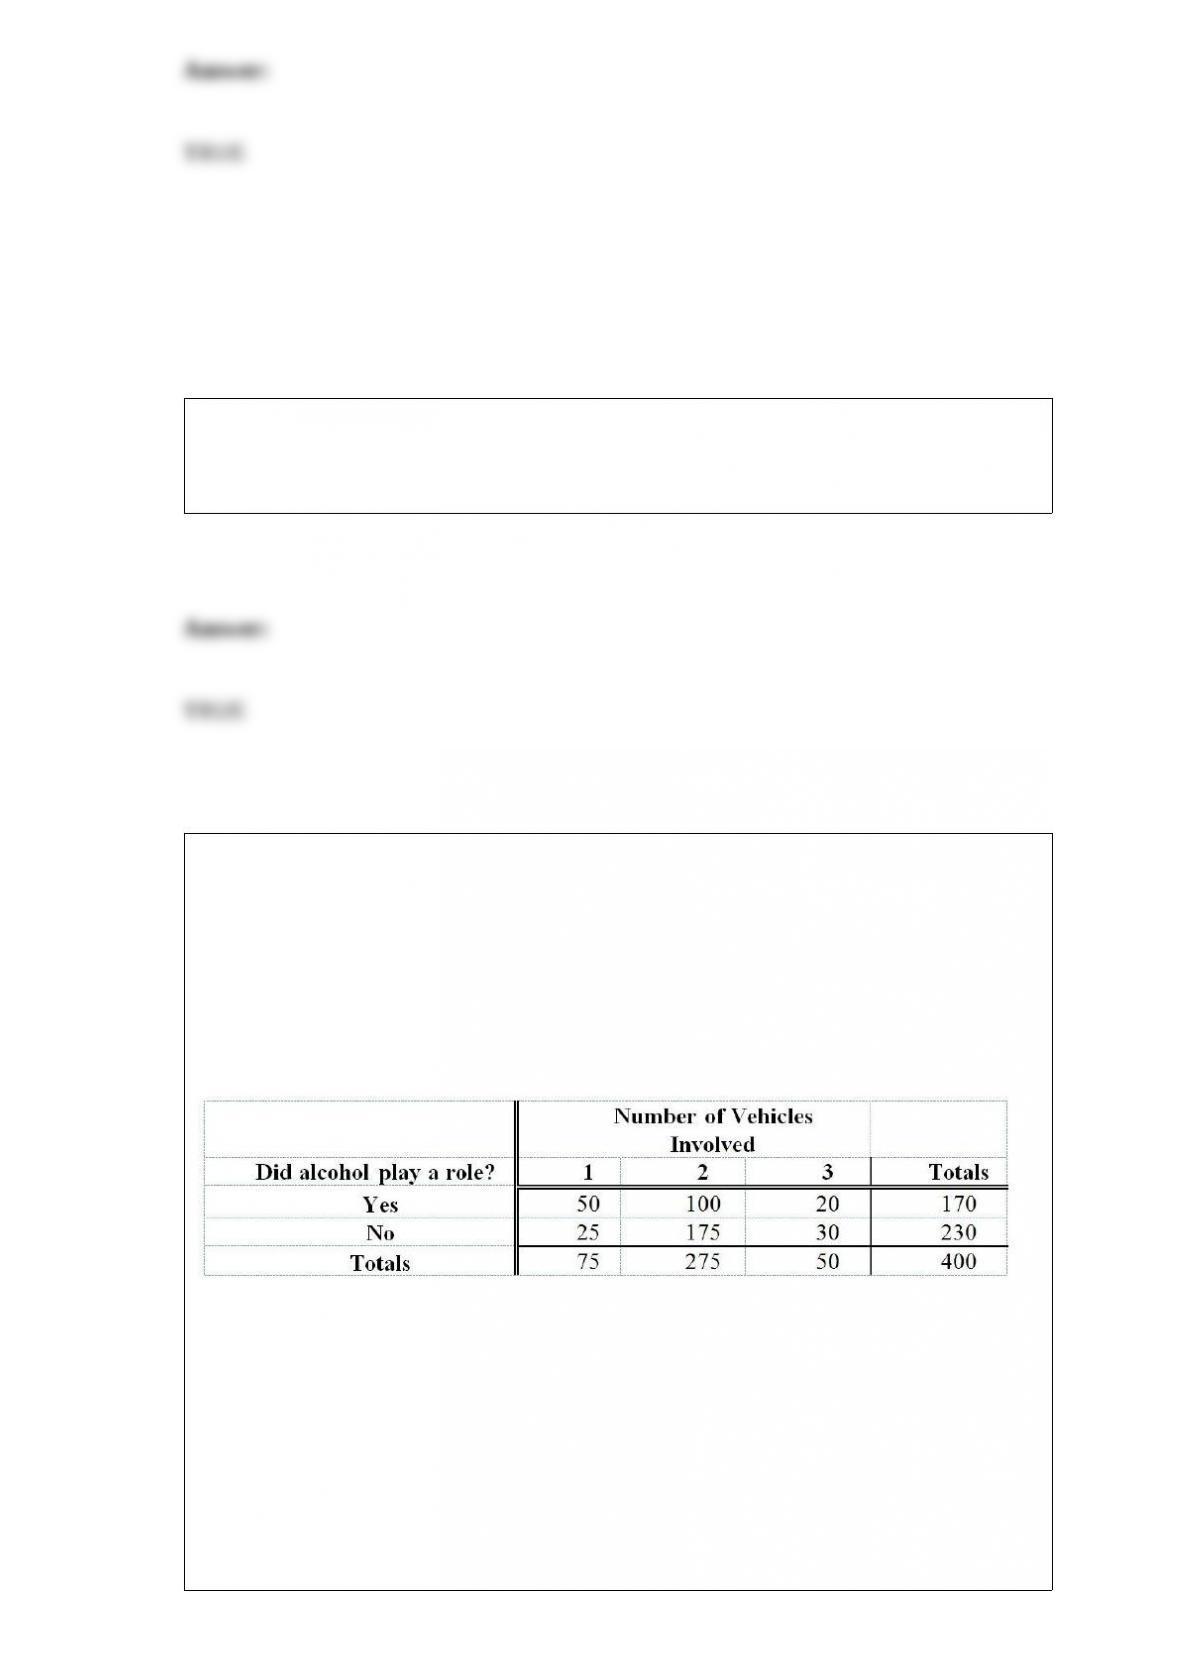
TABLE 4-1
Mothers Against Drunk Driving is a very visible group whose main focus is to educate
the public about the harm caused by drunk drivers. A study was recently done that
emphasized the problem we all face with drinking and driving. Four hundred accidents
that occurred on a Saturday night were analyzed. Two items noted were the number of
vehicles involved and whether alcohol played a role in the accident. The numbers are
shown below:
Referring to Table 4-1, given that alcohol was not involved, what proportion of the
accidents were single vehicle?
A) 50/75 or 66.67%
B) 25/230 or 10.87%
C) 50/170 or 29.41%
D) 25/75 or 33.33%
TABLE 1-3
The manager of the customer service division of a major consumer electronics company
is interested in determining whether the customers who have purchased a Blu-ray
player made by the company over the past 12 months are satisfied with their products.
Referring to Table 1-3, if there are 4 different brands of Blu-ray players made by the
company, the best sampling strategy would be to use
A) a simple random sample.
B) a stratified sample.
C) a cluster sample.
D) a systematic sample.
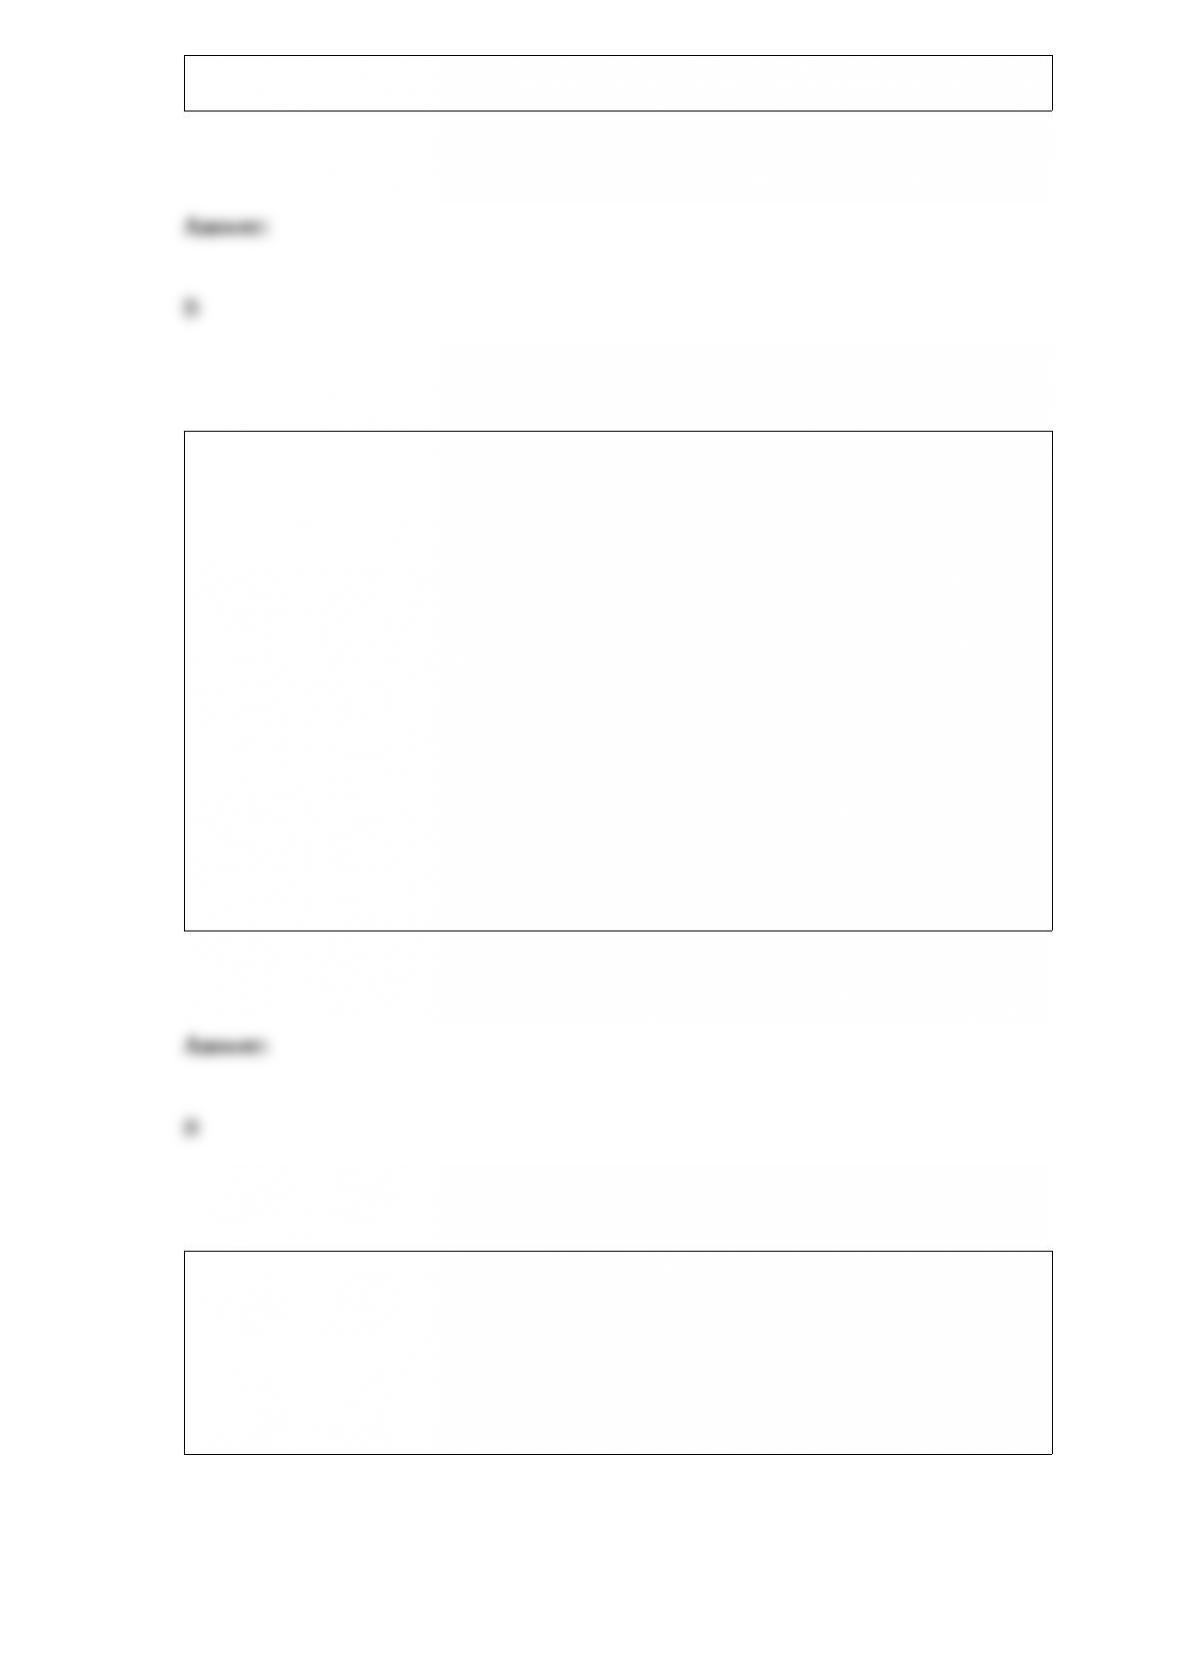
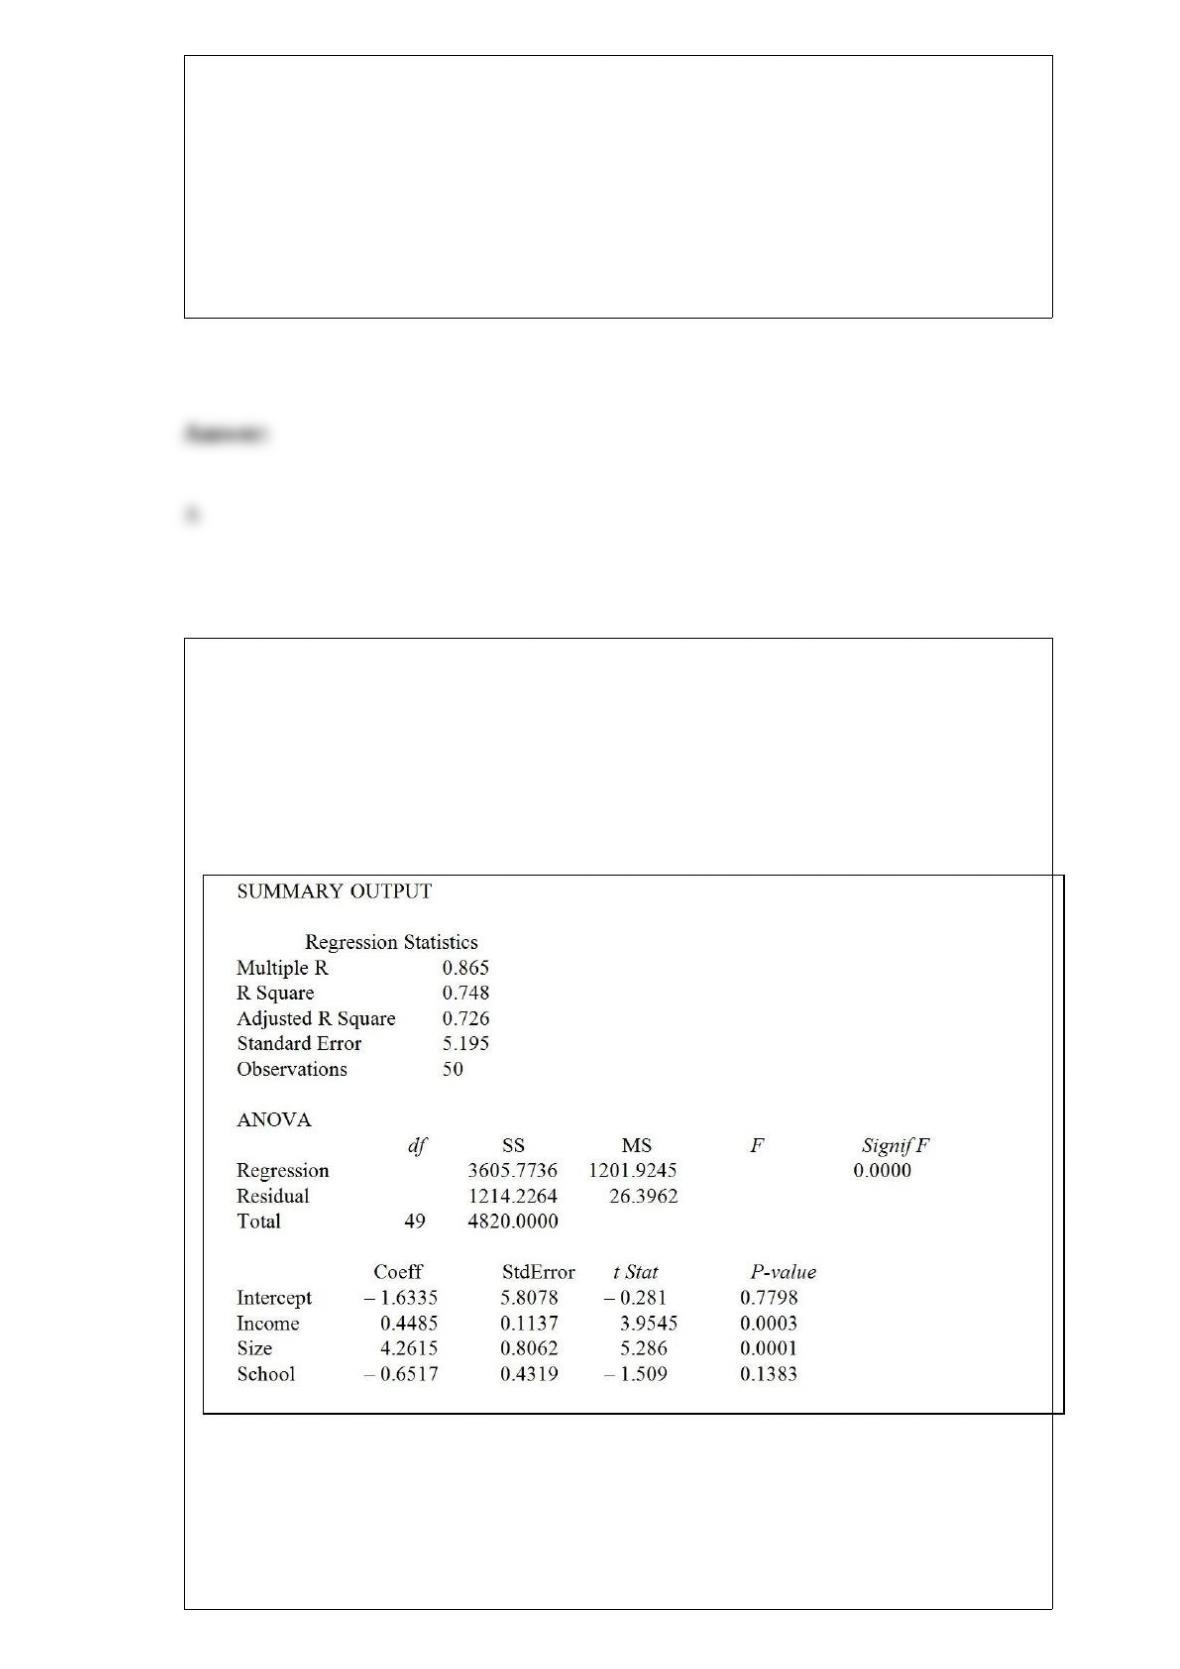
TABLE 17-1
A real estate builder wishes to determine how house size (House) is influenced by
family income (Income), family size (Size), and education of the head of household
(School). House size is measured in hundreds of square feet, income is measured in
thousands of dollars, and education is in years. The builder randomly selected 50
families and ran the multiple regression. Microsoft Excel output is provided below:
Referring to Table 17-1, one individual in the sample had an annual income of $40,000,
a family size of 1, and an education of 8 years. This individual owned a home with an
area of 1,000 square feet (House = 10.00). What is the residual (in hundreds of square
feet) for this data point?
A) -6.99
B) -5.35
C) 5.40
D) 16.99
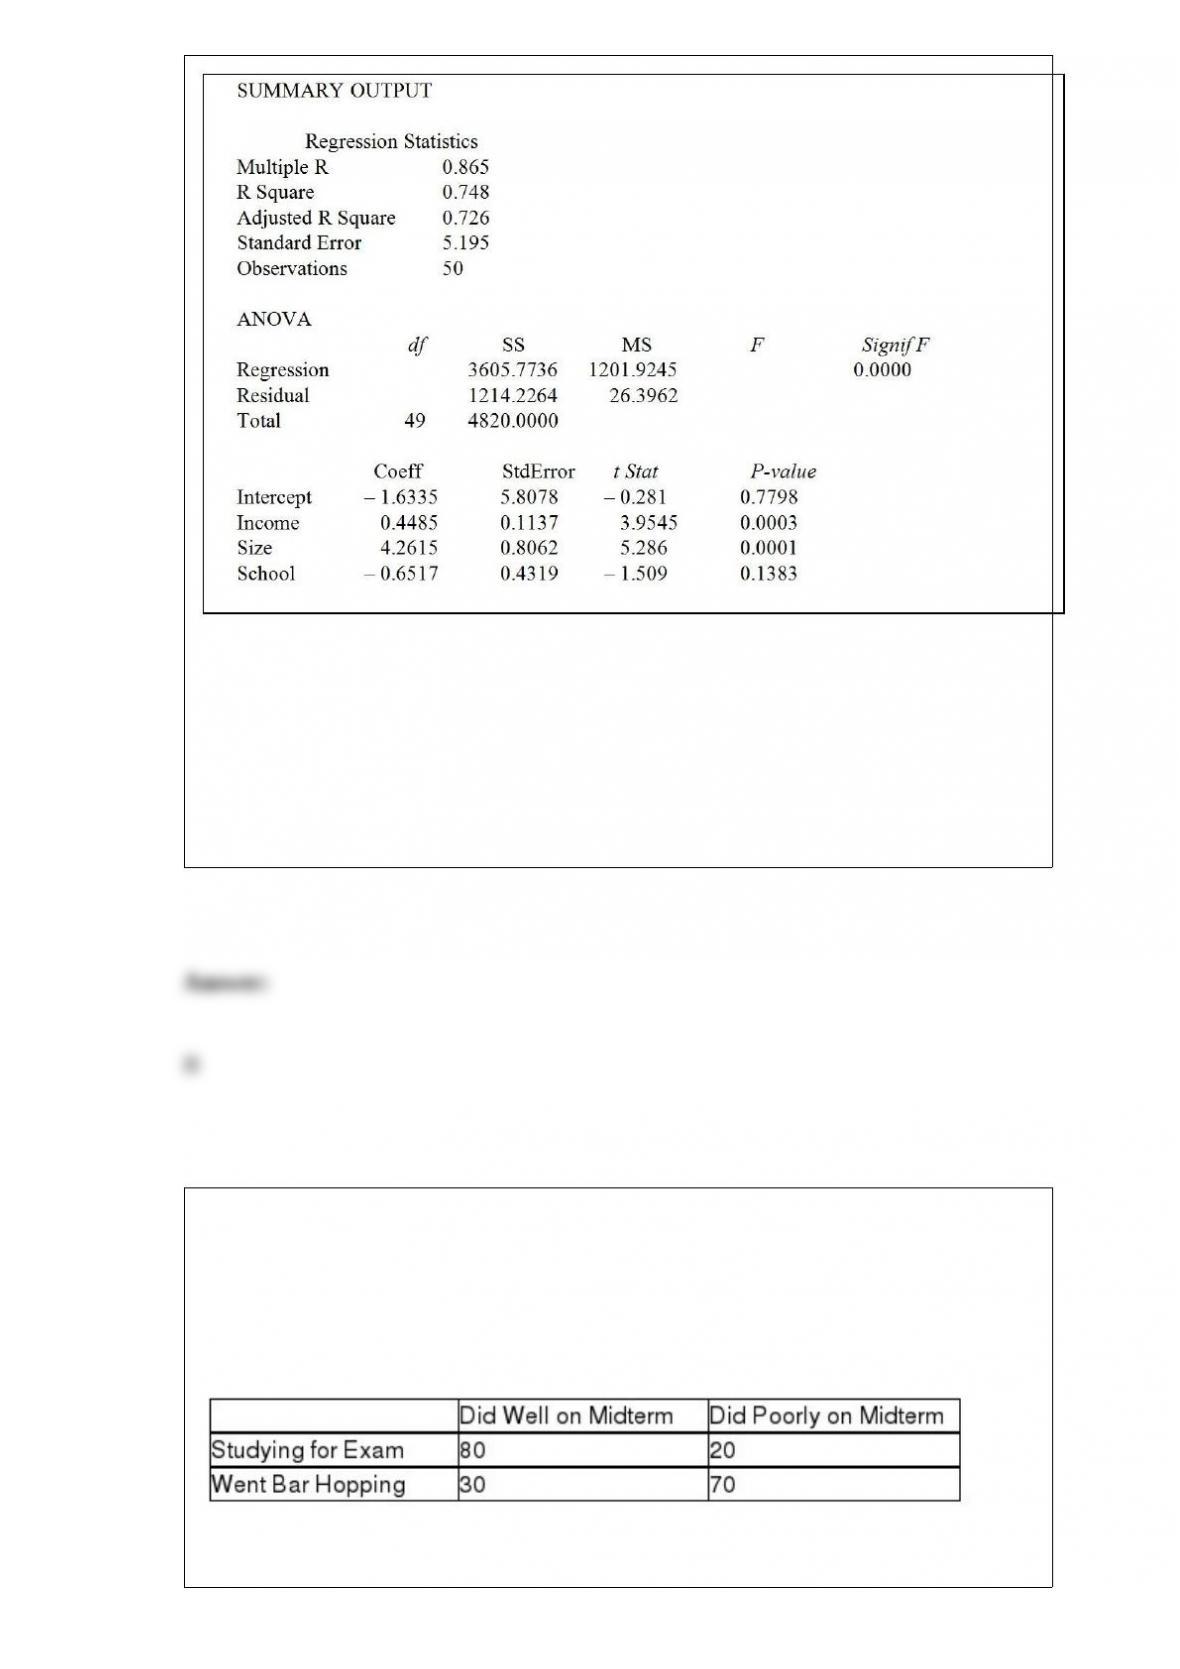
TABLE 4-2
An alcohol awareness task force at a Big-Ten university sampled 200 students after the
midterm to ask them whether they went bar hopping the weekend before the midterm or
spent the weekend studying, and whether they did well or poorly on the midterm. The
following result was obtained.
Referring to Table 4-2, the events “Did Well on Midterm” and “Studying for Exam” are
A) dependent.
B) mutually exclusive.
C) collectively exhaustive.
D) None of the above.
TABLE 17-1
A real estate builder wishes to determine how house size (House) is influenced by
family income (Income), family size (Size), and education of the head of household
(School). House size is measured in hundreds of square feet, income is measured in
thousands of dollars, and education is in years. The builder randomly selected 50
families and ran the multiple regression. Microsoft Excel output is provided below:
Referring to Table 17-1, what is the predicted house size (in hundreds of square feet) for
an individual earning an annual income of $40,000, having a family size of 4, and going
to school a total of 13 years?
A) 11.43
B) 15.15
C) 24.88
D) 53.87
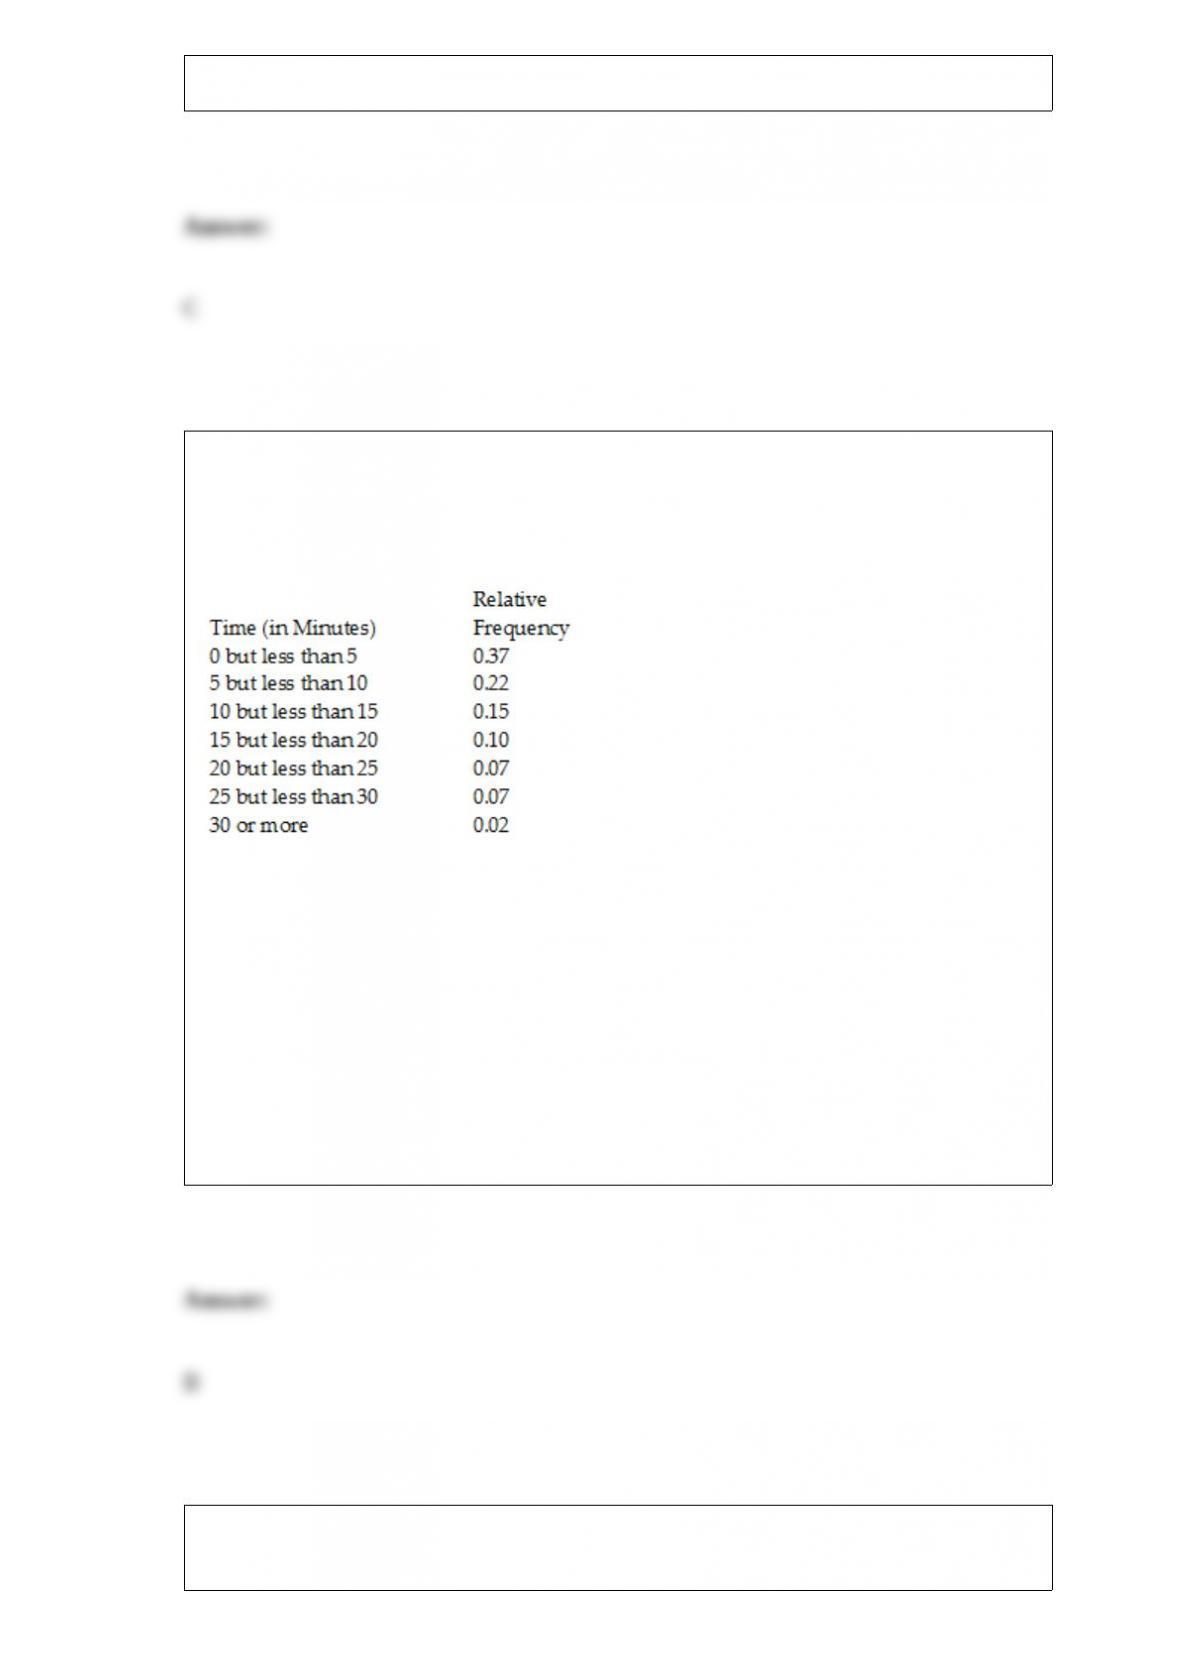
TABLE 2-5
The following are the duration in minutes of a sample of long-distance phone calls
made within the continental United States reported by one long-distance carrier.
Referring to Table 2-5, if 100 calls were sampled, ________ of them would have lasted
20 minutes or more.
A) 26
B) 16
C) 74
D) None of the above.
A campus program evenly enrolls undergraduate and graduate students. If a random
sample of 4 students is selected from the program to be interviewed about the

introduction of a new fast food outlet on the ground floor of the campus building, what
is the probability that all 4 students selected are undergraduate students?
A) 0.0256
B) 0.0625
C) 0.16
D) 1.00
Referring to Table 14-17, which of the following is the correct
alternative hypothesis to determine whether there is a significant
relationship between percentage of students passing the proficiency
test and the entire set of explanatory variables?
TABLE 14-17
Given below are results from the regression analysis where the
dependent variable is the number of weeks a worker is unemployed
due to a layo’ (Unemploy) and the independent variables are the age
of the worker (Age) and a dummy variable for management position
(Manager: 1 = yes, 0 = no).
The results of the regression analysis are given below:

A) H1 : All βj≠0 for j = 0, 1, 2
B) H1 : All βj ≠0 for j = 1, 2
C) H1 : At least one of βj ≠0 for j = 0, 1, 2
D) H1 : At least one of βj ≠0 for j = 1, 2
TABLE 16-3
The following table contains the number of complaints received in a department store
for the first 6 months of last year.
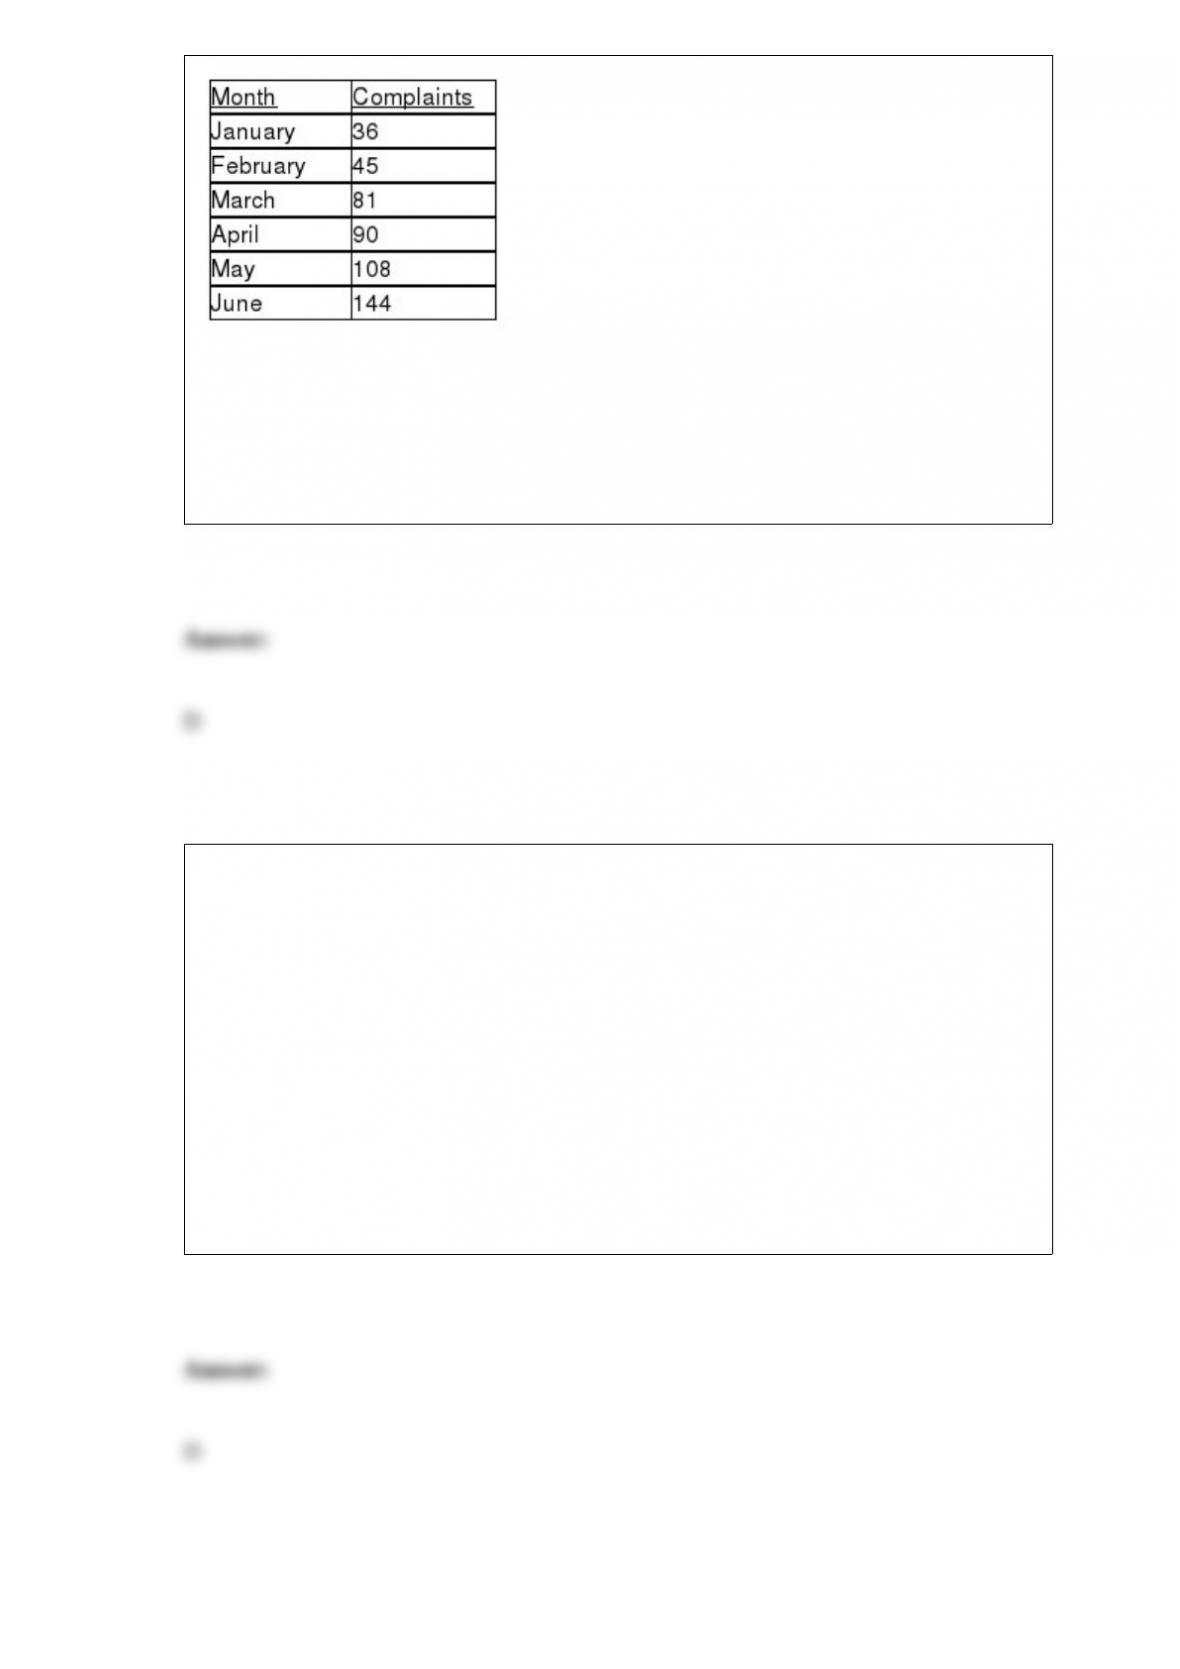
Referring to Table 16-3, suppose the last two smoothed values are 81 and 96 (Note:
they are not). What would you forecast as the value of the time series for September?
A) 81
B) 86
C) 91
D) 96
The employees of a company were surveyed on questions regarding their educational
background (college degree or no college degree) and marital status (single or married).
Of the 600 employees, 400 had college degrees, 100 were single, and 60 were single
college graduates. The probability that an employee of the company is single or has a
college degree is
A) 0.10.
B) 0.25.
C) 0.667.
D) 0.733.

Data on 1,500 students’ height were collected at a larger university in the East Coast.
Which of the following is the best chart for presenting the information?
A) a pie chart
B) a Pareto chart
C) a side-by-side bar chart
D) a histogram
Blossom’s Flowers purchases roses for sale for Valentine’s Day. The roses are purchased
for $10 a dozen and are sold for $20 a dozen. Any roses not sold on Valentine’s Day can
be sold for $5 per dozen. The owner will purchase 1 of 3 amounts of roses for
Valentine’s Day: 100, 200, or 400 dozen roses. Given 0.2, 0.4, and 0.6 are the
probabilities for the sale of 100, 200, or 400 dozen roses, respectively, then the optimal
alternative using EMV for selling roses is to buy ________ dozen roses.
A) 100
B) 200
C) 400
D) 600
TABLE 13-10
The management of a chain electronic store would like to develop a model for
predicting the weekly sales (in thousands of dollars) for individual stores based on the
number of customers who made purchases. A random sample of 12 stores yields the
following results:
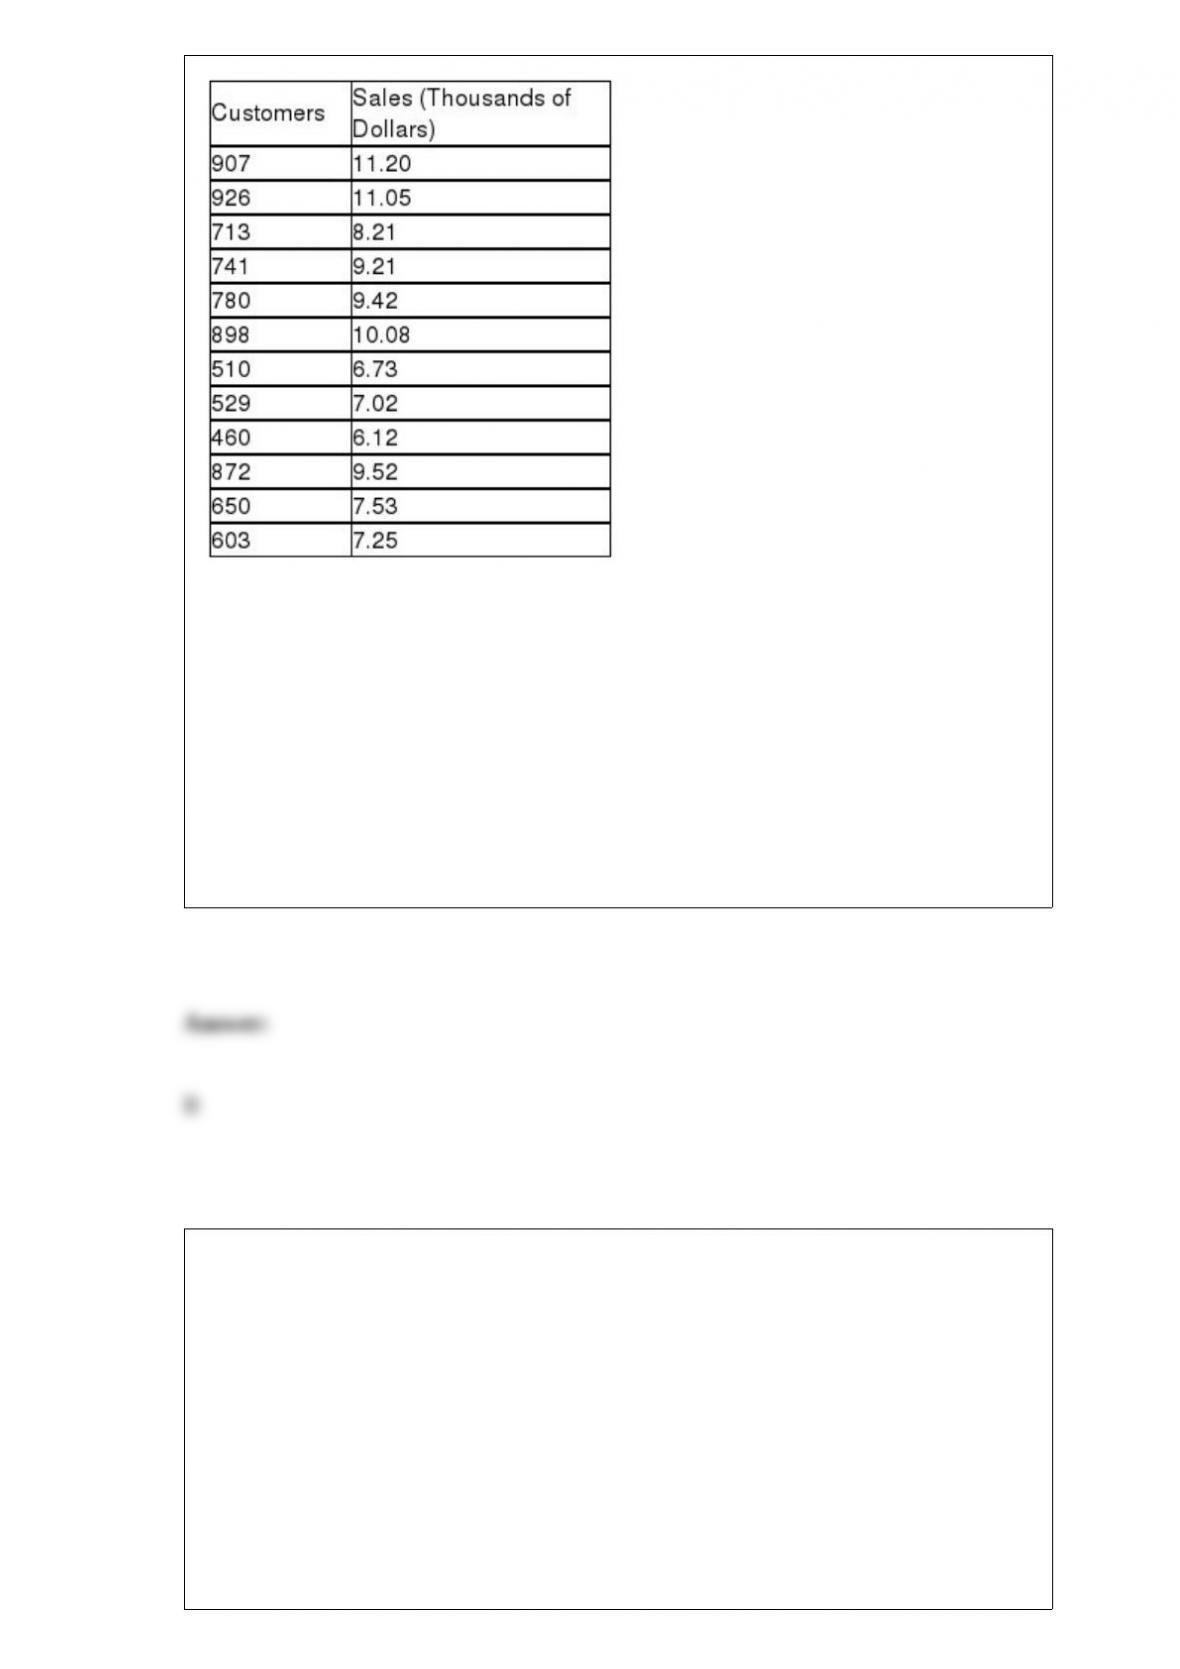
Referring to Table 13-10, the residual plot indicates possible violation of which
assumptions?
A) Linearity of the relationship
B) Homoscedasticity
C) Autocorrelation
D) Normality
A physician and president of a Tampa Health Maintenance Organization (HMO) are
attempting to show the benefits of managed health care to an insurance company. The
physician believes that certain types of doctors are more cost-effective than others. To
investigate this, the president obtained independent random samples of 20 HMO
physicians from each of 4 primary specialties – General Practice (GP), Internal
Medicine (IM), Pediatrics (PED), and Family Physicians (FP) – and recorded the total
charges per member per month for each. A second variable which the president believes
influences total charges per member per month is whether the doctor is a foreign or
USA medical school graduate. To investigate this, the president also collected data on
20 foreign medical school graduates in each of the 4 primary specialty types described
above. Altogether, information on charges for 40 doctors (20 foreign and 20 USA
medical school graduates) was obtained for each of the 4 specialties. Which of the
following tests will be the most appropriate to find out if the primary specialty and the
origin of medical school degree interact to affect the charges?
A) Tukey-Kramer multiple comparisons procedure for one-way ANOVA
B) One-way ANOVA F test for differences among more than two means
C) One-way ANOVA F test for interaction effect
D) Two-way ANOVA F test for interaction effect
A model that can be used to make predictions about long-term future values of a time
series is
A) linear trend.
B) quadratic trend.
C) exponential trend.
D) All of the above.
A survey claims that 9 out of 10 doctors recommend aspirin for their patients with
headaches. To test this claim against the alternative that the actual proportion of doctors
who recommend aspirin is less than 0.90, a random sample of 100 doctors was selected.
Suppose that the test statistic is -2.20. Can you conclude that H0 should be rejected at
the (a) = 0.10, (b) = 0.05, and (c) = 0.01 level of Type I error?
A) (a) yes; (b) yes; (c) yes
B) (a) no; (b) no; (c) no
C) (a) no; (b) no; (c) yes
D) (a) yes; (b) yes; (c) no
Which of the following yields a cluster sample?
A) All students in a class are divided into groups of 15. One student is randomly chosen
from the 1st group, the remaining observations are every 15th student thereafter.
B) The best 15 students, according to the opinion of the instructor, in a class are
selected.
C) All students in a class are grouped according to their gender. A random sample of 8
is selected from the males and a separate random sample of 7 is selected from the
females.
D) All students in a class are divided into groups according to the rows that they are
seated. One of the groups is randomly selected.
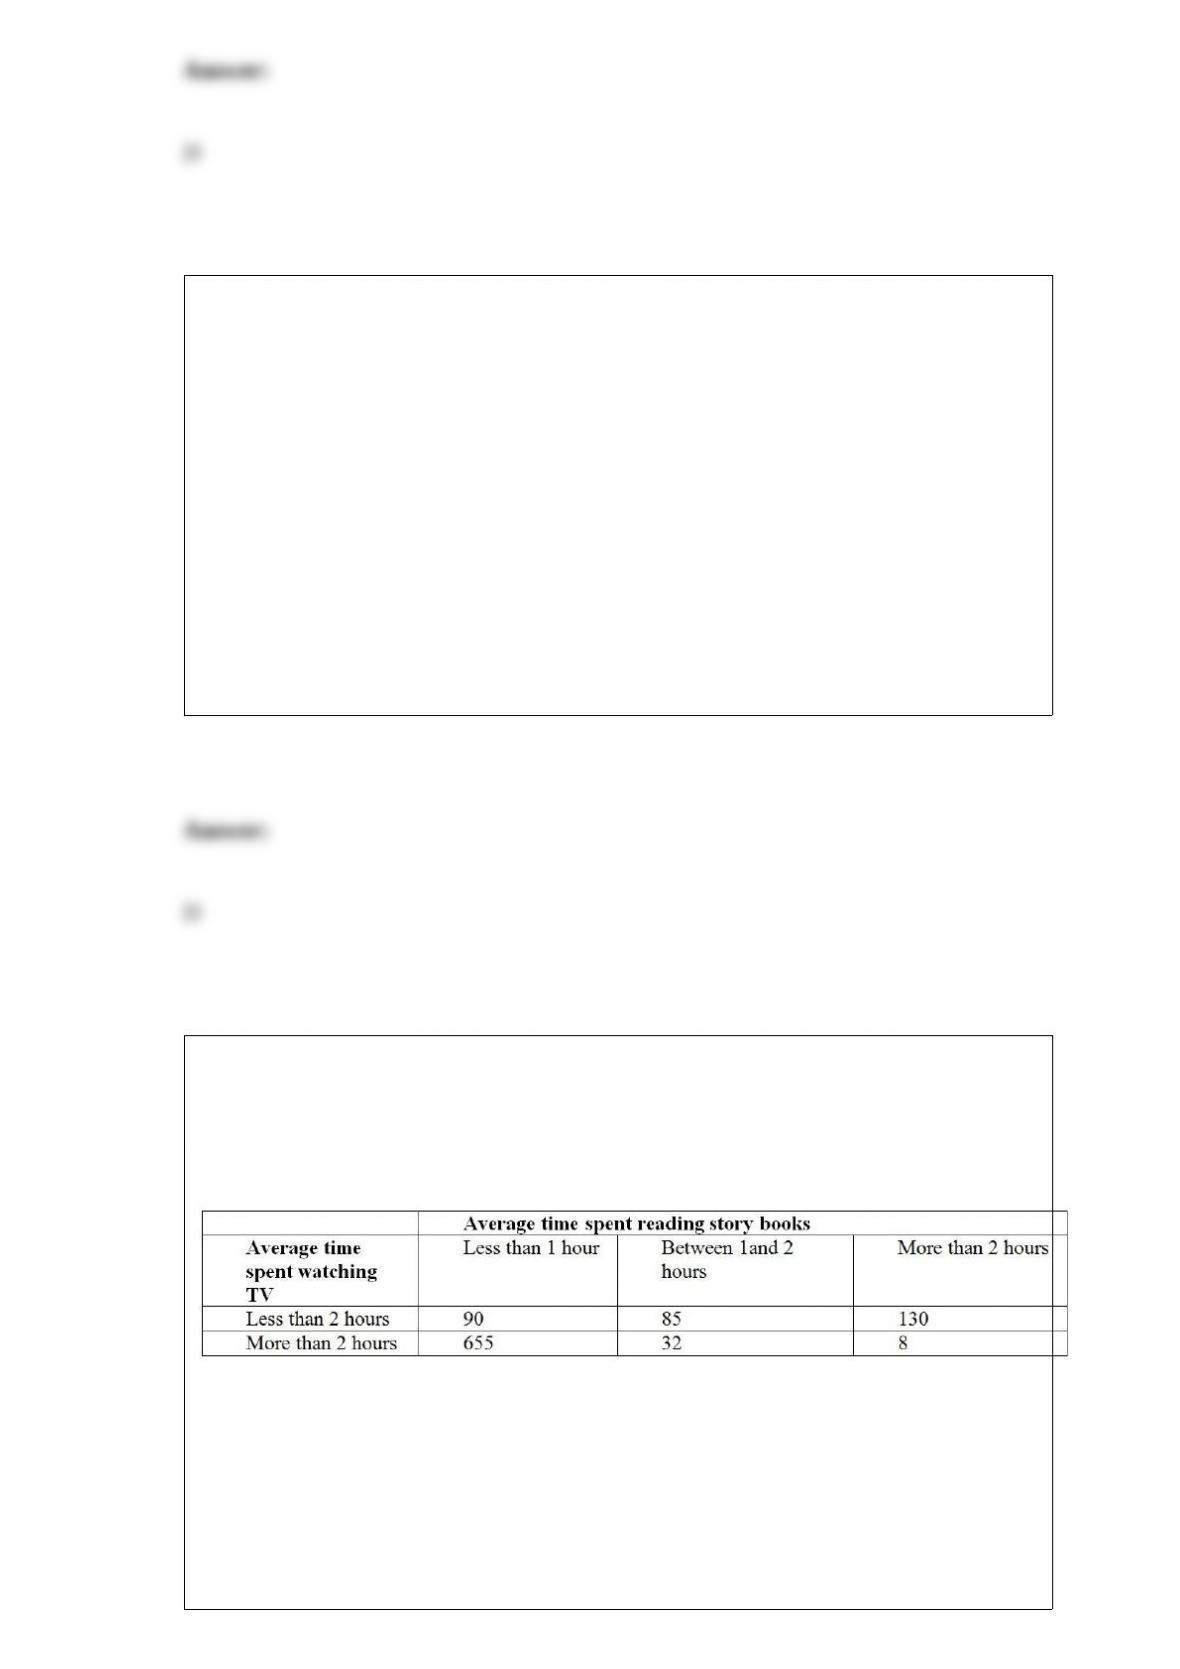
TABLE 12-12
Parents complain that children read too few storybooks and watch too much television
nowadays. A survey of 1,000 children reveals the following information on average
time spent watching TV and average time spent reading storybooks.
Referring to Table 12-12, if the null hypothesis of no connection between time spent
watching TV and time spent reading story books is true, how many children watching
less than 2 hours of TV and reading more than 2 hours of story books on average can
we expect?
A) 42.09
B) 155.25
C) 262.92
D) 987.75
TABLE 8-18
A wealthy real estate investor wants to decide whether it is a good investment to build a
high-end shopping complex in a suburban county in Chicago. His main concern is the
total market value of the 3,605 houses in the suburban county. He commissioned a
statistical consulting group to take a sample of 200 houses and obtained a sample mean
market price of $225,000 and a sample standard deviation of $38,700. The consulting
group also found out that the mean differences between market prices and appraised
prices was $125,000 with a standard deviation of $3,400. Also the proportion of houses
in the sample that are appraised for higher than the market prices is 0.24.
Referring to Table 8-18, if he wants a 95% confidence on estimating the true population
mean market price of the houses in the suburban county to be within $10,000, how
large a sample will he need?
Referring to Table 14-18, what is the estimated odds ratio for a school
with a mean SAT score of 1250 and a TOEFL criterion that is at least
90?
TABLE 14-18
A logistic regression model was estimated in order to predict the
probability that a randomly chosen university or college would be a
private university using information on mean total Scholastic Aptitude
Test score (SAT) at the university or college and whether the TOEFL
criterion is at least 90 (Toe90 = 1 if yes, 0 otherwise). The
dependent variable, Y, is school type (Type = 1 if private and 0
otherwise).
The PHStat output is given below:
The amount of time necessary for assembly line workers to complete a product is a
normal variable with a mean of 15 minutes and a standard deviation of 2 minutes. The
probability is ________ that a product is assembled in between 10 and 12 minutes.
A national trend predicts that women will account for half of all business travelers in
the next 3 years. To attract these women business travelers, hotels are providing more
amenities that women particularly like. A recent survey of American hotels found that
70% offer hairdryers in the bathrooms. Consider a random and independent sample of
20 hotels. Find the probability that all of the hotels in the sample offered hairdryers in
the bathrooms.
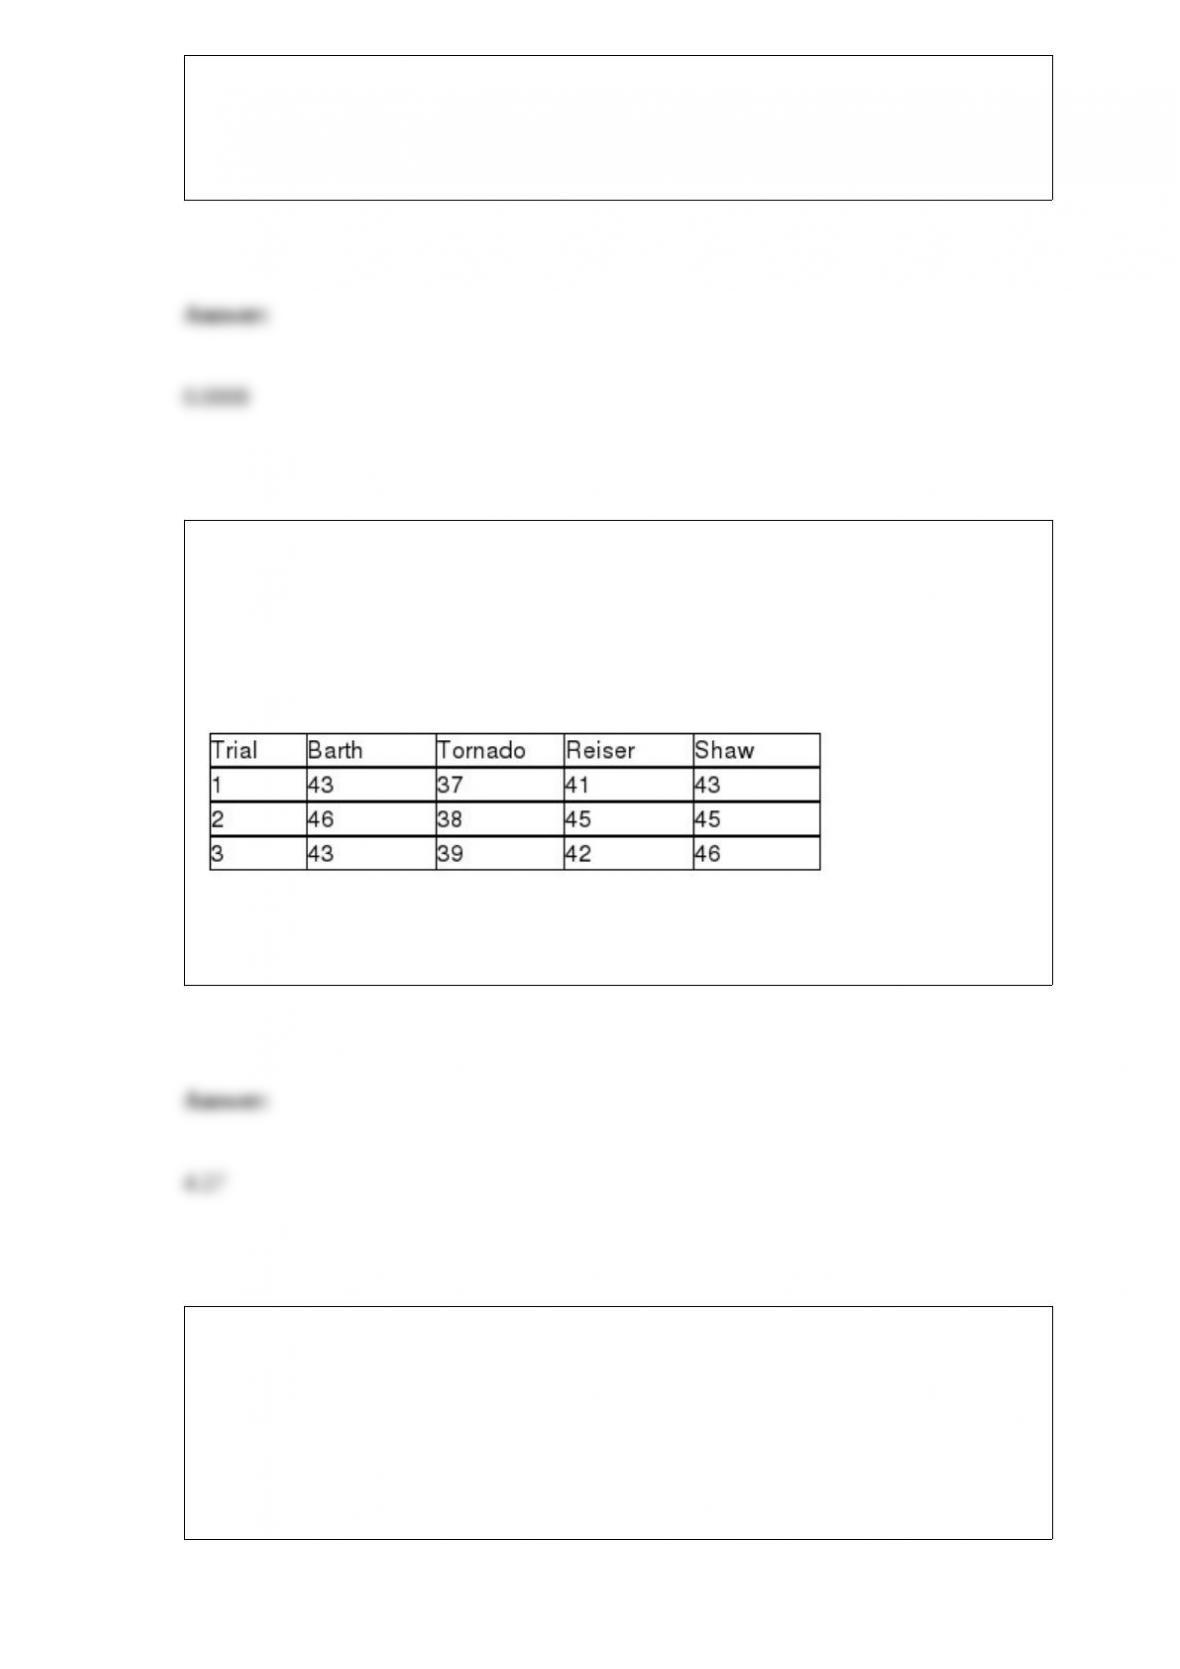
TABLE 11-3
As part of an evaluation program, a sporting goods retailer wanted to compare the
downhill coasting speeds of 4 brands of bicycles. She took 3 of each brand and
determined their maximum downhill speeds. The results are presented in miles per hour
in the table below.
Referring to Table 11-3, using an overall level of significance of 0.05, the critical range
for the Tukey-Kramer procedure is ________.
TABLE 5-8
Two different designs on a new line of winter jackets for the coming winter are
available for your manufacturing plants. Your profit (in thousands of dollars) will
depend on the taste of the consumers when winter arrives. The probability of the three
possible different tastes of the consumers and the corresponding profits are presented in
the following table.
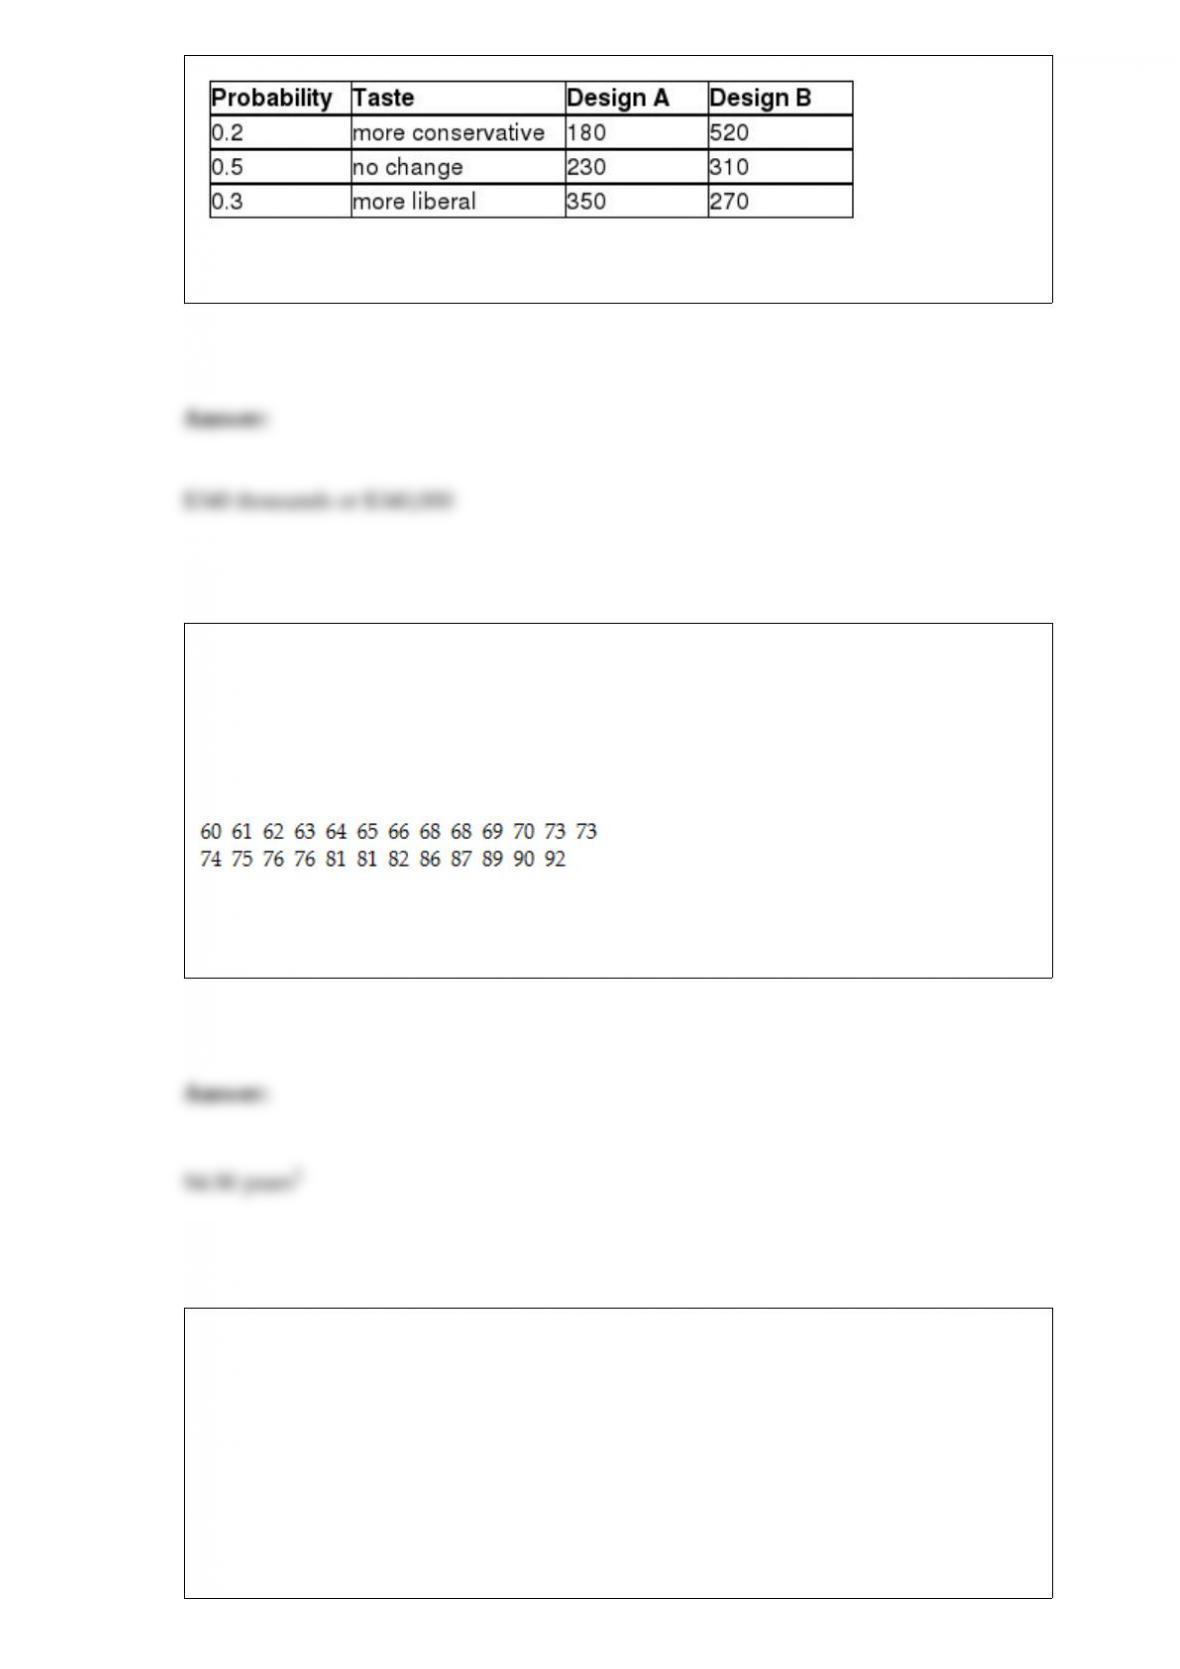
Referring to Table 5-8, what is your expected profit when Design B is chosen?
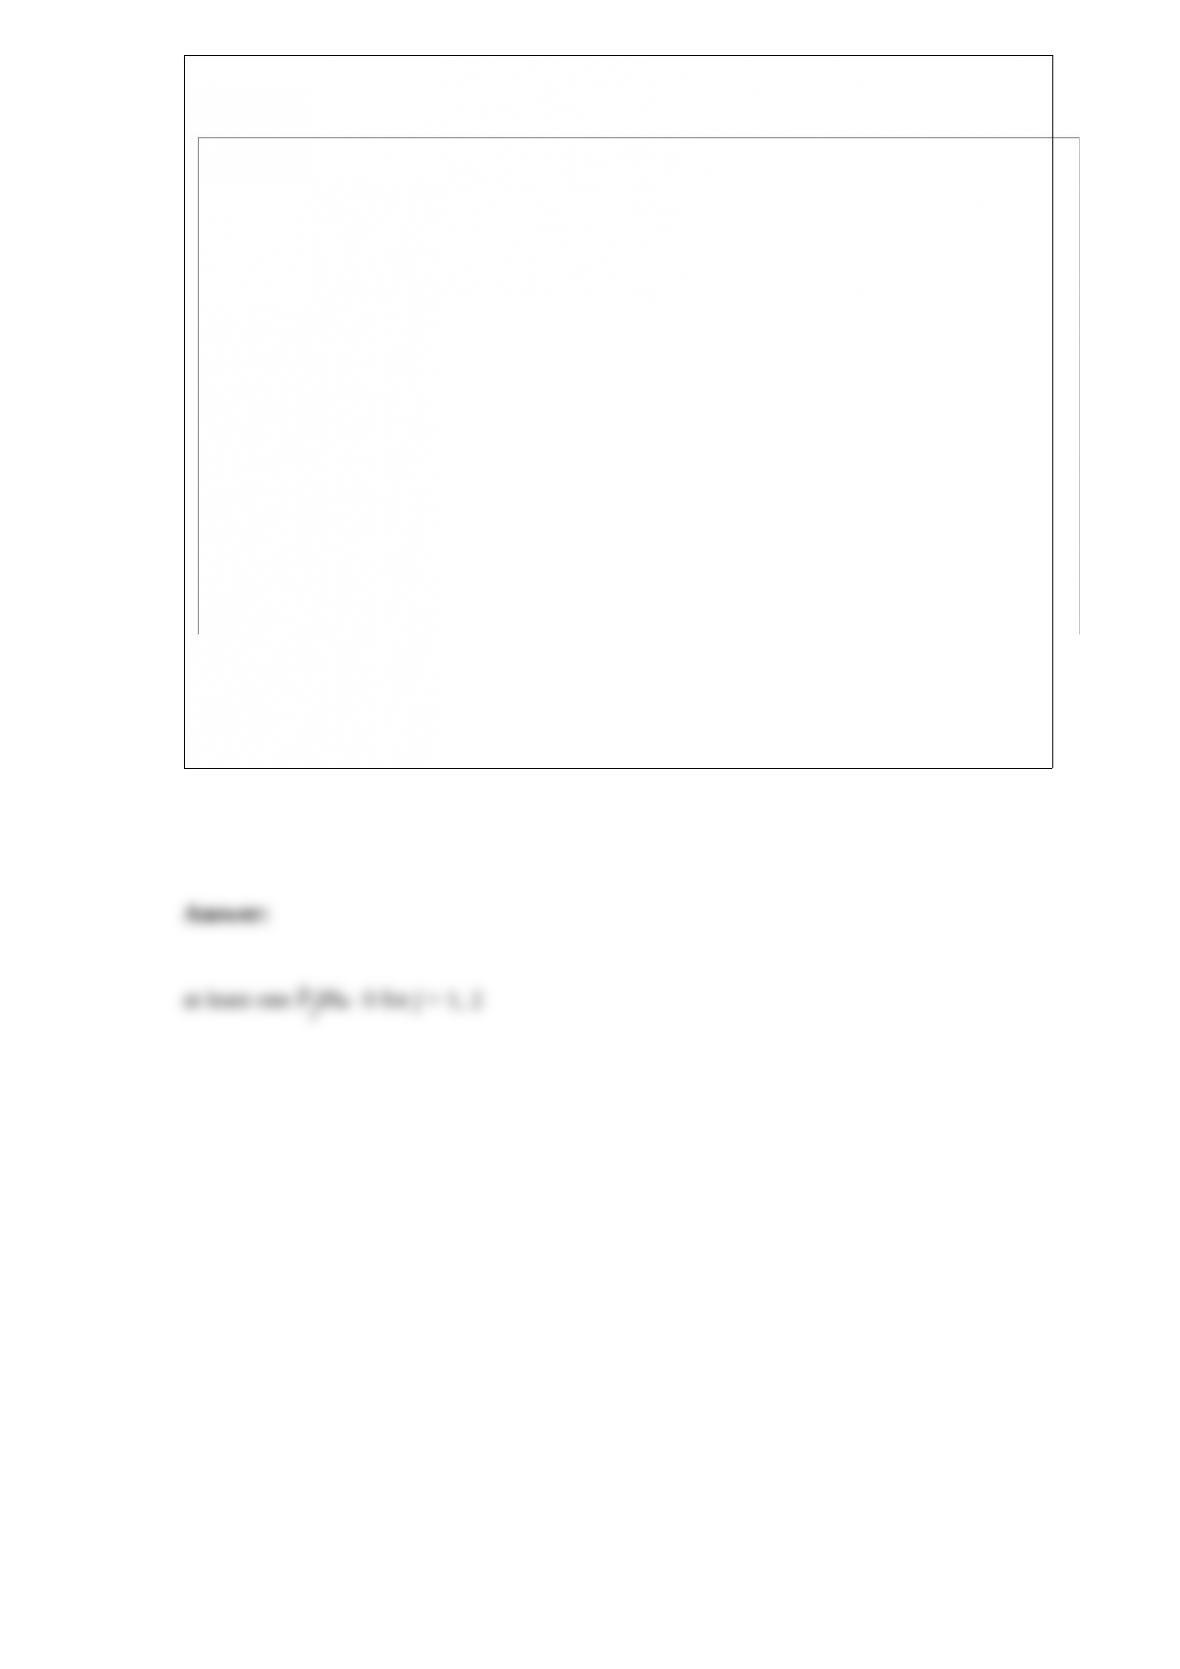
TABLE 3-1
Health care issues are receiving much attention in both academic and political arenas. A
sociologist recently conducted a survey of citizens over 60 years of age whose net
worth is too high to qualify for Medicaid. The ages of 25 senior citizens were as
follows:
Referring to Table 3-1, calculate the variance of the ages of the senior citizens correct to
the nearest hundredth of a year squared.
Referring to Table 14-8, the analyst wants to use an F test to test H0 :
β1 = β2 = 0. The appropriate alternative hypothesis is ________.TABLE
14-8
A financial analyst wanted to examine the relationship between salary
(in $1,000) and 2 variables: age
(X1 = Age) and experience in the field (X2 = Exper). He took a sample
of 20 employees and obtained the following Microsoft Excel output:
Also, the sum of squares due to the regression for the model that
includes only Age is 5022.0654 while the sum of squares due to the
regression for the model that includes only Exper is 125.9848.