
TABLE 14-17
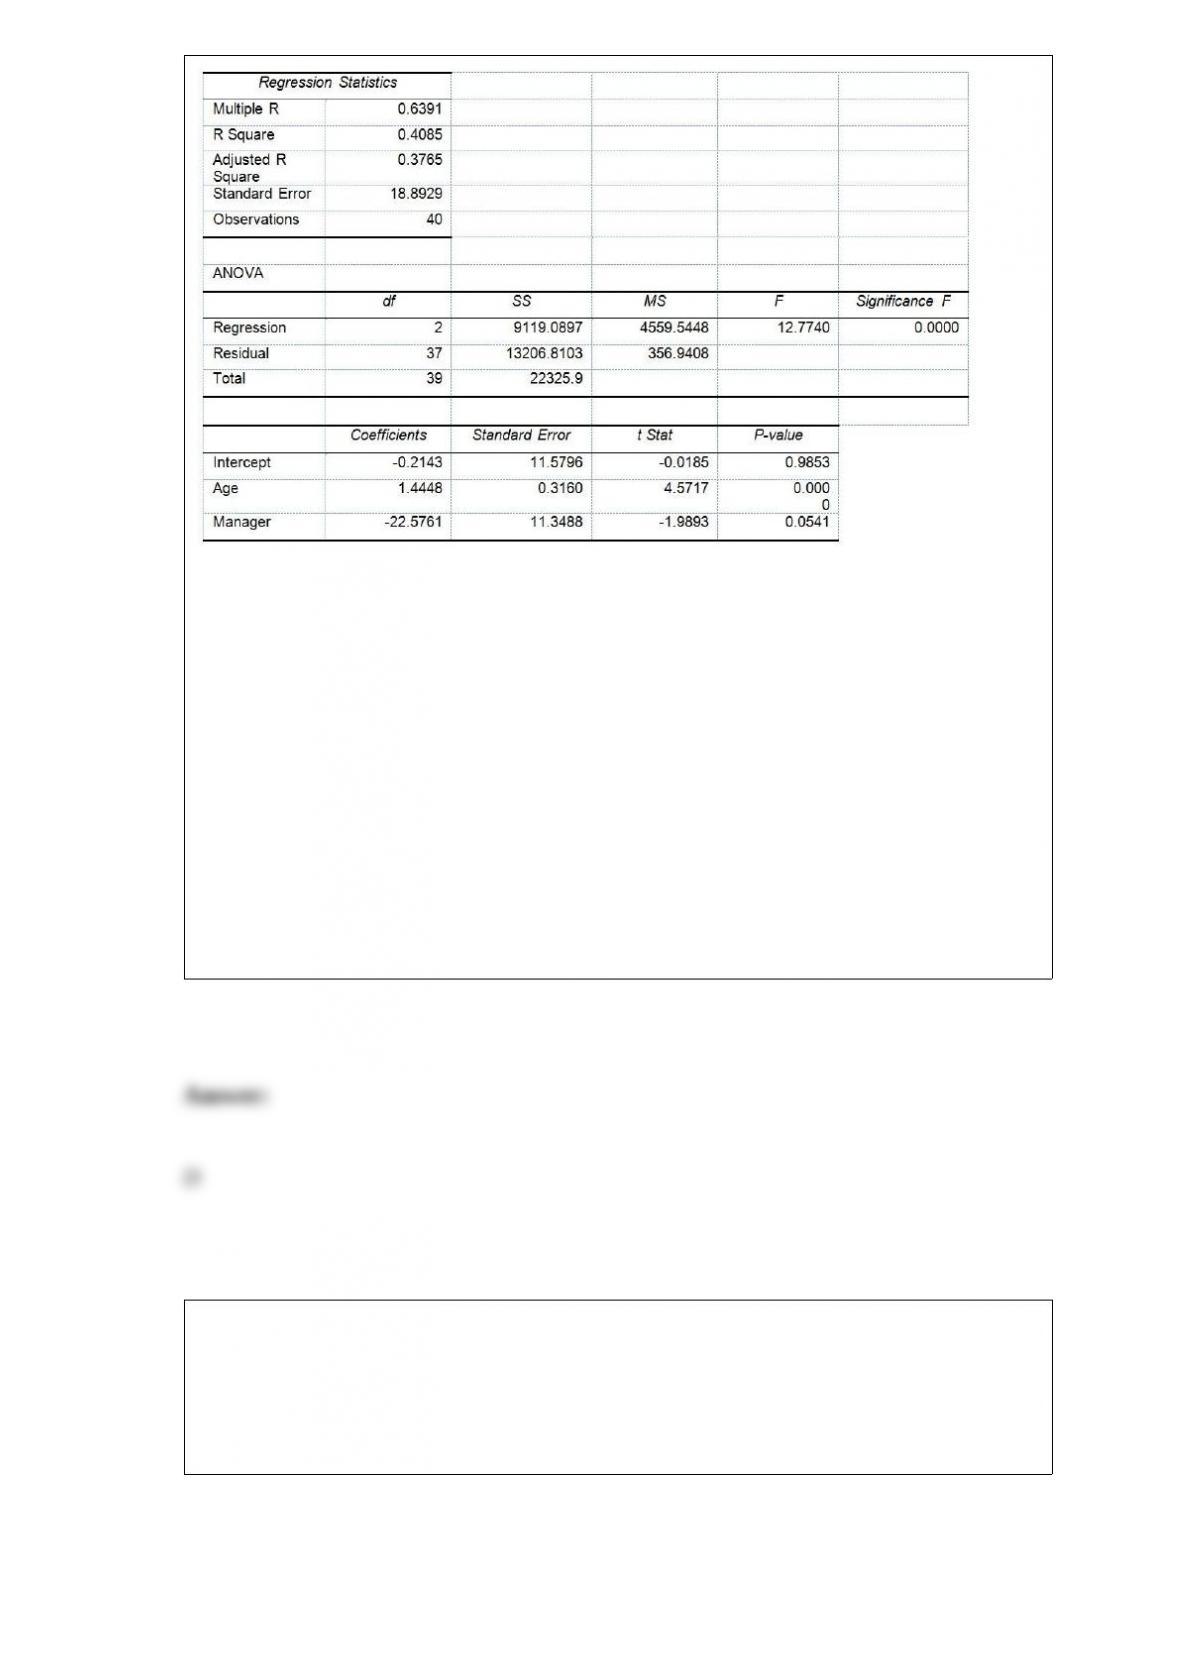
Given below are results from the regression analysis where the
dependent variable is the number of weeks a worker is unemployed
due to a layo! (Unemploy) and the independent variables are the age
of the worker (Age) and a dummy variable for management position
(Manager: 1 = yes, 0 = no).
The results of the regression analysis are given below:
True or False: Referring to Table 14-17, there is suffcient evidence
that age has an e!ect on the number of weeks a worker is
unemployed due to a layo! while holding constant the e!ect of the
other independent variable at a 10% level of signiticance.
TABLE 8-8
The president of a university would like to estimate the proportion of the student
population that owns a personal computer. In a sample of 500 students, 417 own a
personal computer.
True or False: Referring to Table 8-8, a confidence interval estimate of the population
proportion would only be valid if the distribution of the number of students who own a
personal computer is normal.
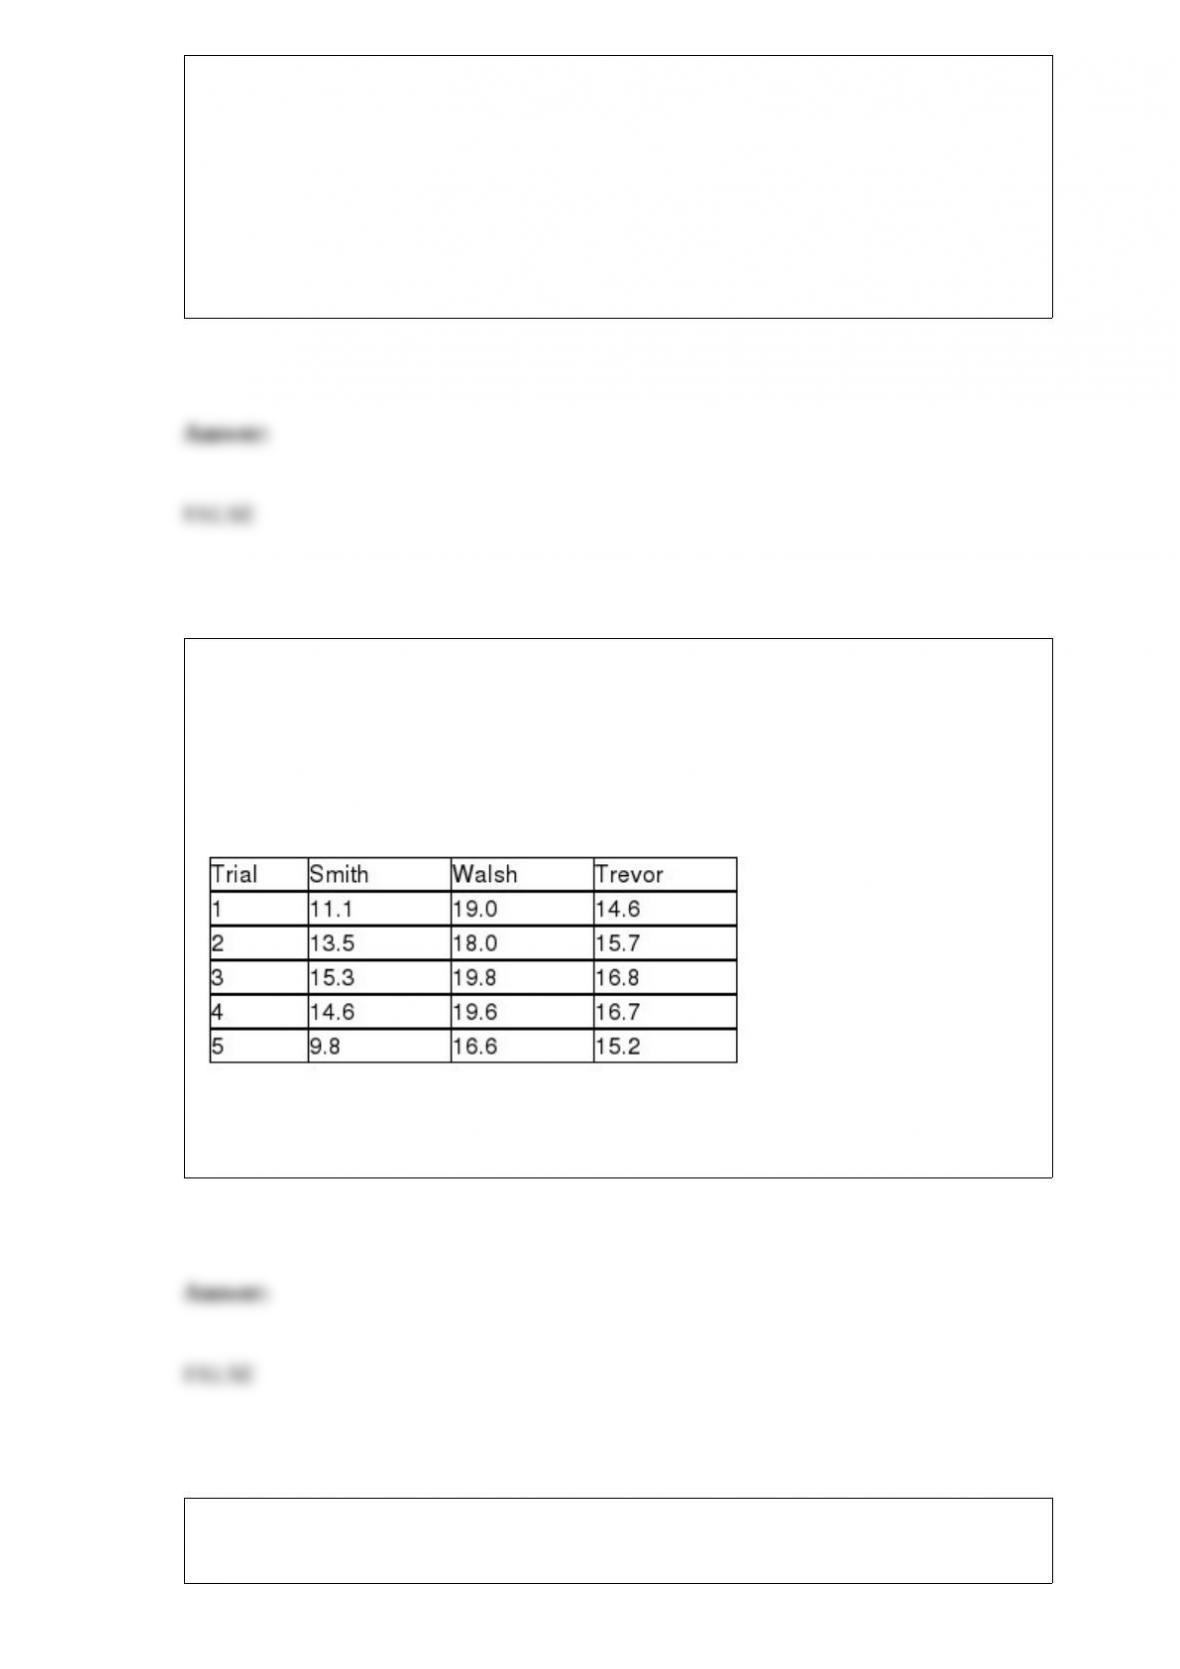
TABLE 11-4
An agronomist wants to compare the crop yield of 3 varieties of chickpea seeds. She
plants 15 fields, 5 with each variety. She then measures the crop yield in bushels per
acre. Treating this as a completely randomized design, the results are presented in the
table that follows.
True or False: Referring to Table 11-4, the decision made at 0.005 level of significance
implies that all 3 means are significantly different.
True or False: TABLE 17-10
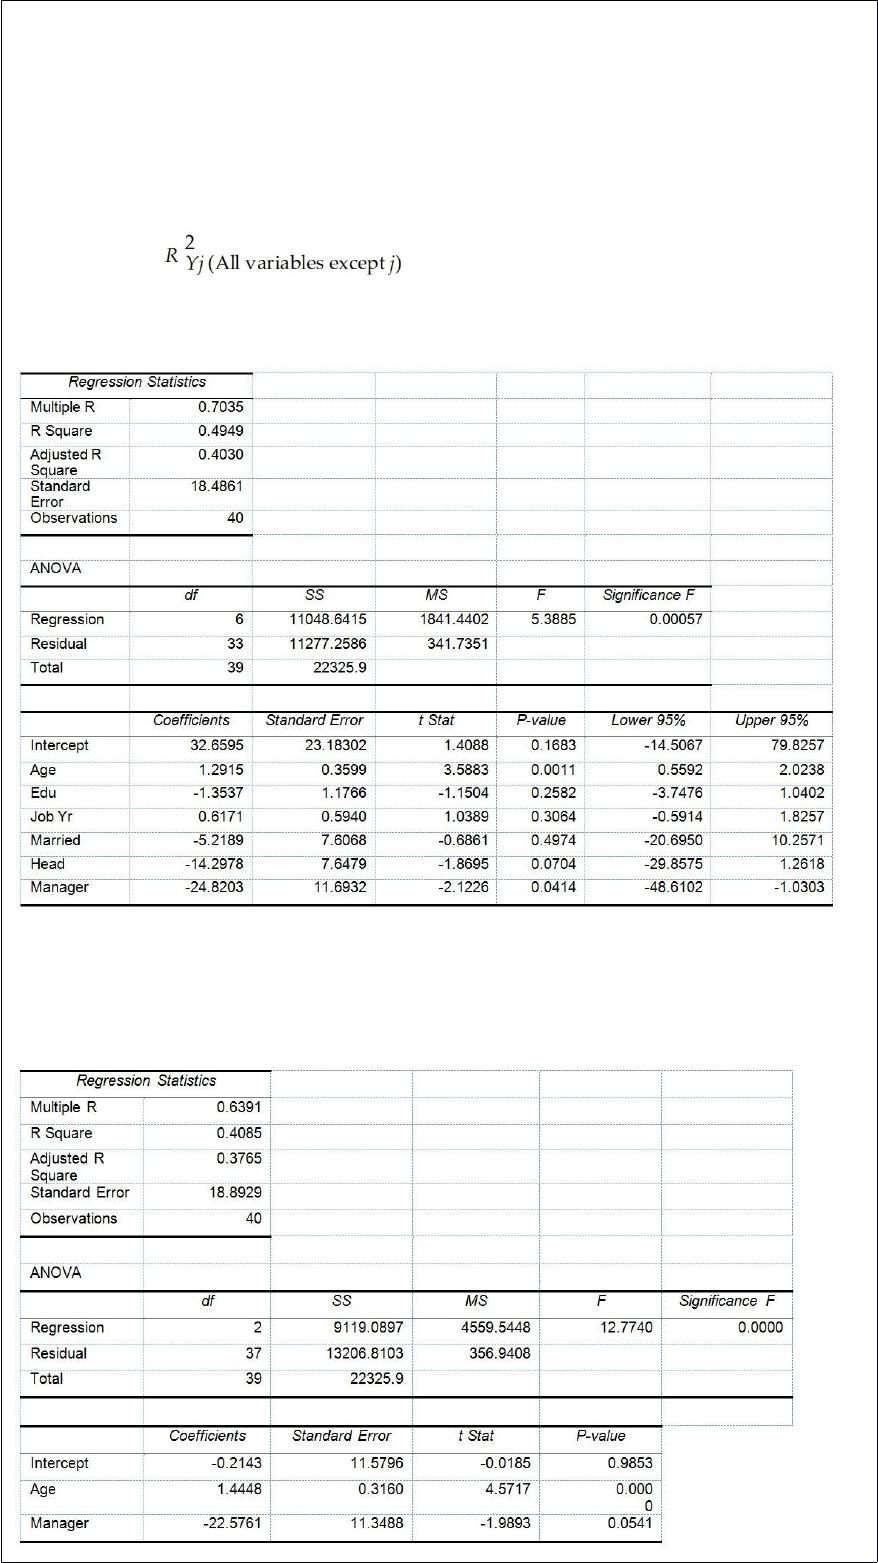
Given below are results from the regression analysis where the dependent variable is
the number of weeks a worker is unemployed due to a layoff (Unemploy) and the
independent variables are the age of the worker (Age), the number of years of education
received (Edu), the number of years at the previous job (Job Yr), a dummy variable for
marital status (Married: 1 = married, 0 = otherwise), a dummy variable for head of
household (Head: 1 = yes, 0 = no) and a dummy variable for management position
(Manager: 1 = yes, 0 = no). We shall call this Model 1. The coefficient of partial
determination ( ) of each of the 6 predictors are, respectively,
0.2807, 0.0386, 0.0317, 0.0141, 0.0958, and 0.1201.
Model 2 is the regression analysis where the dependent variable is Unemploy and the
independent variables are Age and Manager. The results of the regression analysis are
given below:
Referring to Table 17-10, Model 1, we can conclude that, holding constant the effect of
the other independent variables, there is a difference in the mean number of weeks a
worker is unemployed due to a layoff between a worker who is married and one who is
not at a 1% level of significance if all we have is the information of the 95% confidence
interval estimate forβ4.
True or False: The median of the values 3.4, 4.7, 1.9, 7.6, and 6.5 is 4.05.
True or False: The possible responses to the question “How long have you been living
at your current residence?” are values from a continuous variable.
True or False: In the current data-driven environment of business, the decisions you
make will be increasingly based on gut or intuition supported by personal experience.
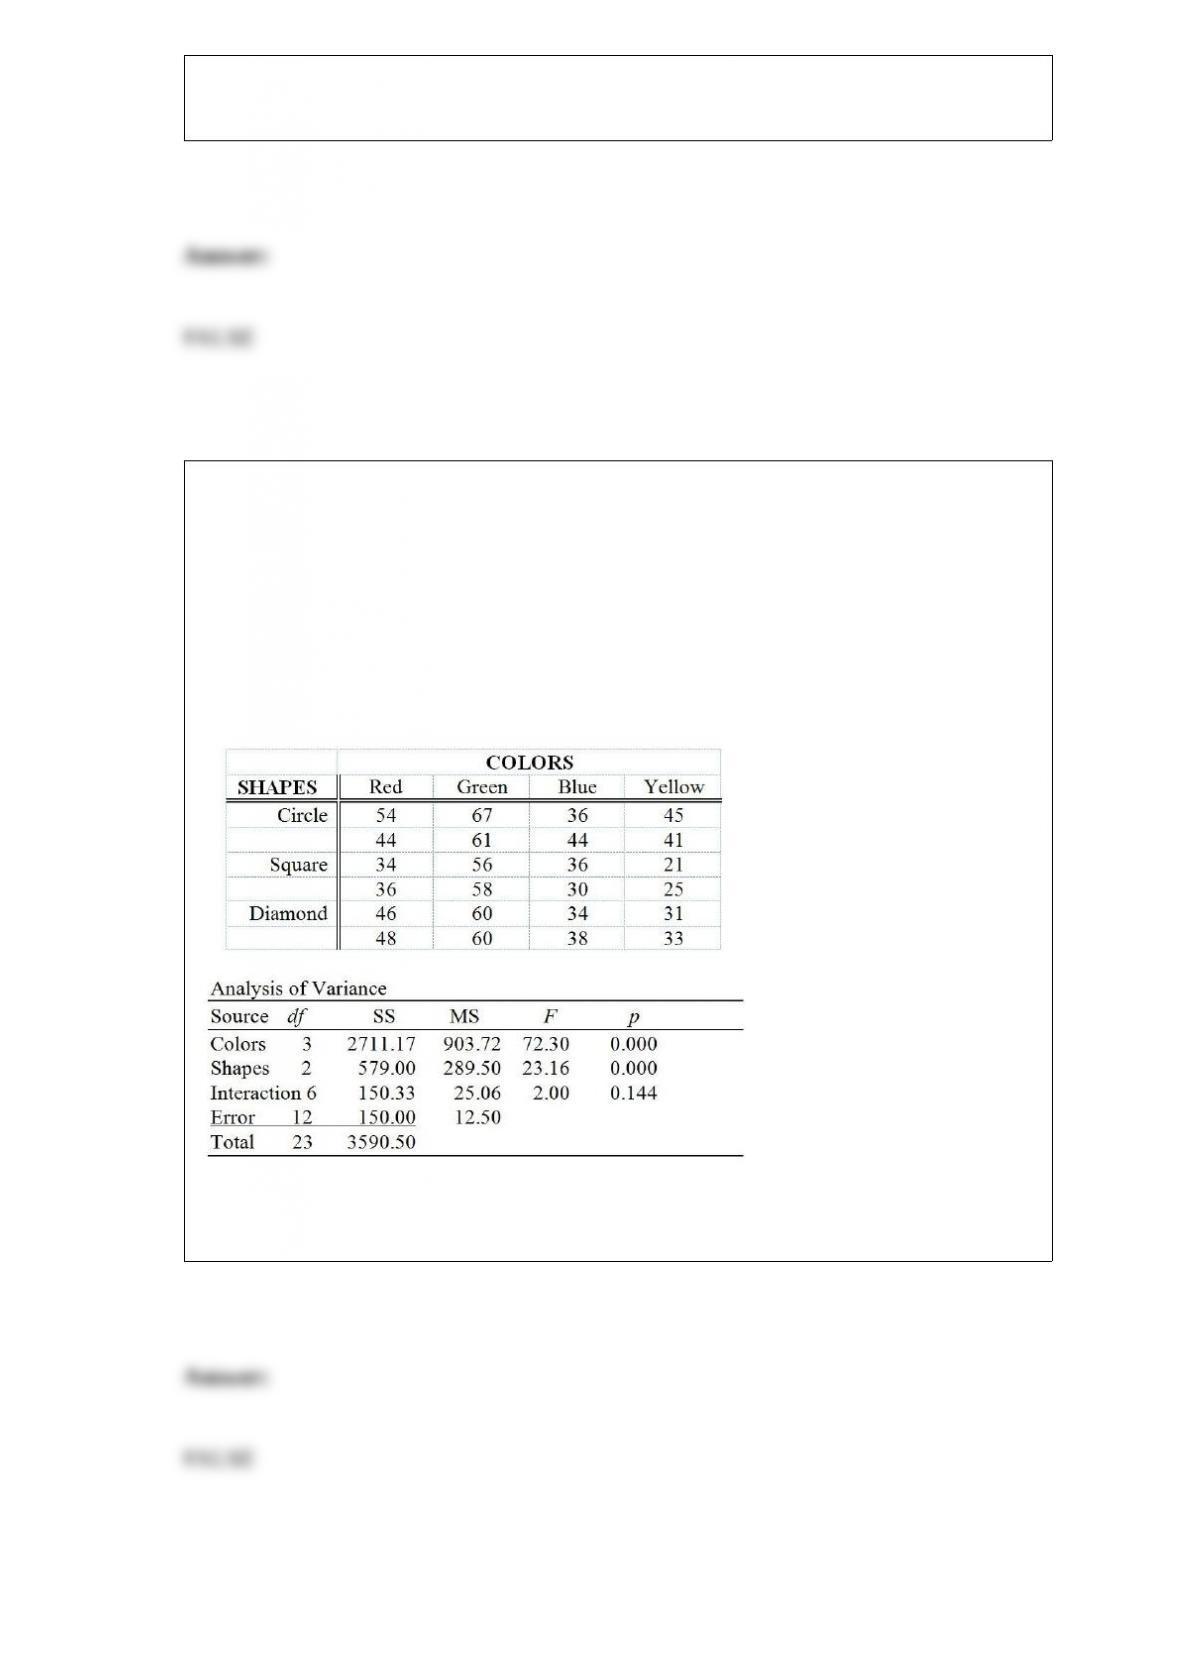
TABLE 11-9
The marketing manager of a company producing a new cereal aimed for children wants
to examine the effect of the color and shape of the box’s logo on the approval rating of
the cereal. He combined 4 colors and 3 shapes to produce a total of 12 designs. Each
logo was presented to 2 different groups (a total of 24 groups) and the approval rating
for each was recorded and is shown below. The manager analyzed these data using the
α = 0.05 level of significance for all inferences.
True or False: Referring to Table 11-9, based on the results of the hypothesis test, it
appears that there is a significant interaction.
True or False: A random sample of 50 provides a sample mean of 31 with a standard
deviation of S = 14. The upper bound of a 90% confidence interval estimate of the
population mean is 34.32.
TABLE 13-10
The management of a chain electronic store would like to develop a model for
predicting the weekly sales (in thousands of dollars) for individual stores based on the
number of customers who made purchases. A random sample of 12 stores yields the
following results:
True or False: Referring to Table 13-10, the null hypothesis for testing whether the
number of customers who make a purchase effects weekly sales cannot be rejected if a
1% probability of committing a type I error is desired.

To use the Wilcoxon Rank Sum Test as a test for location, you must assume that
A) the obtained data are either ranks or numerical measurements that will be converted
to combined ranks.
B) both samples are randomly and independently drawn from their respective
populations.
C) both underlying populations from which the samples were drawn are equivalent in
shape and dispersion.
D) All of the above.
TABLE 17-8
The superintendent of a school district wanted to predict the percentage of students
passing a sixth-grade proficiency test. She obtained the data on percentage of students
passing the proficiency test (% Passing), daily mean of the percentage of students
attending class (% Attendance), mean teacher salary in dollars (Salaries), and
instructional spending per pupil in dollars (Spending) of 47 schools in the state.
Following is the multiple regression output with Y = % Passing as the dependent
variable, X1 = % Attendance, X2 = Salaries and X3 = Spending:
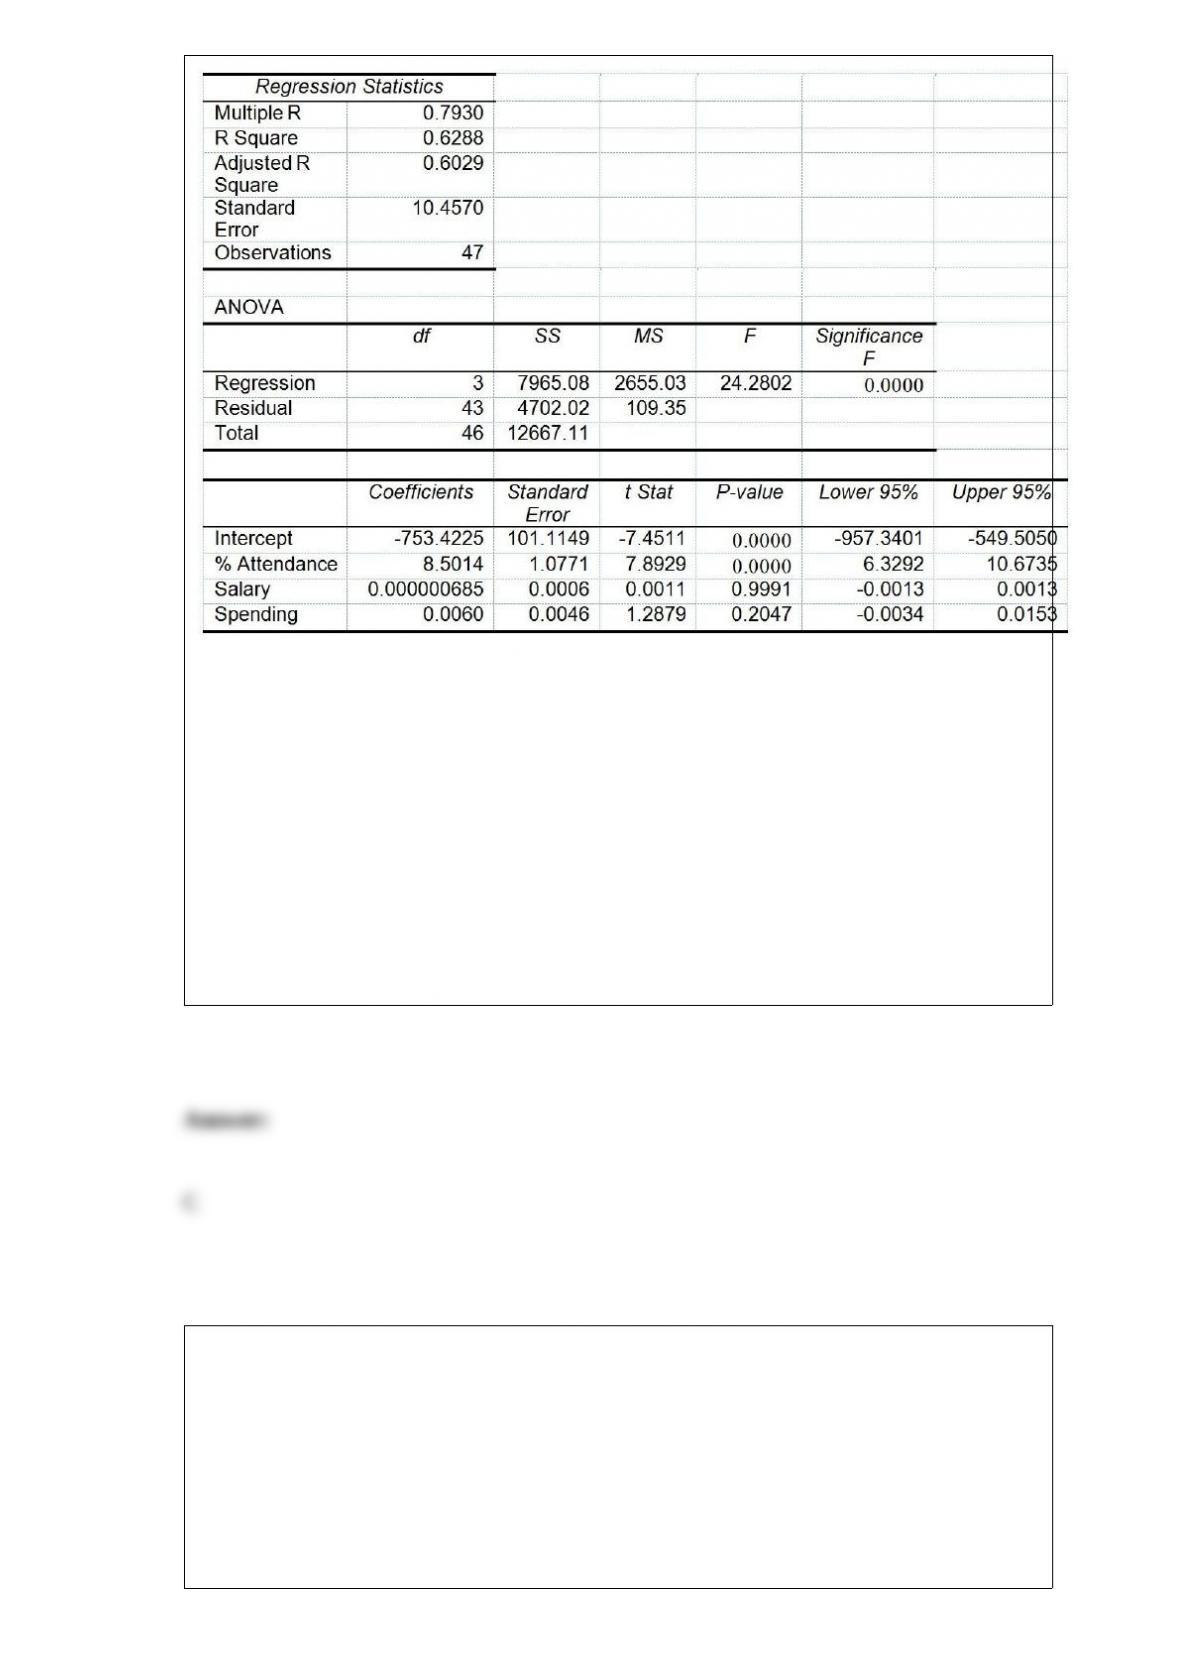
Referring to Table 17-8, which of the following is a correct statement?
A) The mean percentage of students passing the proficiency test is estimated to go up
by 8.50% when daily average of percentage of students attending class increases by 1%.
B) The daily mean of the percentage of students attending class is expected to go up by
an estimated 8.50% when the percentage of students passing the proficiency test
increases by 1%.
C) The mean percentage of students passing the proficiency test is estimated to go up
by 8.50% when daily average of the percentage of students attending class increases by
1% holding constant the effects of all the remaining independent variables.
D) The daily mean of the percentage of students attending class is expected to go up by
an estimated 8.50% when the percentage of students passing the proficiency test
increases by 1% holding constant the effects of all the remaining independent variables.
Sampling distributions describe the distribution of
A) parameters.
B) statistics.
C) both parameters and statistics.
D) neither parameters nor statistics.
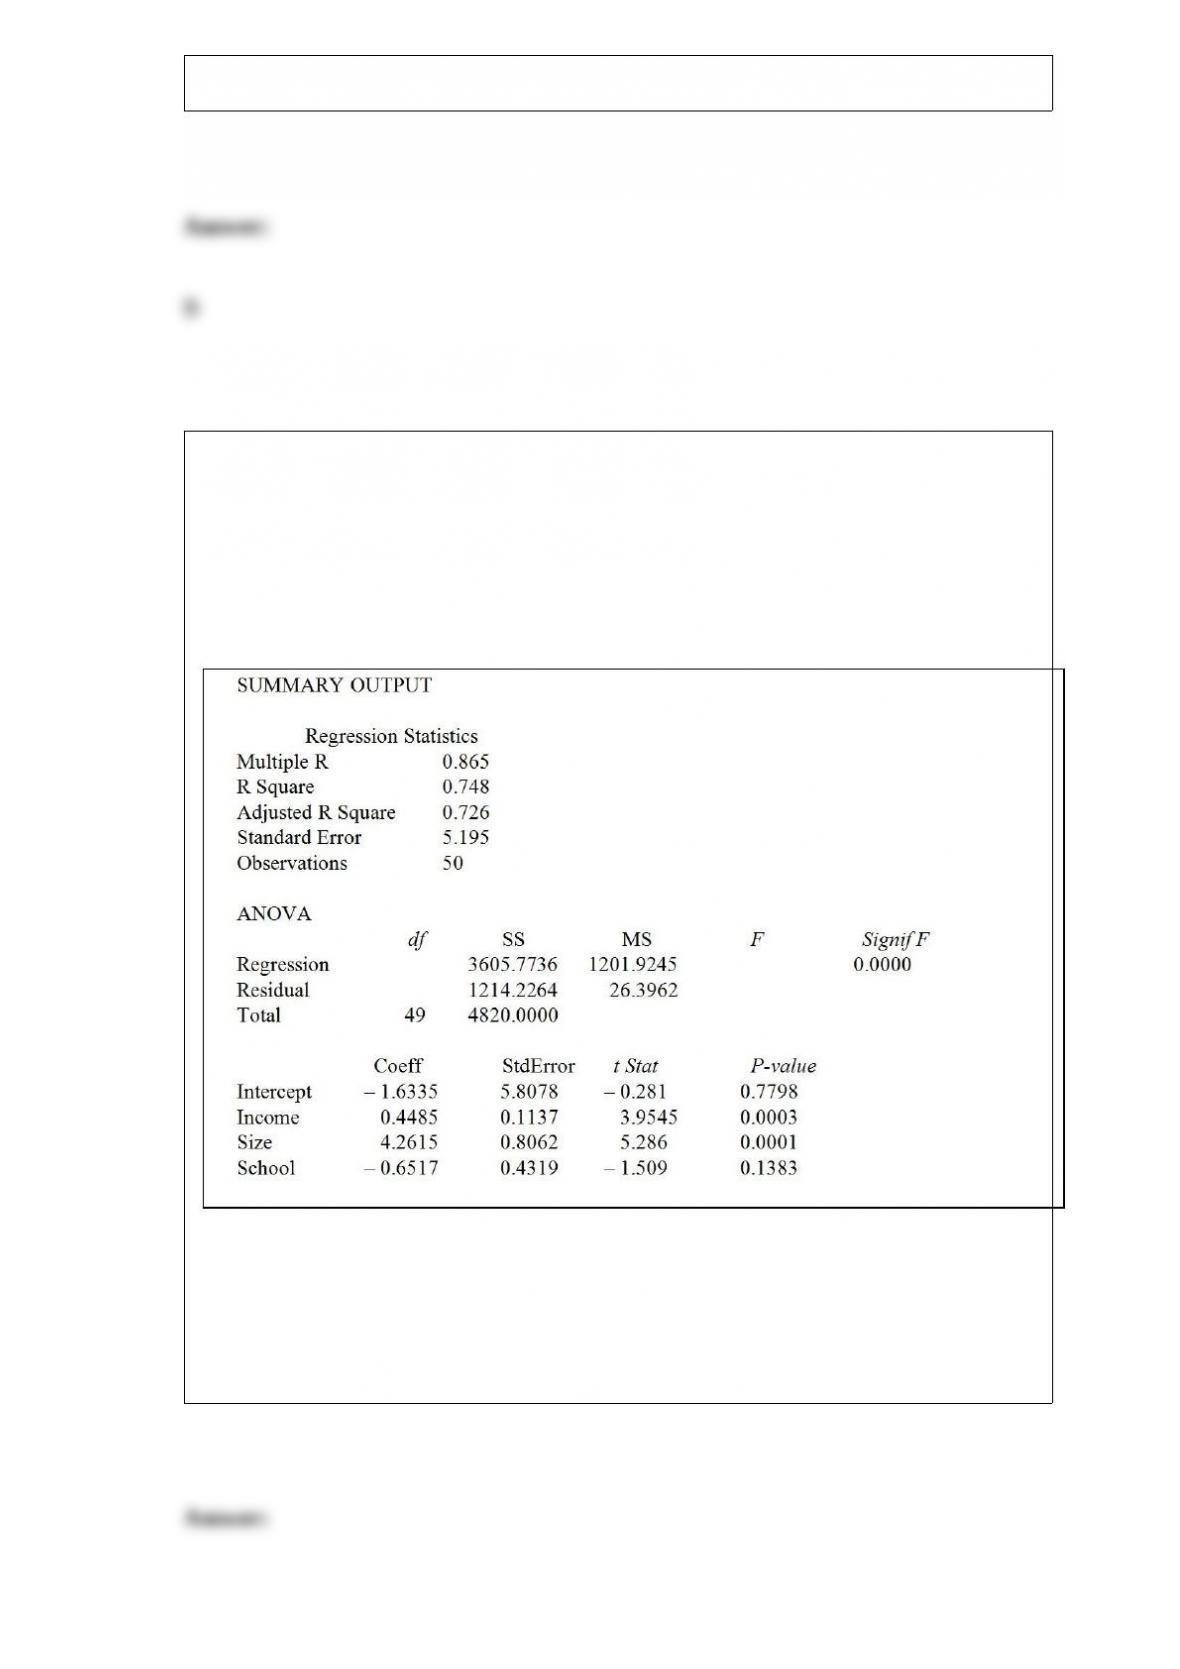
TABLE 17-1
A real estate builder wishes to determine how house size (House) is influenced by
family income (Income), family size (Size), and education of the head of household
(School). House size is measured in hundreds of square feet, income is measured in
thousands of dollars, and education is in years. The builder randomly selected 50
families and ran the multiple regression. Microsoft Excel output is provided below:
Referring to Table 17-1, which of the following values for the level of significance is
the smallest for which the regression model as a whole is significant?
A) 0.0005
B) 0.001
C) 0.01
D) 0.05

The chancellor of a major university was concerned about alcohol abuse on her campus
and wanted to find out the proportion of students at her university who visited campus
bars on the weekend before the final exam week. Her assistant took a random sample of
250 students and computed the portion of students in the sample who visited campus
bars on the weekend before the final exam. The portion of all students at her university
who visited campus bars on the weekend before the final exam week is an example of
A) a summary table.
B) an ogive.
C) a parameter.
D) a statistic.
Are Japanese managers more motivated than American managers? A randomly selected
group of 100 managers from each group were administered the Sarnoff Survey of
Attitudes Toward Life (SSATL), which measures motivation for upward mobility. The
mean and standard deviation of the SSATL scores are computed. The standard
deviations of the SSATL scores suggest that the standard deviation from the two groups
is very different. Which of the following tests will be the most appropriate?
A) t test for the mean
B) Z test for the proportion
C) Pooled-variance t test
D) Separate-variance t test
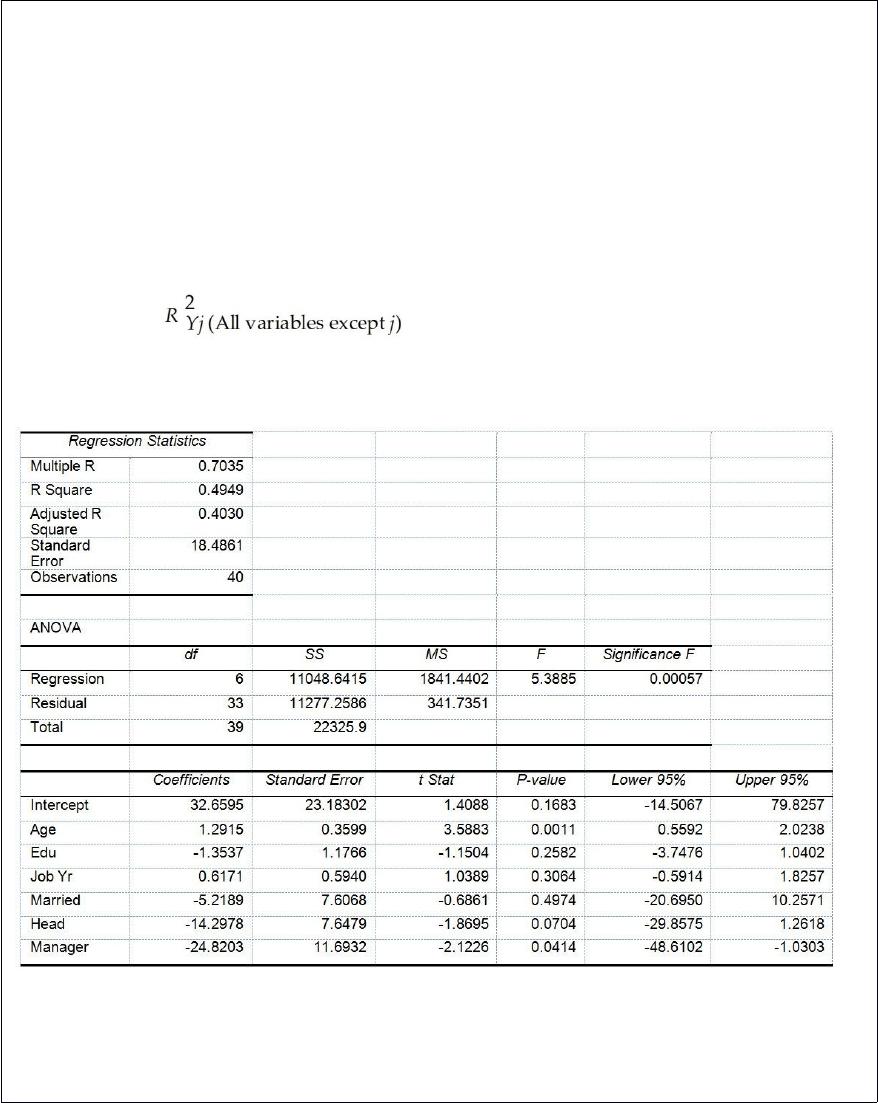
TABLE 17-10
Given below are results from the regression analysis where the dependent variable is
the number of weeks a worker is unemployed due to a layoff (Unemploy) and the
independent variables are the age of the worker (Age), the number of years of education
received (Edu), the number of years at the previous job (Job Yr), a dummy variable for
marital status (Married: 1 = married, 0 = otherwise), a dummy variable for head of
household (Head: 1 = yes, 0 = no) and a dummy variable for management position
(Manager: 1 = yes, 0 = no). We shall call this Model 1. The coefficient of partial
determination ( ) of each of the 6 predictors are, respectively,
0.2807, 0.0386, 0.0317, 0.0141, 0.0958, and 0.1201.
Model 2 is the regression analysis where the dependent variable is Unemploy and the
independent variables are Age and Manager. The results of the regression analysis are
given below:
Referring to Table 17-10, Model 1, which of the following is the correct alternative
hypothesis to determine whether there is a significant relationship between the number
of weeks a worker is unemployed due to a layoff and the entire set of explanatory
variables?
A) H1 : All βj ≠0 for j = 0, 1, 2, 3, 4, 5, 6
B) H1 : All βj ≠0 for j = 1, 2, 3, 4, 5, 6
C) H1 : At least one of βj ≠0 for j = 0, 1, 2, 3, 4, 5, 6
D) H1 : At least one of βj ≠0 for j = 1, 2, 3, 4, 5, 6
TABLE 18-1
A local newspaper has 10 delivery boys who each deliver the morning paper to 50
customers every day. The owner decides to record the number of papers delivered on
time for a 10-day period for one of the delivery boys and construct a p chart to see
whether the percentage is too erratic.
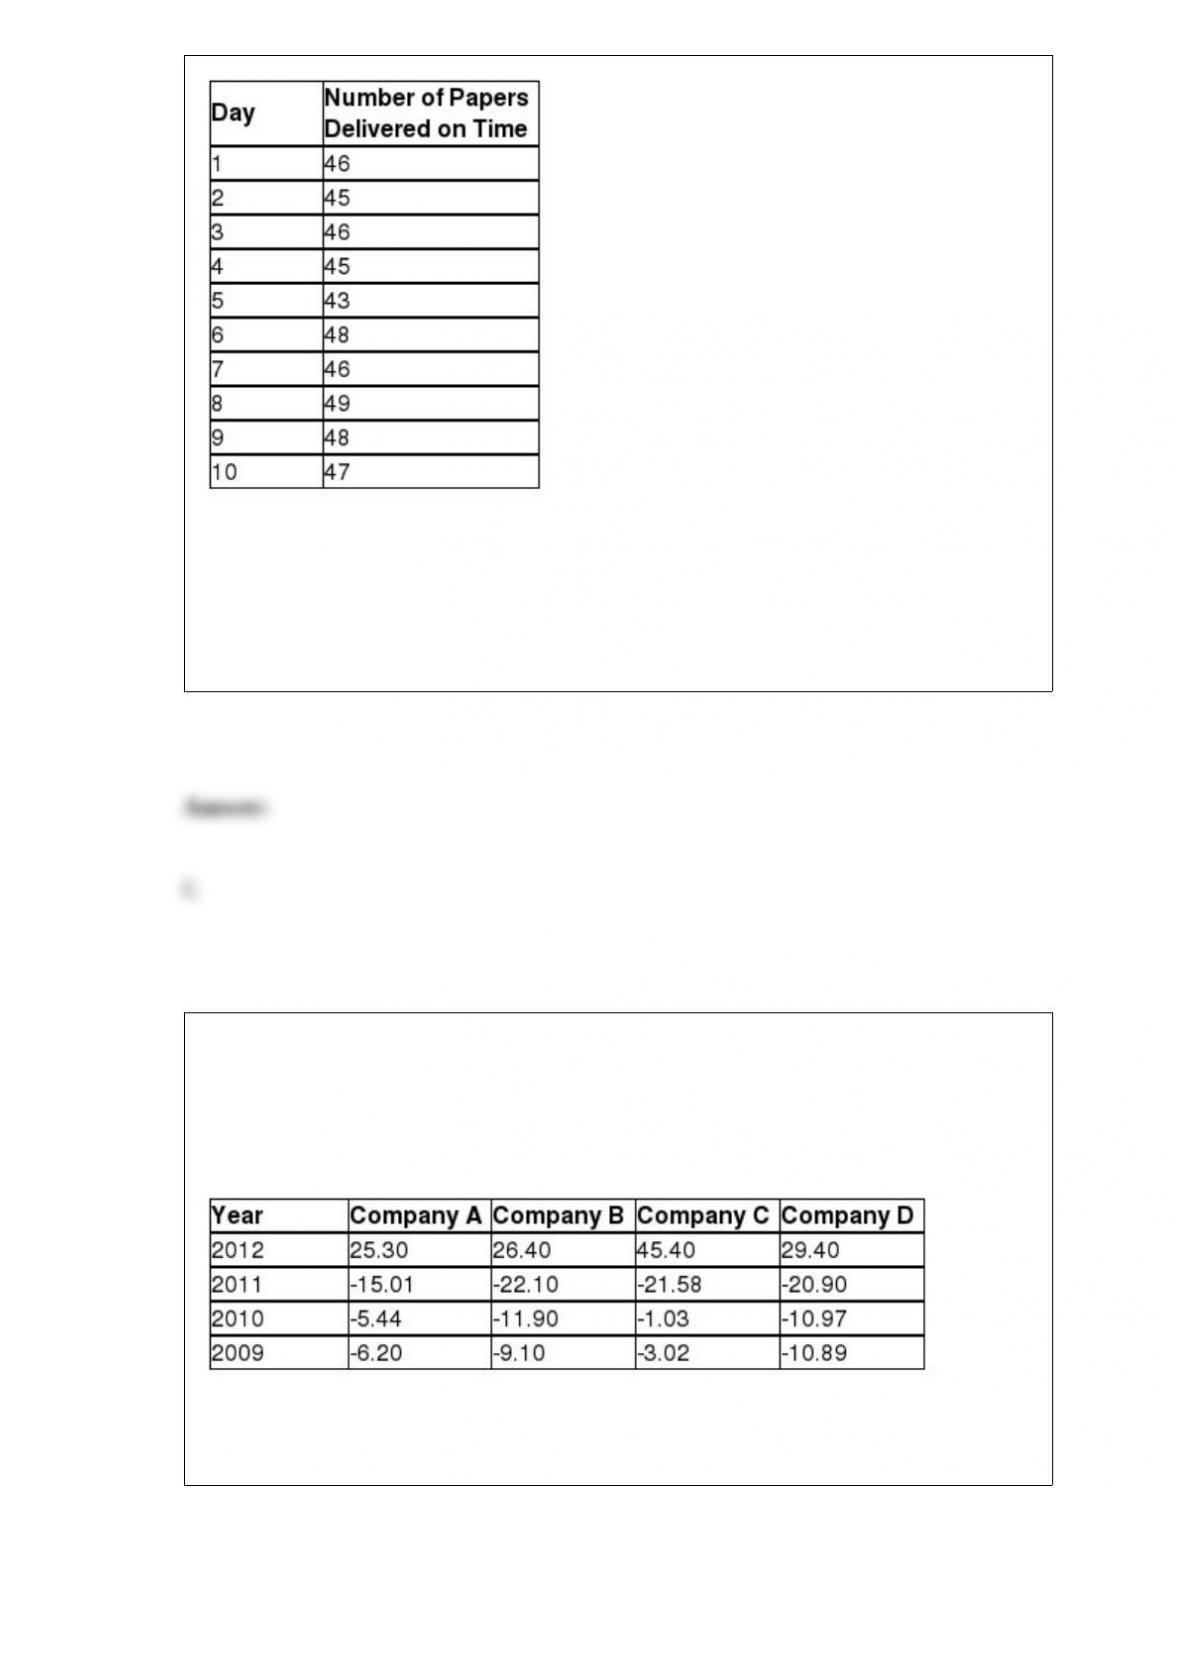
Referring to Table 18-1, what is the numerical value of the lower control limit for the p
chart?
A) 0.920
B) 0.911
C) 0.815
D) 0.798
TABLE 3-8
The time period from 2009 to 2012 saw a great deal of volatility in the value of stocks.
The data in the following table represent the total rate of return of our companies from
2009 to 2012.
Referring to Table 3-8, calculate the geometric mean rate of return per year for
Company A.

Which of the following scenarios will yield a nonprobability sample?
A) The subjects of the sample are chosen on the basis of known probability.
B) Items or individuals are chosen without regard to their probability of occurrence.
C) Every individual or item from the frame has an equal chance of being selected.
Selection may be with replacement or without replacement.
D) Decide on a sample size, n; divide the frame of N individuals into groups of k
individuals where k = N/n; randomly select one individual from the first group; select
every kth individual thereafter.
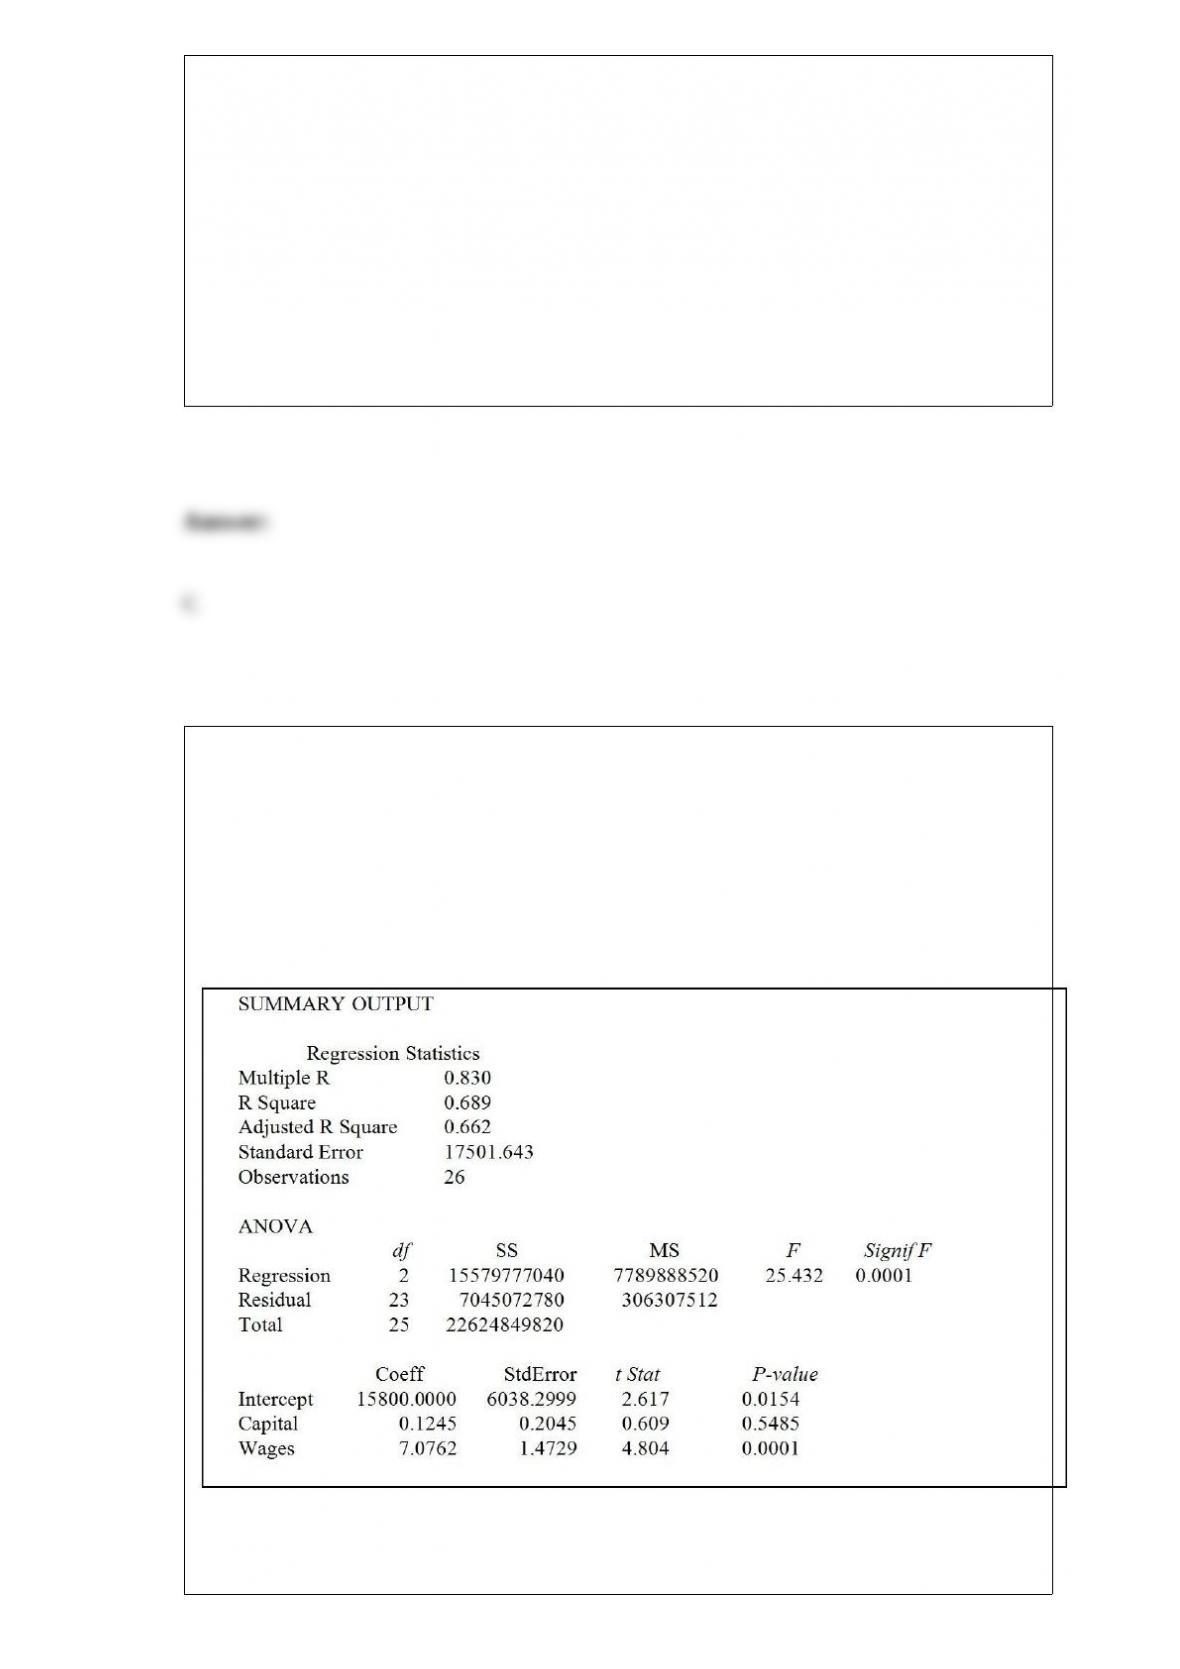
Referring to Table 14-5, which of the independent variables in the model are significant
at the 5% level?
TABLE 14-5
A microeconomist wants to determine how corporate sales are influenced by capital and
wage spending by companies. She proceeds to randomly select 26 large corporations
and record information in millions of dollars. The Microsoft Excel output below shows
results of this multiple regression.
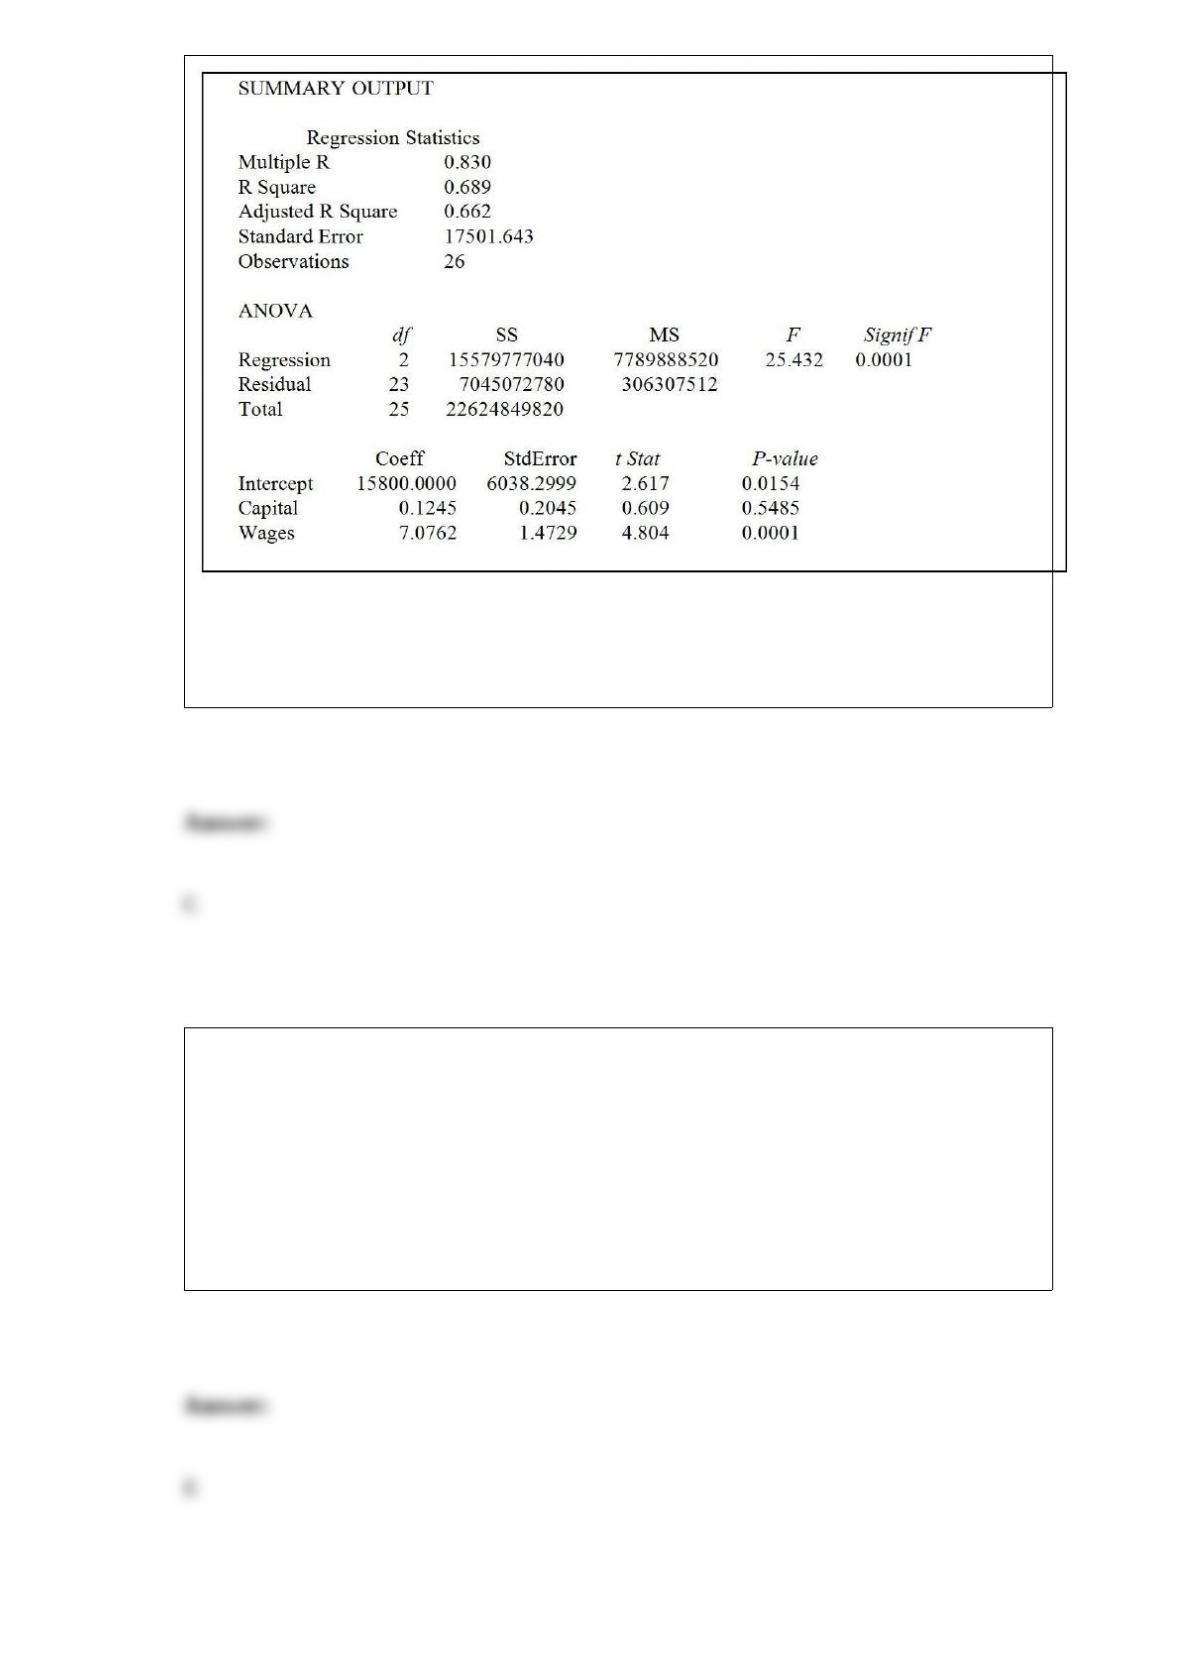
A) Capital, Wages
B) Capital
C) Wages
D) None of the above
Maintaining the gains that have been made with a revised process in the long term by
avoiding potential problems that can occur when a process is changed involves which
part of the DMAIC process?
A) Define
B) Measure
C) Analyze
D) Improve
E) Control
A company that manufactures designer jeans is contemplating whether to increase its
advertising budget by $1 million for next year. If the expanded advertising campaign is
successful, the company expects sales to increase by $1.6 million next year. If the
advertising campaign fails, the company expects sales to increase by only $400,000
next year. If the advertising budget is not increased, the company expects sales to
increase by $200,000. Identify the outcomes in this decision-making problem.
A) Two choices: <1> increase the budget and <2> do not increase the budget.
B) Two possibilities: <1> campaign is successful and <2> campaign is not successful.
C) Four consequences resulting from the Increase/Do Not Increase and Successful/Not
Successful combinations.
D) The increase in sales dollars next year.
Referring to Table 14-5, what is the p-value for testing whether Wages have a positive
impact on corporate sales?
TABLE 14-5
A microeconomist wants to determine how corporate sales are influenced by capital and
wage spending by companies. She proceeds to randomly select 26 large corporations
and record information in millions of dollars. The Microsoft Excel output below shows
results of this multiple regression.
A) 0.01
B) 0.05
C) 0.0001
D) 0.00005
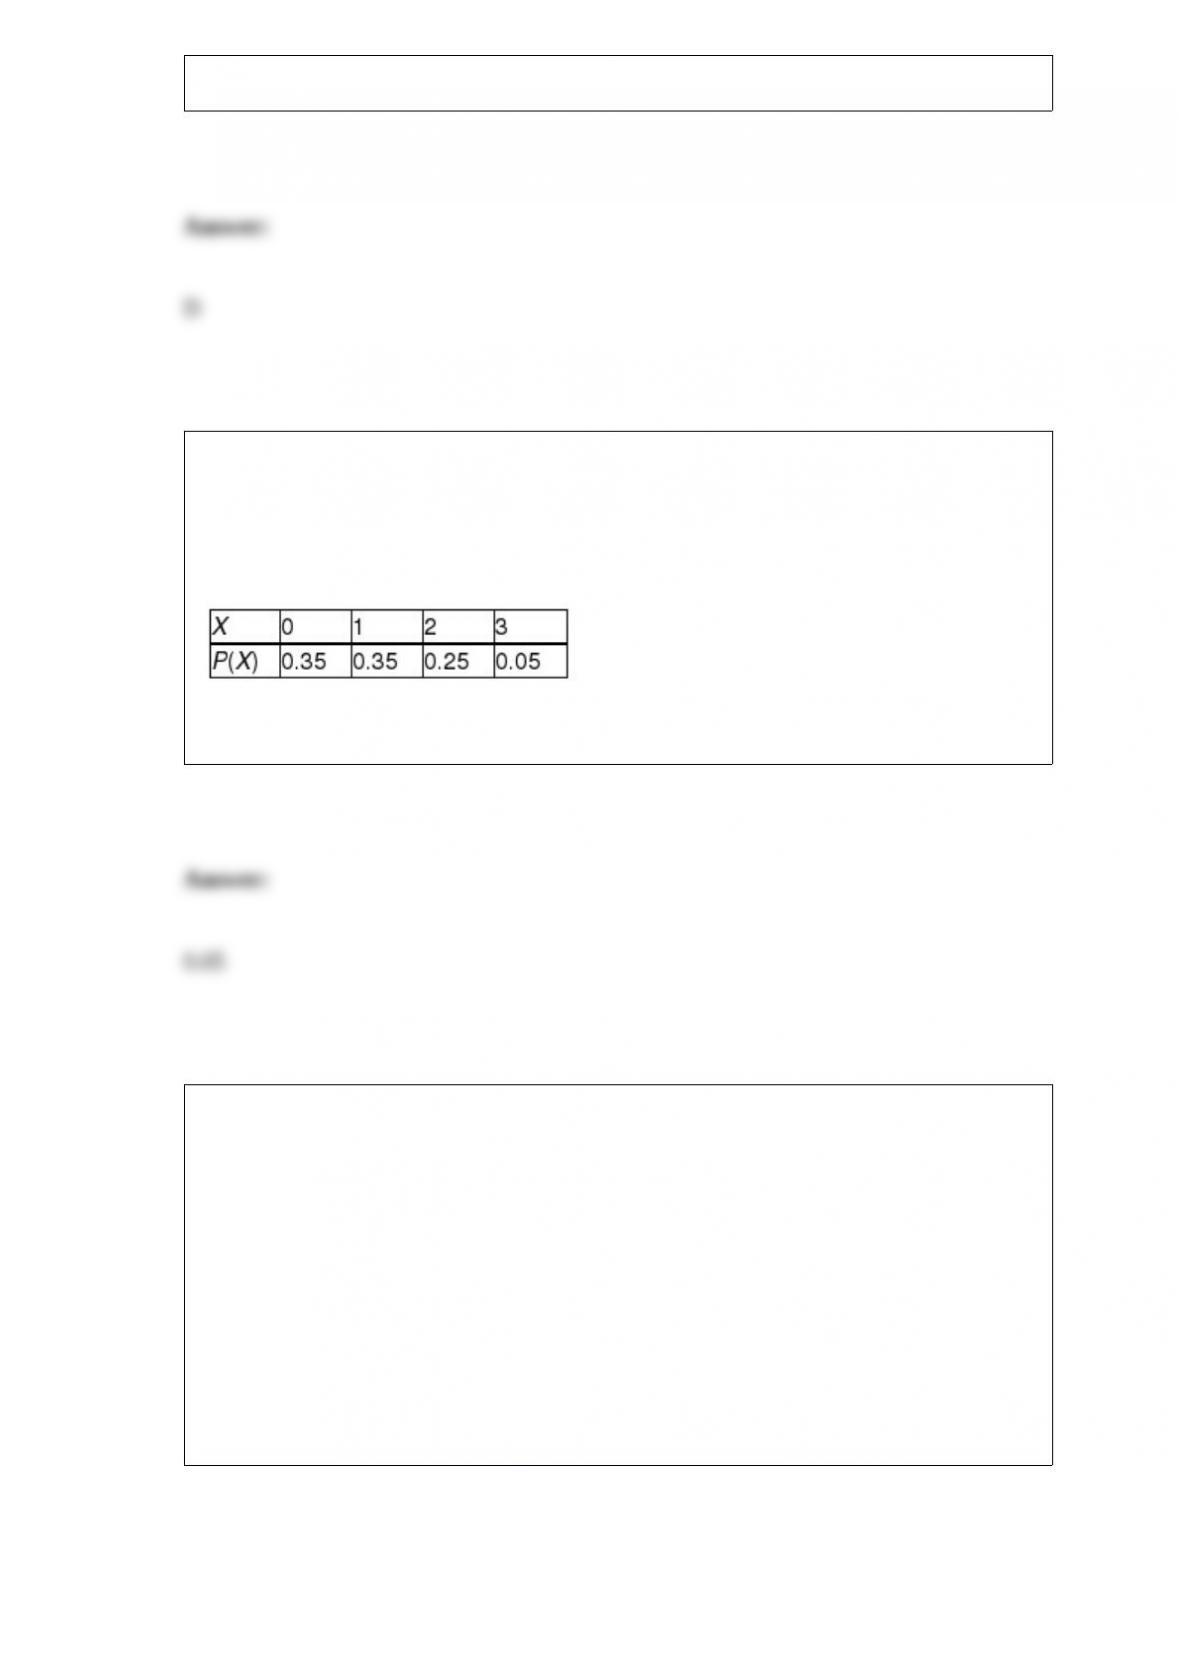
TABLE 5-3
The following table contains the probability distribution for X = the number of
retransmissions necessary to successfully transmit a 1024K data package through a
double satellite media.
Referring to Table 5-3, the probability of at least one retransmission is ________.
TABLE 11-7
A campus researcher wanted to investigate the factors that affect visitor travel time in a
complex, multilevel building on campus. Specifically, he wanted to determine whether
different building signs (building maps versus wall signage) affect the total amount of
time visitors require to reach their destination and whether that time depends on
whether the starting location is inside or outside the building. Three subjects were
assigned to each of the combinations of signs and starting locations, and travel time in
seconds from beginning to destination was recorded. An Excel output of the appropriate
analysis is given below:
ANOVA
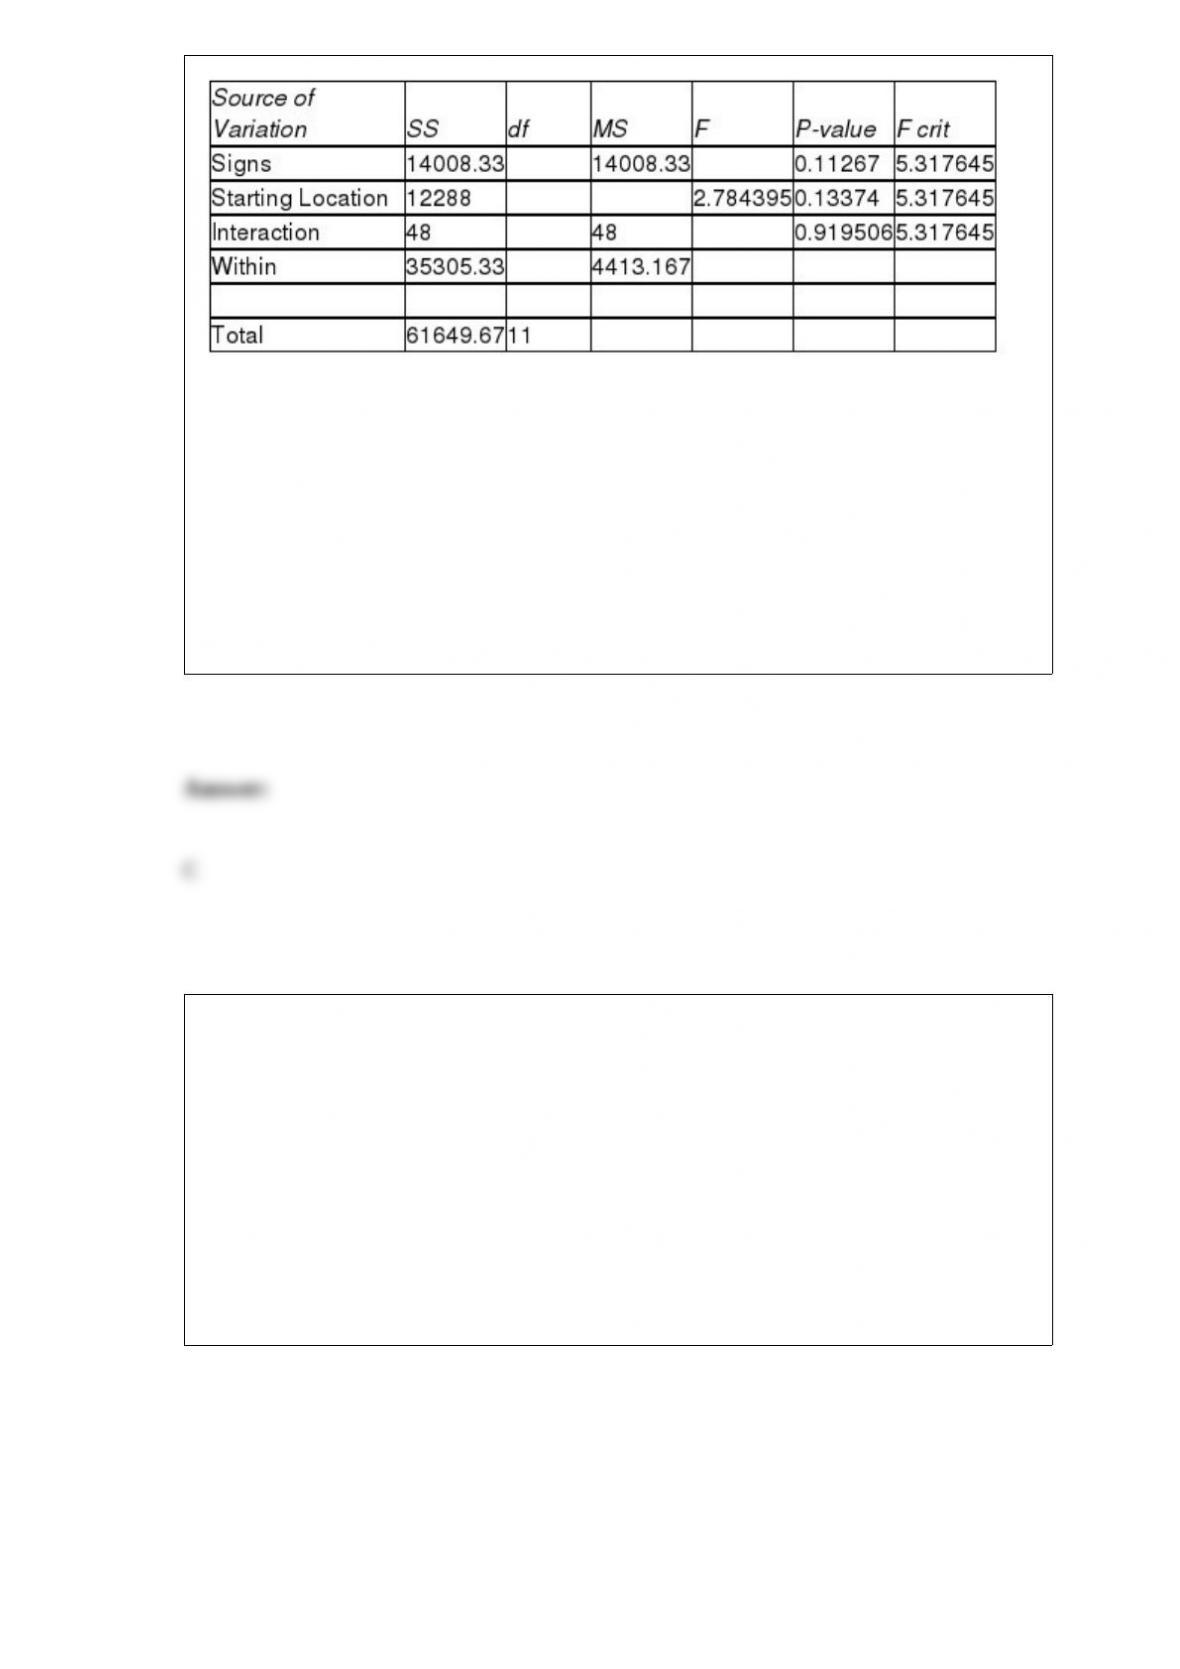
Referring to Table 11-7, the F test statistic for testing the main effect of types of signs is
A) 0.0109.
B) 2.7844.
C) 3.1742.
D) 5.3176.
TABLE 17-12
The marketing manager for a nationally franchised lawn service company would like to
study the characteristics that differentiate home owners who do and do not have a lawn
service. A random sample of 30 home owners located in a suburban area near a large
city was selected; 15 did not have a lawn service (code 0) and 15 had a lawn service
(code 1). Additional information available concerning these 30 home owners includes
family income (Income, in thousands of dollars), lawn size (Lawn Size, in thousands of
square feet), attitude toward outdoor recreational activities (Attitude 0 = unfavorable, 1
= favorable), number of teenagers in the household (Teenager), and age of the head of
the household (Age).
The Minitab output is given below:
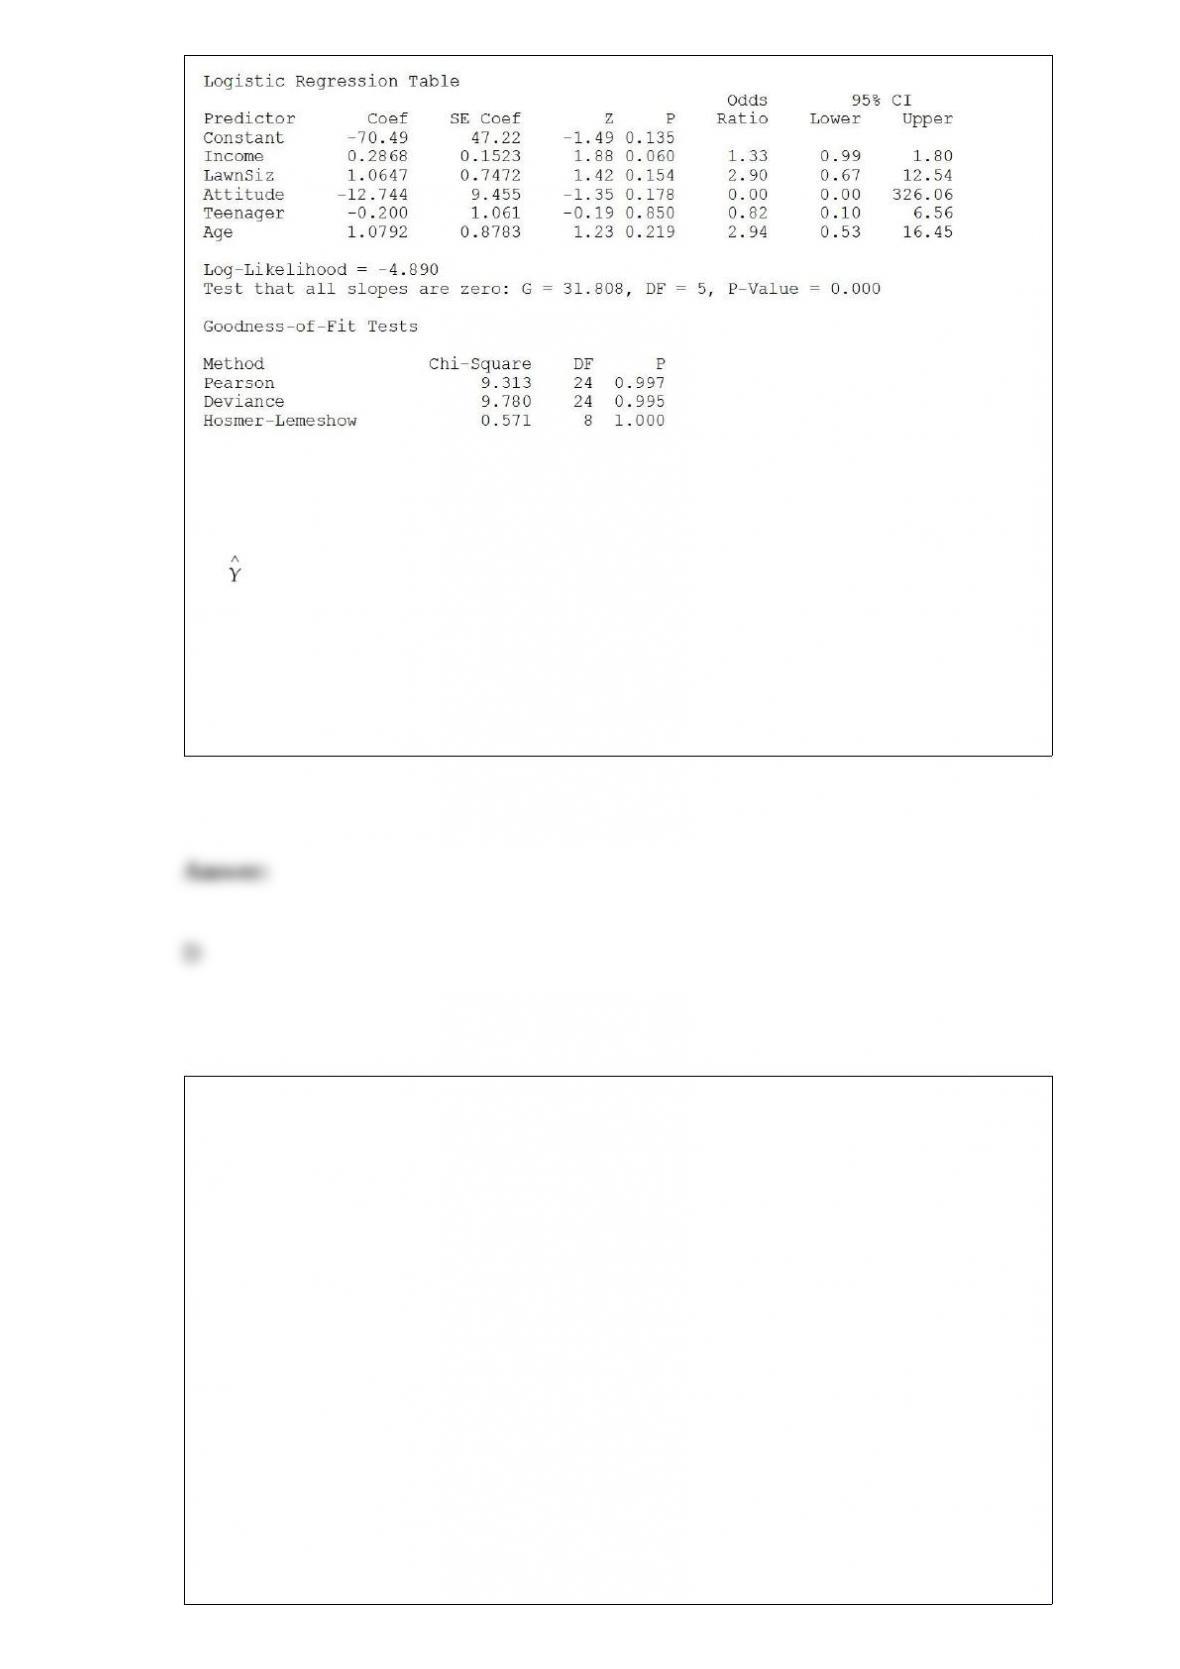
Referring to Table 17-12, which of the following is the correct expression for the
estimated model?
A) Y = -70.49 + 0.268 Income + 1.0647 LawnSize – 12.744 Attitude – 0.200 Teenager +
1.0792 Age
B) = -70.49 + 0.268 Income + 1.0647 LawnSize – 12.744 Attitude – 0.200 Teenager +
1.0792 Age
C) ln (odds ratio) = -70.49 + 0.268 Income + 1.0647 LawnSize – 12.744 Attitude – 0.200
Teenager + 1.0792 Age
D) ln (estimated odds ratio) = -70.49 + 0.268 Income + 1.0647 LawnSize – 12.744
Attitude – 0.200 Teenager + 1.0792 Age
A physician and president of a Tampa Health Maintenance Organization (HMO) are
attempting to show the benefits of managed health care to an insurance company. The
physician believes that certain types of doctors are more cost-effective than others. To
investigate this, the president obtained independent random samples of 20 HMO
physicians from each of 4 primary specialties – General Practice (GP), Internal
Medicine (IM), Pediatrics (PED), and Family Physicians (FP) – and recorded the total
charges per member per month for each. A second variable which the president believes
influences total charges per member per month is whether the doctor is a foreign or
USA medical school graduate. To investigate this, the president also collected data on
20 foreign medical school graduates in each of the 4 primary specialty types described
above. Altogether, information on charges for 40 doctors (20 foreign and 20 USA
medical school graduates) was obtained for each of the 4 specialties. The president has
already found out that specialty types and origin of the medical degree do not interact to
affect the charges. He has also found out special types do have an impact on average
charges. Which of the following tests will be the most appropriate to find out which
primary specialty has the highest charges?
A) Tukey-Kramer multiple comparisons procedure for one-way ANOVA

B) Tukey multiple comparisons procedure for two-way ANOVA
C) Two-way ANOVA F test for primary specialty effect
D) Two-way ANOVA F test for origin of the medical degree effect
According to a survey of American households, the probability that the residents own 2
cars if annual household income is over $50,000 is 80%. Of the households surveyed,
60% had incomes over $50,000 and 70% had 2 cars. The probability that the residents
of a household own 2 cars and have an income over $50,000 a year is
A) 0.12.
B) 0.18.
C) 0.22.
D) 0.48.
Referring to Table 14-7, the predicted GPA for a student carrying 15
course units and who has a total SAT of 1,100 is ________.
TABLE 14-7
The department head of the accounting department wanted to see if
she could predict the GPA of students using the number of course
units (credits) and total SAT scores of each. She takes a sample of
students and generates the following Microsoft Excel output:

TABLE 5-8
Two different designs on a new line of winter jackets for the coming winter are
available for your manufacturing plants. Your profit (in thousands of dollars) will
depend on the taste of the consumers when winter arrives. The probability of the three
possible different tastes of the consumers and the corresponding profits are presented in
the following table.
Referring to Table 5-8, if your investment preference is to maximize your expected
profit and not worry at all about the risk that you have to take, will you choose a
production mix that will consist of 10%, 30%, 50%, 70%, or 90% of your production
lines for Design A and the remaining for Design B?
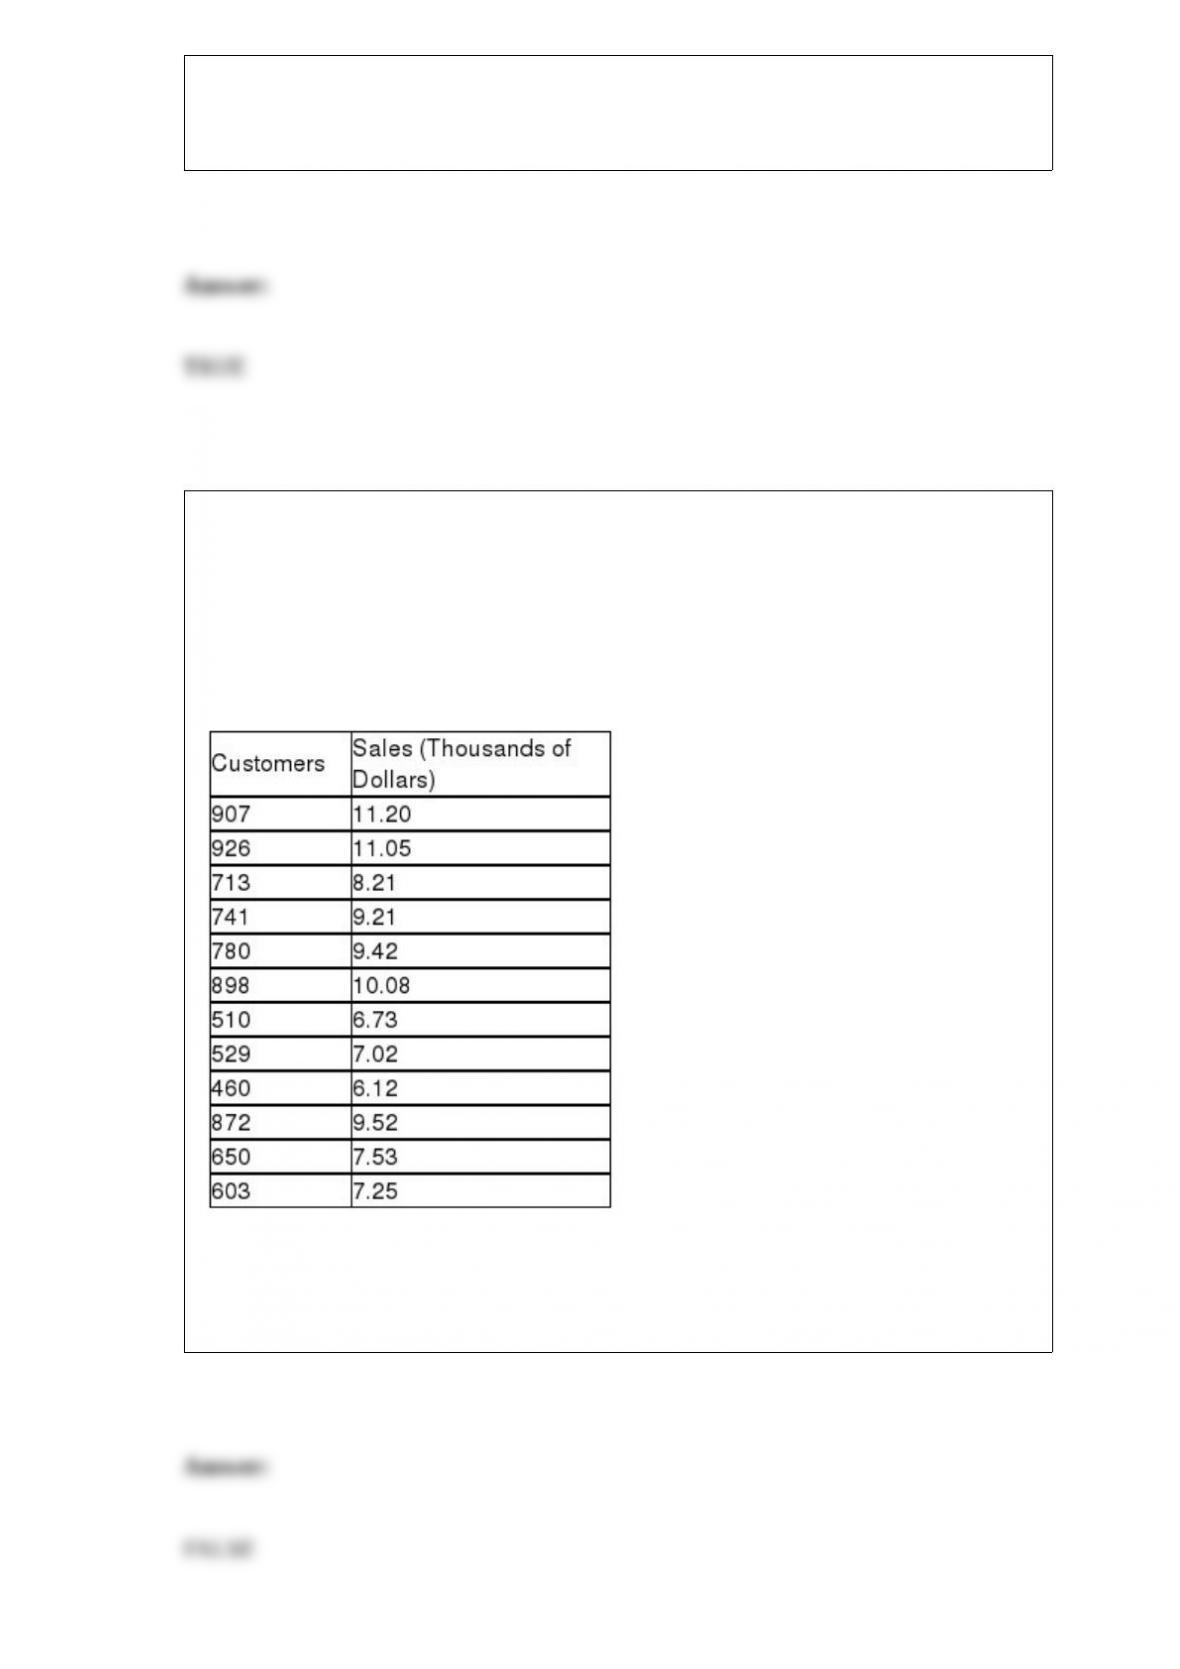
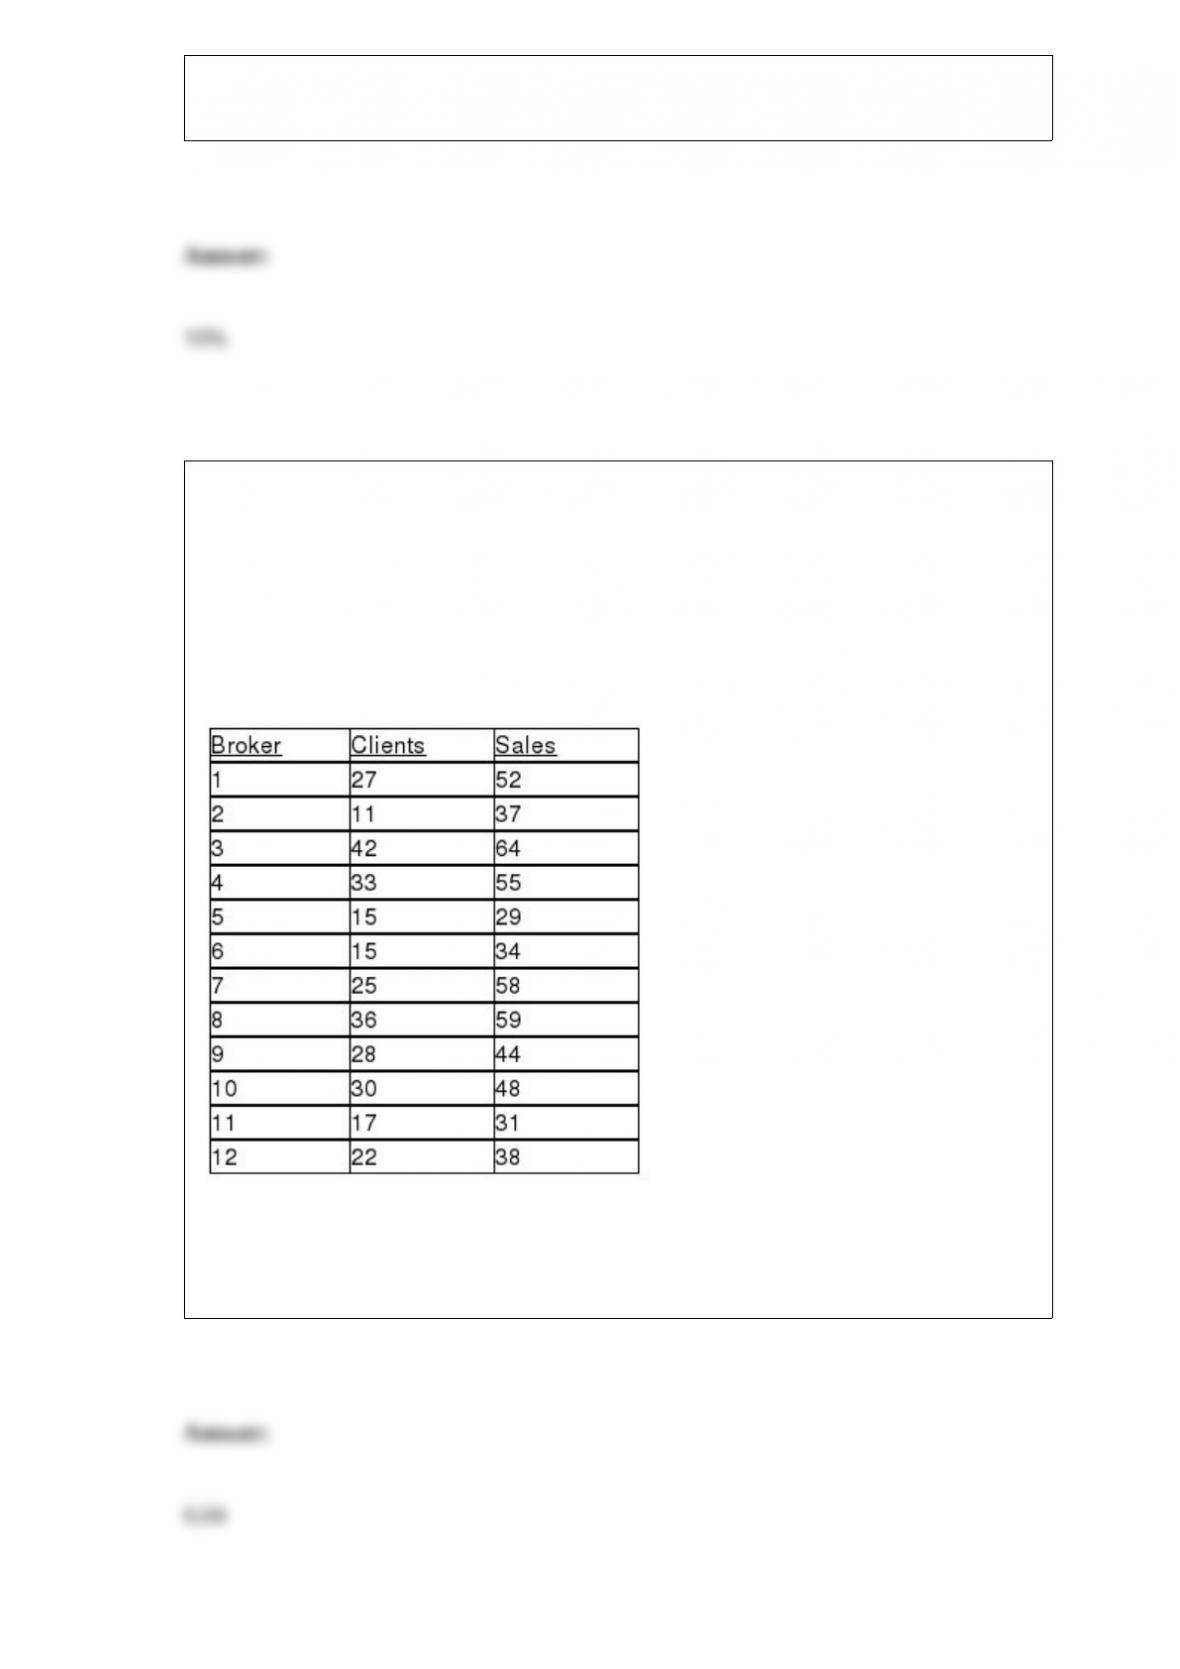
TABLE 13-4
The managers of a brokerage firm are interested in finding out if the number of new
clients a broker brings into the firm affects the sales generated by the broker. They
sample 12 brokers and determine the number of new clients they have enrolled in the
last year and their sales amounts in thousands of dollars. These data are presented in the
table that follows.
Referring to Table 13-4, the managers of the brokerage firm wanted to test the
hypothesis that the number of new clients brought in had a positive impact on the
amount of sales generated. The value of the test statistic is ________.

TABLE 9-12
A drug company is considering marketing a new local anesthetic. The effective time of
the anesthetic the drug company is currently producing has a normal distribution with a
mean of 7.4 minutes with a standard deviation of 1.2 minutes. The chemistry of the new
anesthetic is such that the effective time should be normally distributed with the same
standard deviation. The company will market the new local anesthetic as being better if
there is evidence that the population mean effective time is greater than the 7.4 minutes
of the current local anesthetic.
Referring to Table 9-12, if you select a sample of 25 new local anesthetics and are
willing to have a level of significance of 0.01, the probability of the company not
marketing the new local anesthetic when its population mean effective time is not
greater than the 7.4 minutes is ________.
Referring to Table 14-18, what is the estimated probability that a
school with a mean SAT score of 1250 and a TOEFL criterion that is at
least 90?
TABLE 14-18
A logistic regression model was estimated in order to predict the
probability that a randomly chosen university or college would be a
private university using information on mean total Scholastic Aptitude
Test score (SAT) at the university or college and whether the TOEFL
criterion is at least 90 (Toe90 = 1 if yes, 0 otherwise). The
dependent variable, Y, is school type (Type = 1 if private and 0
otherwise).
The PHStat output is given below:

TABLE 6-3
Suppose the time interval between two consecutive defective light bulbs from a
production line has a uniform distribution over an interval from 0 to 90 minutes.
Referring to Table 6-3, what is the probability that the time interval between two
consecutive defective light bulbs will be between 10 and 35 minutes?
As an aid to the establishment of personnel requirements, the director of a hospital
wishes to estimate the mean number of people who are admitted to the emergency room
during a 24-hour period. The director randomly selects 64 different 24-hour periods and
determines the number of admissions for each. For this sample, = 396 and S = 100.
Using the sample standard deviation as an estimate for the population standard
deviation, what size sample should the director choose if she wishes to estimate the
mean number of admissions per 24-hour period to within 1 admission with 99%
reliability?

TABLE 8-10
A sales and marketing management magazine conducted a survey on salespeople
cheating on their expense reports and other unethical conduct. In the survey on 200
managers, 58% of the managers have caught salespeople cheating on an expense report,
50% have caught salespeople working a second job on company time, 22% have caught
salespeople listing a ‘strip bar” as a restaurant on an expense report, and 19% have
caught salespeople giving a kickback to a customer.
Referring to Table 8-10, the sampling error of a 95% confidence interval estimate of the
population proportion of managers who have caught salespeople working a second job
on company time is ________.
TABLE 6-2
John has two jobs. For daytime work at a jewelry store he is paid $15,000 per month,
plus a commission. His monthly commission is normally distributed with a mean of
$10,000 and a standard deviation of $2,000. At night he works occasionally as a waiter,
for which his monthly income is normally distributed with a mean of $1,000 and a
standard deviation of $300. John’s income levels from these two sources are
independent of each other.
Referring to Table 6-2, for a given month, what is the probability that John’s income as
a waiter is between $1,200 and $1,600?