
True or False: If P(A or B) = 1.0, then A and B must be mutually exclusive.
TABLE 8-8
The president of a university would like to estimate the proportion of the student
population that owns a personal computer. In a sample of 500 students, 417 own a
personal computer.
True or False: Referring to Table 8-8, it is possible that the 99% confidence interval
calculated from the data will not contain the sample proportion of students who own a
personal computer.
TABLE 14-15
The superintendent of a school district wanted to predict the
percentage of students passing a sixth-grade proficiency test. She
obtained the data on percentage of students passing the proficiency
test (% Passing), mean teacher salary in thousands of dollars
(Salaries), and instructional spending per pupil in thousands of dollars
(Spending) of 47 schools in the state.
Following is the multiple regression output with Y = % Passing as the
dependent variable, X1 = Salaries and X2 = Spending:

True or False: Referring to Table 14-15, there is suffcient evidence
that mean teacher salary has an e.ect on percentage of students
passing the proficiency test while holding constant the e.ect of
instructional spending per pupil at a 5% level of significance.
TABLE 9-1
Microsoft Excel was used on a set of data involving the number of defective items
found in a random sample of 46 cases of light bulbs produced during a morning shift at
a plant. A manager wants to know if the mean number of defective bulbs per case is
greater than 20 during the morning shift. She will make her decision using a test with a
level of significance of 0.10. The following information was extracted from the
Microsoft Excel output for the sample of 46 cases:
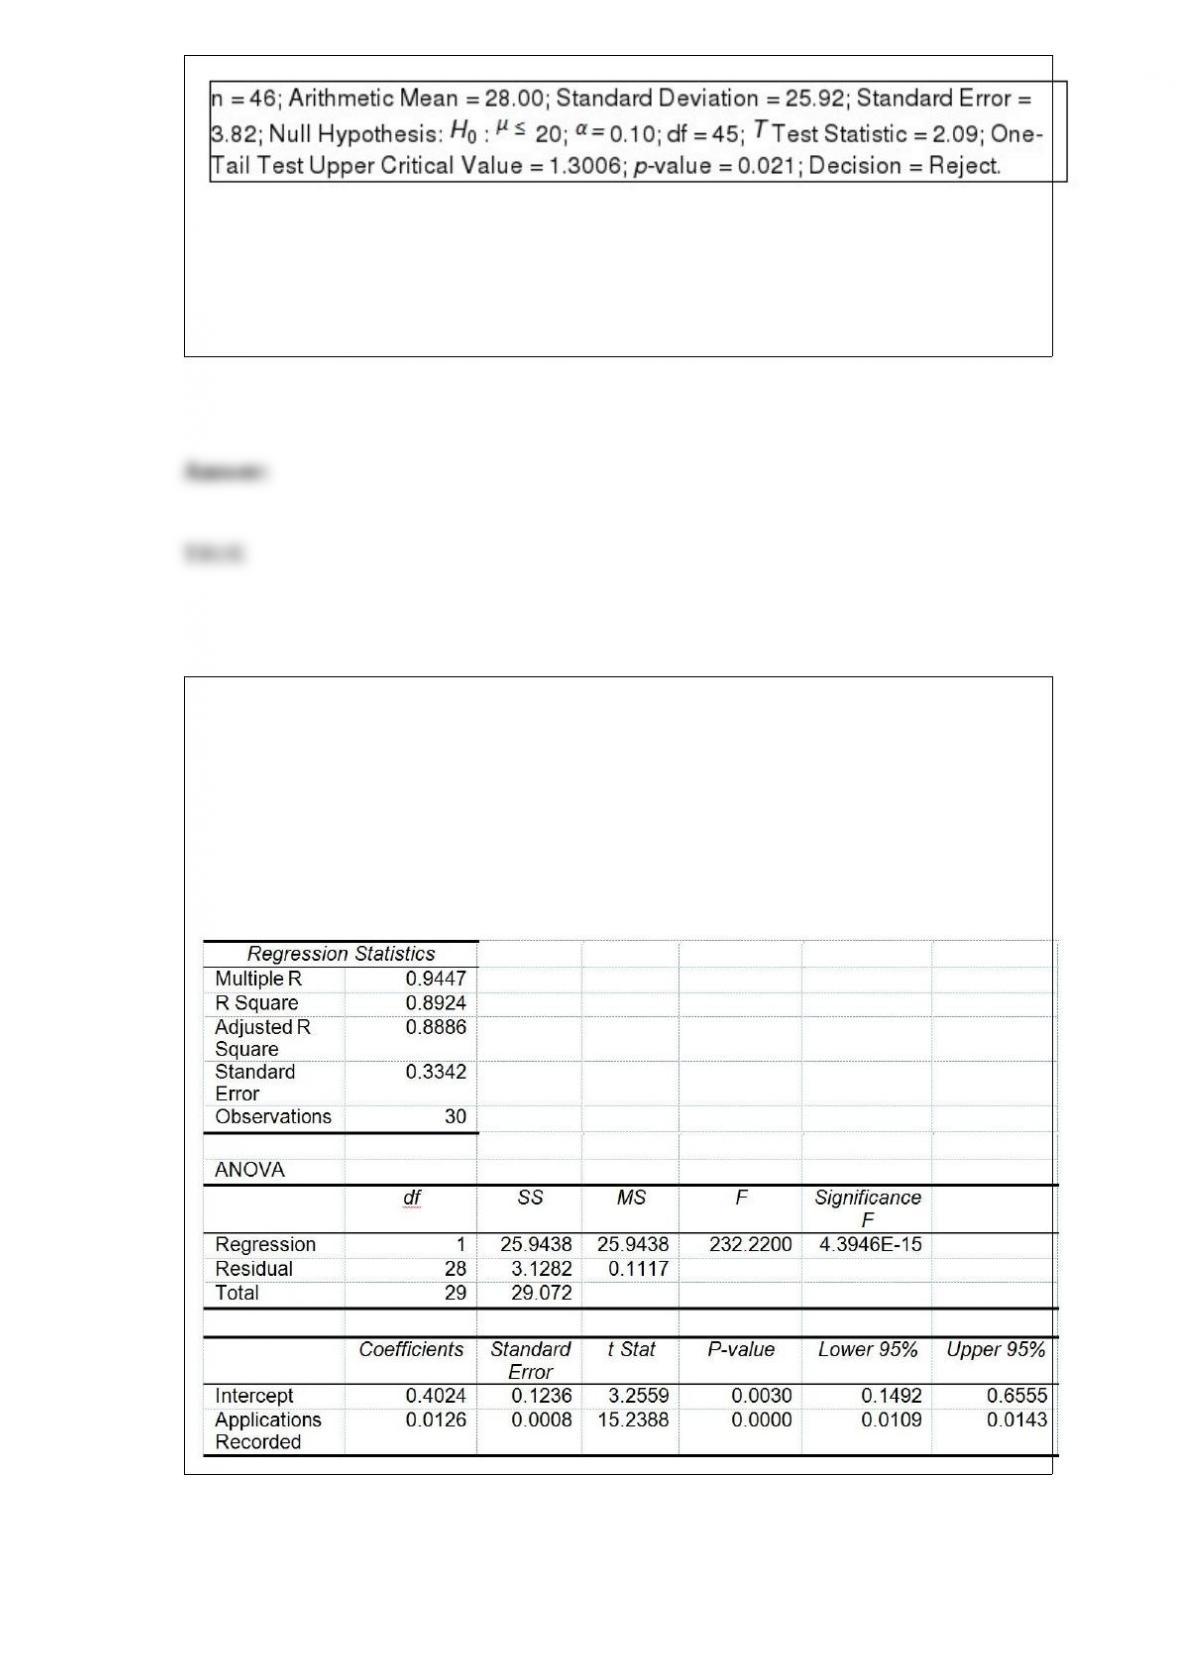
True or False: Referring to Table 9-1, the manager can conclude that there is sufficient
evidence to show that the mean number of defective bulbs per case is greater than 20
during the morning shift with no more than a 5% probability of incorrectly rejecting the
true null hypothesis.
TABLE 13-12
The manager of the purchasing department of a large saving and loan organization
would like to develop a model to predict the amount of time (measured in hours) it
takes to record a loan application. Data are collected from a sample of 30 days, and the
number of applications recorded and completion time in hours is recorded. Below is the
regression output:
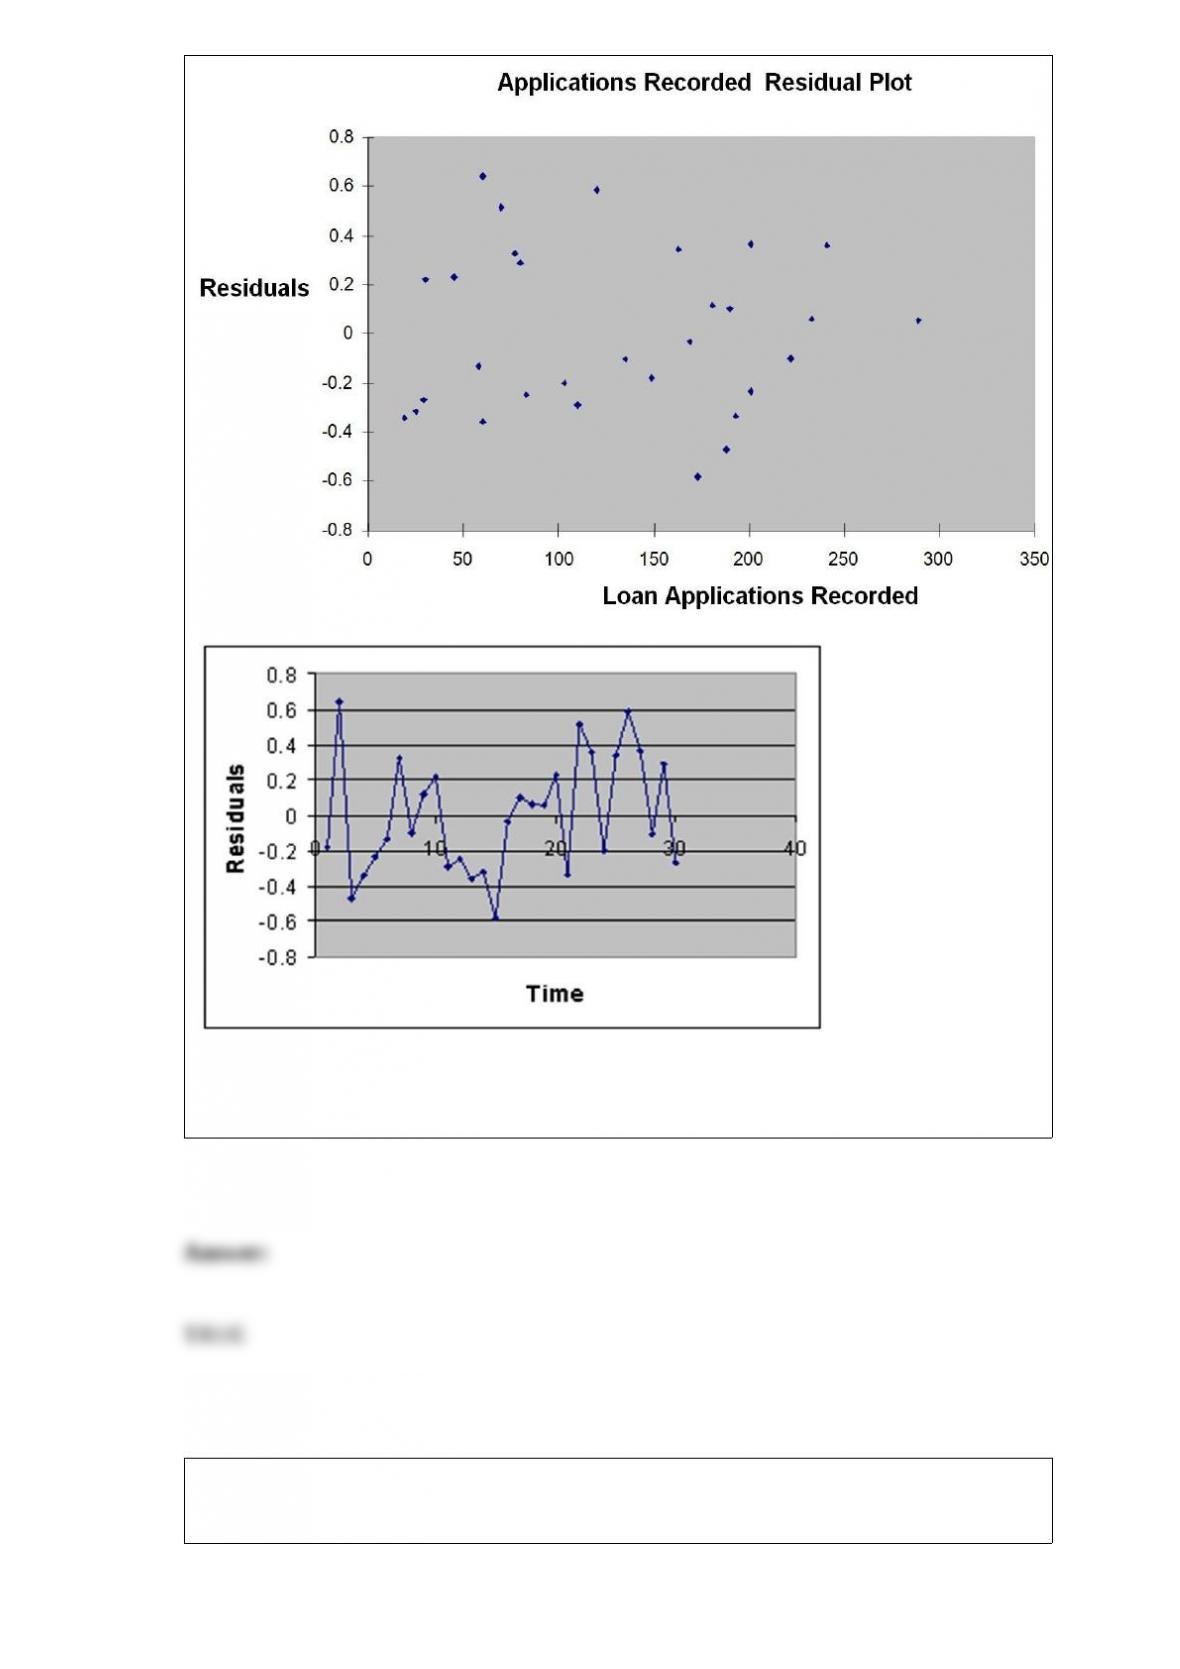
True or False: Referring to Table 13-12, there is no evidence of positive autocorrelation
if the Durbin-Watson test statistic is found to be 1.78.
True or False: The chi-square test of independence requires that the expected frequency
in each cell to be at least 5.

True or False: The question: “How much did you earn last year rounded to the nearest
hundreds of dollars?” will most likely result in measurement error.
TABLE 12-20
A filling machine at a local soft drinks company is calibrated to fill the cans at a mean
amount of 12 fluid ounces and a standard deviation of 0.5 ounces. The company wants
to test whether the standard deviation of the amount filled by the machine is 0.5 ounces.
A random sample of 15 cans filled by the machine reveals a standard deviation of 0.67
ounces.
True or False: Referring to Table 12-20, the decision is to reject the null hypothesis
when using a 5% level of significance.
True or False: TABLE 17-9
What are the factors that determine the acceleration time (in sec.) from 0 to 60 miles per
hour of a car? Data on the following variables for 171 different vehicle models were
collected:
Accel Time: Acceleration time in sec.
Cargo Vol: Cargo volume in cu. ft.
HP: Horsepower
MPG: Miles per gallon
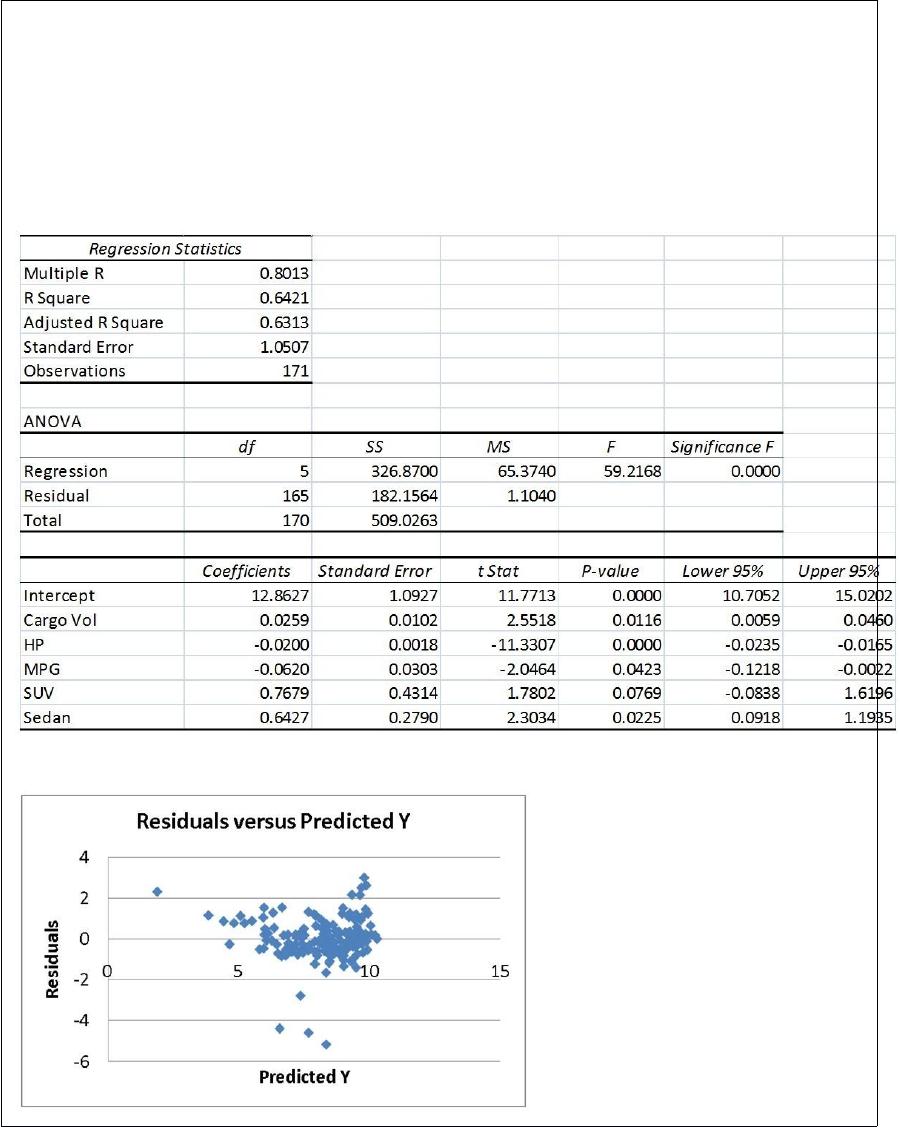
SUV: 1 if the vehicle model is an SUV with Coupe as the base when SUV and Sedan
are both 0
Sedan: 1 if the vehicle model is a sedan with Coupe as the base when SUV and Sedan
are both 0
The regression results using acceleration time as the dependent variable and the
remaining variables as the independent variables are presented below.
The various residual plots are as shown below.
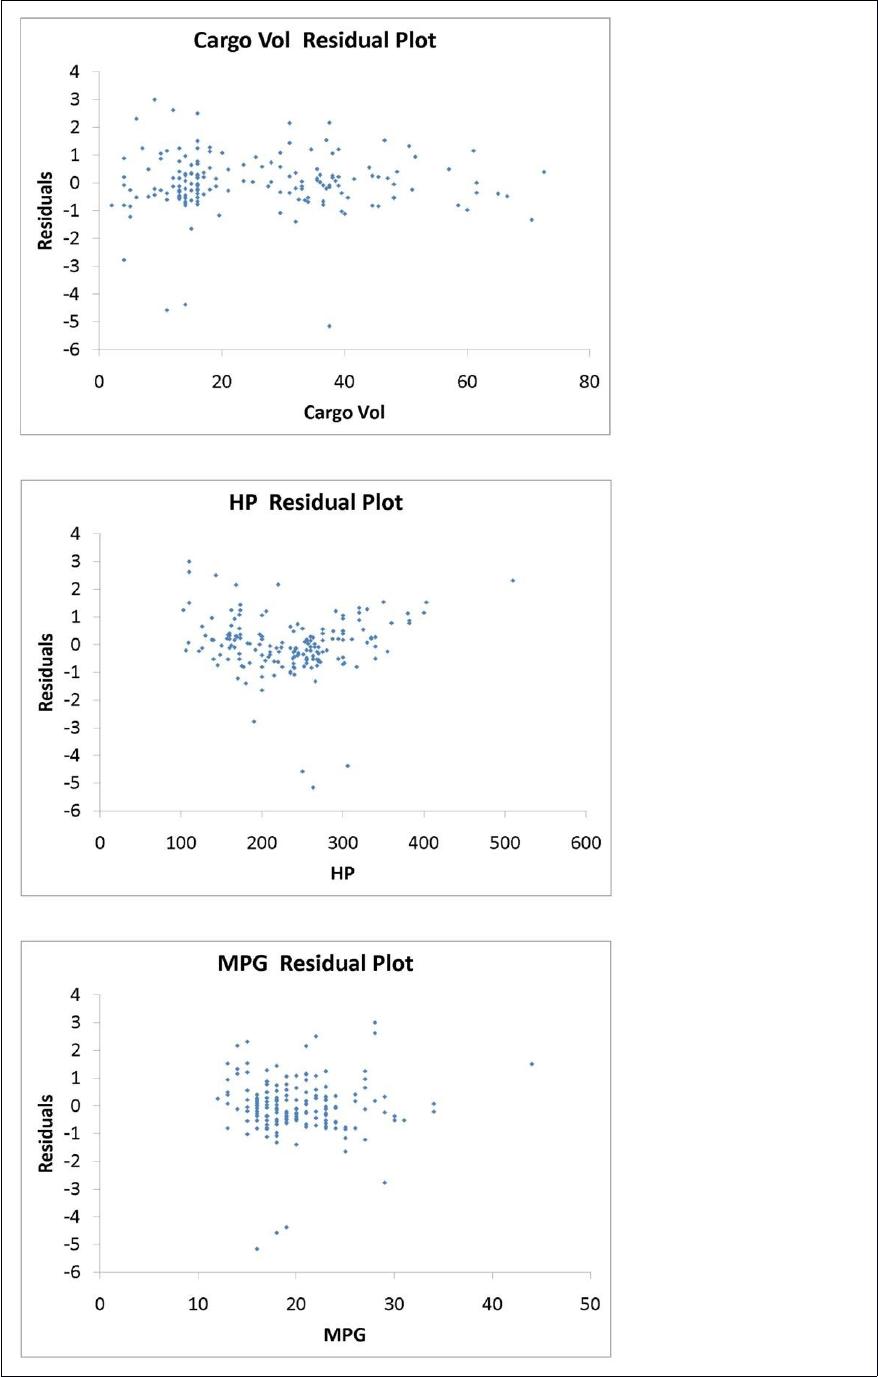
The coefficient of partial determination ( ) of each of the 5
predictors are, respectively, 0.0380, 0.4376, 0.0248, 0.0188, and 0.0312.
The coefficient of multiple determination for the regression model using each of the 5
variables Xj as the dependent variable and all other X variables as independent variables
( ) are, respectively, 0.7461, 0.5676, 0.6764, 0.8582, 0.6632.
Referring to Table 17-9, the 0 to 60 miles per hour acceleration time of a sedan is
predicted to be 0.7679 seconds higher than that of an SUV.
True or False: Suppose, in testing a hypothesis about a mean, the p-value is computed
to be 0.034. The null hypothesis should be rejected if the chosen level of significance is
0.01.
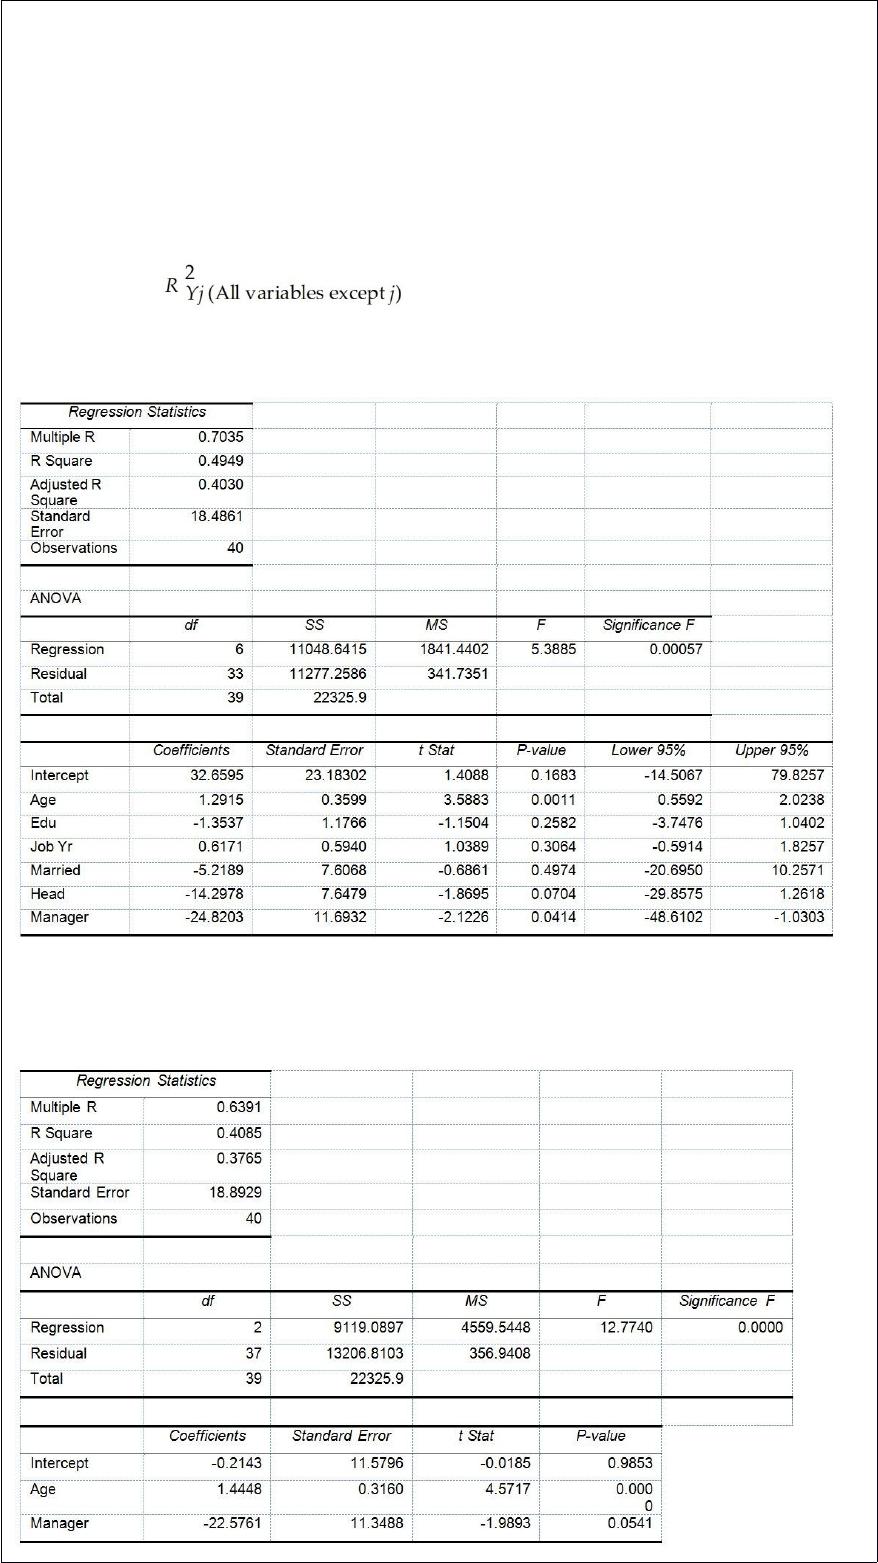
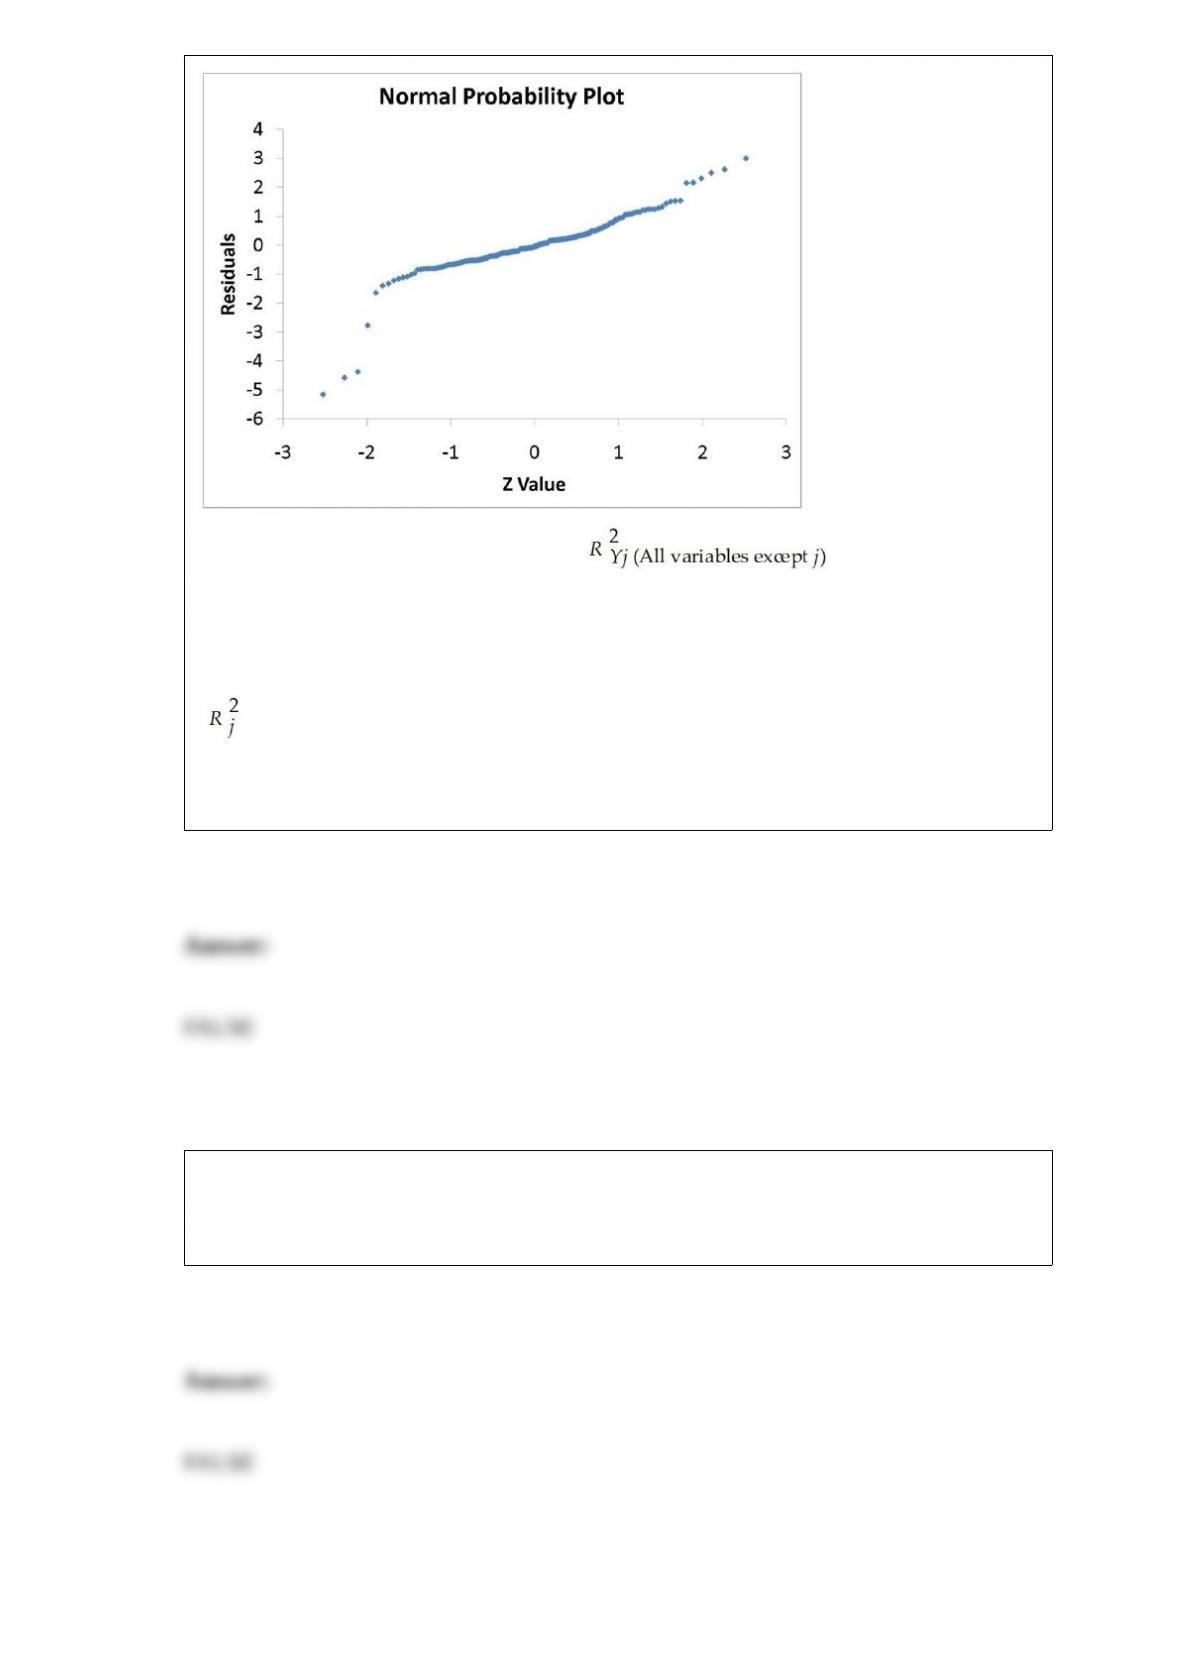
True or False: TABLE 17-10
Given below are results from the regression analysis where the dependent variable is
the number of weeks a worker is unemployed due to a layoff (Unemploy) and the
independent variables are the age of the worker (Age), the number of years of education
received (Edu), the number of years at the previous job (Job Yr), a dummy variable for
marital status (Married: 1 = married, 0 = otherwise), a dummy variable for head of
household (Head: 1 = yes, 0 = no) and a dummy variable for management position
(Manager: 1 = yes, 0 = no). We shall call this Model 1. The coefficient of partial
determination ( ) of each of the 6 predictors are, respectively,
0.2807, 0.0386, 0.0317, 0.0141, 0.0958, and 0.1201.
Model 2 is the regression analysis where the dependent variable is Unemploy and the
independent variables are Age and Manager. The results of the regression analysis are
given below:
Referring to Table 17-10, Model 1, the alternative hypothesis H1 : At least one of βj â
‰ 0 for j = 1, 2, 3, 4, 5, 6 implies that the number of weeks a worker is unemployed
due to a layoff is related to all of the explanatory variables.
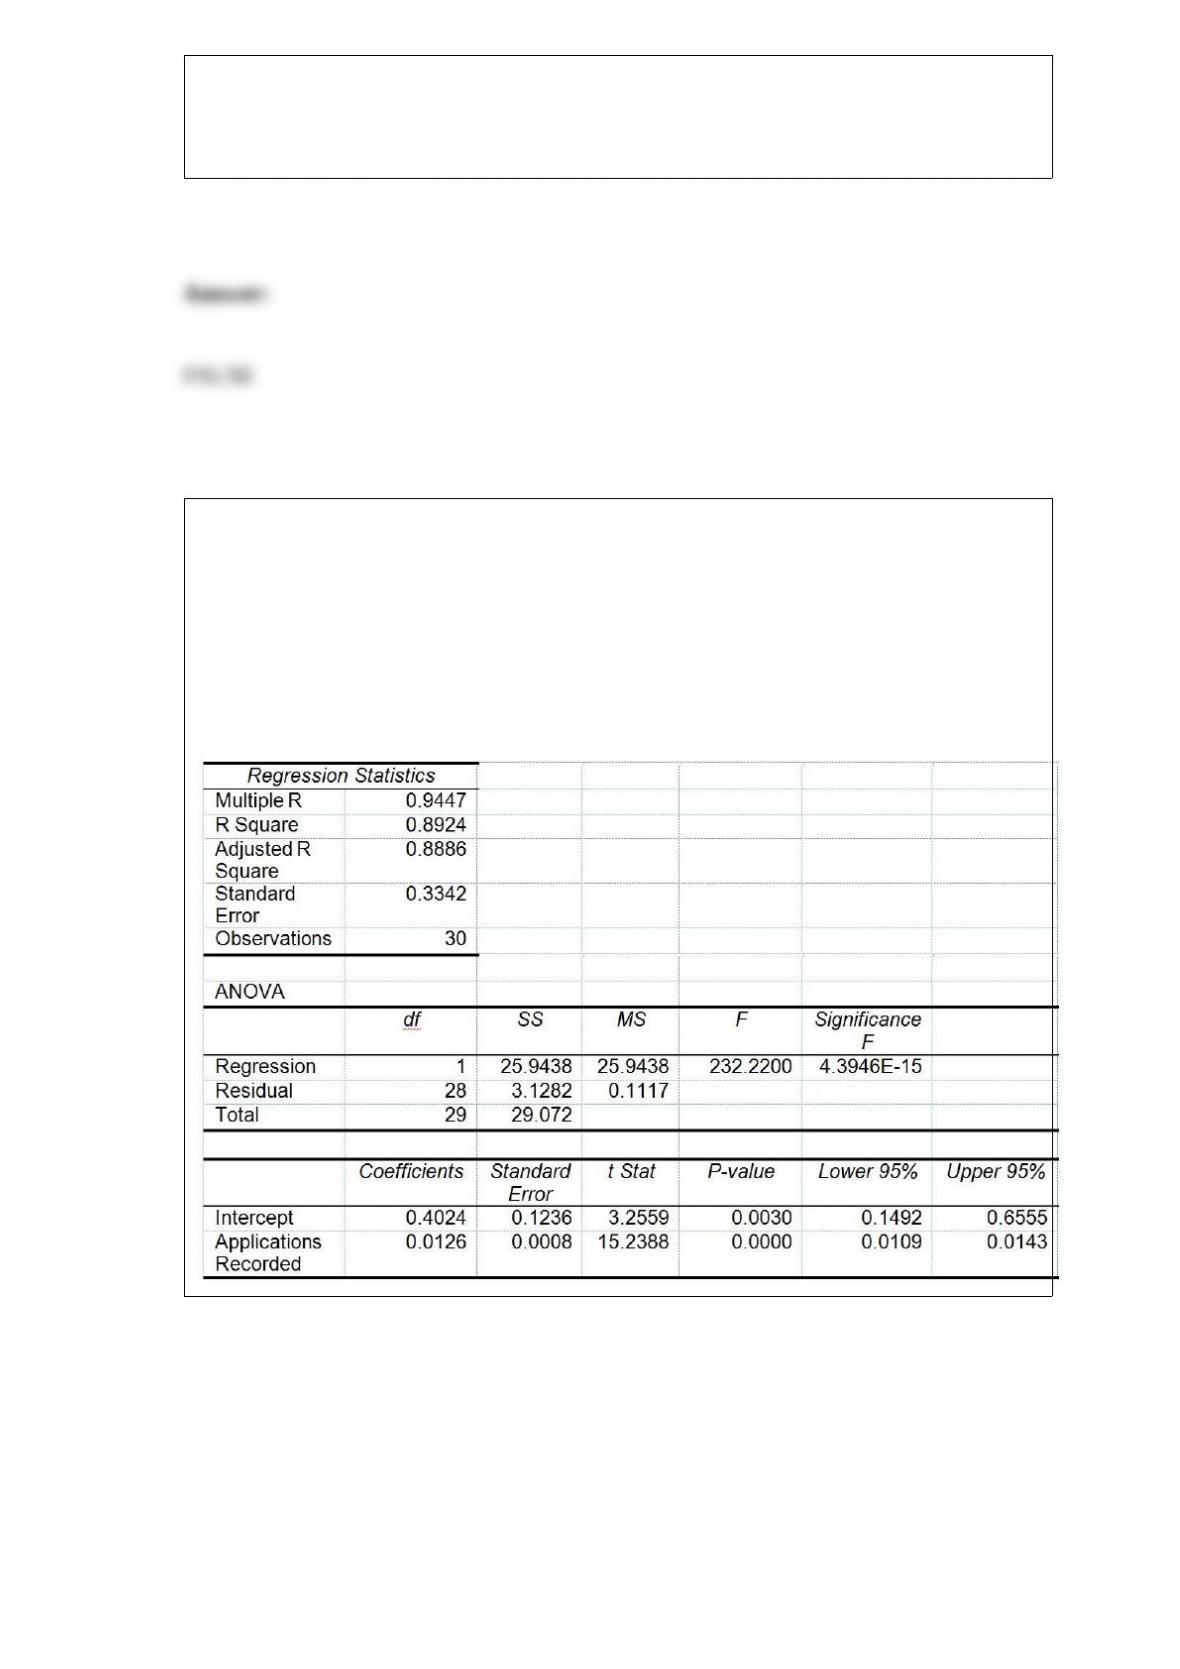
TABLE 13-12
The manager of the purchasing department of a large saving and loan organization
would like to develop a model to predict the amount of time (measured in hours) it
takes to record a loan application. Data are collected from a sample of 30 days, and the
number of applications recorded and completion time in hours is recorded. Below is the
regression output:
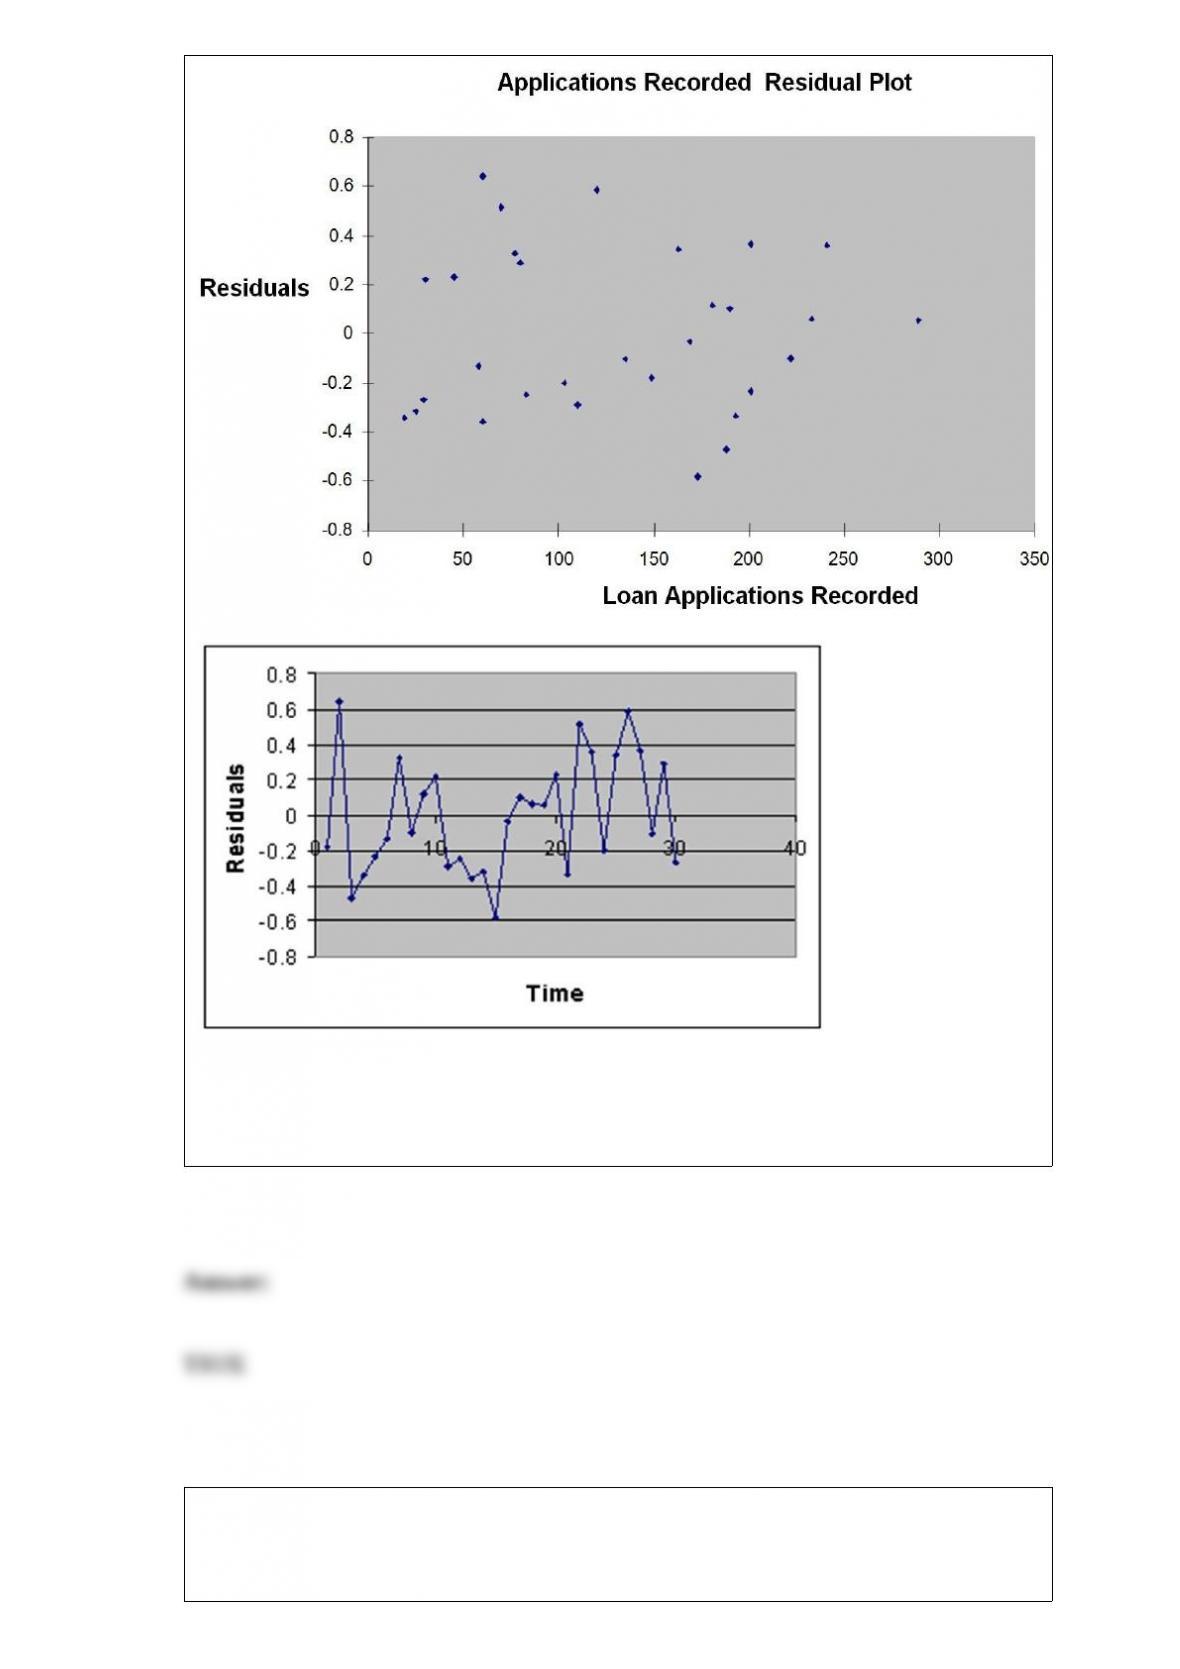
True or False: Referring to Table 13-12, there is sufficient evidence that the amount of
time needed linearly depends on the number of loan applications at a 1% level of
significance.
TABLE 9-8
One of the biggest issues facing e-retailers is the ability to turn browsers into buyers.

This is measured by the conversion rate, the percentage of browsers who buy something
in their visit to a site. The conversion rate for a company’s website was 10.1%. The
website at the company was redesigned in an attempt to increase its conversion rates. A
sample of 200 browsers at the redesigned site was selected. Suppose that 24 browsers
made a purchase. The company officials would like to know if there is evidence of an
increase in conversion rate at the 5% level of significance.
True or False: Referring to Table 9-8, the company officials can conclude that there is
sufficient evidence that the conversion rate at the company’s website has increased
using a level of significance of 0.05.
True or False: If A and B cannot occur at the same time they are called mutually
exclusive.
True or False: A statistics professor wanted to test whether the grades on a statistics test
were the same for upper and lower classmen. The professor took a random sample size
of 10 from each, conducted a test and found out that the variances were equal. For this
situation, the professor should use a t test with independent samples.
The finite population correction factor is
A) .
B) .
C) .
D) .
If we know that the length of time it takes a college student to find a parking spot in the
library parking lot follows a normal distribution with a mean of 3.5 minutes and a
standard deviation of 1 minute, find the probability that a randomly selected college
student will take between 2 and 4.5 minutes to find a parking spot in the library parking
lot.
A) 0.0919
B) 0.2255
C) 0.4938
D) 0.7745
The covariance
A) must be between -1 and +1.
B) must be positive.
C) can be positive or negative.
D) must be less than +1.
Referring to Table 14-4, which of the following values for the level of significance is
the smallest for which at least one explanatory variable is significant individually?
A) 0.005
B) 0.010
C) 0.025
D) 0.050
TABLE 15-1
A certain type of rare gem serves as a status symbol for many of its owners. In theory,
for low prices, the demand increases and it decreases as the price of the gem increases.
However, experts hypothesize that when the gem is valued at very high prices, the
demand increases with price due to the status owners believe they gain in obtaining the
gem. Thus, the model proposed to best explain the demand for the gem by its price is
the quadratic model:
where Y = demand (in thousands) and X = retail price per carat.
This model was fit to data collected for a sample of 12 rare gems of this type. A portion
of the computer analysis obtained from Microsoft Excel is shown below:
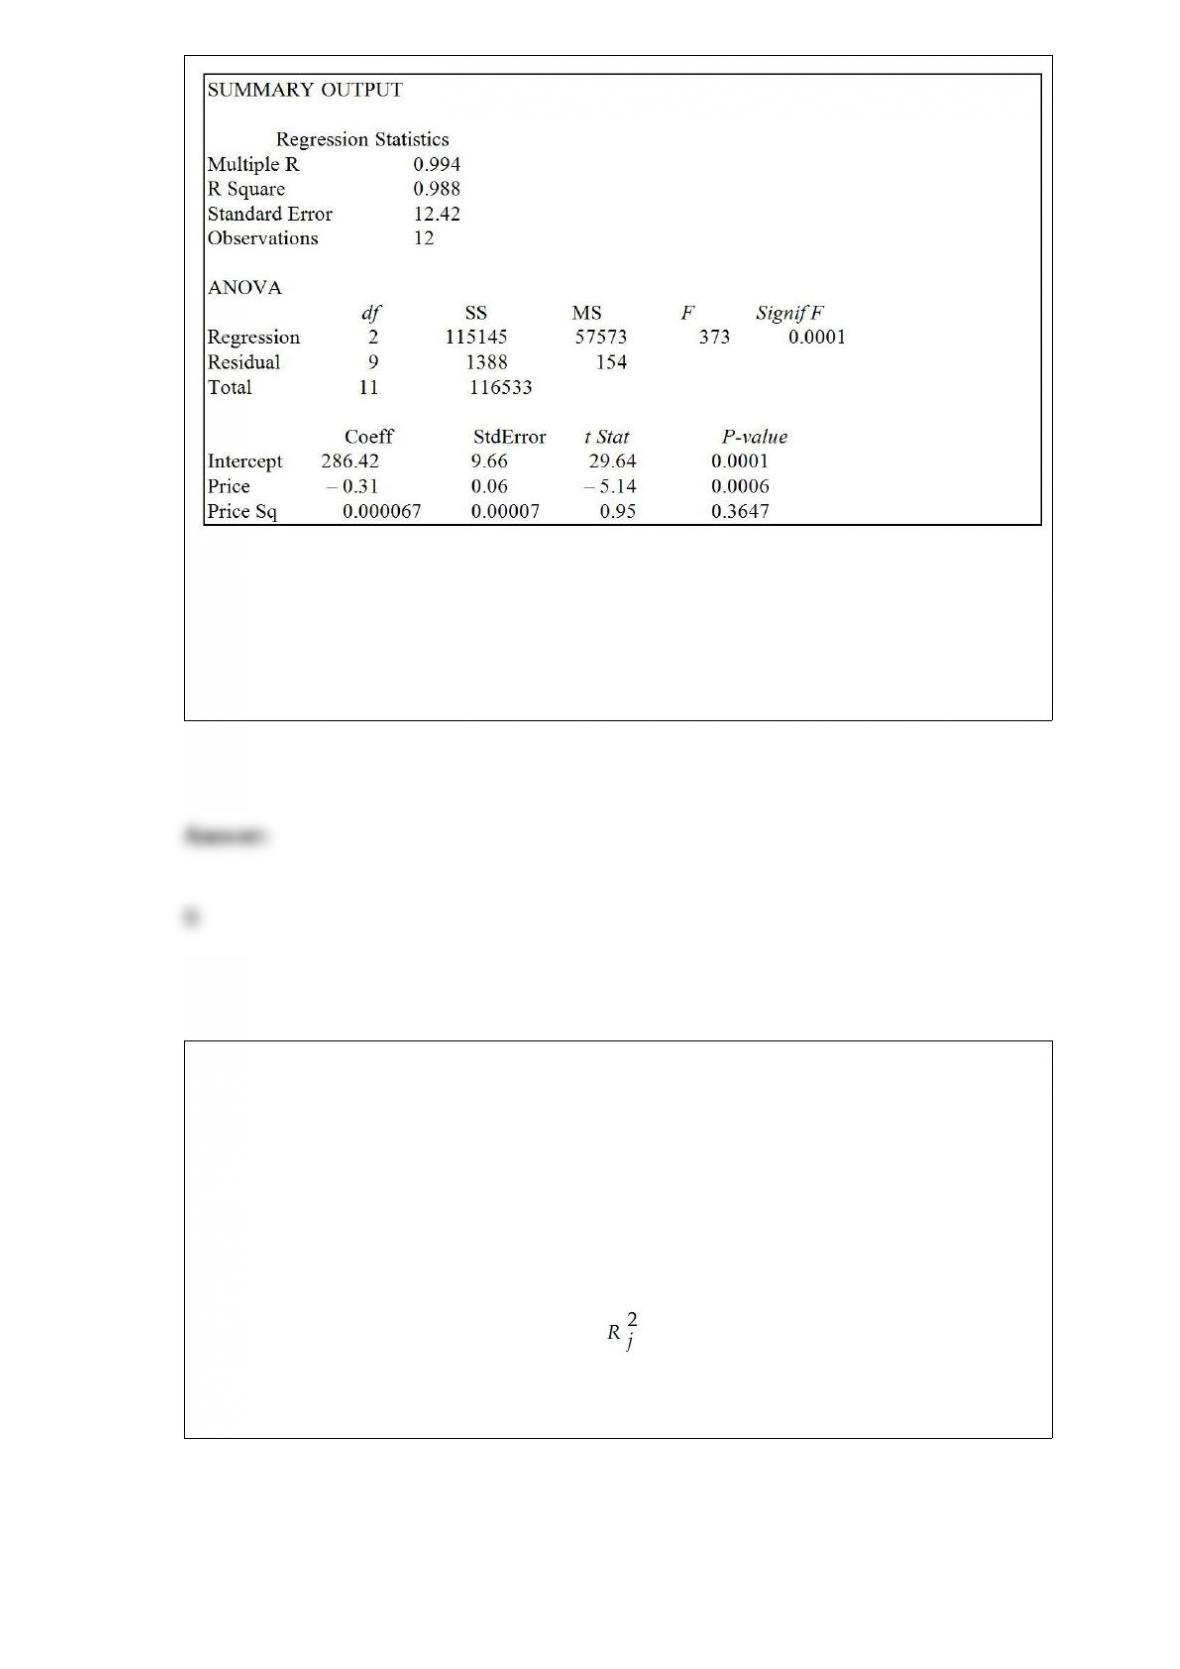
Referring to Table 15-1, what is the value of the test statistic for testing whether there is
an upward curvature in the response curve relating the demand (Y) and the price (X)?
A) -5.14
B) 0.95
C) 373
D) None of the above
TABLE 15-4
The superintendent of a school district wanted to predict the percentage of students
passing a sixth-grade proficiency test. She obtained the data on percentage of students
passing the proficiency test (% Passing), daily mean of the percentage of students
attending class (% Attendance), mean teacher salary in dollars (Salaries), and
instructional spending per pupil in dollars (Spending) of 47 schools in the state.
Let Y = % Passing as the dependent variable, X1 = % Attendance, X2 = Salaries and X3
= Spending.
The coefficient of multiple determination ( ) of each of the 3 predictors with all the
other remaining predictors are, respectively, 0.0338, 0.4669, and 0.4743.
The output from the best-subset regressions is given below:
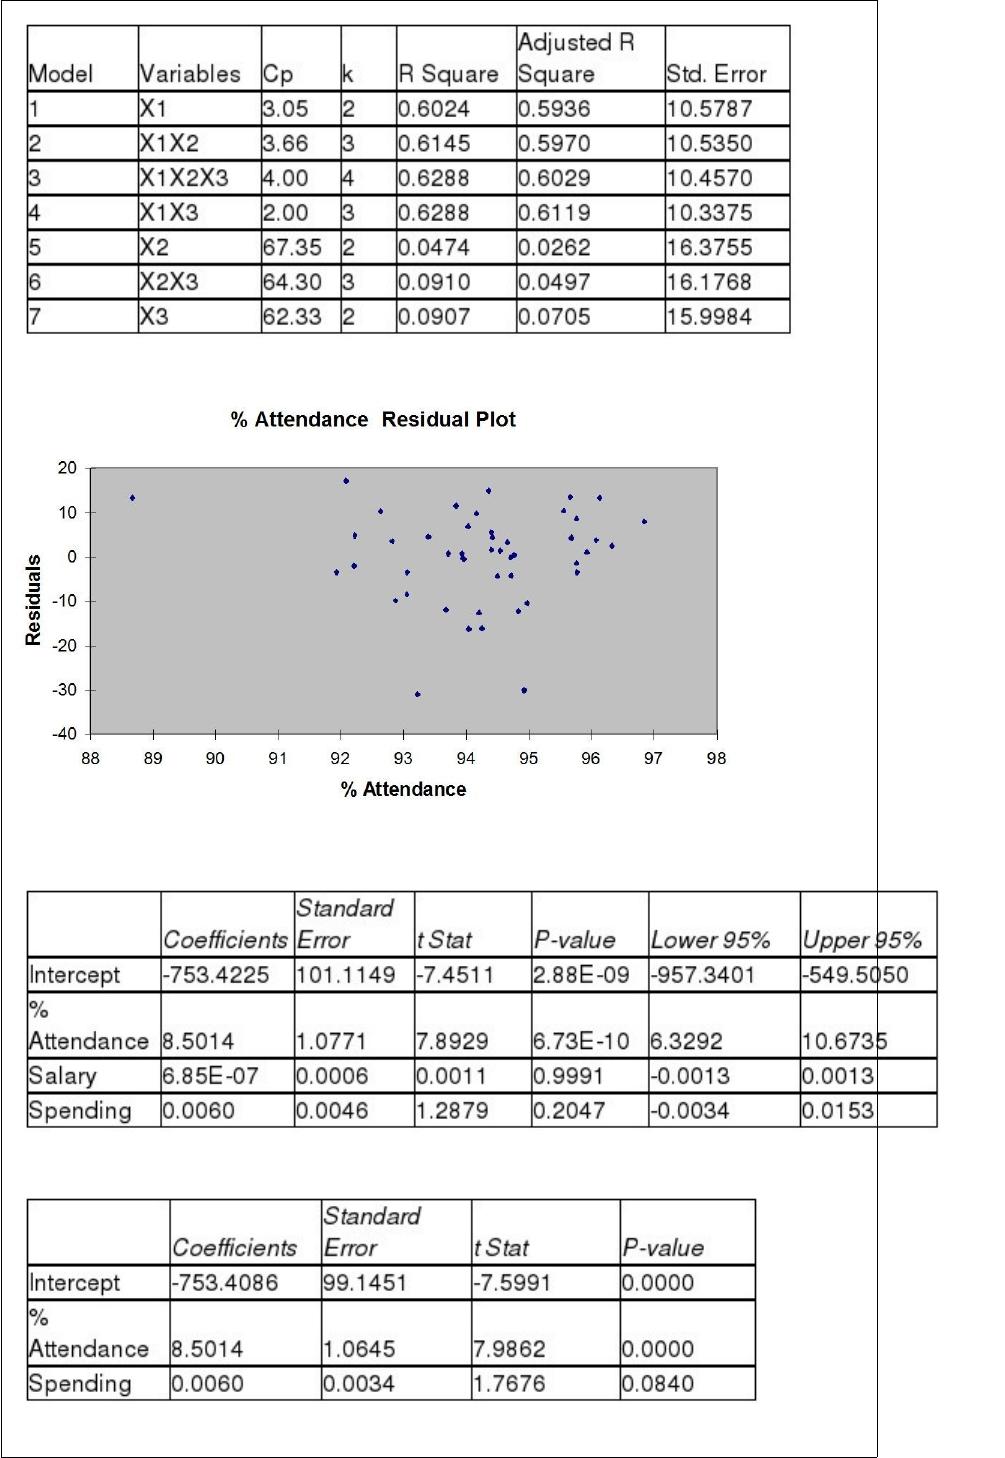
Following is the residual plot for % Attendance:
Following is the output of several multiple regression models:
Model (I):
Model (II):
Model (III):
Referring to Table 15-4, the “best” model using a 5% level of significance among those
chosen by the Cp statistic is
A) X1, X3.
B) X1, X2, X3.
C) Either of the above
D) None of the above
TABLE 18-2
A political pollster randomly selects a sample of 100 voters each day for 8 successive
days and asks how many will vote for the incumbent. The pollster wishes to construct a
p chart to see if the percentage favoring the incumbent candidate is too erratic.
Referring to Table 18-2, which expression best characterizes the p chart?
A) In-control
B) Increasing trend
C) Decreasing trend
D) Individual outliers
The owner of a local nightclub has recently surveyed a random sample of n = 250
customers of the club. She would now like to determine whether or not the mean age of
her customers is greater than 30. If so, she plans to alter the entertainment to appeal to
an older crowd. If not, no entertainment changes will be made. The appropriate
hypotheses to test are
A) H0 : 30 versus H1 : < 30.
B) H0 : 30 versus H1 : > 30.
C) H0 : 30 versus H1 : < 30.
D) H0 : 30 versus H1 : > 30.
If two events are mutually exclusive, what is the probability that one or the other
occurs?
A) 0
B) 0.50
C) 1.00
D) Cannot be determined from the information given.
In an Analysis of Proportions (ANOP) with 6 groups, the sample size per group used to
obtain the Nelson’s h statistic should always be
A) 5.
B) 6.
C) 7.
D) infinity.
TABLE 12-13
Recent studies have found that American children are more obese than in the past. The
amount of time children spent watching television has received much of the blame. A
survey of 100 ten-year-olds revealed the following with regards to weights and average
number of hours a day spent watching television. We are interested in testing whether
the mean number of hours spent watching TV and weights are independent at 1% level
of significance.
Referring to Table 12-13, the value of the test statistic is
A) 8.532.
B) 15.483.
C) 18.889.
D) 69.744.
TABLE 12-4
A computer used by a 24-hour banking service is supposed to randomly assign each
transaction to one of 5 memory locations. A check at the end of a day’s transactions
gave the counts shown in the table to each of the 5 memory locations, along with the
number of reported errors.
The bank manager wanted to test whether the proportion of errors in transactions
assigned to each of the 5 memory locations differ.
Referring to Table 12-4, the calculated value of the test statistic is
A) -0.1777.
B) -0.0185.
C) 1.4999.
D) 1.5190.
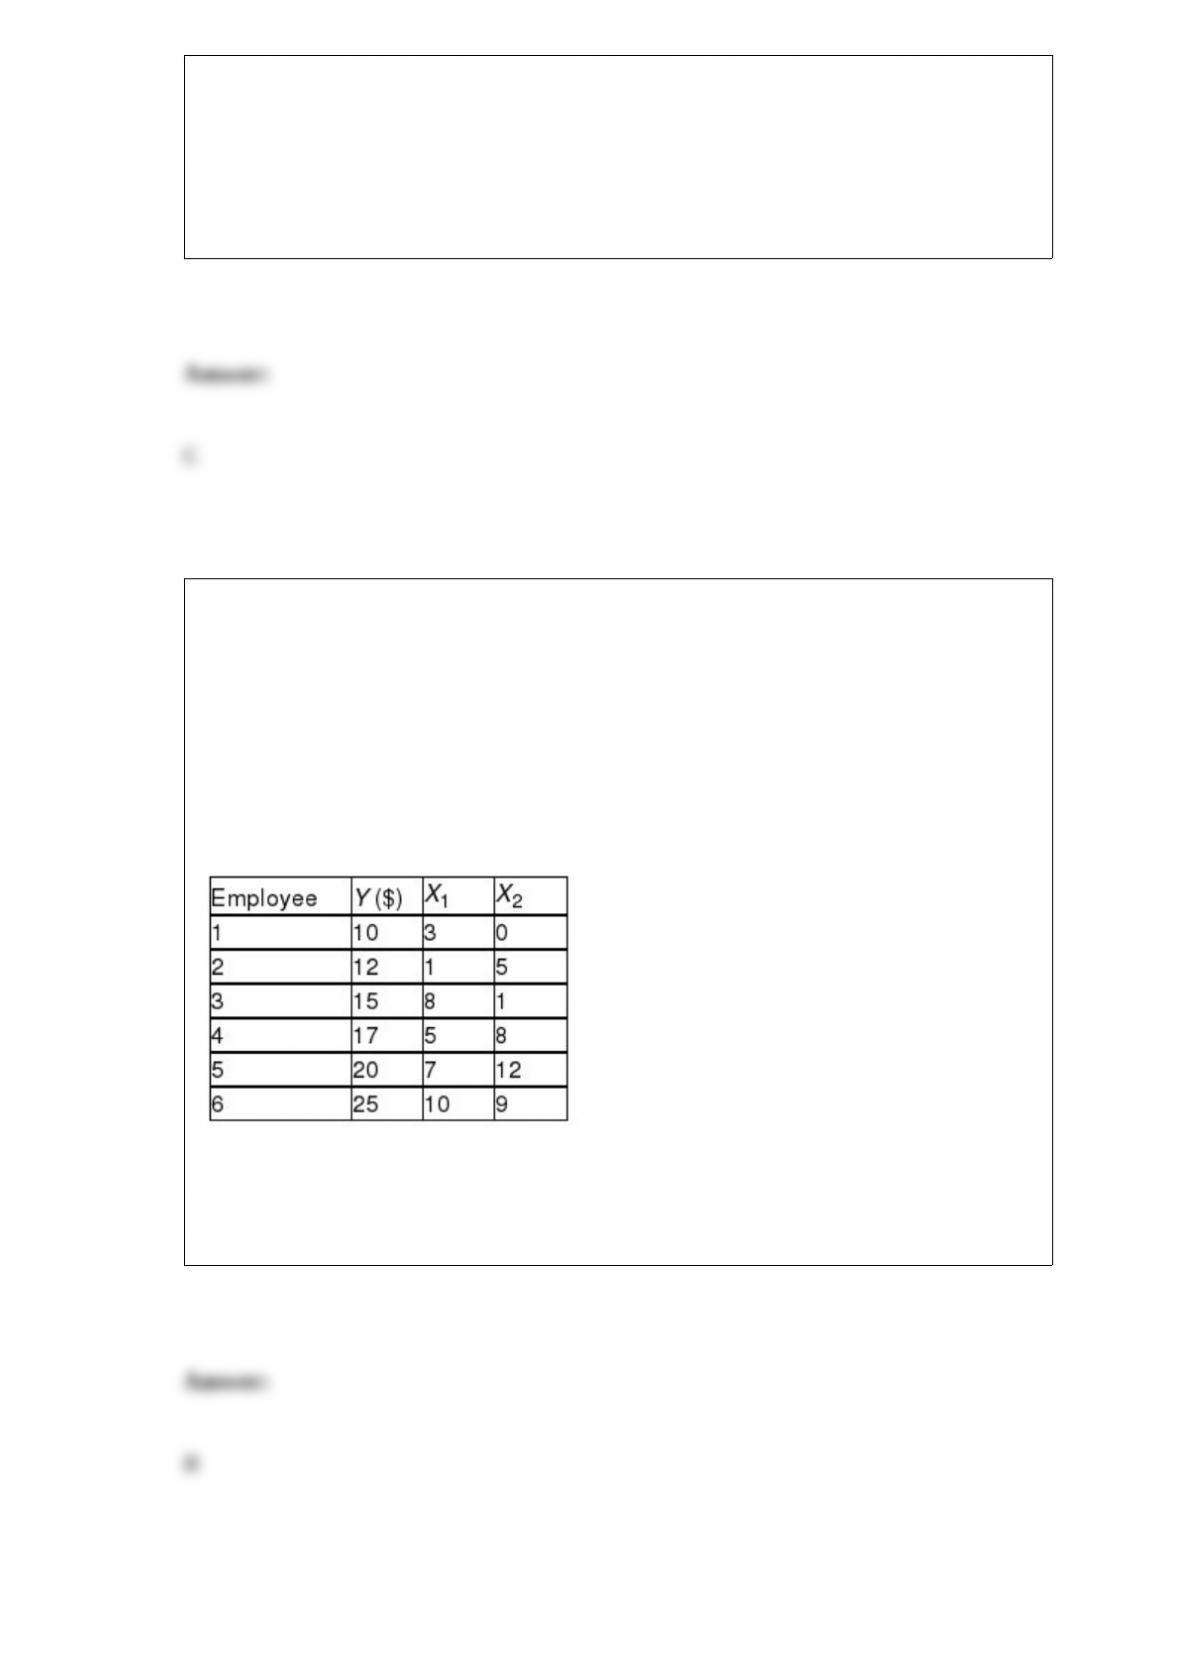
Referring to Table 14-2, suppose an employee had never taken an economics course and
managed to score a 5 on his performance rating. What is his estimated expected wage
rate?
TABLE 14-2
A professor of industrial relations believes that an individual’s wage rate at a factory (Y)
depends on his performance rating (X1) and the number of economics courses the
employee successfully completed in college (X2). The professor randomly selects 6
workers and collects the following information:
A) 10.90
B) 12.20
C) 17.23
D) 25.11
Referring to Table 19-3, what is the return to risk ratio for Investment B?
A) 8
B) 10
C) 12
D) 24
A type of vertical bar chart in which the categories are plotted in the descending rank
order of the magnitude of their frequencies is called a
A) contingency table.
B) Pareto chart.
C) stem-and-leaf display.
D) pie chart.
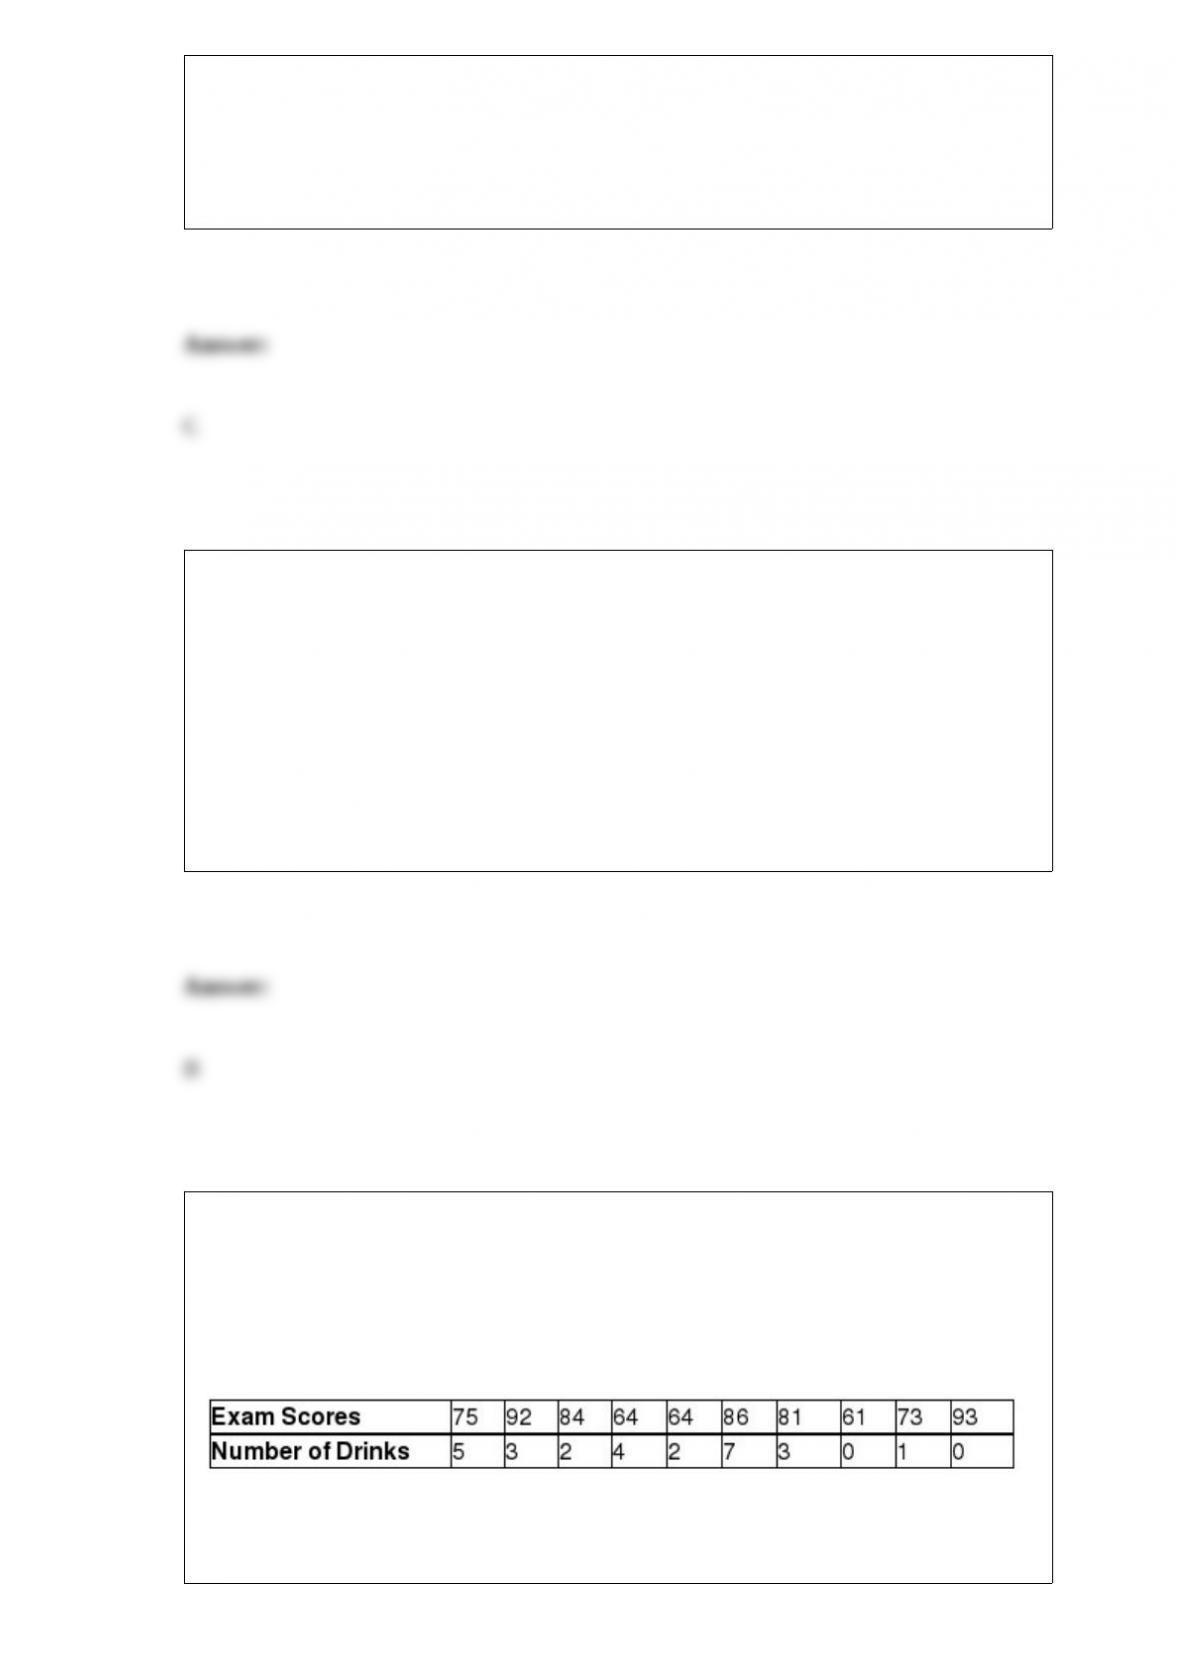
TABLE 3-13
Energy drink consumption has continued to gain in popularity since the 1997 debut of
Red Bull, the current leader in the energy drink market. Given below are the exam
scores and the number of 12-ounce energy drinks consumed within a week prior to the
exam of 10 college students.
Referring to Table 3-13, for a student who has consumed a high number of energy
drinks within the week prior to the exam, you will expect his/her exam score to
A) be noticeably higher than the exam score had he/she not consumed as many energy
drinks.
B) be noticeably lower than the exam score had he/she not consumed as many energy
drinks.
C) not be noticeably different from the amount of energy drinks that he/she consumed.
D) not be noticeably different from the exam score had he/she not consumed as many
energy drinks.
If a researcher does not reject a false null hypothesis, she has made a(n) ________ error.
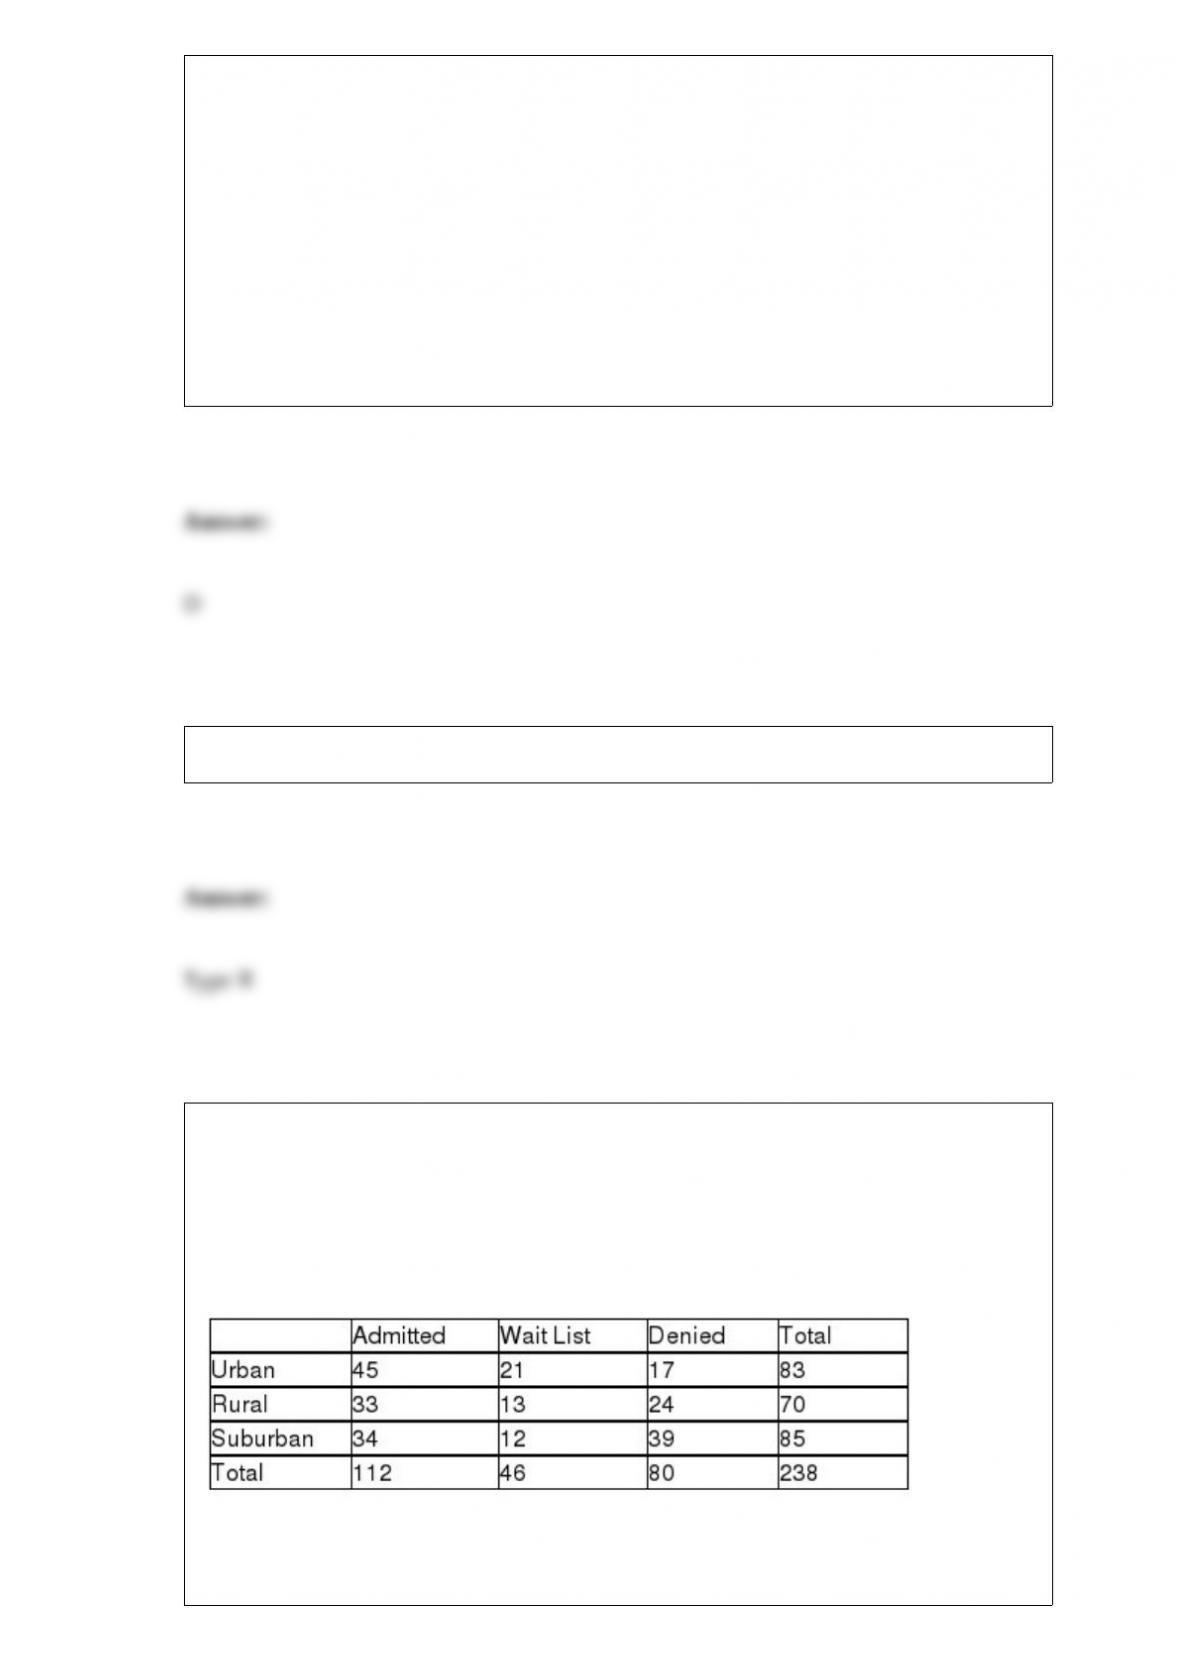
TABLE 12-11
The director of admissions at a state college is interested in seeing if admissions status
(admitted, waiting list, denied admission) at his college is independent of the type of
community in which an applicant resides. He takes a sample of recent admissions
decisions and forms the following table:
He will use this table to do a chi-square test of independence with a level of
significance of 0.01.
Referring to Table 12-11, the test will involve ________ degrees of freedom.
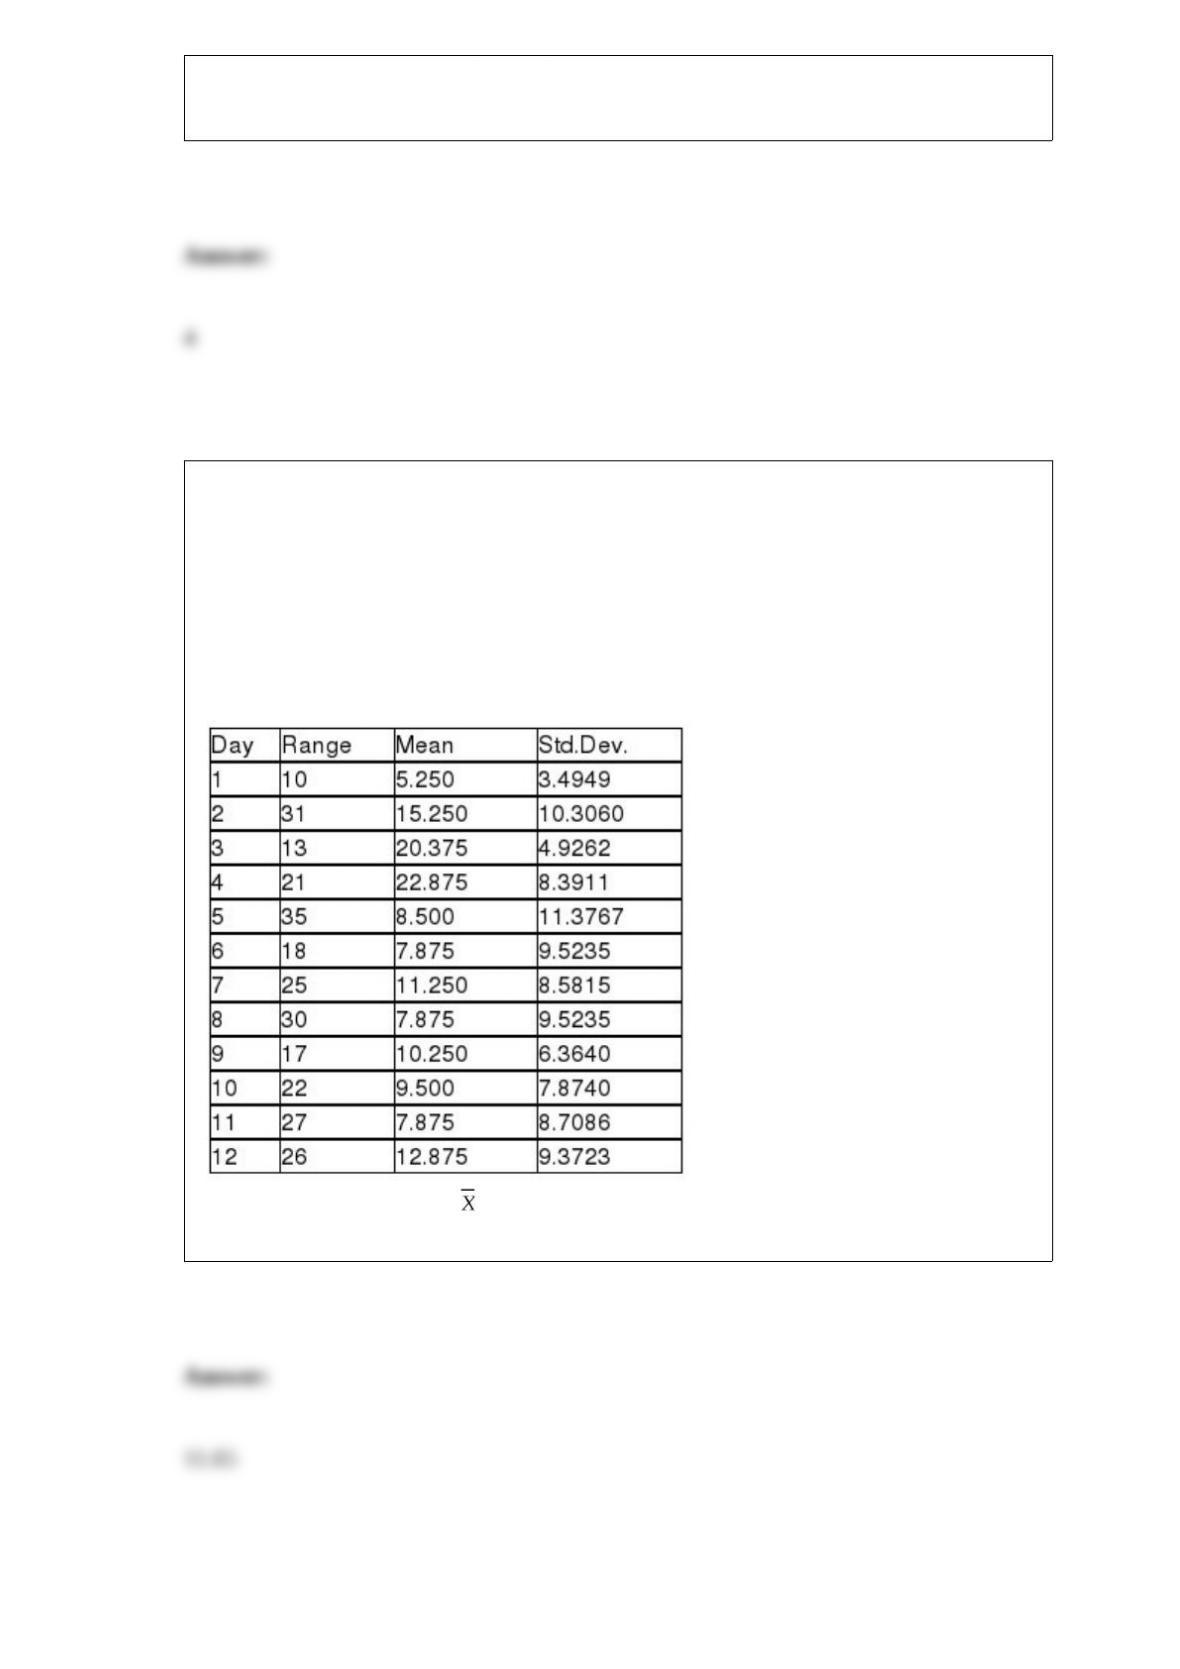
TABLE 18-8
Recently, a university switched to a new type of computer-based registration. The
registrar is concerned with the amount of time students are spending on the computer
registering under the new system. She decides to randomly select 8 students on each of
the 12 days of the registration and determine the time each spends on the computer
registering. The range, mean, and standard deviation of the times required to register are
in the table that follows.
Referring to Table 18-8, an chart is to be used for the time required to register. The
center line of this chart is located at ________.
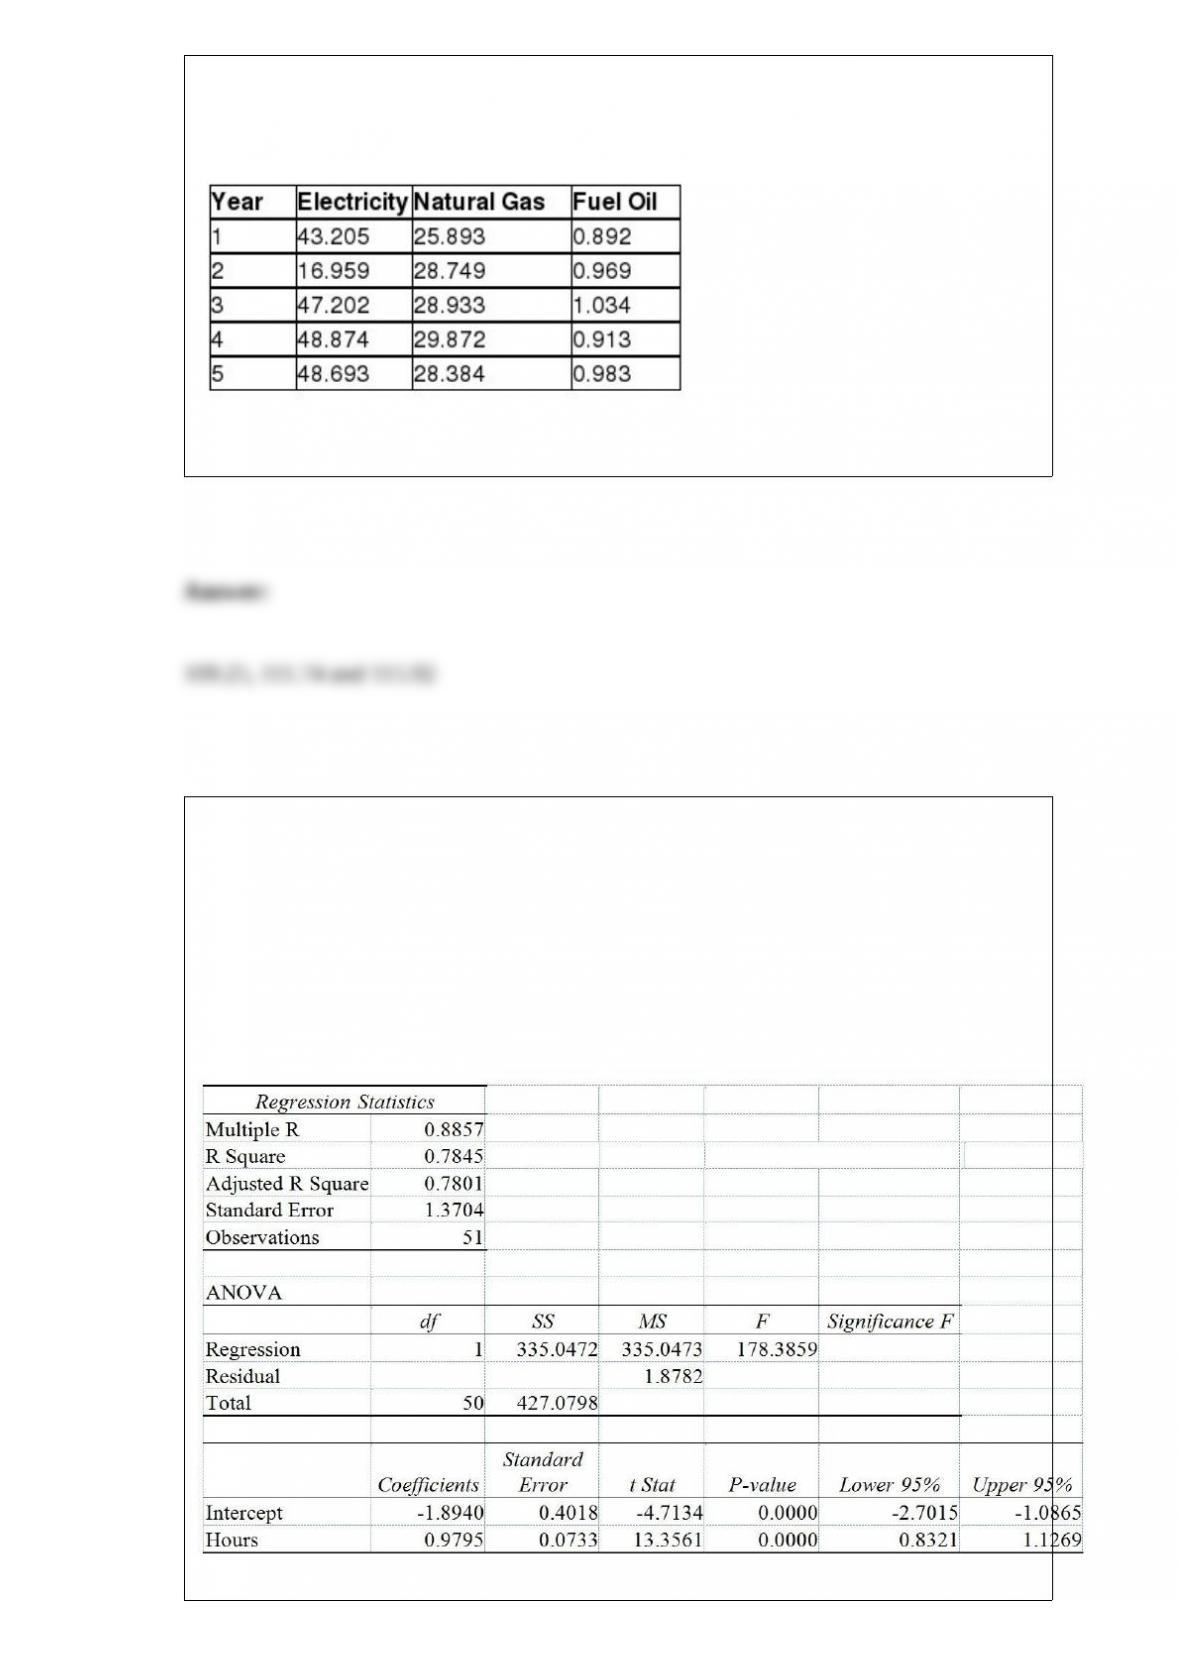
TABLE 16-15
Given below are the average prices for three types of energy products for five
consecutive years.
Referring to Table 16-15, what are the simple price indices for electricity, natural gas
and fuel oil, respectively, in year 3 using year 1 as the base year?
TABLE 13-9
It is believed that, the average numbers of hours spent studying per day (HOURS)
during undergraduate education should have a positive linear relationship with the
starting salary (SALARY, measured in thousands of dollars per month) after graduation.
Given below is the Excel output for predicting starting salary (Y) using number of hours
spent studying per day (X) for a sample of 51 students. NOTE: Only partial output is
shown.

Note: 2.051E – 05 = 2.051 ∗ 10-05 and 5.944E – 18 = 5.944 ∗ 10-18.
Referring to Table 13-9, to test the claim that SALARY depends positively on HOURS
against the null hypothesis that SALARY does not depend linearly on HOURS, the
p-value of the test statistic is ________.
Referring to Table 17-3, the analyst decided to construct a 99% confidence interval for
β3. The confidence interval is from ________ to ________.
TABLE 6-2
John has two jobs. For daytime work at a jewelry store he is paid $15,000 per month,
plus a commission. His monthly commission is normally distributed with a mean of
$10,000 and a standard deviation of $2,000. At night he works occasionally as a waiter,
for which his monthly income is normally distributed with a mean of $1,000 and a
standard deviation of $300. John’s income levels from these two sources are
independent of each other.
Referring to Table 6-2, for a given month, what is the probability that John’s
commission from the jewelry store is between $11,000 and $12,000?
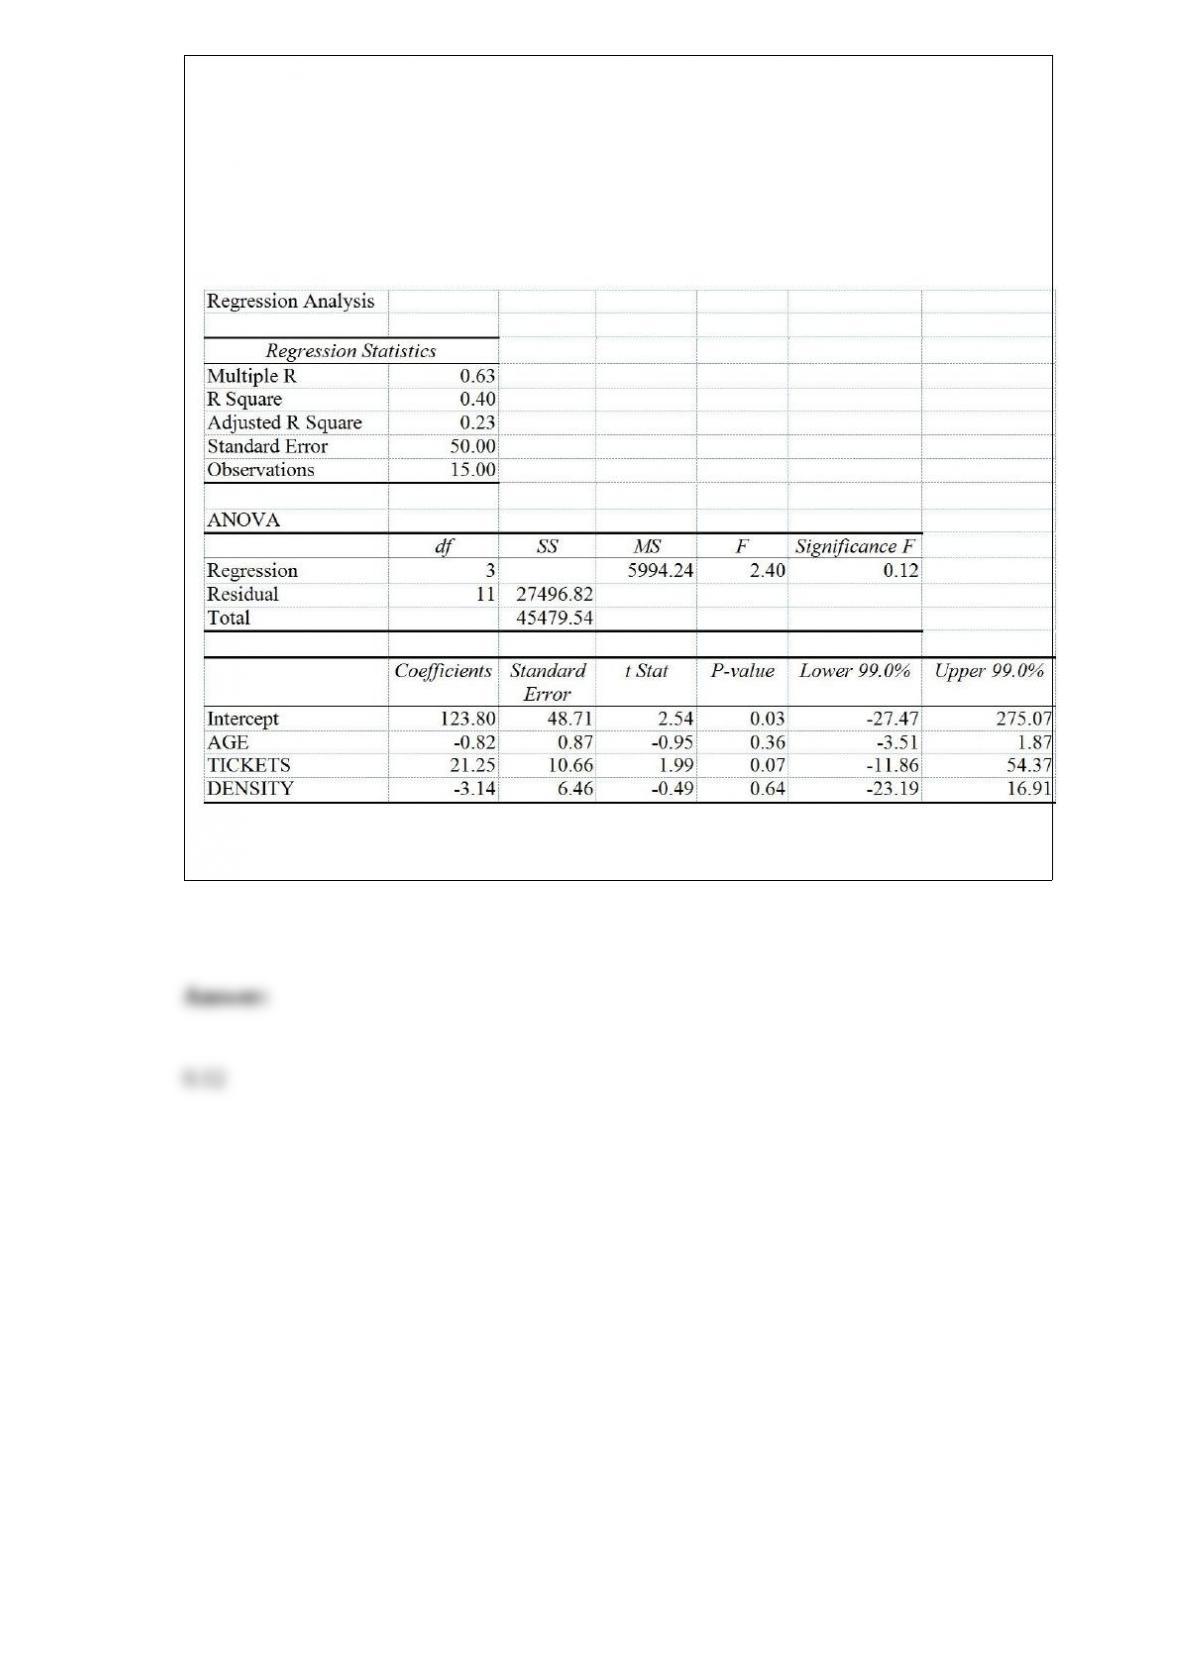
TABLE 17-5
You worked as an intern at We Always Win Car Insurance Company last summer. You
notice that individual car insurance premiums depend very much on the age of the
individual, the number of traffic tickets received by the individual, and the population
density of the city in which the individual lives. You performed a regression analysis in
EXCEL and obtained the following information:
Referring to Table 17-5, to test the significance of the multiple regression model, the
p-value of the test statistic in the sample is ________.