
TABLE 8-4
The actual voltages of power packs labeled as 12 volts are as follows: 11.77, 11.90,
11.64, 11.84, 12.13, 11.99, and 11.77.
True or False: Referring to Table 8-4, it is possible that the 99% confidence interval
calculated from the data will not contain the mean voltage for the entire population.
TABLE 9-3
An appliance manufacturer claims to have developed a compact microwave oven that
consumes a mean of no more than 250 W. From previous studies, it is believed that
power consumption for microwave ovens is normally distributed with a population
standard deviation of 15 W. A consumer group has decided to try to discover if the
claim appears true. They take a sample of 20 microwave ovens and find that they
consume a mean of 257.3 W.
True or False: Referring to Table 9-3, the null hypothesis will be rejected at 5% level of
significance.
True or False: TABLE 17-8
The superintendent of a school district wanted to predict the percentage of students
passing a sixth-grade proficiency test. She obtained the data on percentage of students
passing the proficiency test (% Passing), daily mean of the percentage of students
attending class (% Attendance), mean teacher salary in dollars (Salaries), and
instructional spending per pupil in dollars (Spending) of 47 schools in the state.
Following is the multiple regression output with Y = % Passing as the dependent
variable, X1 = % Attendance, X2 = Salaries and X3 = Spending:
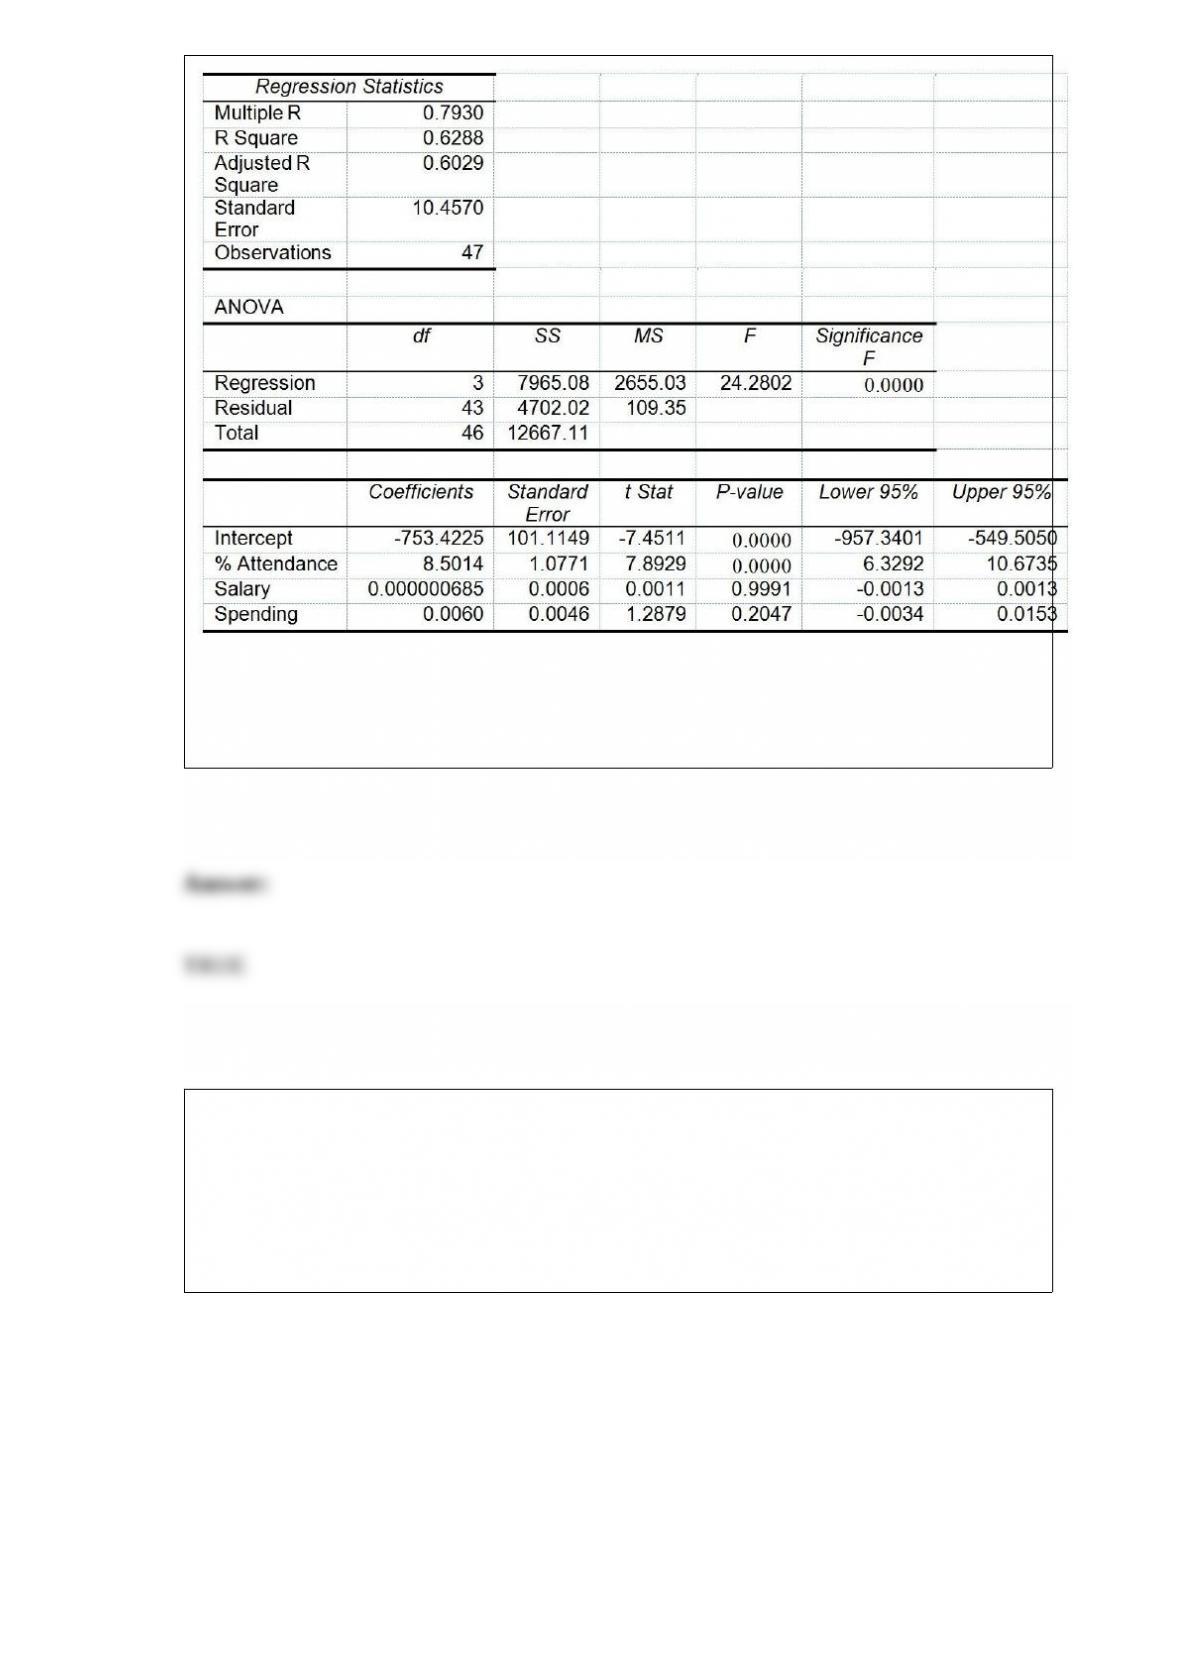
Referring to Table 17-8, the null hypothesis should be rejected at a 5% level of
significance when testing whether the daily mean of the percentage of students
attending class has any effect on the percentage of students passing the proficiency test,
taking into account the effect of all the other independent variables.
TABLE 13-10
The management of a chain electronic store would like to develop a model for
predicting the weekly sales (in thousands of dollars) for individual stores based on the
number of customers who made purchases. A random sample of 12 stores yields the
following results:
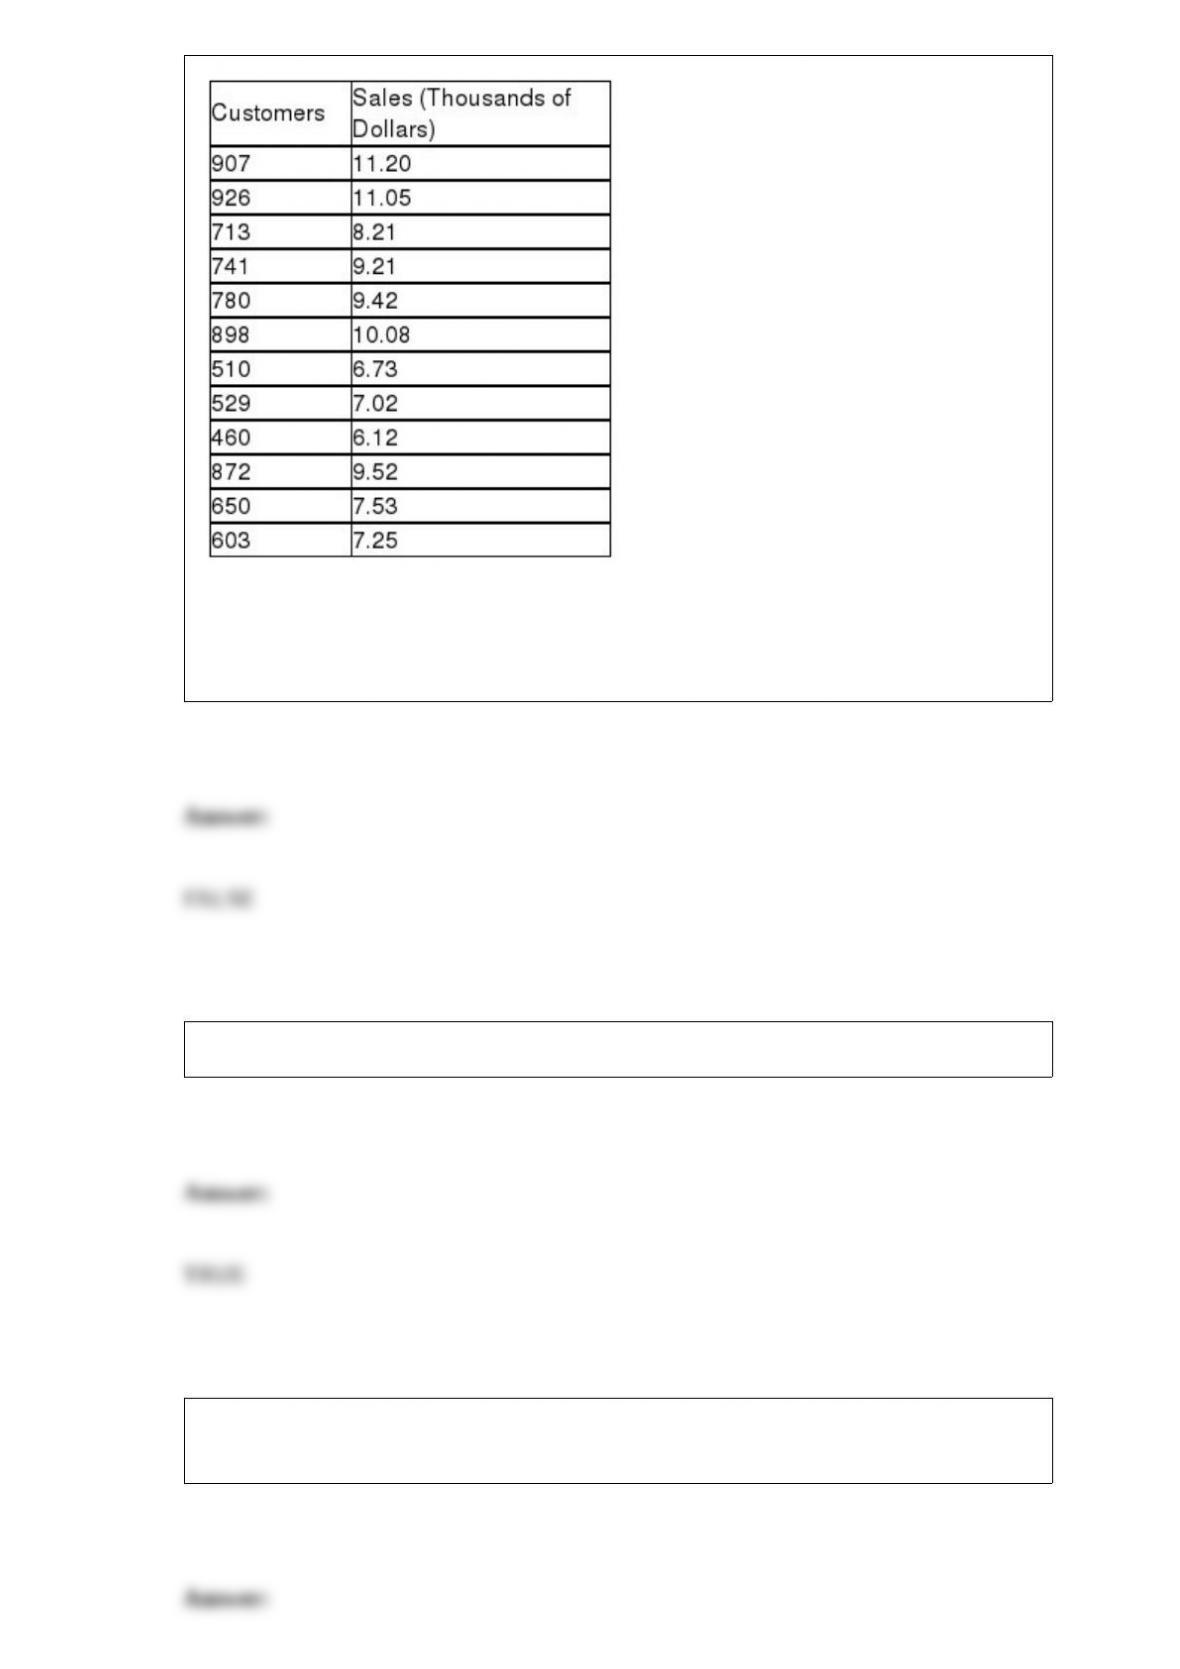
True or False: Referring to Table 13-10, the value of the t test statistic and F test
statistic should be the same when testing whether the number of customers who make
purchases is a good predictor for weekly sales.
True or False: In a Poisson distribution, the mean and variance are equal.
True or False: A good choice for the number of class groups to use in constructing
frequency distribution is to have at least 5 but no more than 15 class groups.
True or False: A statistic is usually unobservable while a parameter is usually
observable.
True or False: The amount of alcohol consumed by a person per week will be measured
on an interval scale.
True or False: The difference between the sample mean and the population mean is
called the sampling error.
TABLE 14-19
The marketing manager for a nationally franchised lawn service
company would like to study the characteristics that di erentiate
home owners who do and do not have a lawn service. A random
sample of 30 home owners located in a suburban area near a large
city was selected; 11 did not have a lawn service (code 0) and 19 had
a lawn service (code 1). Additional information available concerning
these 30 home owners includes family income (Income, in thousands
of dollars) and lawn size (Lawn Size, in thousands of square feet).
The PHStat output is given below:
True or False: Referring to Table 14-19, there is not enough evidence
to conclude that Income makes a signiticant contribution to the
model in the presence of LawnSize at a 0.05 level of signiticance.
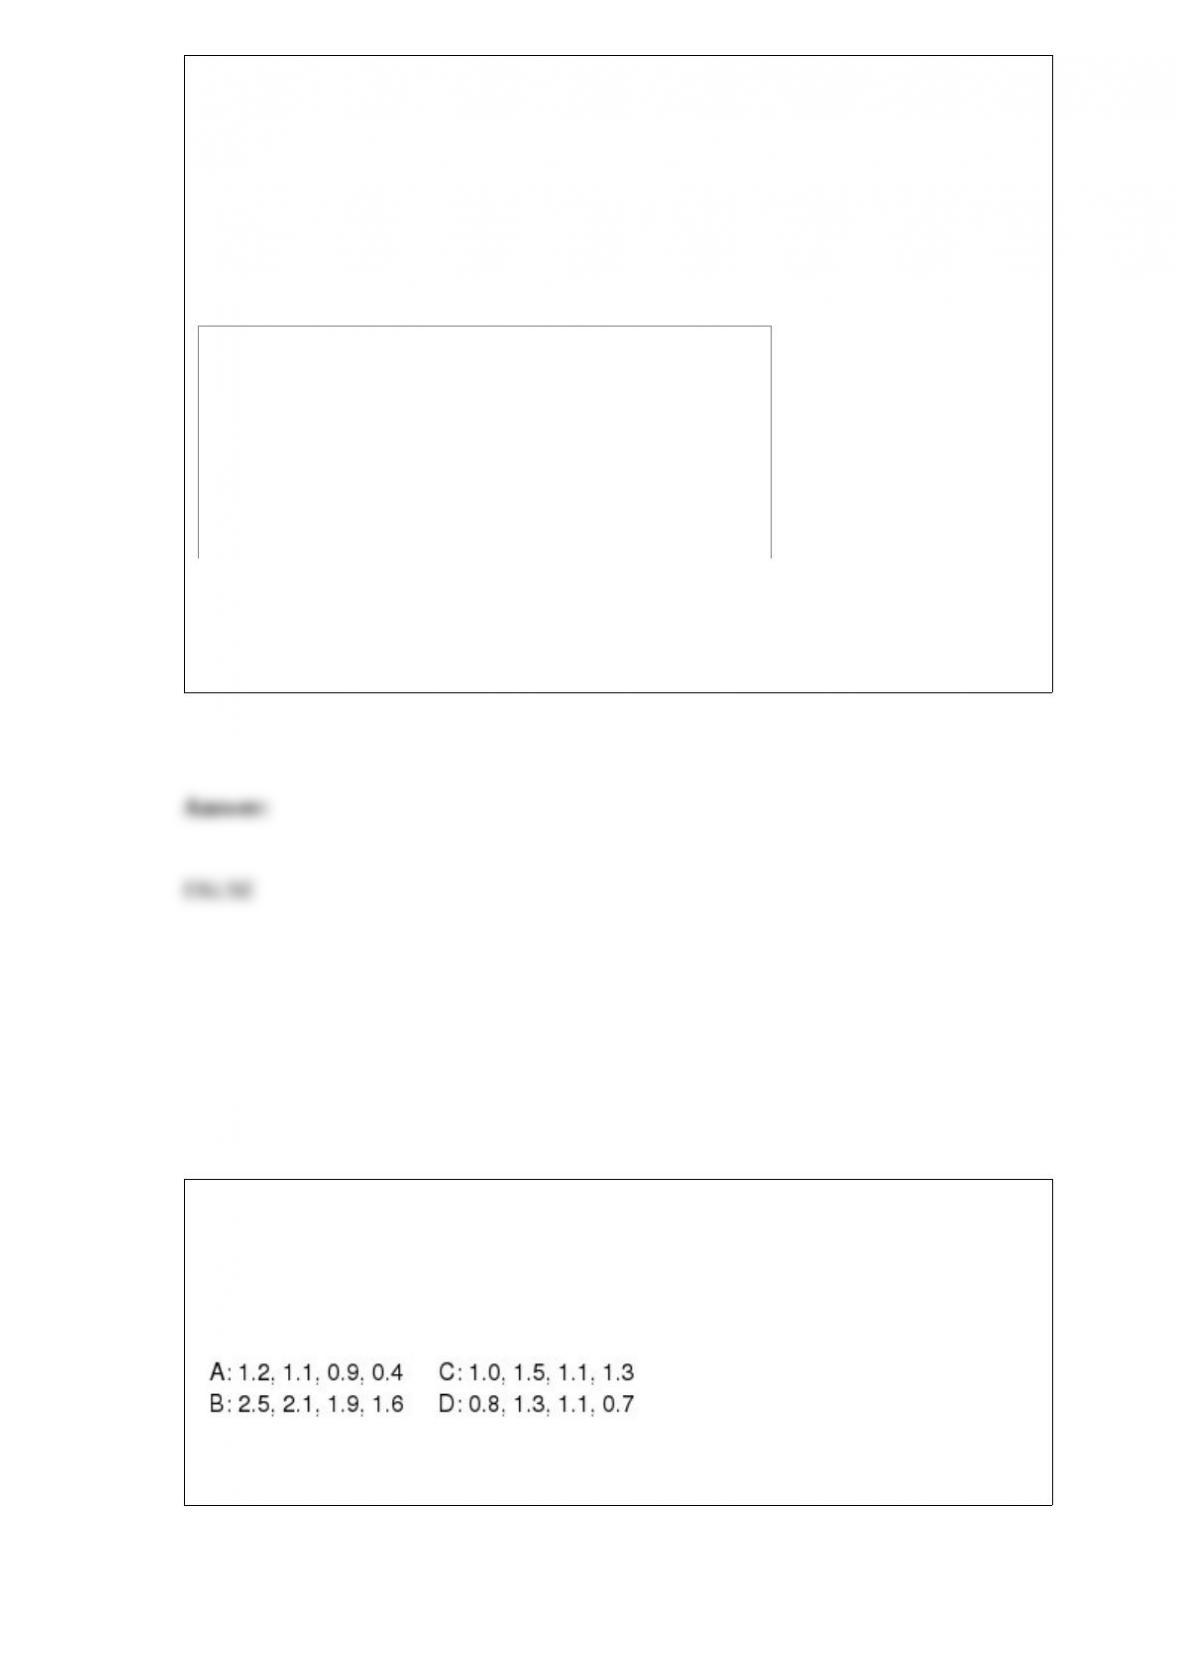
TABLE 11-2
A realtor wants to compare the mean sales-to-appraisal ratios of residential properties
sold in four neighborhoods (A, B, C, and D). Four properties are randomly selected
from each neighborhood and the ratios recorded for each, as shown below.
Interpret the results of the analysis summarized in the following table:
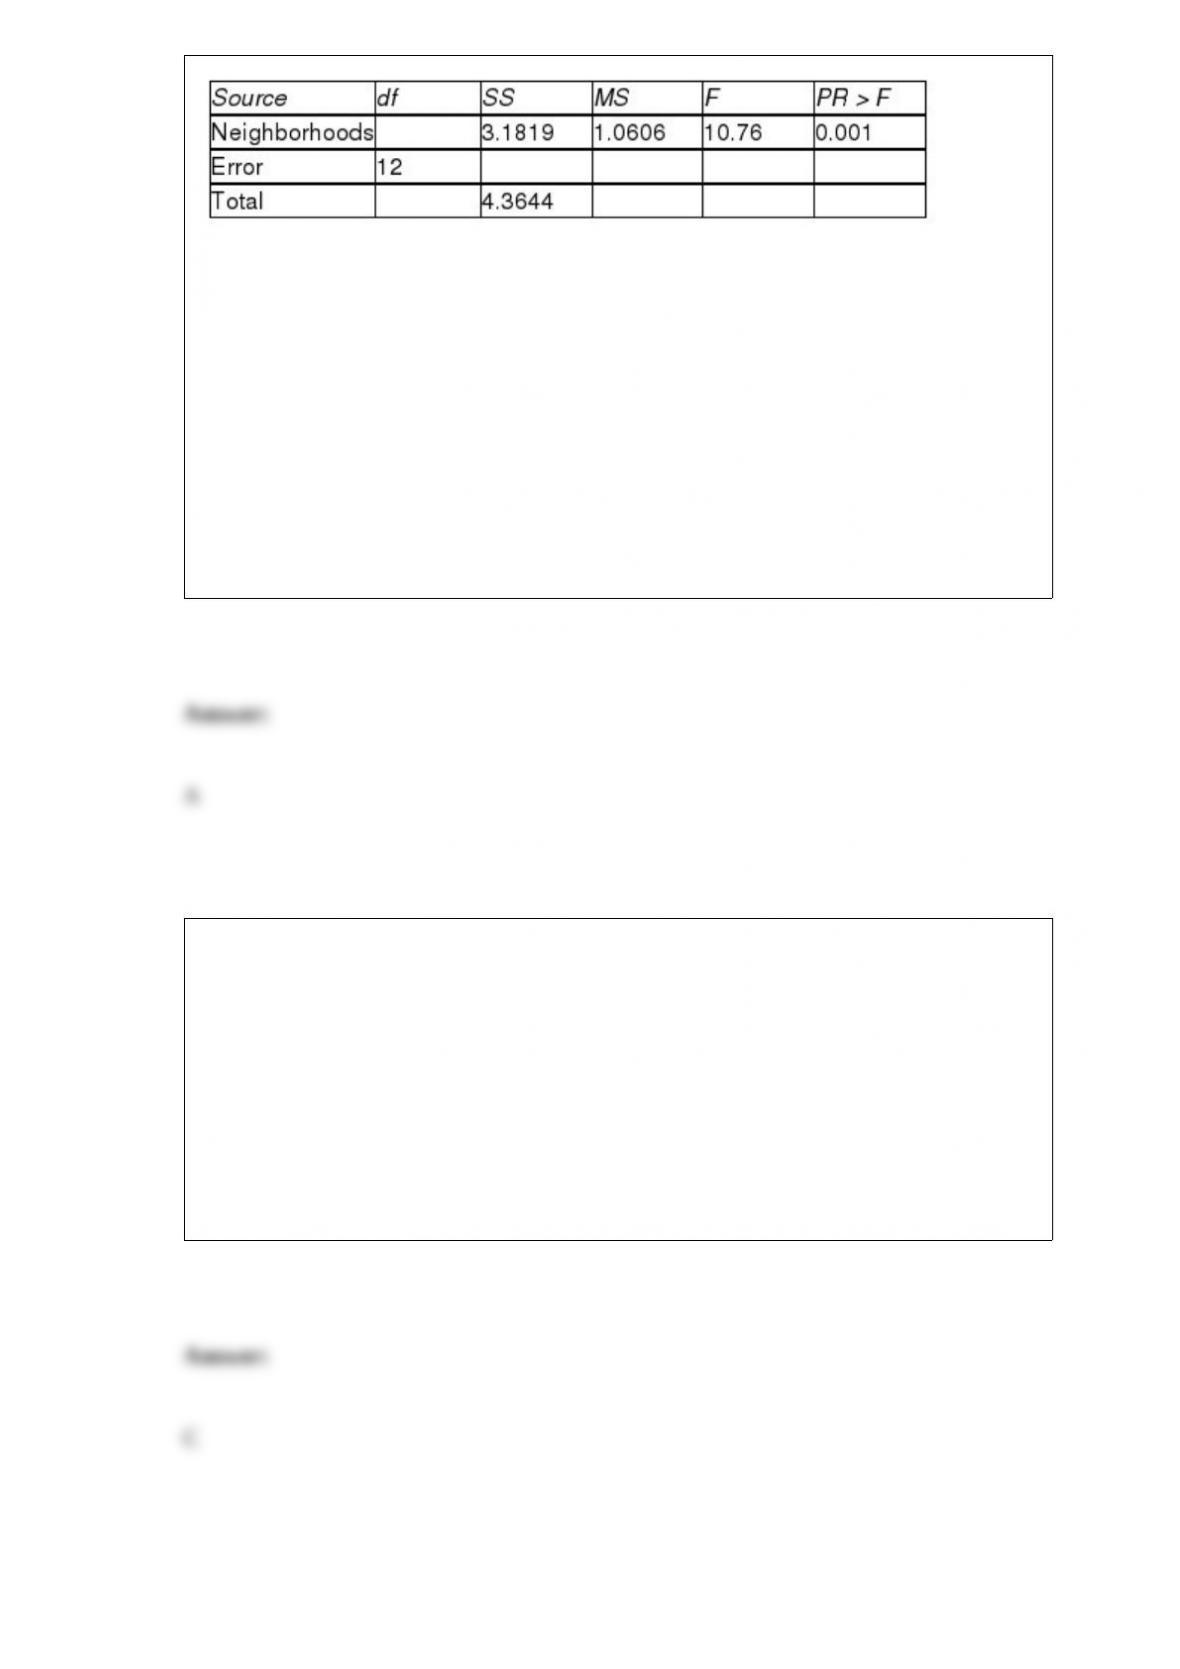
Referring to Table 11-2, the numerator and denominator degrees of freedom for
Levene’s test for homogeneity of variances at a 5% level of significance are,
respectively,
A) 3, 12.
B) 12, 3.
C) 3, 15.
D) 15, 3.
The value of the cumulative standardized normal distribution at Z is 0.6255. The value
of Z is
A) 0.99.
B) 0.40.
C) 0.32.
D) 0.16.
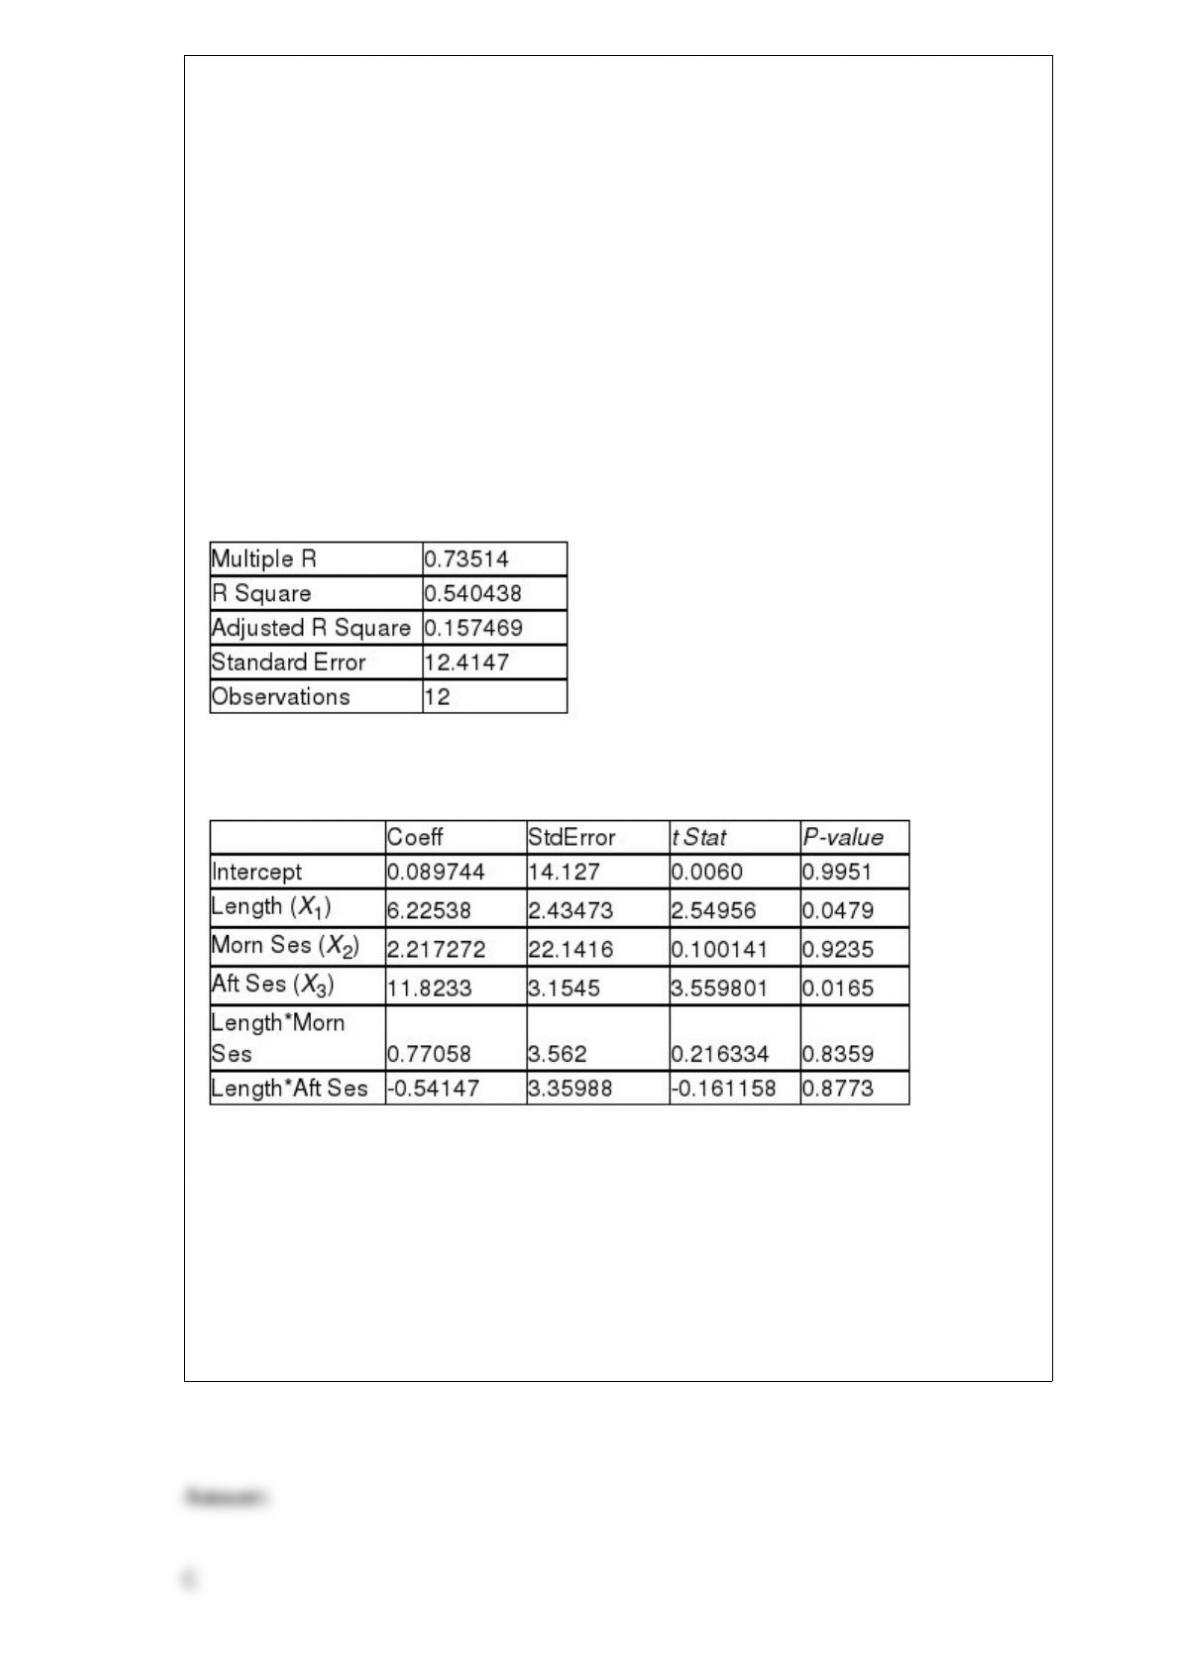
TABLE 17-6
A weight-loss clinic wants to use regression analysis to build a model for weight loss of
a client (measured in pounds). Two variables thought to affect weight loss are client’s
length of time on the weight-loss program and time of session. These variables are
described below:
Y = Weight loss (in pounds)
X1 = Length of time in weight-loss program (in months)
X2 = 1 if morning session, 0 if not
X3 = 1 if afternoon session, 0 if not (Base level = evening session)
Data for 12 clients on a weight-loss program at the clinic were collected and used to fit
the interaction model:
Y = β0 + β1X1 + β2X2 + β3X3 + β4X1X2 + β5X1X3 + ε
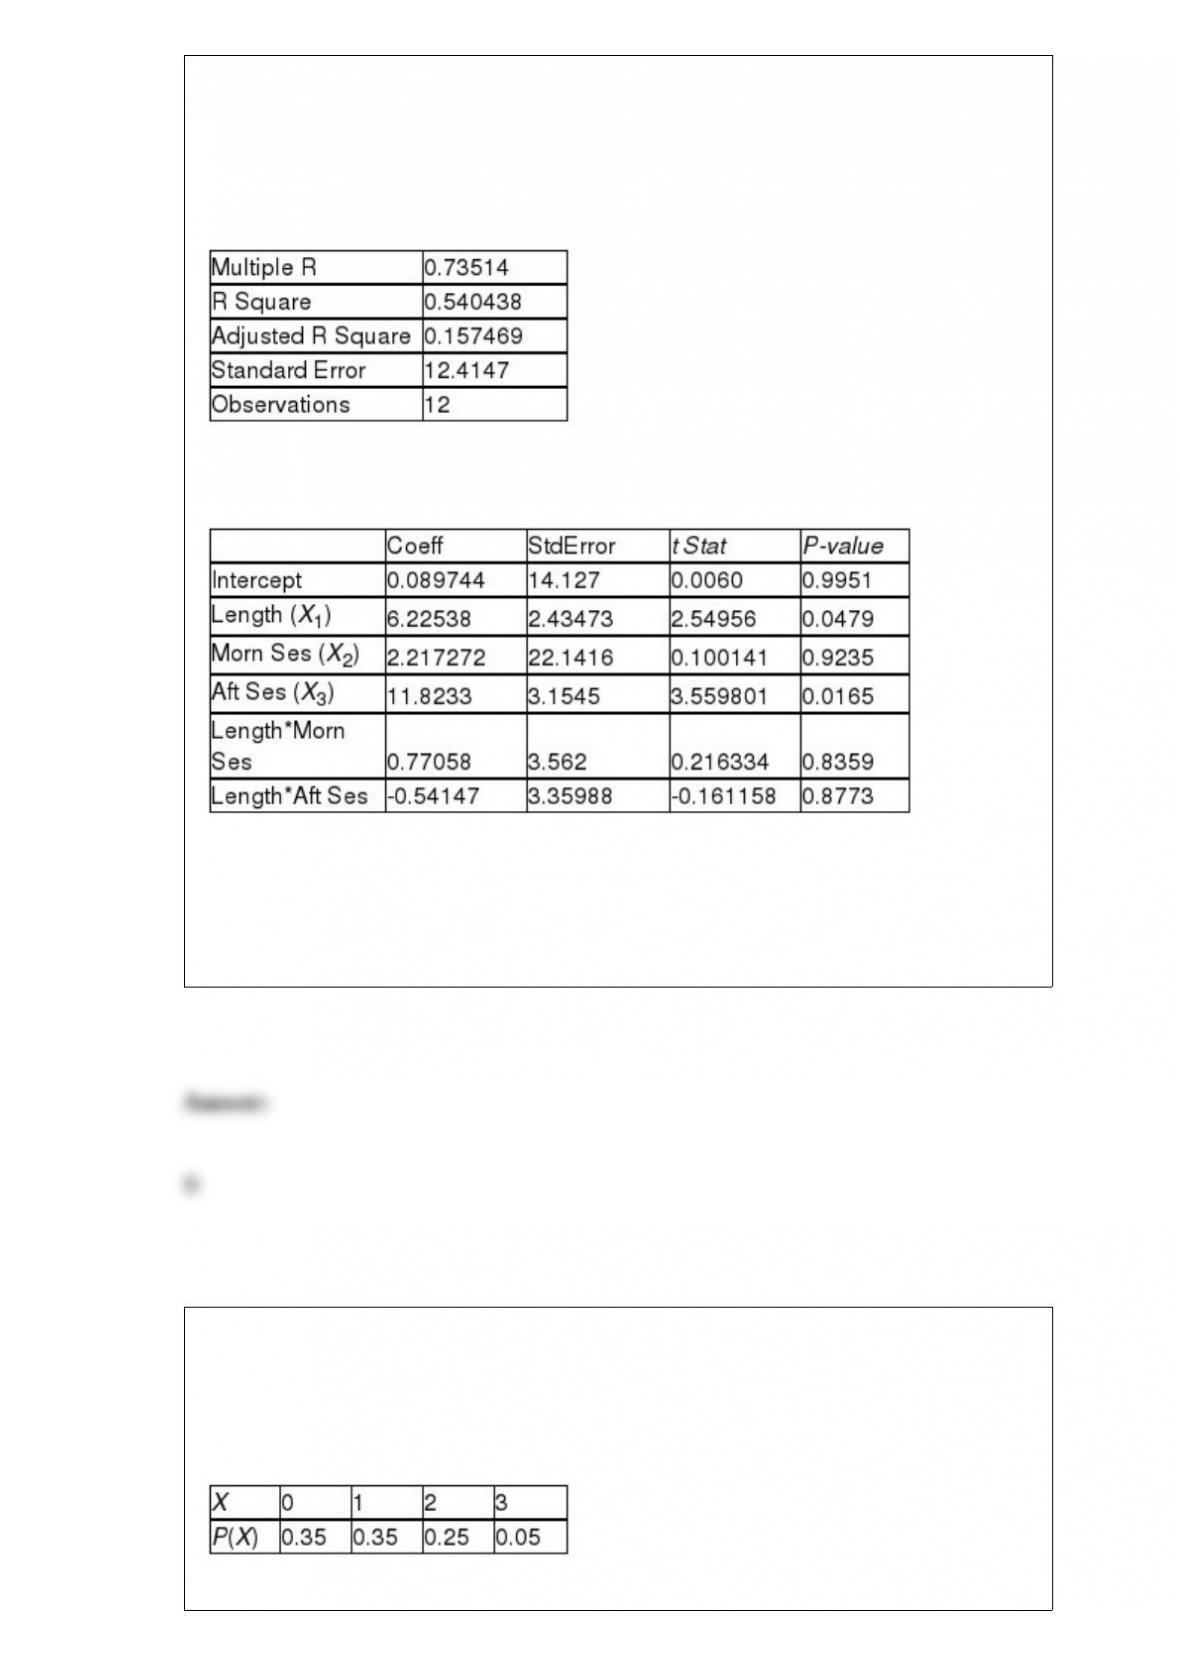
Partial output from Microsoft Excel follows:
Regression Statistics
ANOVA
F = 5.41118 Significance F = 0.040201
Referring to Table 17-6, what null hypothesis would you test to determine whether the
slope of the linear relationship between weight loss (Y) and time in the program (X1)
varies according to time of session?
A) H0 : β1 = β2 = β3 = β4 = β5 = 0
B) H0 : β2 = β3 = β4 = β5 = 0
C) H0 : β4 = β5 = 0
D) H0 : β2 = β3 = 0
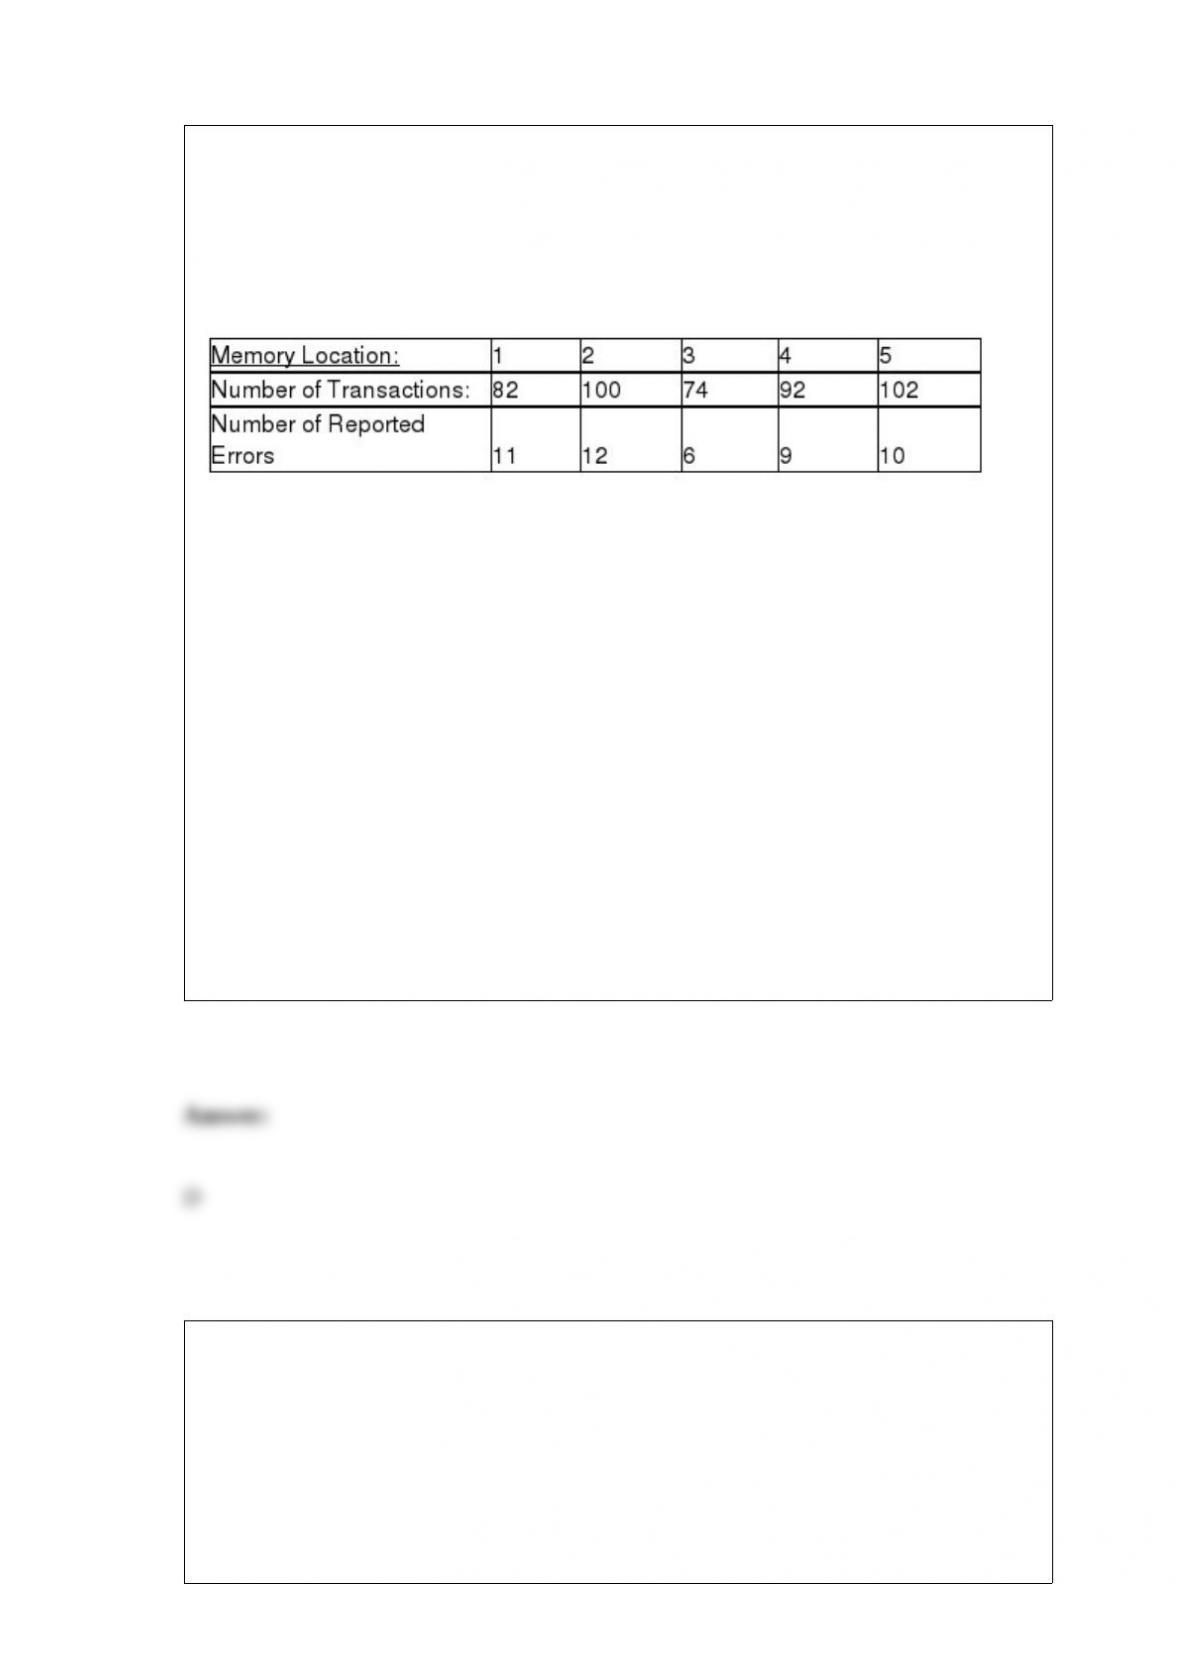
TABLE 12-4
A computer used by a 24-hour banking service is supposed to randomly assign each
transaction to one of 5 memory locations. A check at the end of a day’s transactions
gave the counts shown in the table to each of the 5 memory locations, along with the
number of reported errors.
The bank manager wanted to test whether the proportion of errors in transactions
assigned to each of the 5 memory locations differ.
Referring to Table 12-4, at 1% level of significance,
A) there is sufficient evidence to conclude that the proportions of errors in transactions
assigned to each of the 5 memory locations are all different.
B) there is insufficient evidence to conclude that the proportions of errors in
transactions assigned to each of the 5 memory locations are all different.
C) there is sufficient evidence to conclude that the proportion of errors in transactions
assigned to each of the 5 memory locations are not all the same.
D) there is insufficient evidence to conclude that the proportion of errors in transactions
assigned to each of the 5 memory locations are not all the same.
Blossom’s Flowers purchases roses for sale for Valentine’s Day. The roses are purchased
for $10 a dozen and are sold for $20 a dozen. Any roses not sold on Valentine’s Day can
be sold for $5 per dozen. The owner will purchase 1 of 3 amounts of roses for
Valentine’s Day: 100, 200, or 400 dozen roses. The opportunity loss for buying 400
dozen roses and selling 200 dozen roses at the full price is
A) -$2,000.
B) $1,000.
C) $500.
D) $0.
An airline wants to select a computer software package for its reservation system. Four
software packages (1, 2, 3, and 4) are commercially available. An experiment is set up
in which each package is used to make reservations for 5 randomly selected weeks and
data on the number of passengers that are bumped over a month are collected. (A total
of 20 weeks was included in the experiment.) The variability of the number of
passengers that are bumped is found to be roughly the same for the 4 packages. The
distribution on the number of passengers that are bumped has been found out to be
right-skewed for package 1 and 4, left-skewed for package 2 and normal for package 3.
Which of the following tests will be the most appropriate to find out if the mean
number of passengers being bumped over a month is the same across the 4 packages?
A) Paired t test
B) Pooled-variance t test
C) One-way ANOVA F test for differences among more than two means
D) Kruskal-Wallis rank test
Referring to Table 14-17, which of the following is the correct null
hypothesis to test whether age has any e ect on the number of
weeks a worker is unemployed due to a layo while holding constant
the e ect of the other independent variable?
TABLE 14-17
Given below are results from the regression analysis where the
dependent variable is the number of weeks a worker is unemployed
due to a layo (Unemploy) and the independent variables are the age
of the worker (Age) and a dummy variable for management position
(Manager: 1 = yes, 0 = no).

The results of the regression analysis are given below:
A) H0 : β1 = 0
B) H0 : β1 ≠0
C) H0 : β2 = 0
D) H0 : β2 ≠0
The universe or “totality of items or things” under consideration is called
A) a sample.
B) a population.
C) a primary data source.
D) a secondary data source.

Referring to Table 14-16, which of the following assumptions is most
likely violated based on the residual plot of the residuals versus
predicted Y?
TABLE 14-16
What are the factors that determine the acceleration time (in sec.)
from 0 to 60 miles per hour of a car? Data on the following variables
for 30 di erent vehicle models were collected:
Y (Accel Time): Acceleration time in sec.
X1 (Engine Size): c.c.
X2 (Sedan): 1 if the vehicle model is a sedan and 0 otherwise
The regression results using acceleration time as the dependent
variable and the remaining variables as the independent variables are
presented below.
The various residual plots are as shown below.

The coefficient of partial determinations and are 0.3301,
and 0.0594, respectively.
The coefficient of determination for the regression model using each
of the 2 independent variables as the dependent variable and the
other independent variable as independent variables ( ) are,
respectively 0.0077, and 0.0077.
A) Independence of errors
B) Normality of errors
C) Equal variance
D) None of the above
The connotation “expected value” or “expected gain” from playing roulette at a casino
means
A) the amount you expect to “gain” on a single play.
B) the amount you expect to “gain” in the long run over many plays.
C) the amount you need to “break even” over many plays.
D) the amount you should expect to gain if you are lucky.
It is desired to estimate the mean total compensation of CEOs in the Service industry.
Data were randomly collected from 18 CEOs and the 95% confidence interval was
calculated to be ($2,181,260, $5,836,180). Which of the following interpretations is
correct?
A) 95% of the sampled total compensation values fell between $2,181,260 and
$5,836,180.
B) We are 95% confident that the mean of the sampled CEOs falls in the interval
$2,181,260 to $5,836,180.
C) In the population of Service industry CEOs, 95% of them will have total
compensations that fall in the interval $2,181,260 to $5,836,180.
D) We are 95% confident that the mean total compensation of all CEOs in the Service
industry falls in the interval $2,181,260 to $5,836,180.
To obtain a sample of 10 books in the store, the manager walked to the first shelf next
to the cash register to pick the first 10 books on that shelf. This is an example of a
A) systematic sample.
B) simple random sample.
C) stratified sample.
D) convenience sample.
The collection of all possible events is called
A) a simple probability.
B) a sample space.
C) a joint probability.
D) the null set.
TABLE 12-1
A corporation randomly selects 150 salespeople and finds that 66% who have never
taken a self-improvement course would like such a course. The firm did a similar study
10 years ago in which 60% of a random sample of 160 salespeople wanted a
self-improvement course. The groups are assumed to be independent random samples.
Let and represent the true proportion of workers who would like to attend a
self-improvement course in the recent study and the past study, respectively.
Referring to Table 12-1, the company tests to determine at the 0.05 level whether the
population proportion has changed from the previous study. Which of the following is
most correct?
A) Reject the null hypothesis and conclude that the proportion of employees who are
interested in a self-improvement course has changed over the intervening 10 years.
B) Do not reject the null hypothesis and conclude that the proportion of employees who

are interested in a self-improvement course has not changed over the intervening 10
years.
C) Reject the null hypothesis and conclude that the proportion of employees who are
interested in a self-improvement course has increased over the intervening 10 years.
D) Do not reject the null hypothesis and conclude that the proportion of employees who
are interested in a self-improvement course has increased over the intervening 10 years.
A powerful women’s group has claimed that men and women differ in attitudes about
sexual discrimination. A group of 50 men (group 1) and 40 women (group 2) were
asked if they thought sexual discrimination is a problem in the United States. Of those
sampled, 11 of the men and 19 of the women did believe that sexual discrimination is a
problem. Which of the following tests will you use to find out if there is any difference
in attitudes about sexual discrimination?
A) Pooled-variance t test
B) Paired t test
C) Z test for difference in proportions
D) Wilcoxon rank sum test
TABLE 17-6
A weight-loss clinic wants to use regression analysis to build a model for weight loss of
a client (measured in pounds). Two variables thought to affect weight loss are client’s
length of time on the weight-loss program and time of session. These variables are
described below:
Y = Weight loss (in pounds)
X1 = Length of time in weight-loss program (in months)
X2 = 1 if morning session, 0 if not
X3 = 1 if afternoon session, 0 if not (Base level = evening session)
Data for 12 clients on a weight-loss program at the clinic were collected and used to fit
the interaction model:
Y = β0 + β1X1 + β2X2 + β3X3 + β4X1X2 + β5X1X3 + ε
Partial output from Microsoft Excel follows:
Regression Statistics
ANOVA
F = 5.41118 Significance F = 0.040201
Referring to Table 17-6, what is the experimental unit for this analysis?
A) a clinic
B) a client on a weight-loss program
C) a month
D) a morning, afternoon, or evening session
TABLE 5-3
The following table contains the probability distribution for X = the number of
retransmissions necessary to successfully transmit a 1024K data package through a
double satellite media.
Referring to Table 5-3, the variance for the number of retransmissions is ________.
In purchasing an automobile, there are a number of variables to consider. The body
style of the car (sedan, coupe, wagon, etc.) is an example of a ________ variable.
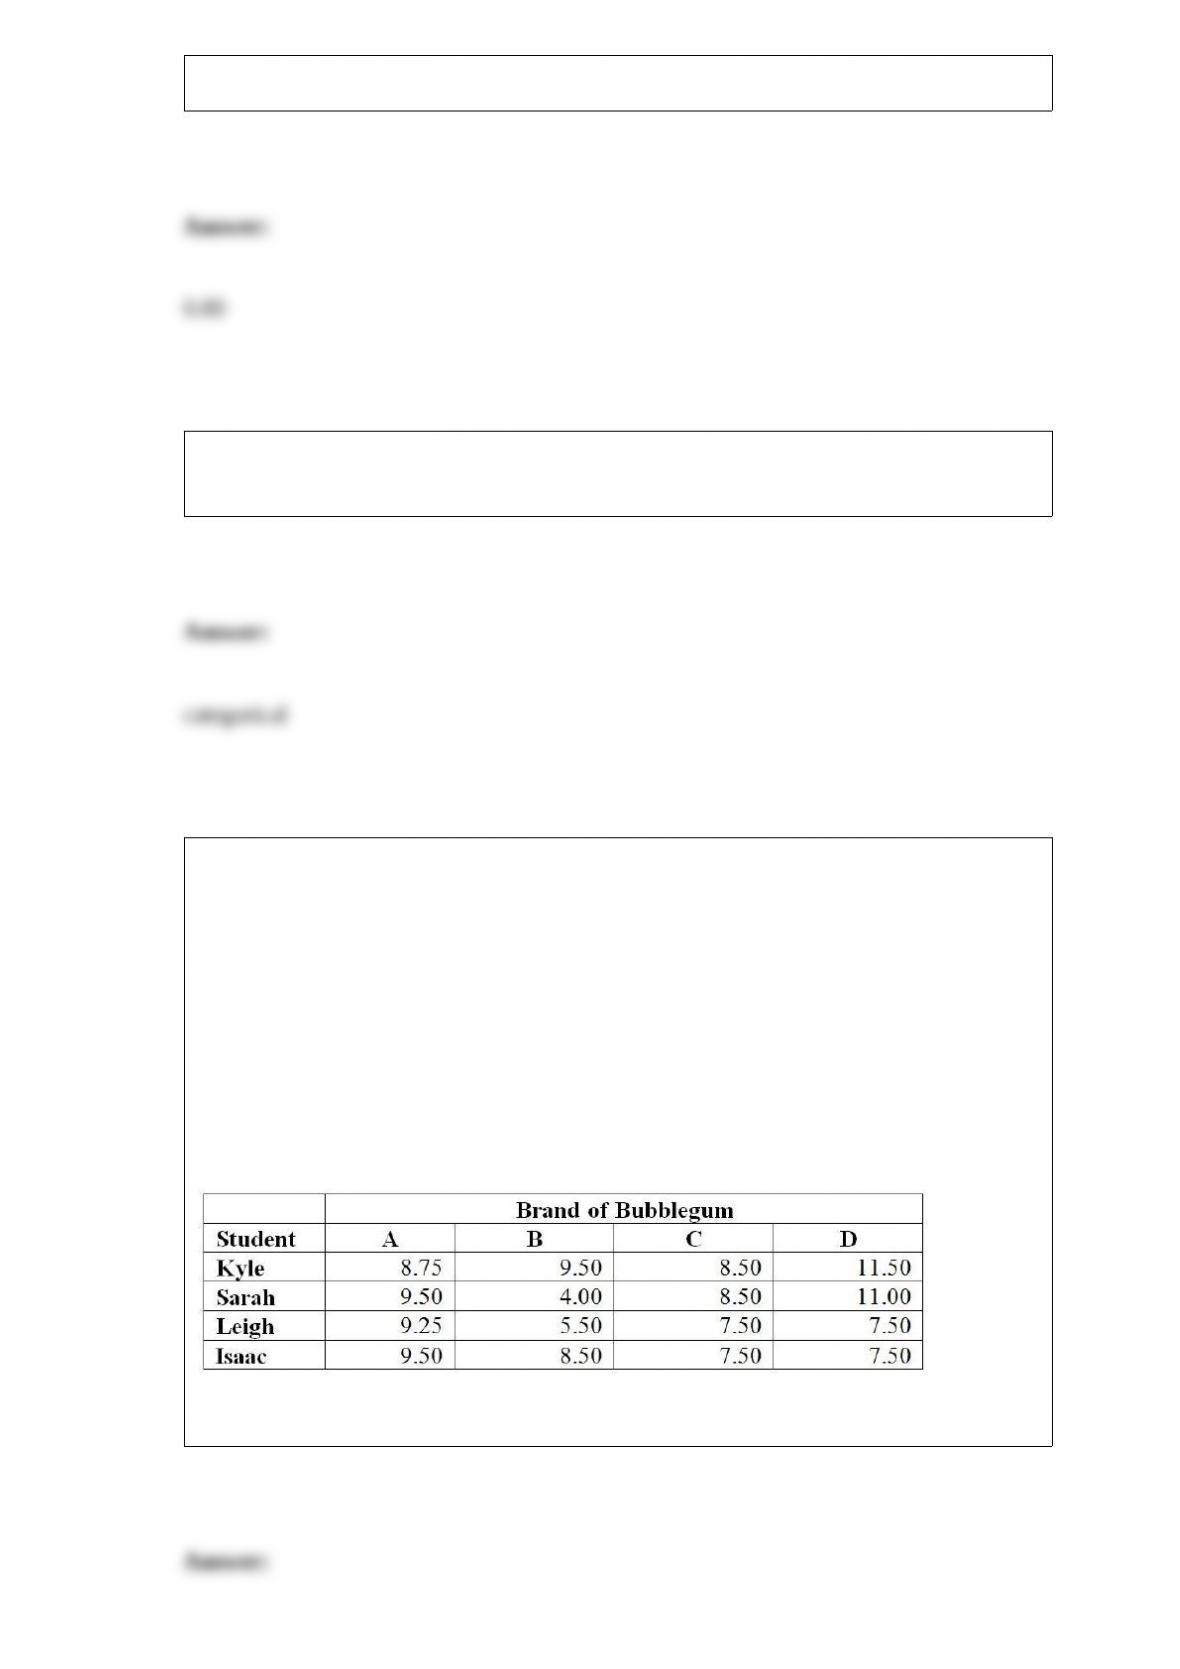
TABLE 11-11
A student team in a business statistics course designed an experiment to investigate
whether the brand of bubblegum used affected the size of bubbles they could blow. To
reduce the person-to-person variability, the students decided to use a randomized block
design using themselves as blocks.
Four brands of bubblegum were tested. A student chewed two pieces of a brand of gum
and then blew a bubble, attempting to make it as big as possible. Another student
measured the diameter of the bubble at its biggest point. The following table gives the
diameters of the bubbles (in inches) for the 16 observations.
Referring to Table 11-11, what is the estimated relative efficiency?
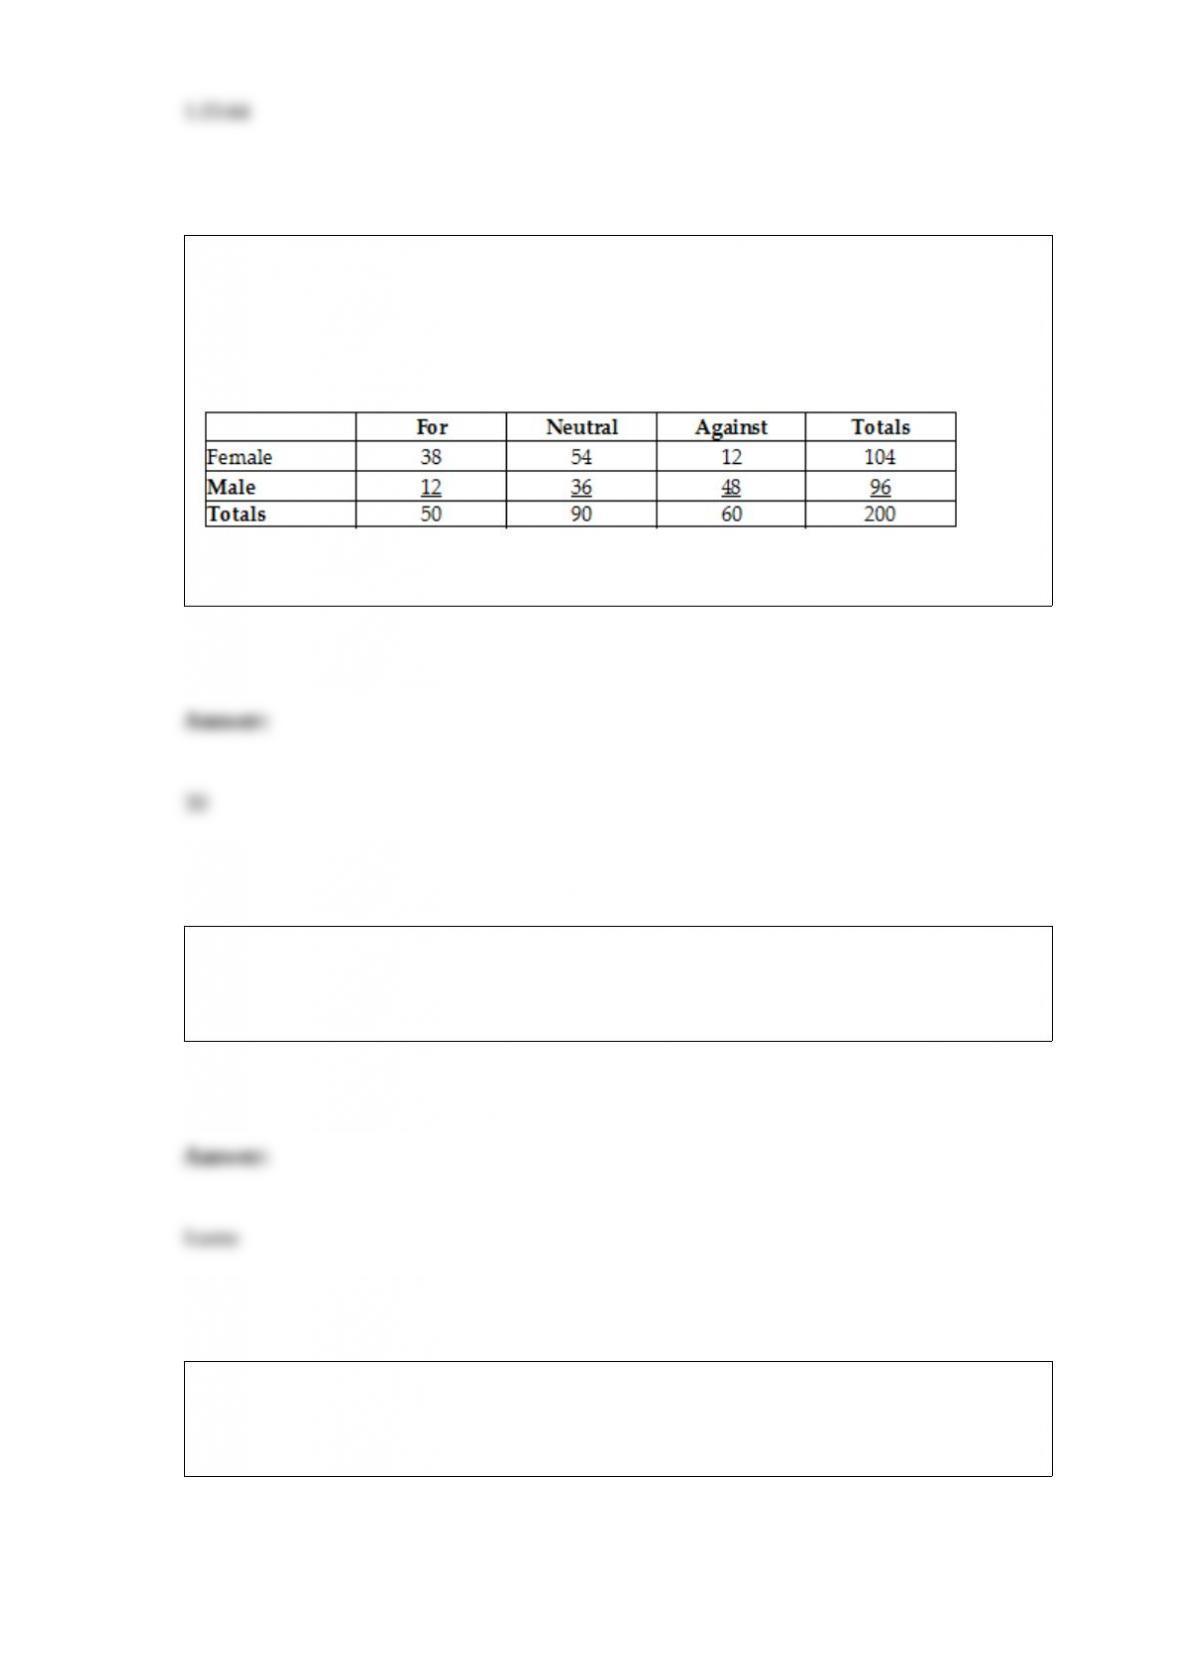
TABLE 2-12
The table below contains the opinions of a sample of 200 people broken down by
gender about the latest congressional plan to eliminate anti-trust exemptions for
professional baseball.
Referring to Table 2-12, ________ percent of the 200 were against the plan.
To estimate the mean number of hours a student at a major university spent in the
library, a researcher obtained the list of students from the registrar’s office, from which
she can select a random sample of 200 students. This list is a ________.
TABLE 16-4
The number of cases of merlot wine sold by a Paso Robles winery in an 8-year period
follows.
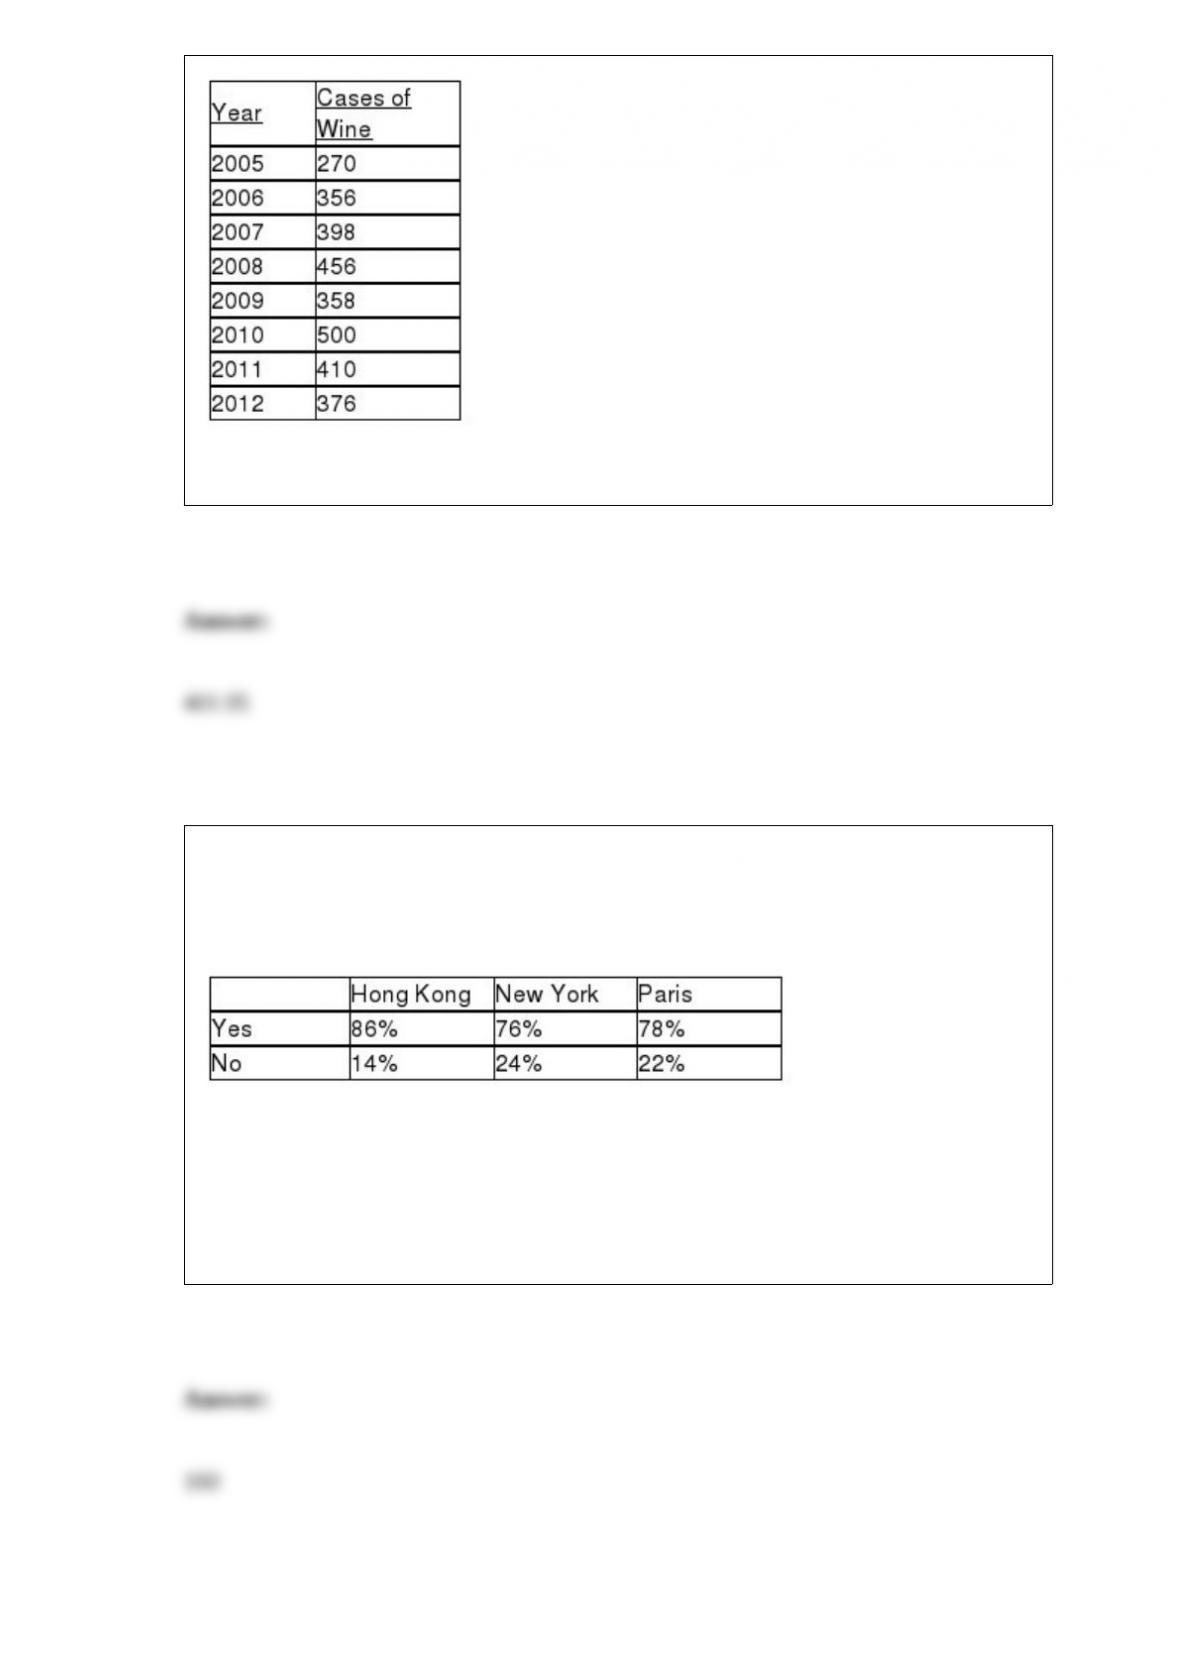
Referring to Table 16-4, exponential smoothing with a weight or smoothing constant of
0.4 will be used to forecast wine sales. The forecast for 2013 is ________.
TABLE 12-7
Data on the percentage of 200 hotels in each of the three large cities across the world on
whether minibar charges are correctly posted at checkout are given below.
At the 0.05 level of significance, you want to know if there is evidence of a difference
in the proportion of hotels that correctly post minibar charges among the three cities.
Referring to Table 12-7, the expected cell frequency for the Hong Kong/Yes cell is
________.

Referring to Table 17-12, what is the estimated probability that a 48-year-old home
owner with a family income of $100,000, a lawn size of 5,000 square feet, a positive
attitude toward outdoor recreation, and two teenagers in the household will purchase a
lawn service?