True or False: TABLE 17-11
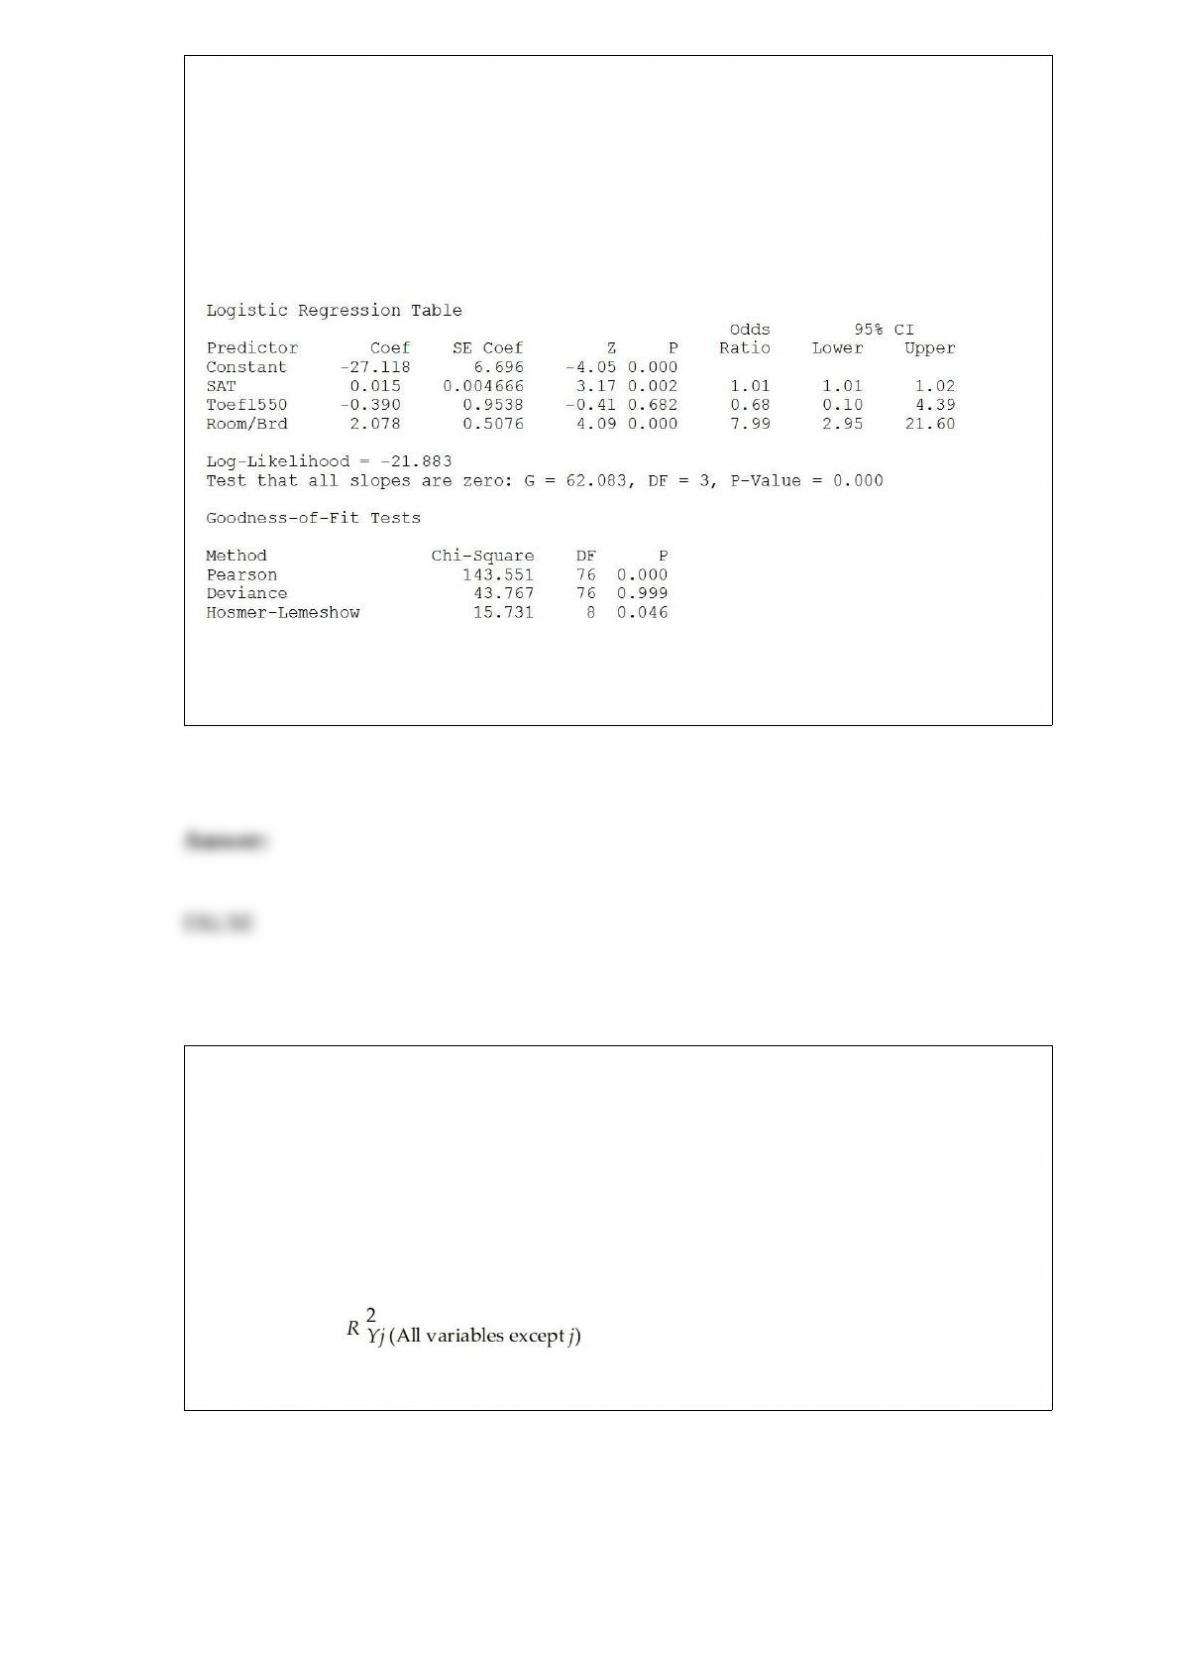
A logistic regression model was estimated in order to predict the probability that a
randomly chosen university or college would be a private university using information
on mean total Scholastic Aptitude Test score (SAT) at the university or college, the
room and board expense measured in thousands of dollars (Room/Brd), and whether the
TOEFL criterion is at least 550 (Toefl550 = 1 if yes, 0 otherwise.) The dependent
variable, Y, is school type (Type = 1 if private and 0 otherwise).
Referring to Table 17-11, there is not enough evidence to conclude that SAT score
makes a significant contribution to the model in the presence of the other independent
variables at a 0.05 level of significance.
True or False: TABLE 17-10
Given below are results from the regression analysis where the dependent variable is
the number of weeks a worker is unemployed due to a layoff (Unemploy) and the
independent variables are the age of the worker (Age), the number of years of education
received (Edu), the number of years at the previous job (Job Yr), a dummy variable for
marital status (Married: 1 = married, 0 = otherwise), a dummy variable for head of
household (Head: 1 = yes, 0 = no) and a dummy variable for management position
(Manager: 1 = yes, 0 = no). We shall call this Model 1. The coefficient of partial
determination ( ) of each of the 6 predictors are, respectively,
0.2807, 0.0386, 0.0317, 0.0141, 0.0958, and 0.1201.
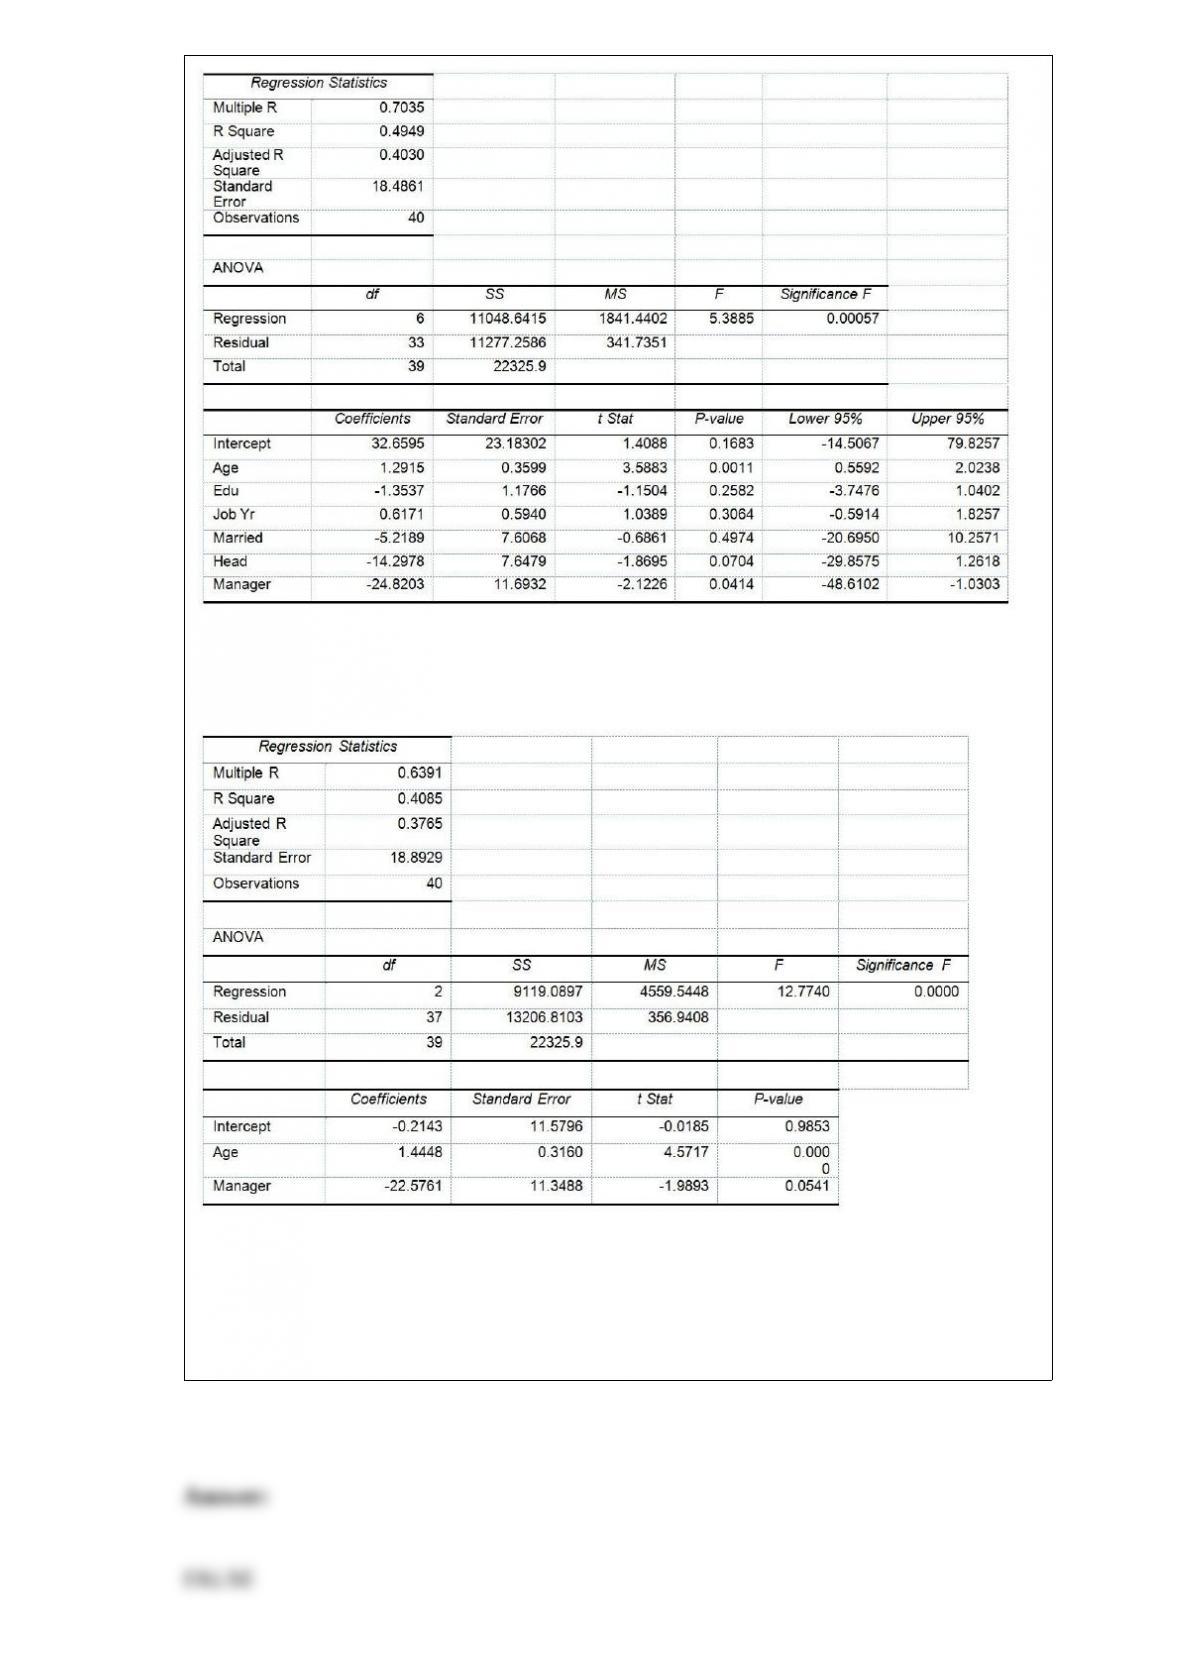
Model 2 is the regression analysis where the dependent variable is Unemploy and the
independent variables are Age and Manager. The results of the regression analysis are
given below:
Referring to Table 17-10, Model 1, we can conclude that, holding constant the effect of
the other independent variables, the number of years of education received has no
impact on the mean number of weeks a worker is unemployed due to a layoff at a 10%
level of significance if all we have is the information on the 95% confidence interval
estimate forβ2.
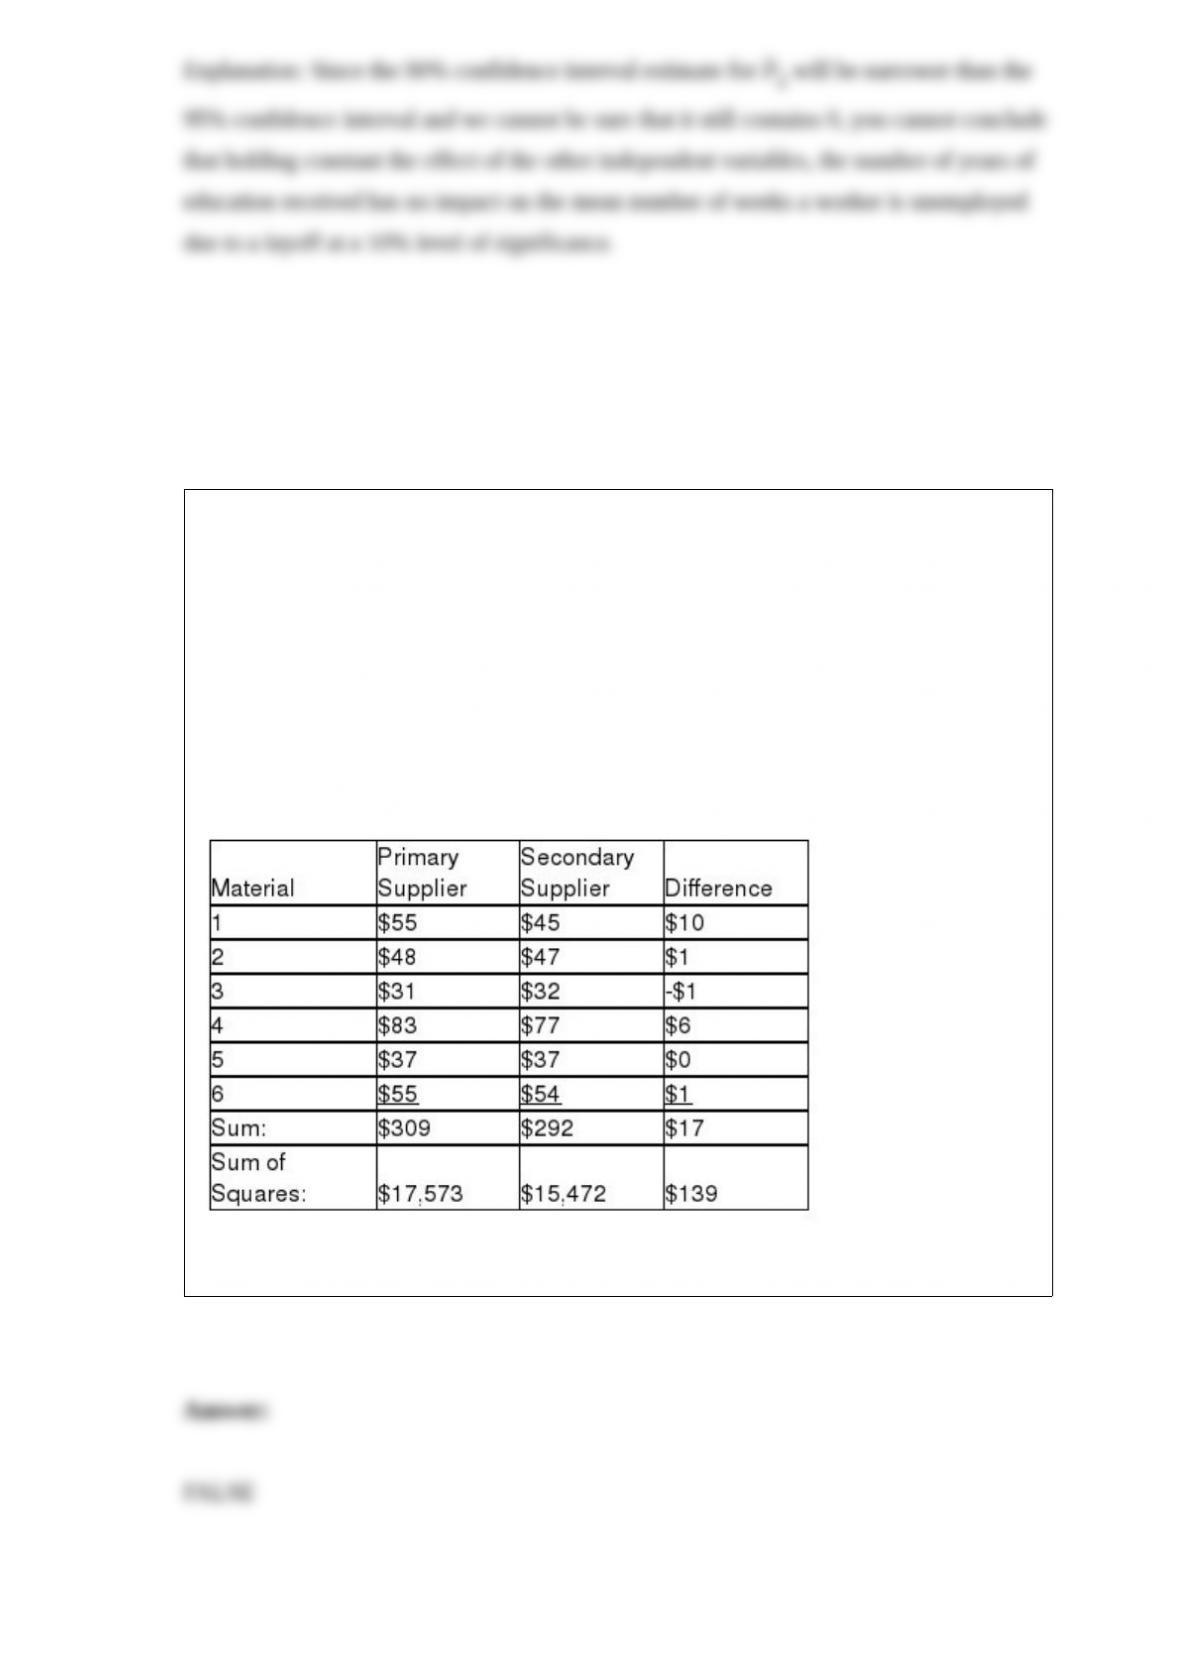
TABLE 10-7
A buyer for a manufacturing plant suspects that his primary supplier of raw materials is
overcharging. In order to determine if his suspicion is correct, he contacts a second
supplier and asks for the prices on various identical materials. He wants to compare
these prices with those of his primary supplier. The data collected is presented in the
table below, with some summary statistics presented (all of these might not be
necessary to answer the questions which follow). The buyer believes that the
differences are normally distributed and will use this sample to perform an appropriate
test at a level of significance of 0.01.
True or False: Referring to Table 10-7, the null hypothesis should be rejected.
True or False: TABLE 17-10
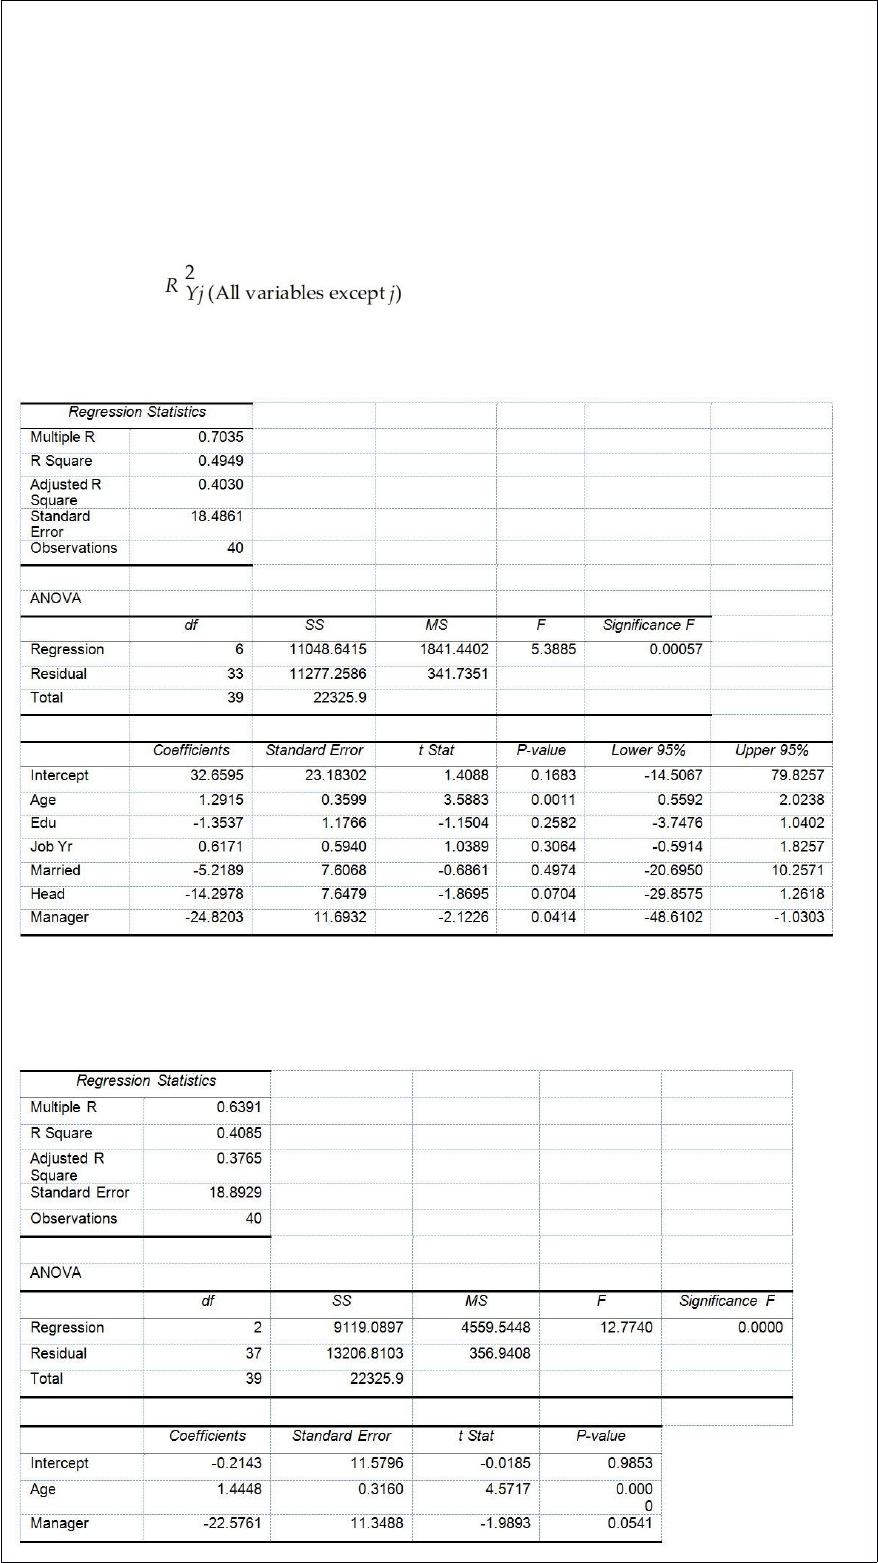
Given below are results from the regression analysis where the dependent variable is
the number of weeks a worker is unemployed due to a layoff (Unemploy) and the
independent variables are the age of the worker (Age), the number of years of education
received (Edu), the number of years at the previous job (Job Yr), a dummy variable for
marital status (Married: 1 = married, 0 = otherwise), a dummy variable for head of
household (Head: 1 = yes, 0 = no) and a dummy variable for management position
(Manager: 1 = yes, 0 = no). We shall call this Model 1. The coefficient of partial
determination ( ) of each of the 6 predictors are, respectively,
0.2807, 0.0386, 0.0317, 0.0141, 0.0958, and 0.1201.
Model 2 is the regression analysis where the dependent variable is Unemploy and the
independent variables are Age and Manager. The results of the regression analysis are
given below:
Referring to Table 17-10 and using both Model 1 and Model 2, there is insufficient
evidence to conclude that the independent variables that are not significant individually
are significant as a group in explaining the variation in the dependent variable at a 5%
level of significance.
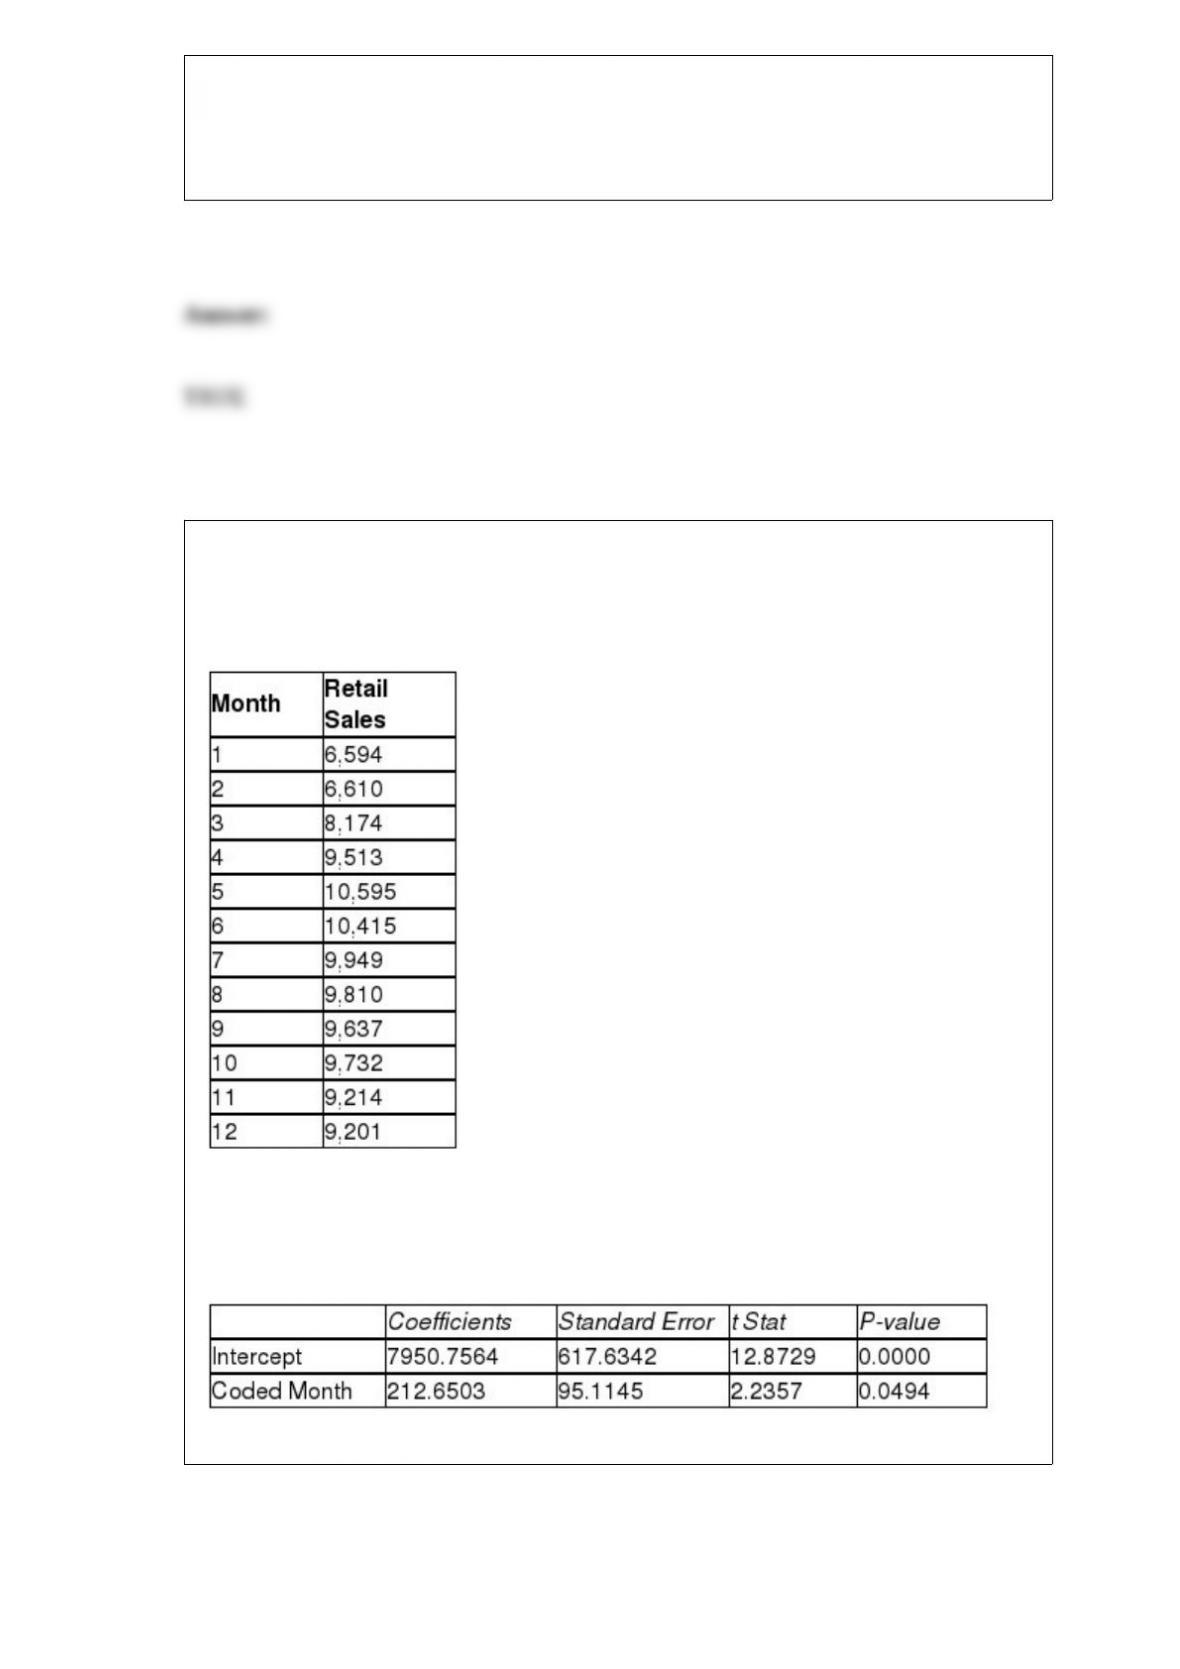
TABLE 16-13
Given below is the monthly time-series data for U.S. retail sales of building materials
over a specific year.
The results of the linear trend, quadratic trend, exponential trend, first-order
autoregressive, second-order autoregressive and third-order autoregressive model are
presented below in which the coded month for the 1st month is 0:
Linear trend model:
Quadratic trend model:
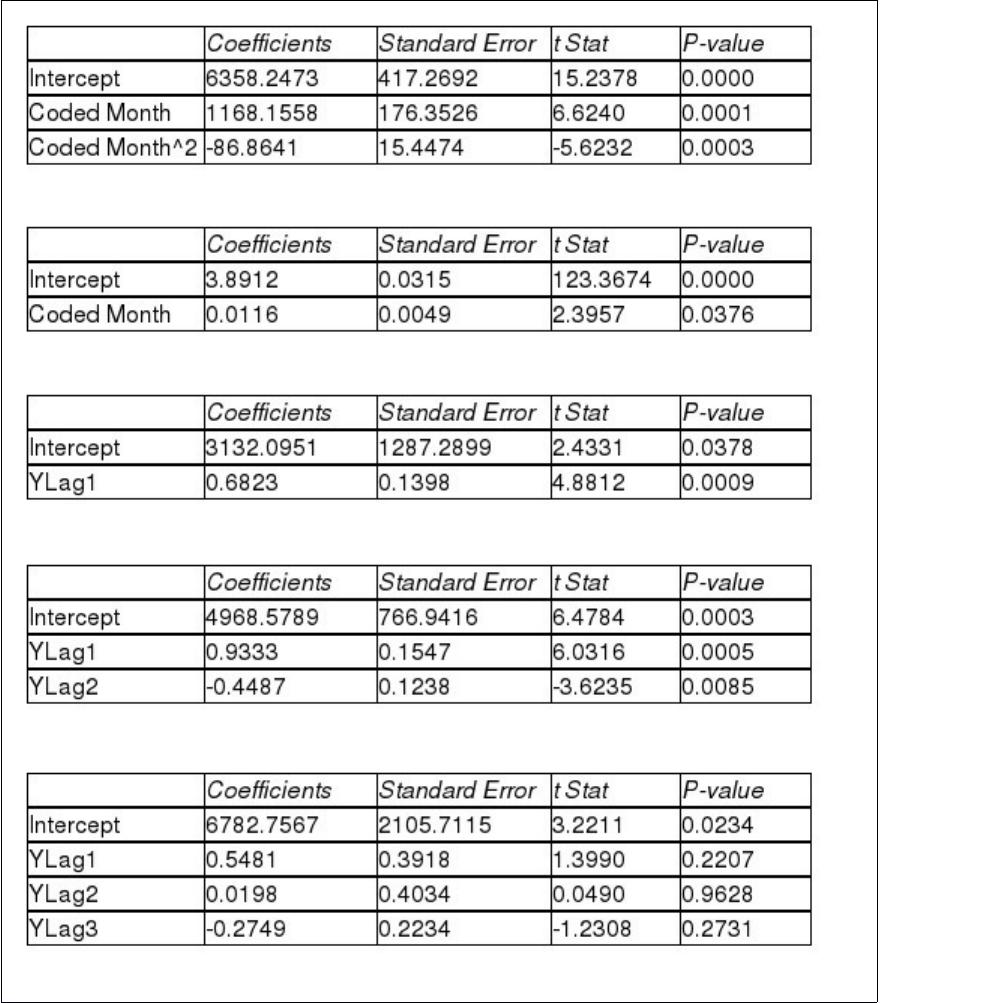
Exponential trend model:
First-order autoregressive:
Second-order autoregressive:
Third-order autoregressive:
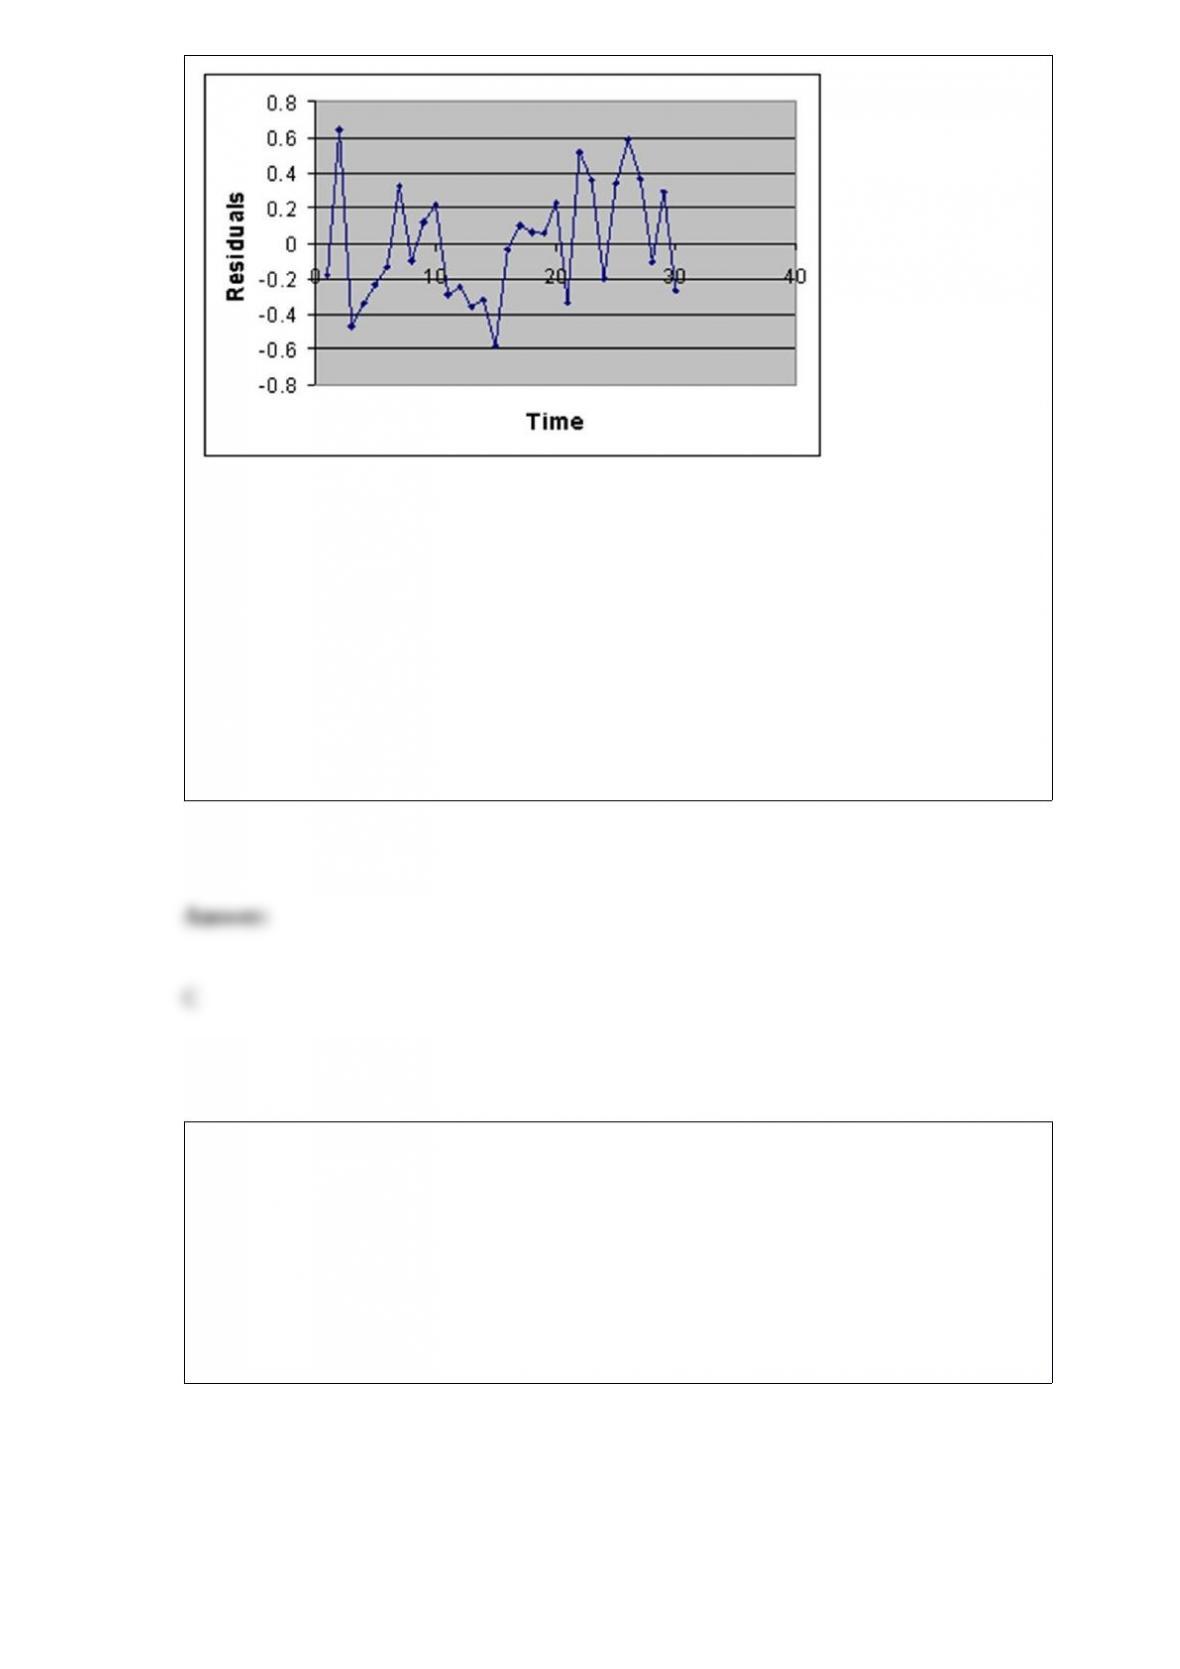
Below is the residual plot of the various models:
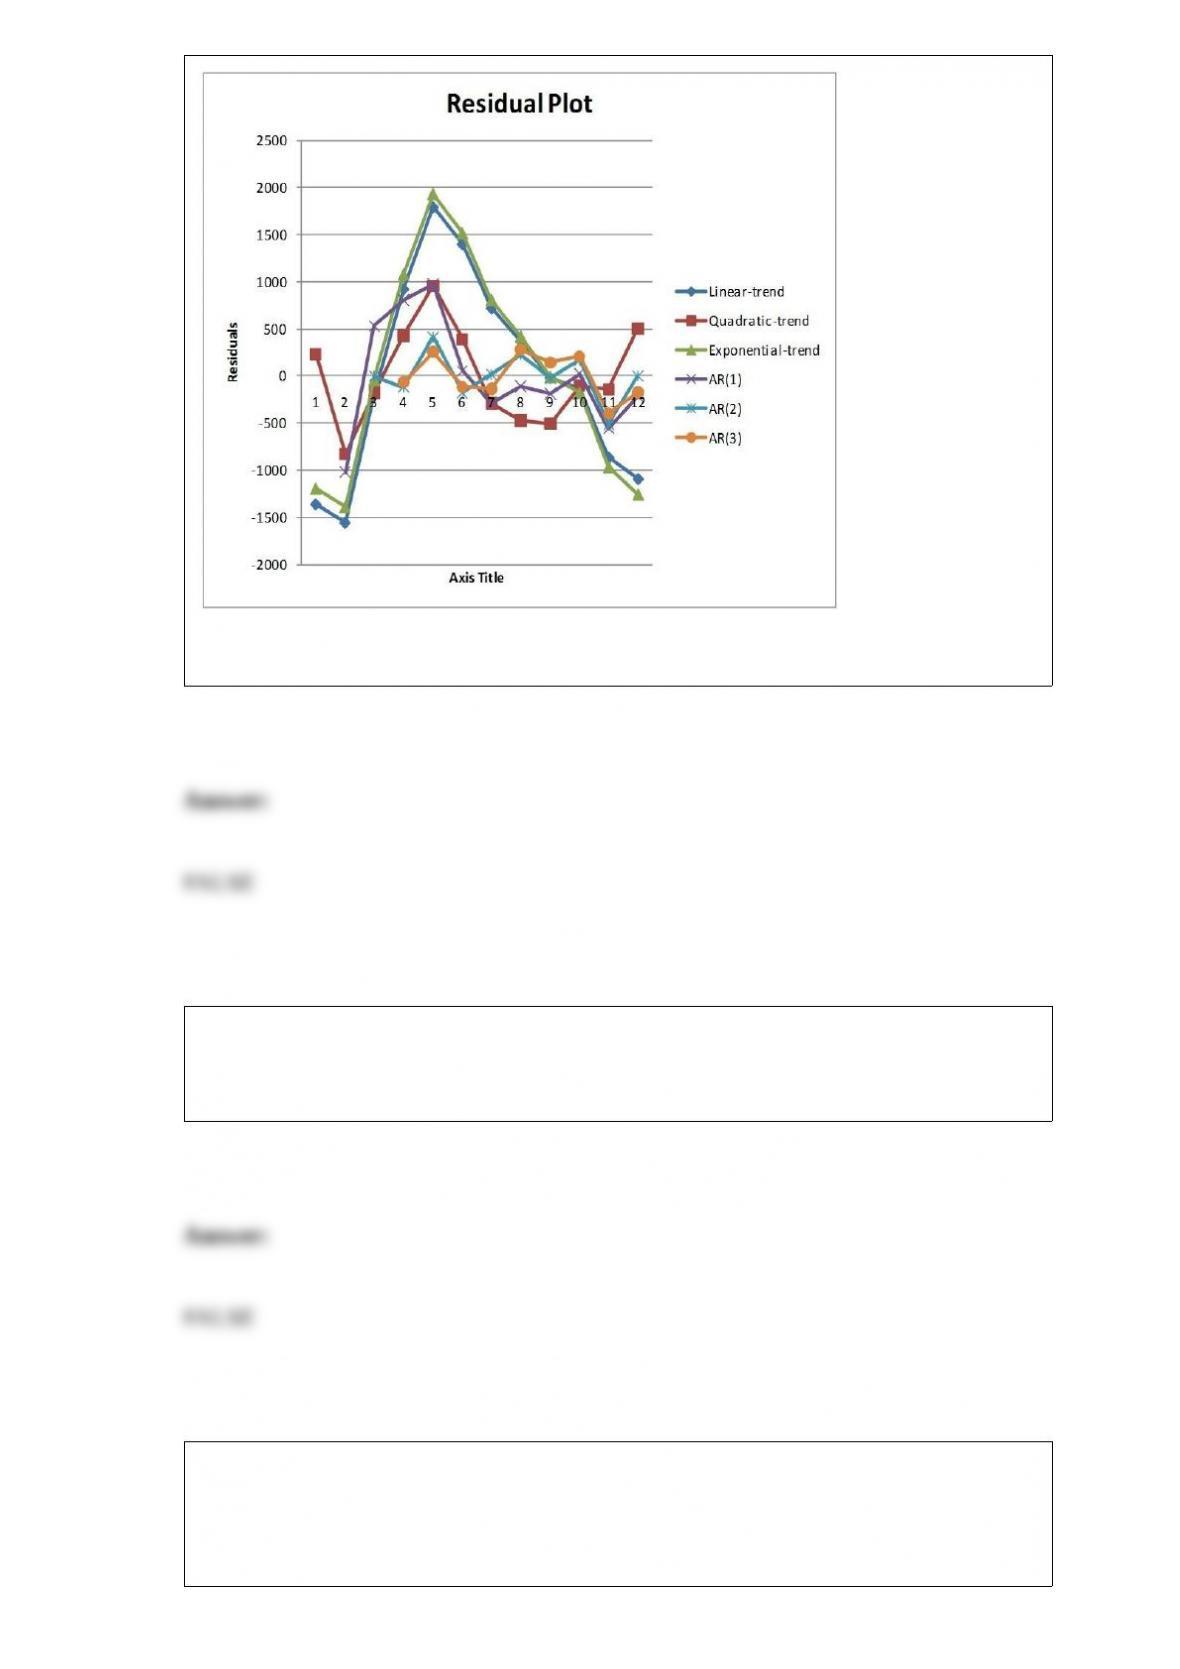
True or False: Referring to Table 16-13, you can conclude that the third-order
autoregressive model is appropriate at the 5% level of significance.
True or False: If you randomly select a student from the first row of a business statistics
class and then every other fifth student thereafter until you get a sample of 20 students,
this is an example of a convenience sample.
TABLE 12-20
A filling machine at a local soft drinks company is calibrated to fill the cans at a mean
amount of 12 fluid ounces and a standard deviation of 0.5 ounces. The company wants
to test whether the standard deviation of the amount filled by the machine is 0.5 ounces.
A random sample of 15 cans filled by the machine reveals a standard deviation of 0.67
ounces.
True or False: Referring to Table 12-20, the decision is to reject the null hypothesis
when using a 10% level of significance.
True or False: The confidence interval obtained will always correctly estimate the
population parameter.
True or False: To determine the probability of getting more than 3 events of interest in a
binomial distribution, you will find the area under the normal curve for X = 3.5 and
above.
TABLE 14-17
Given below are results from the regression analysis where the

dependent variable is the number of weeks a worker is unemployed
due to a layo! (Unemploy) and the independent variables are the age
of the worker (Age) and a dummy variable for management position
(Manager: 1 = yes, 0 = no).
The results of the regression analysis are given below:
True or False: Referring to Table 14-17, we can conclude de.nitively
that, holding constant the e!ect of the other independent variable,
age has an impact on the mean number of weeks a worker is
unemployed due to a layo! at a 10% level of signi.cance if all we
have is the information of the 95% con.dence interval estimate for
the e!ect of a one year increase in age on the mean number of
weeks a worker is unemployed due to a layo!.
True or False: An interaction term in a multiple regression model may be used when the
relationship between X1 and Y changes for differing values of X2.
True or False: The C in the DCOVA framework stands for “categorize.”
TABLE 8-7
A hotel chain wants to estimate the mean number of rooms rented daily in a given
month. The population of rooms rented daily is assumed to be normally distributed for
each month with a standard deviation of 240 rooms. During February, a sample of 25
days has a sample mean of 370 rooms.
True or False: Referring to Table 8-7, a 90% confidence interval calculated from the
same data would be narrower than a 99% confidence interval.
True or False: If the sample sizes in each group is larger than 5, the Kruskal-Wallis rank
test statistic can be approximated by a chi-square distribution.
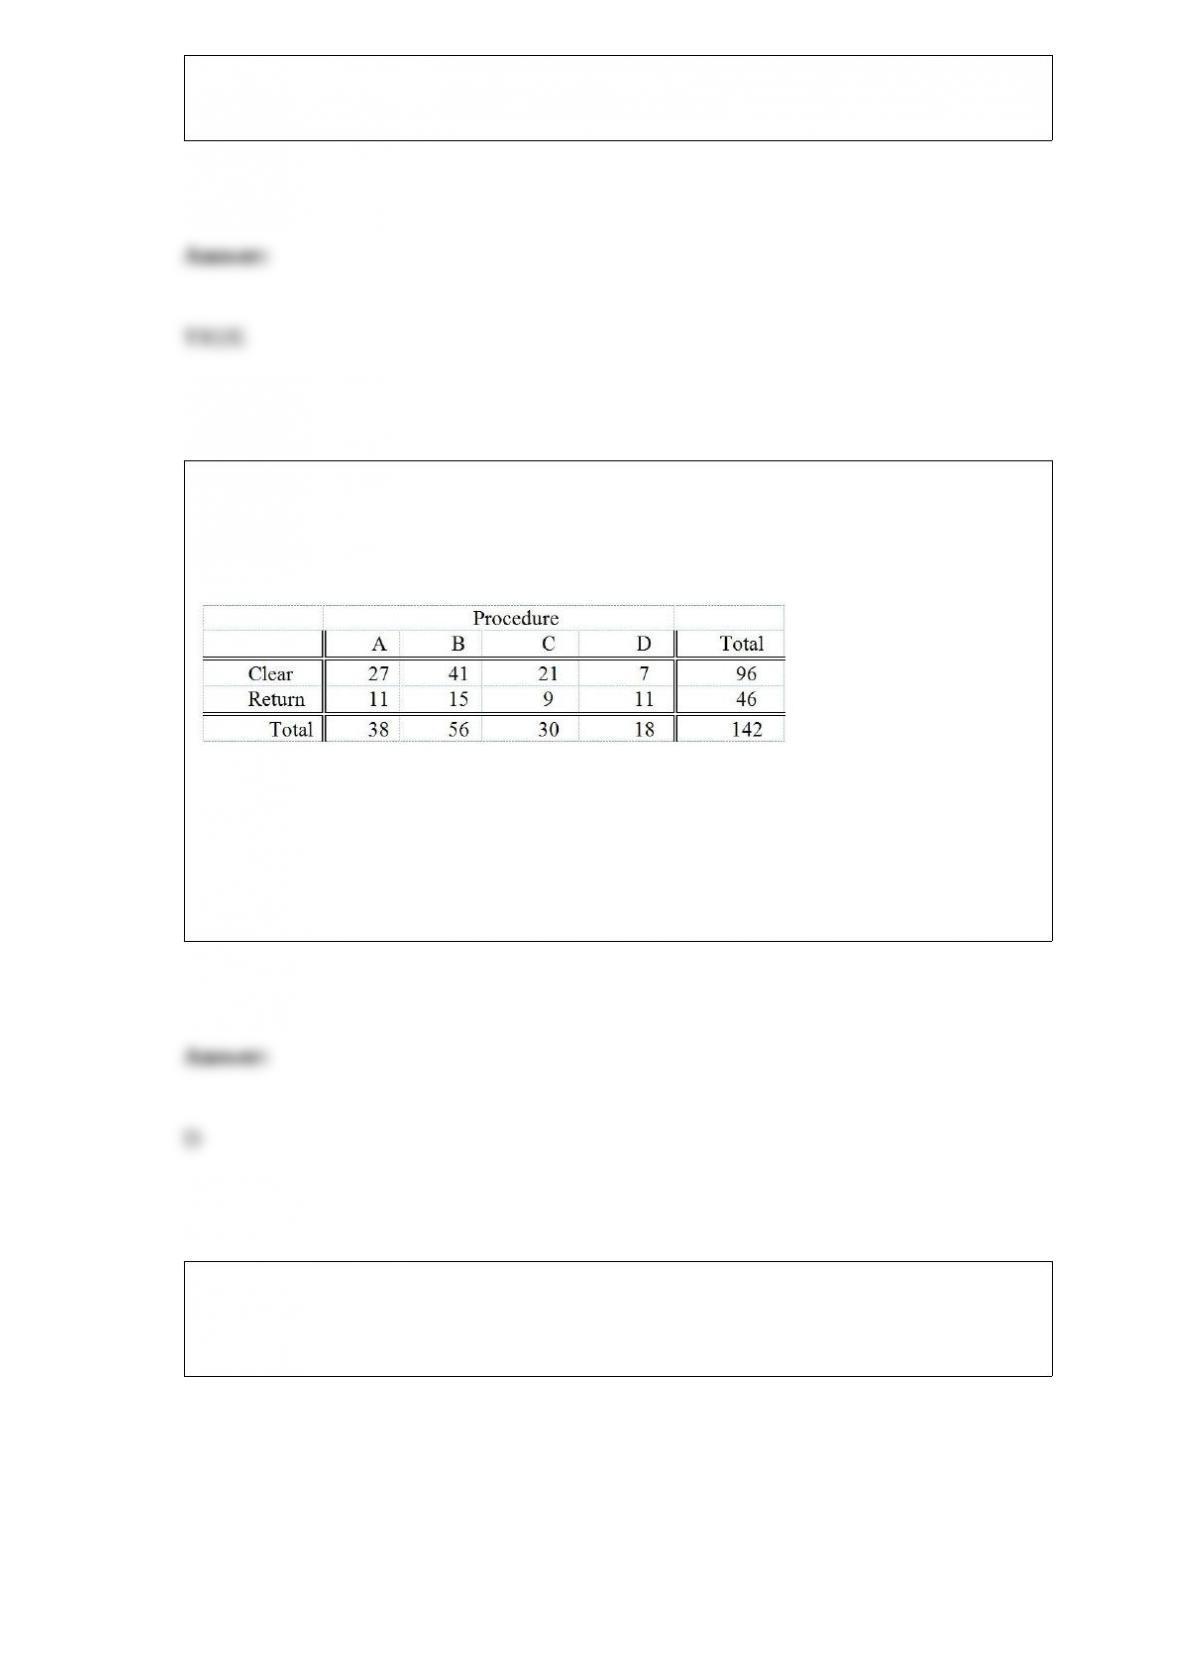
Four surgical procedures currently are used to install pacemakers. If the patient does not
need to return for follow-up surgery, the operation is called a “clear” operation. A heart
center wants to compare the 4 procedures, and collects the following numbers of
patients from their own records:
Which of the following tests will be the most appropriate to find out which of the 4
procedures is the most effective?
A) χ2 test for difference in proportions
B) Z test for difference in proportions
C) One-way ANOVA F test for differences among more than two means
D) The Marascuilo procedure
TABLE 16-3
The following table contains the number of complaints received in a department store
for the first 6 months of last year.
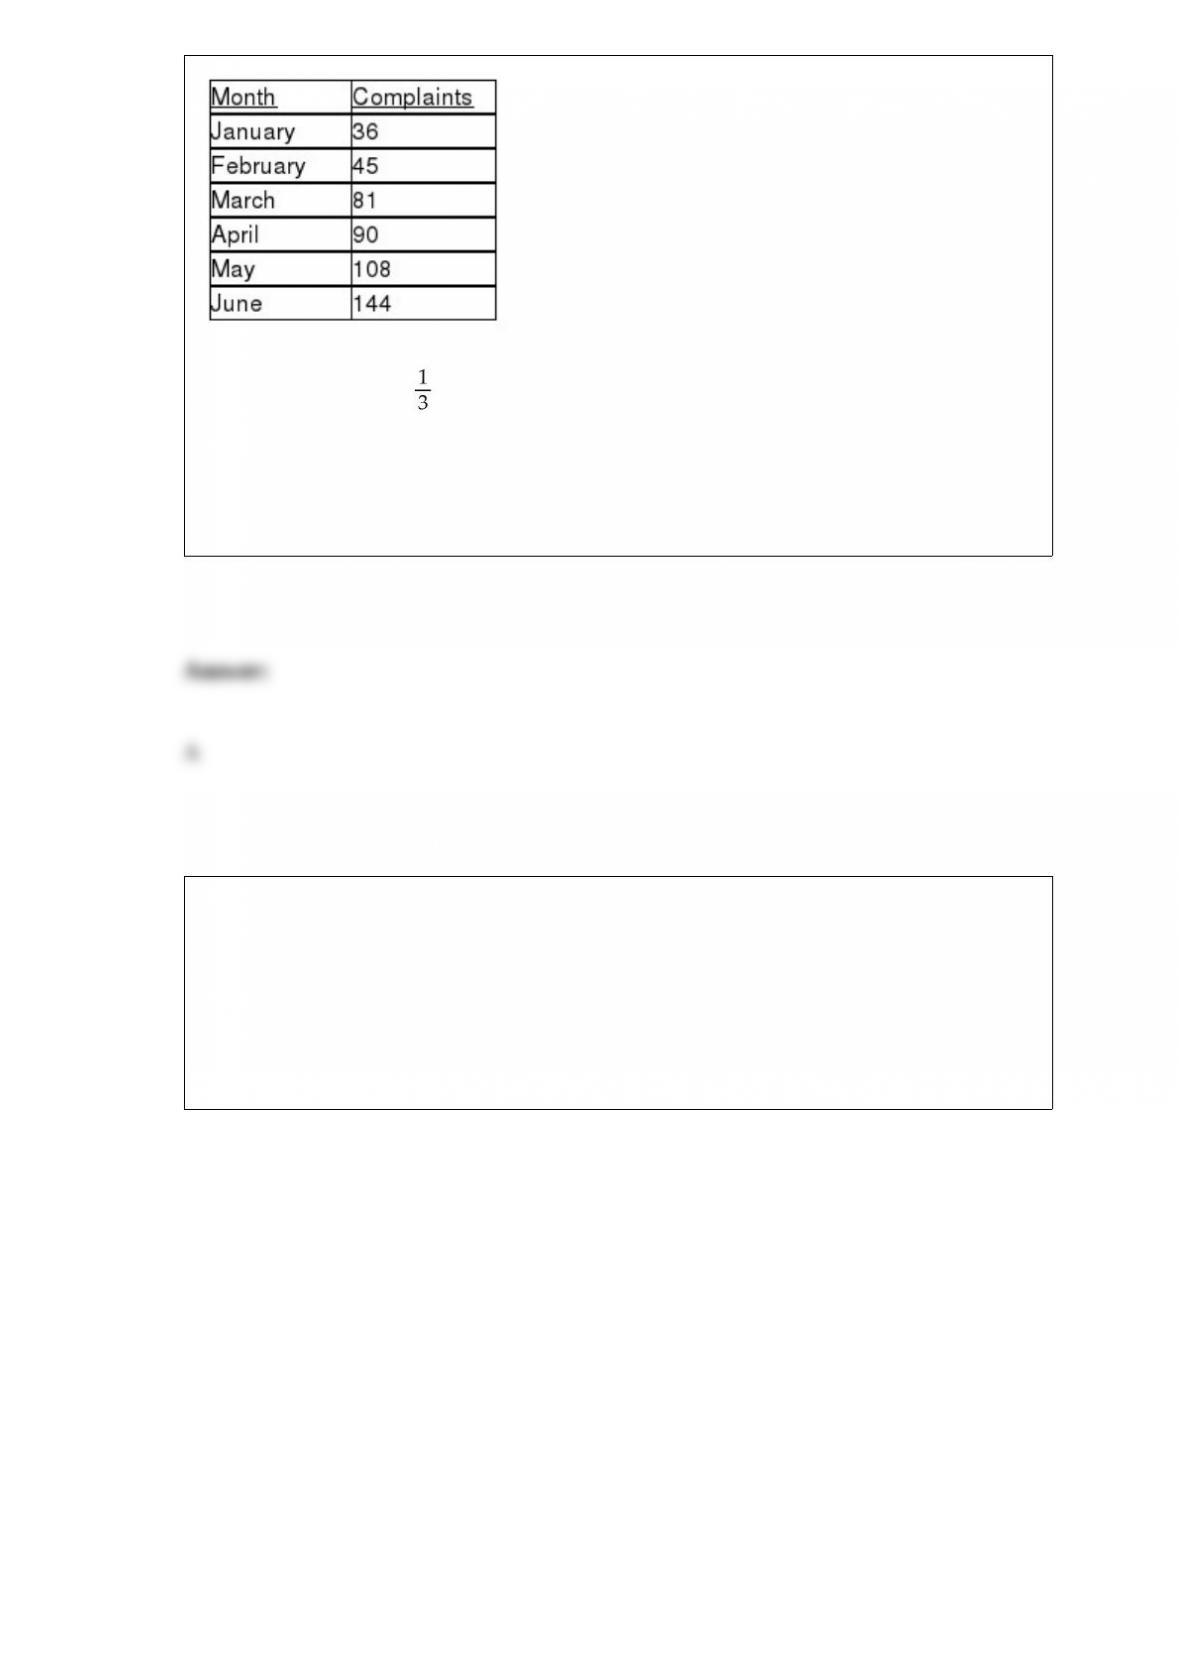
Referring to Table 16-3, if this series is smoothed using exponential smoothing with a
smoothing constant of , what would be the second value?
A) 39
B) 42
C) 45
D) 53
TABLE 13-12
The manager of the purchasing department of a large saving and loan organization
would like to develop a model to predict the amount of time (measured in hours) it
takes to record a loan application. Data are collected from a sample of 30 days, and the
number of applications recorded and completion time in hours is recorded. Below is the
regression output:
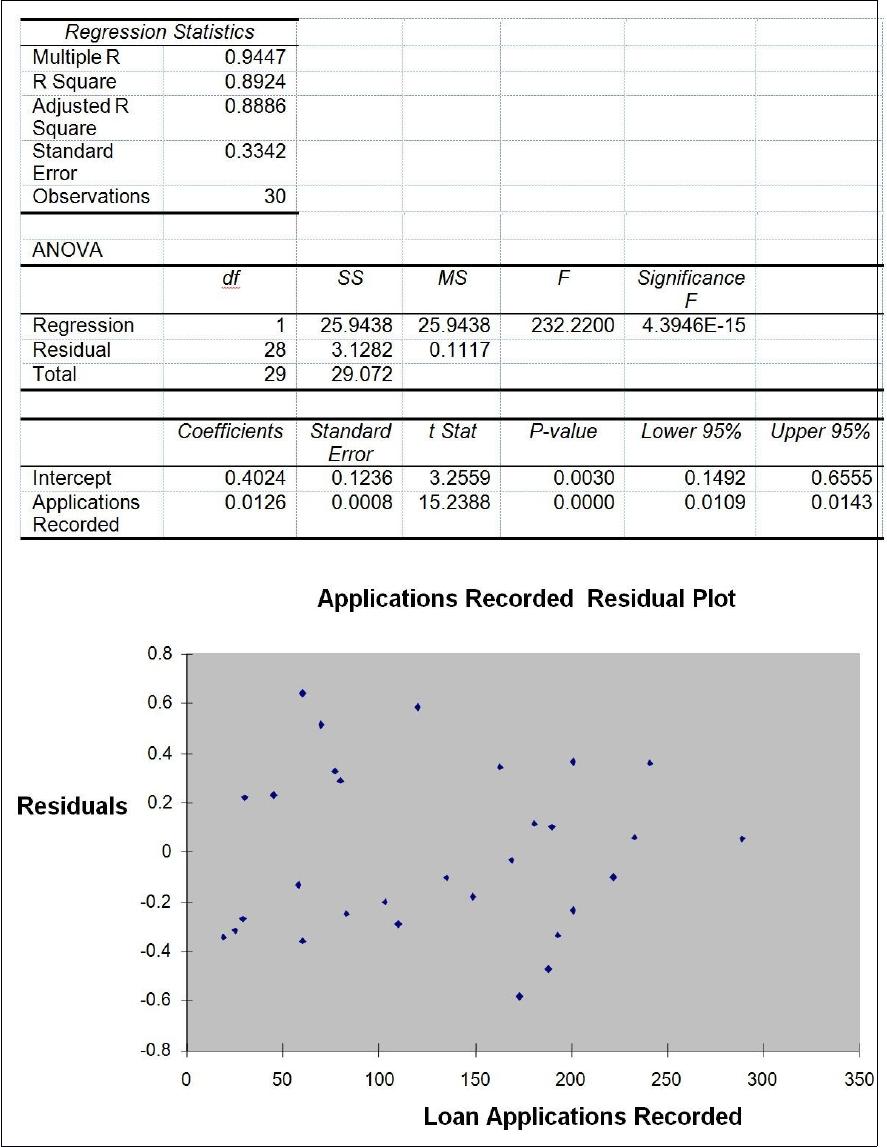
Referring to Table 13-12, the value of the measured t-test statistic to test whether the
amount of time depends linearly on the number of loan applications recorded is
A) 0.8924.
B) 3.2559.
C) 15.2388.
D) 232.2200.
Referring to Table 14-4, what fraction of the variability in house size is explained by
income and size of family?
TABLE 14-4
A real estate builder wishes to determine how house size (House) is influenced by
family income (Income) and family size (Size). House size is measured in hundreds of
square feet and income is measured in thousands of dollars. The builder randomly
selected 50 families and ran the multiple regression. Partial Microsoft Excel output is
provided below:
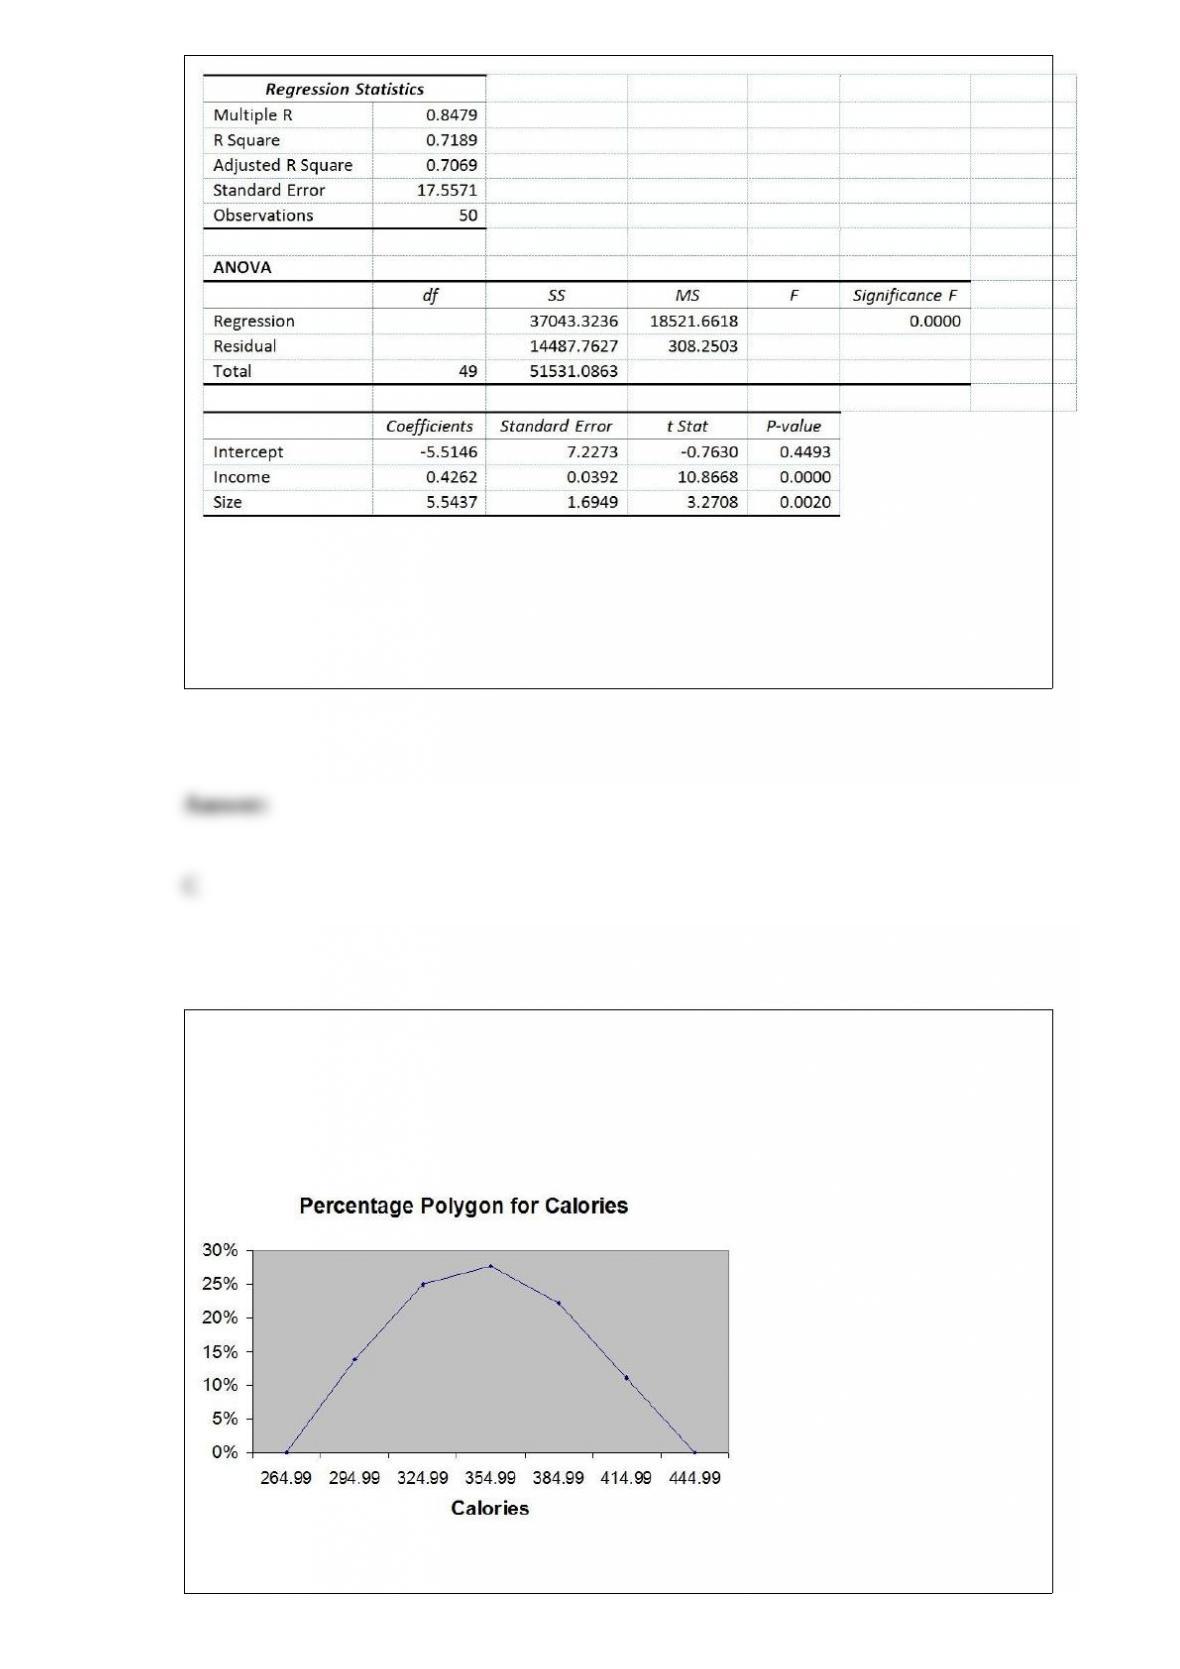
Also SSR (X1∣ X2) = 36400.6326 and SSR (X2∣ X1) = 3297.7917
A) 17.56%
B) 70.69%
C) 71.89%
D) 84.79%
TABLE 2-16
The figure below is the percentage polygon for the amount of calories for a sample of
36 pizza products where the upper limits of the intervals are: 310, 340, 370, 400 and
430.
Referring to Table 2-16, roughly what percentage of pizza products contains at least 340
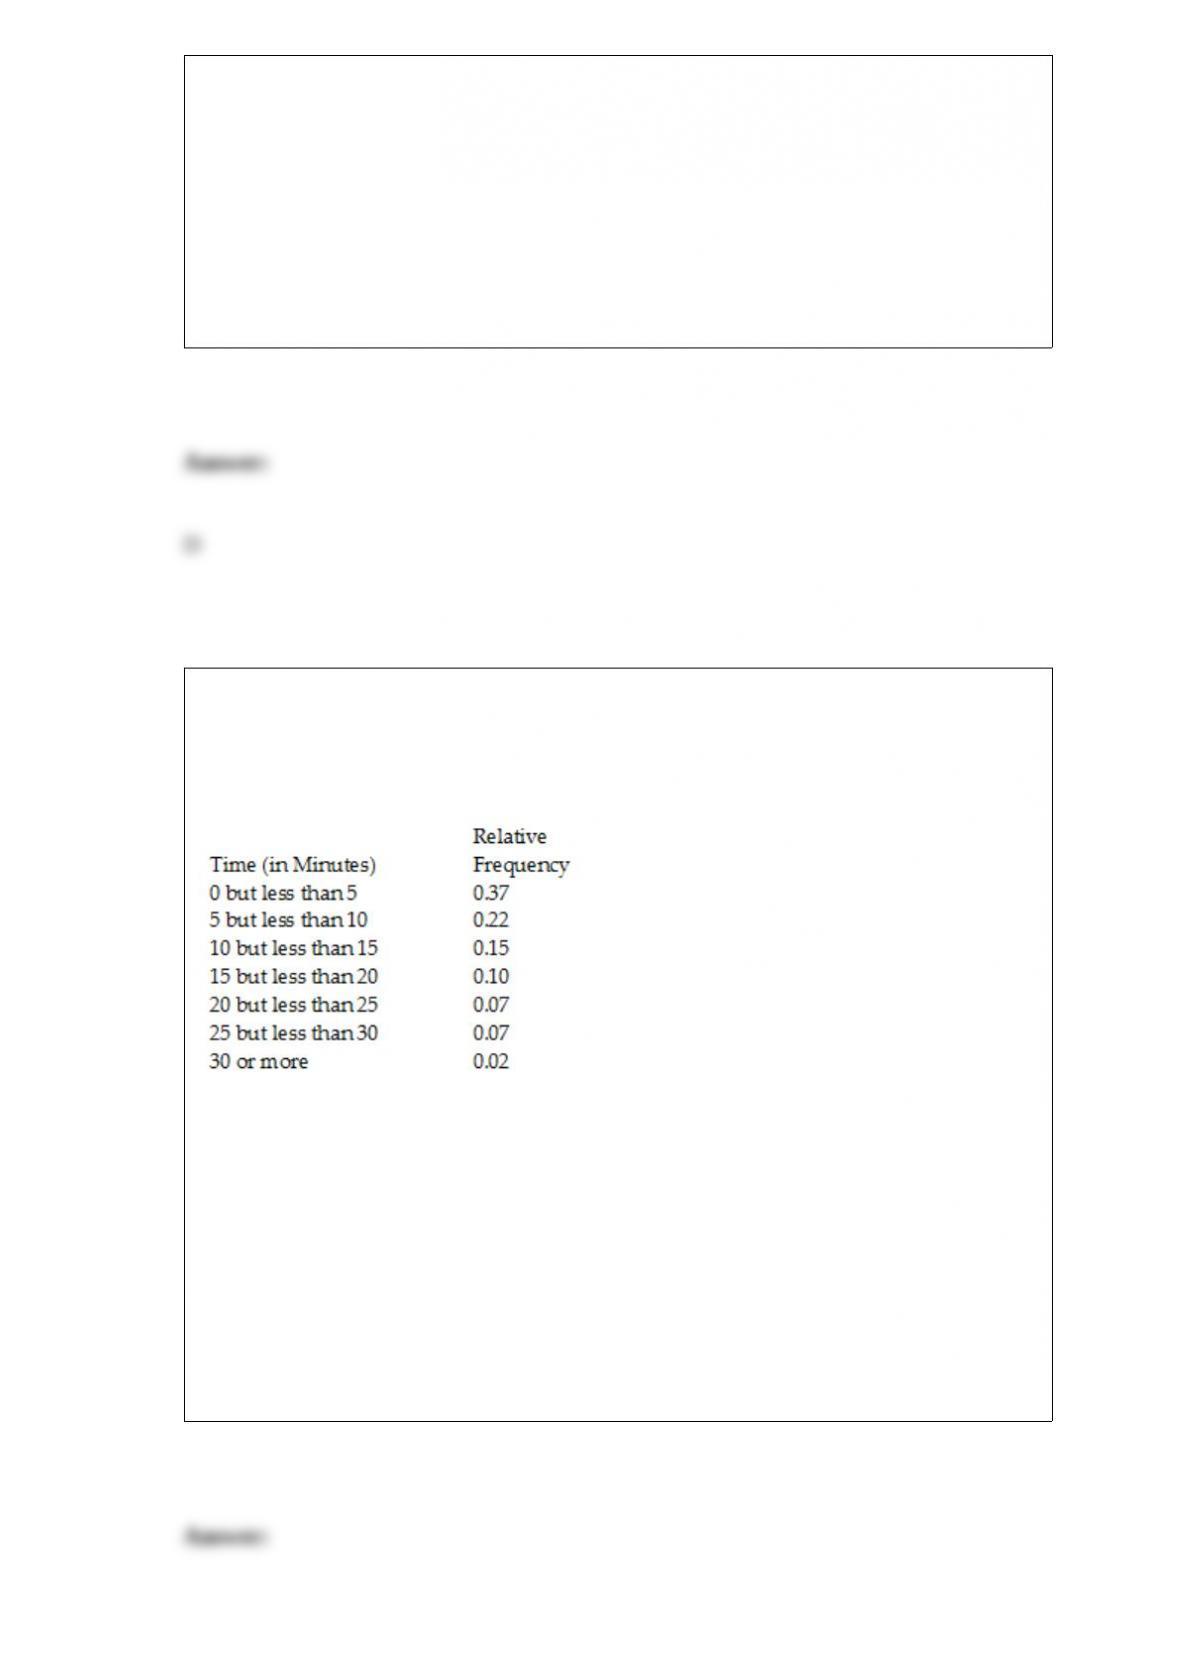
calories?
A) 25%
B) 28%
C) 39%
D) 61%
TABLE 2-5
The following are the duration in minutes of a sample of long-distance phone calls
made within the continental United States reported by one long-distance carrier.
Referring to Table 2-5, if 100 calls were sampled, ________ of them would have lasted
less than 5 minutes or at least 30 minutes or more.
A) 35
B) 37
C) 39
D) None of the above.
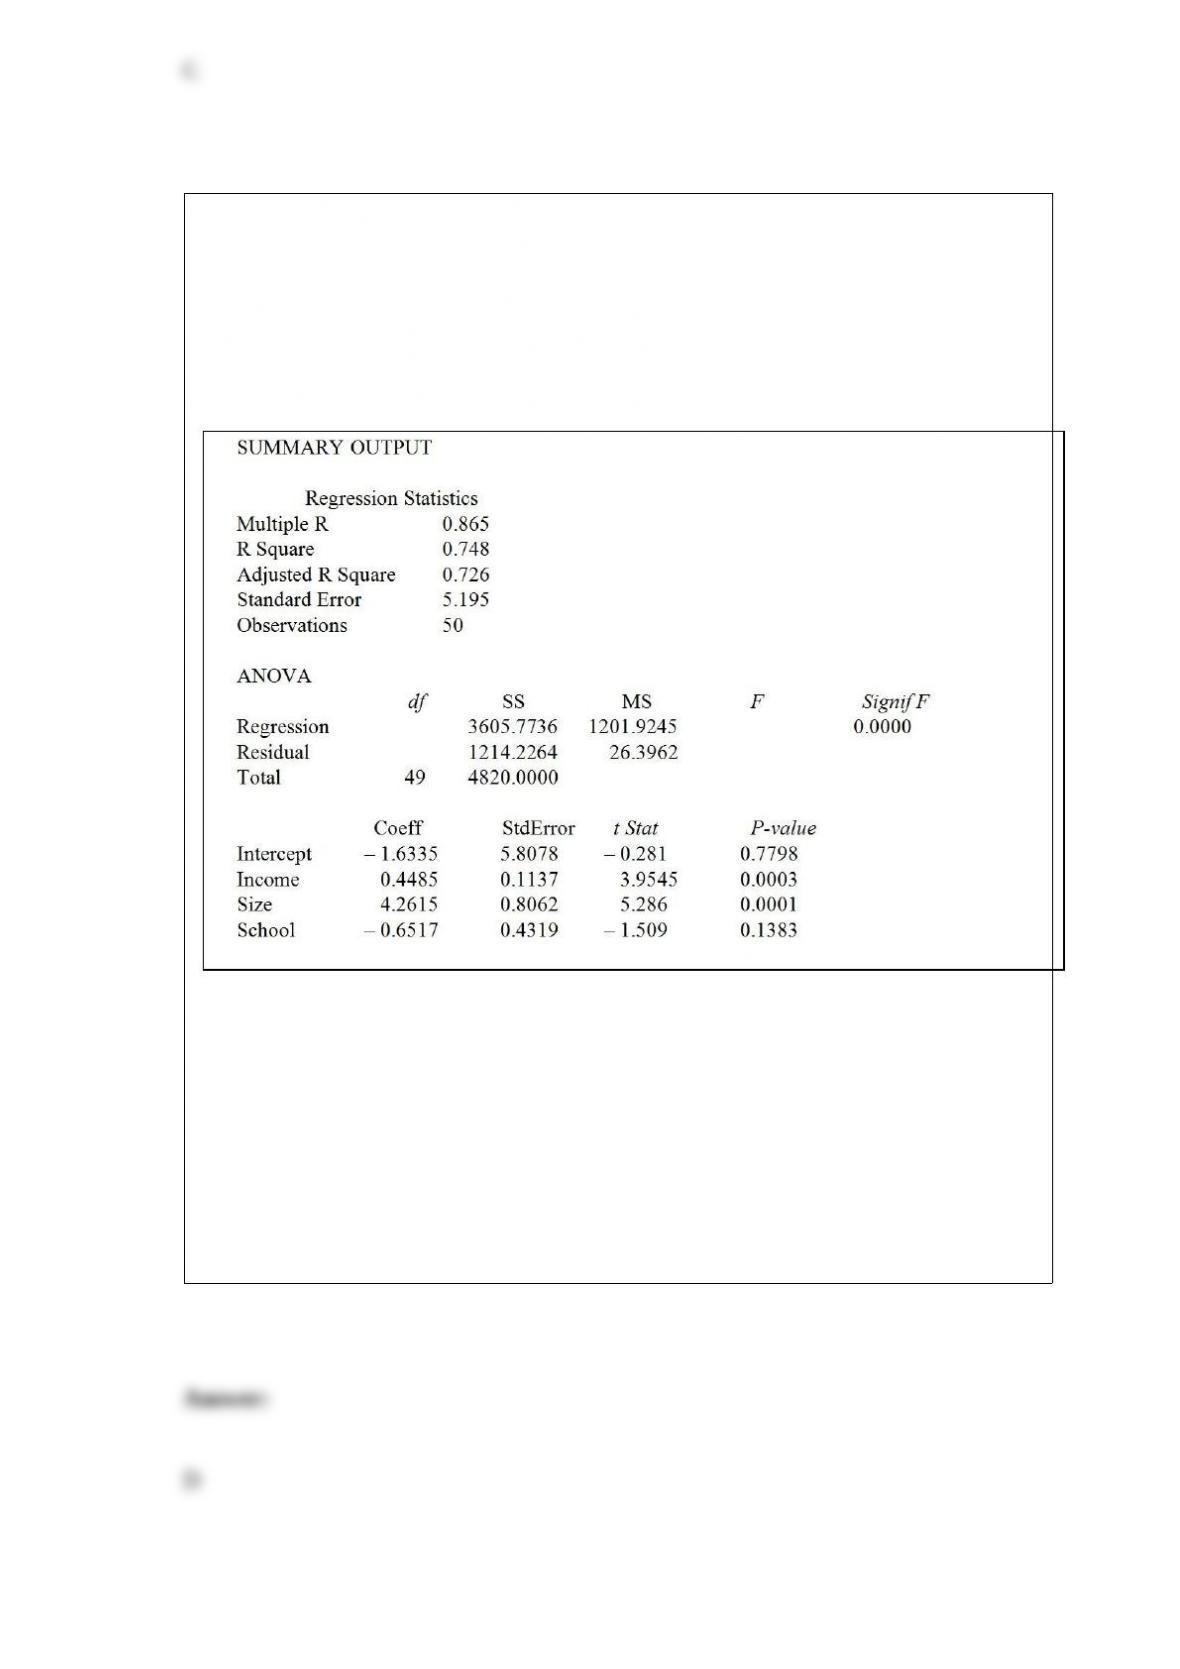
TABLE 17-1
A real estate builder wishes to determine how house size (House) is influenced by
family income (Income), family size (Size), and education of the head of household
(School). House size is measured in hundreds of square feet, income is measured in
thousands of dollars, and education is in years. The builder randomly selected 50
families and ran the multiple regression. Microsoft Excel output is provided below:
Referring to Table 17-1, at the 0.01 level of significance, what conclusion should the
builder draw regarding the inclusion of School in the regression model?
A) School is significant in explaining house size and should be included in the model
because its p-value is less than 0.01.
B) School is significant in explaining house size and should be included in the model
because its p-value is more than 0.01.
C) School is not significant in explaining house size and should not be included in the
model because its p-value is less than 0.01.
D) School is not significant in explaining house size and should not be included in the
model because its p-value is more than 0.01.
A major department store chain is interested in estimating the mean amount its credit
card customers spent on their first visit to the chain’s new store in the mall. Fifteen
credit card accounts were randomly sampled and analyzed with the following results:
= $50.50 and S = 20. Assuming the distribution of the amount spent on their first visit is
normal, what is the shape of the sampling distribution of the sample mean that will be
used to create the desired confidence interval for ?
A) approximately normal with a mean of $50.50
B) a standard normal distribution
C) a t distribution with 15 degrees of freedom
D) a t distribution with 14 degrees of freedom
Suppose that past history shows that 60% of college students prefer Brand C cola. A
sample of 5 students is to be selected. The probability that 2 or fewer prefer brand C is
________.
Which of the following types of samples can you use if you want to make valid
statistical inferences from a sample to a population?
A) a judgment sample
B) a quota sample
C) a convenience sample
D) a probability sample

TABLE 1-2
A Wall Street Journal poll asked 2,150 adults in the United States a series of questions
to find out their view on the U.S. economy.
Referring to Table 1-2, the possible responses to the question “How satisfied are you
with the U.S. economy today with 1 = very satisfied, 2 = moderately satisfied, 3 =
neutral, 4 = moderately dissatisfied, and 5 = very dissatisfied?” result in
A) a nominal scale variable.
B) an ordinal scale variable.
C) an interval scale variable.
D) a ratio scale variable.
TABLE 11-1
An airline wants to select a computer software package for its reservation system. Four
software packages (1, 2, 3, and 4) are commercially available. The airline will choose
the package that bumps as few passengers as possible during a month. An experiment is
set up in which each package is used to make reservations for 5 randomly selected
weeks. (A total of 20 weeks was included in the experiment.) The number of passengers
bumped each week is obtained, which gives rise to the following Excel output:
ANOVA
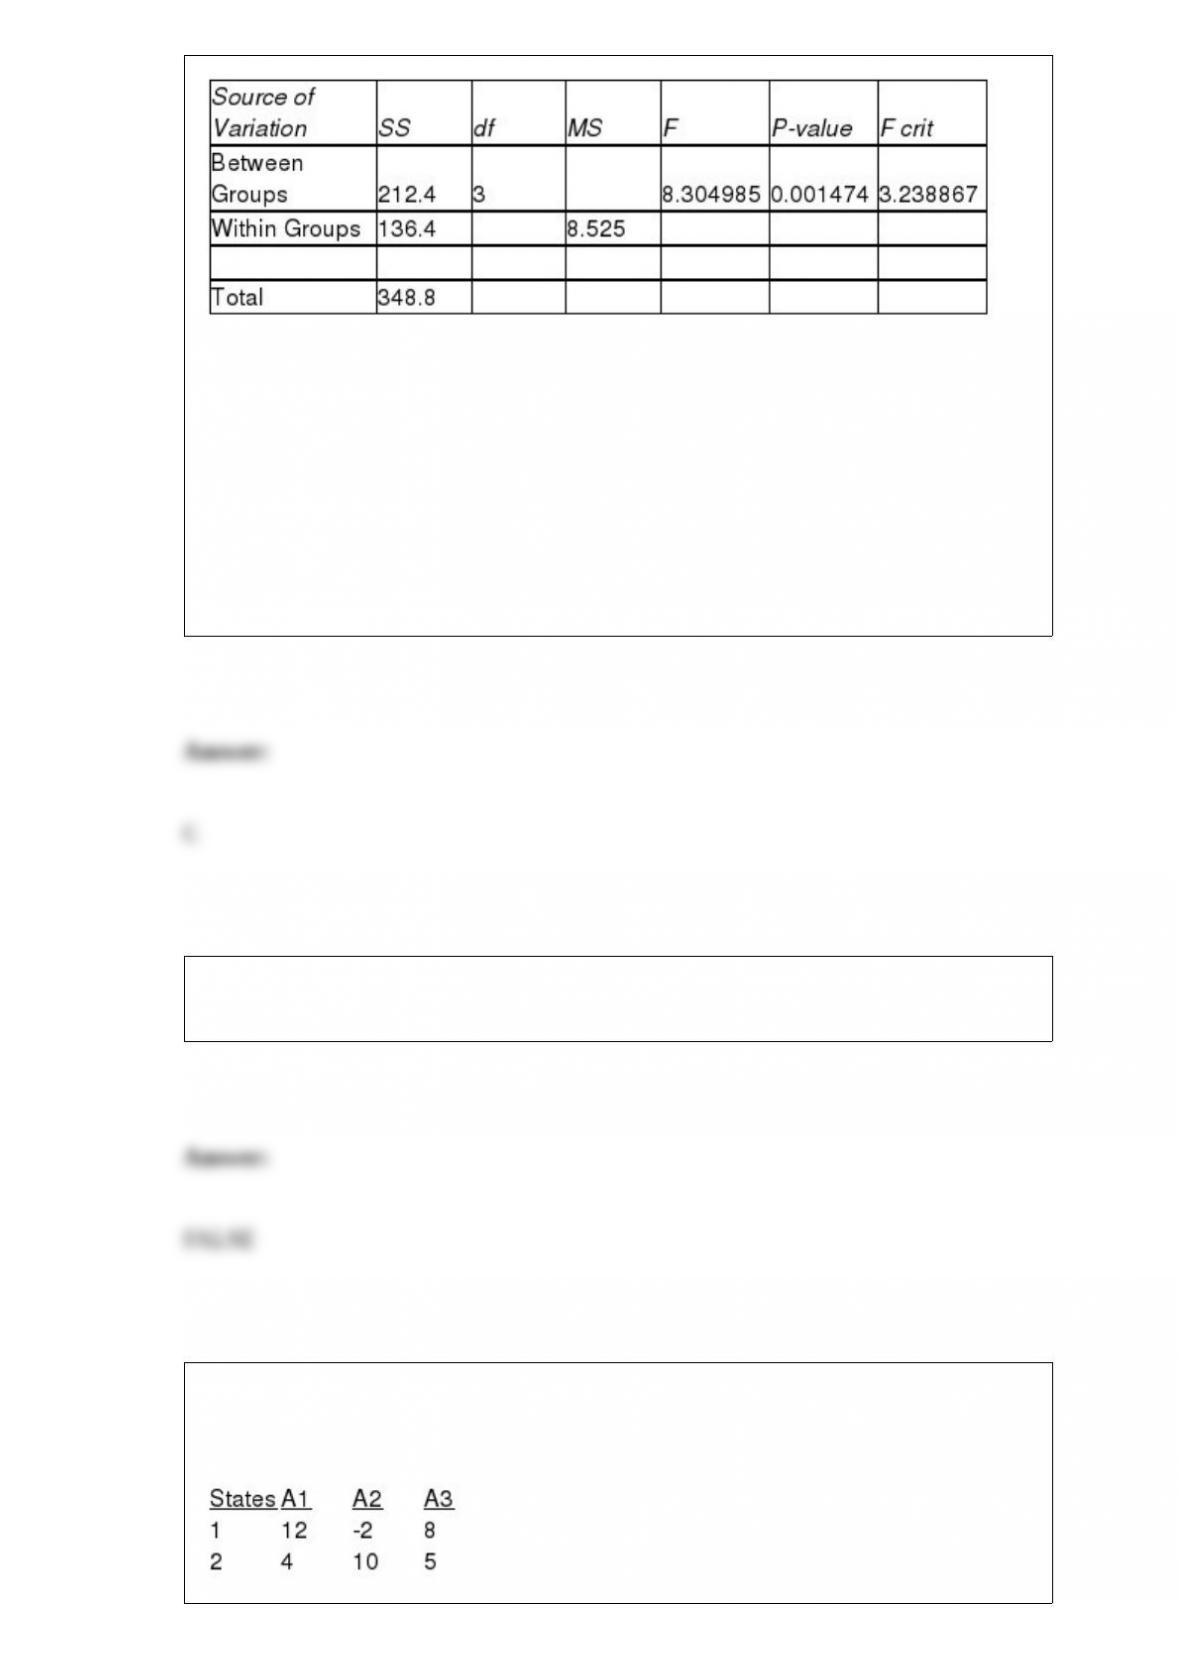
Referring to Table 11-1, the within groups degrees of freedom is
A) 3.
B) 4.
C) 16.
D) 19.
True or False: The geometric mean is a measure of variation or dispersion in a set of
data.
TABLE 19-1
The following payoff table shows profits associated with a set of 3 alternatives under 2
possible states of nature
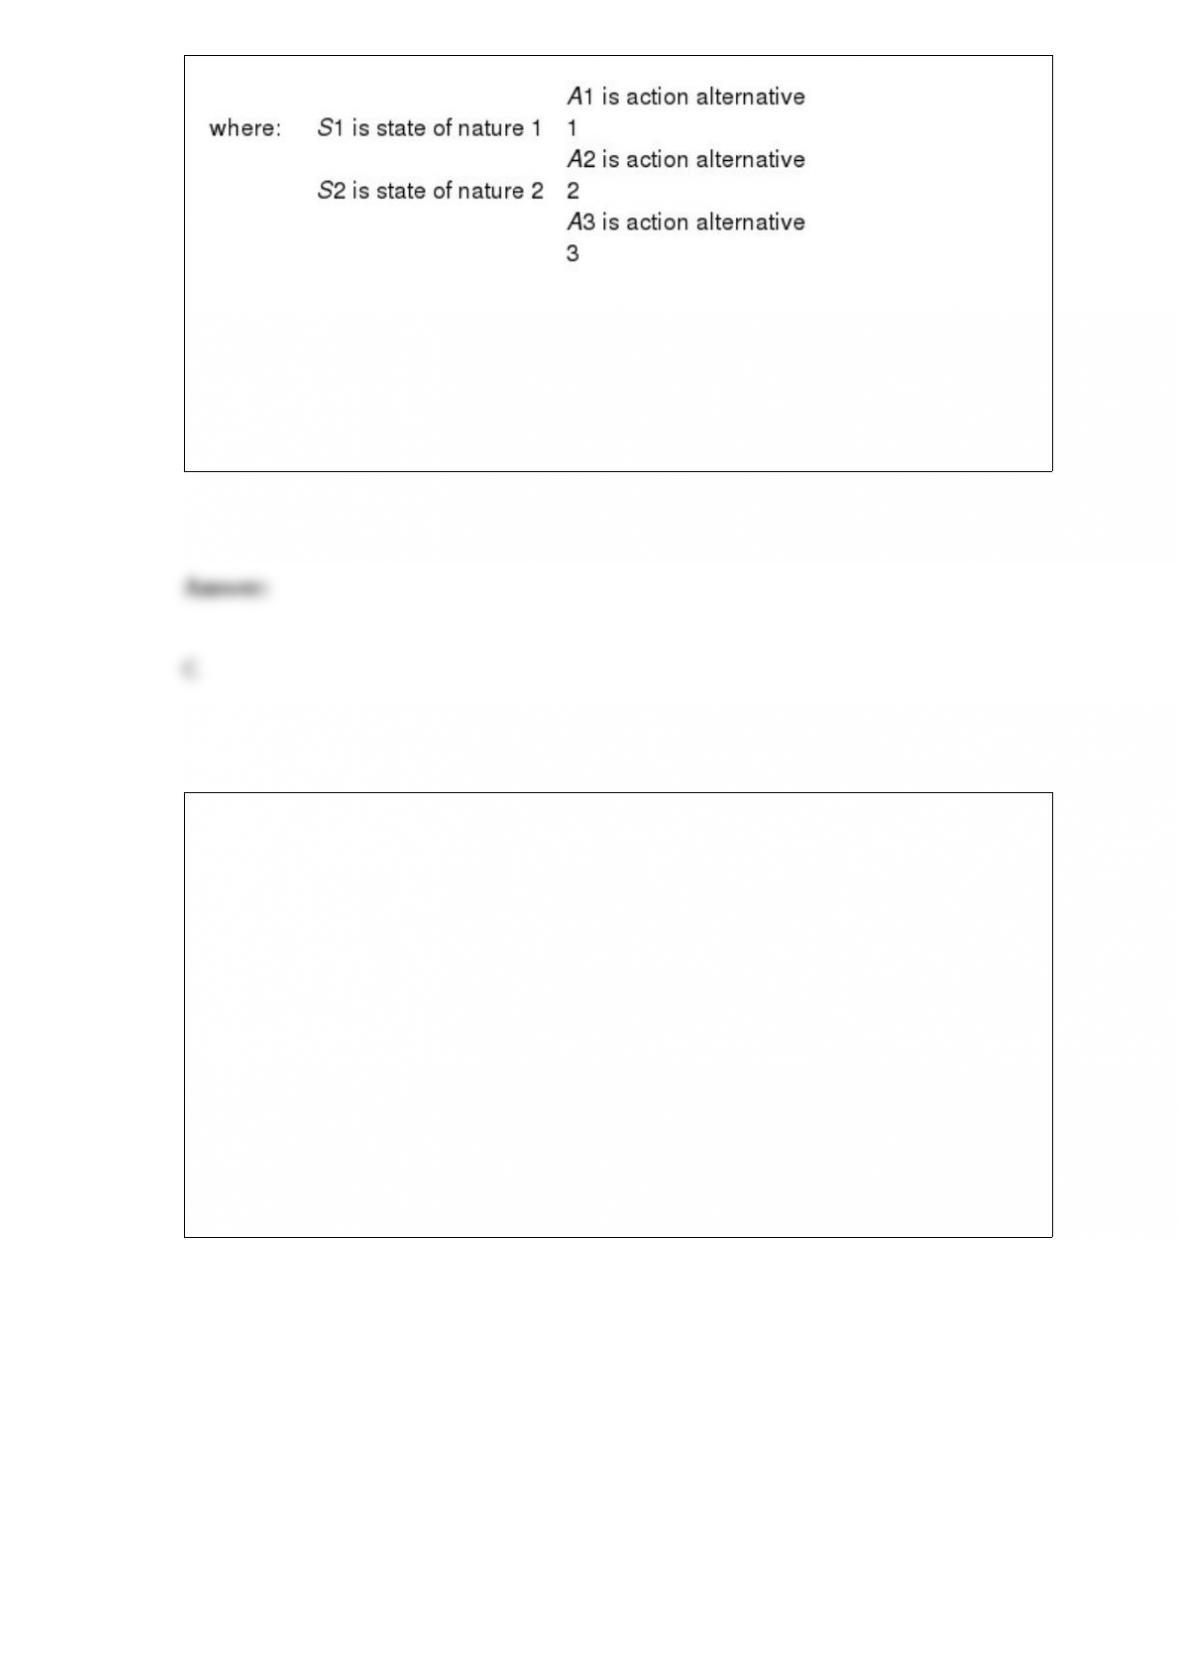
Referring to Table 19-1, if the probability of S1 is 0.2 and S2 is 0.8, then the expected
opportunity loss (EOL) for A1 is
A) 0.
B) 1.2.
C) 4.8.
D) 5.6.
Referring to Table 14-17, what is the p-value of the test statistic to
determine whether there is a signi.cant relationship between the
number of weeks a worker is unemployed due to a layo! and the
entire set of explanatory variables?
TABLE 14-17
Given below are results from the regression analysis where the
dependent variable is the number of weeks a worker is unemployed
due to a layo! (Unemploy) and the independent variables are the age
of the worker (Age) and a dummy variable for management position
(Manager: 1 = yes, 0 = no).
The results of the regression analysis are given below:

The probability that a standard normal variable Z is positive is ________.
TABLE 13-4
The managers of a brokerage firm are interested in finding out if the number of new
clients a broker brings into the firm affects the sales generated by the broker. They
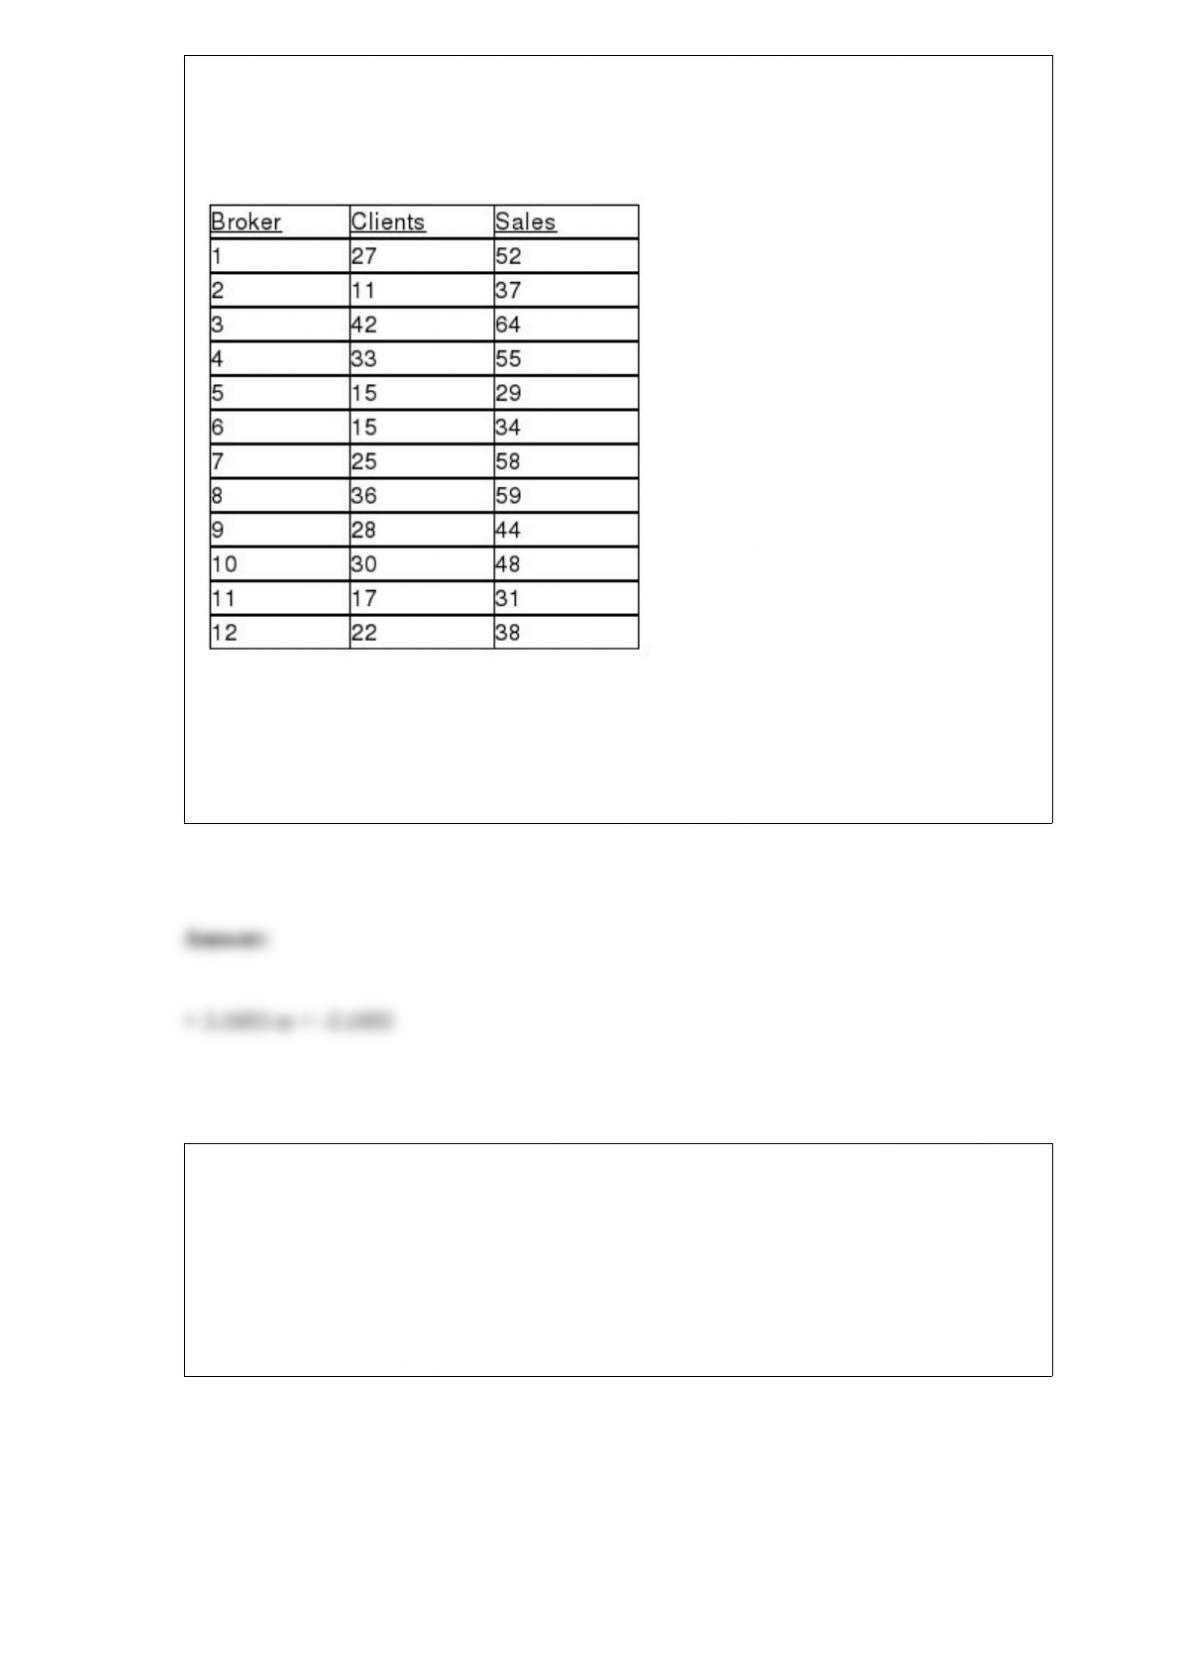
sample 12 brokers and determine the number of new clients they have enrolled in the
last year and their sales amounts in thousands of dollars. These data are presented in the
table that follows.
Referring to Table 13-4, the managers of the brokerage firm wanted to test the
hypothesis that the population slope was equal to 0. For a test with a level of
significance of 0.01, the null hypothesis should be rejected if the value of the test
statistic is ________.
TABLE 13-4
The managers of a brokerage firm are interested in finding out if the number of new
clients a broker brings into the firm affects the sales generated by the broker. They
sample 12 brokers and determine the number of new clients they have enrolled in the
last year and their sales amounts in thousands of dollars. These data are presented in the
table that follows.
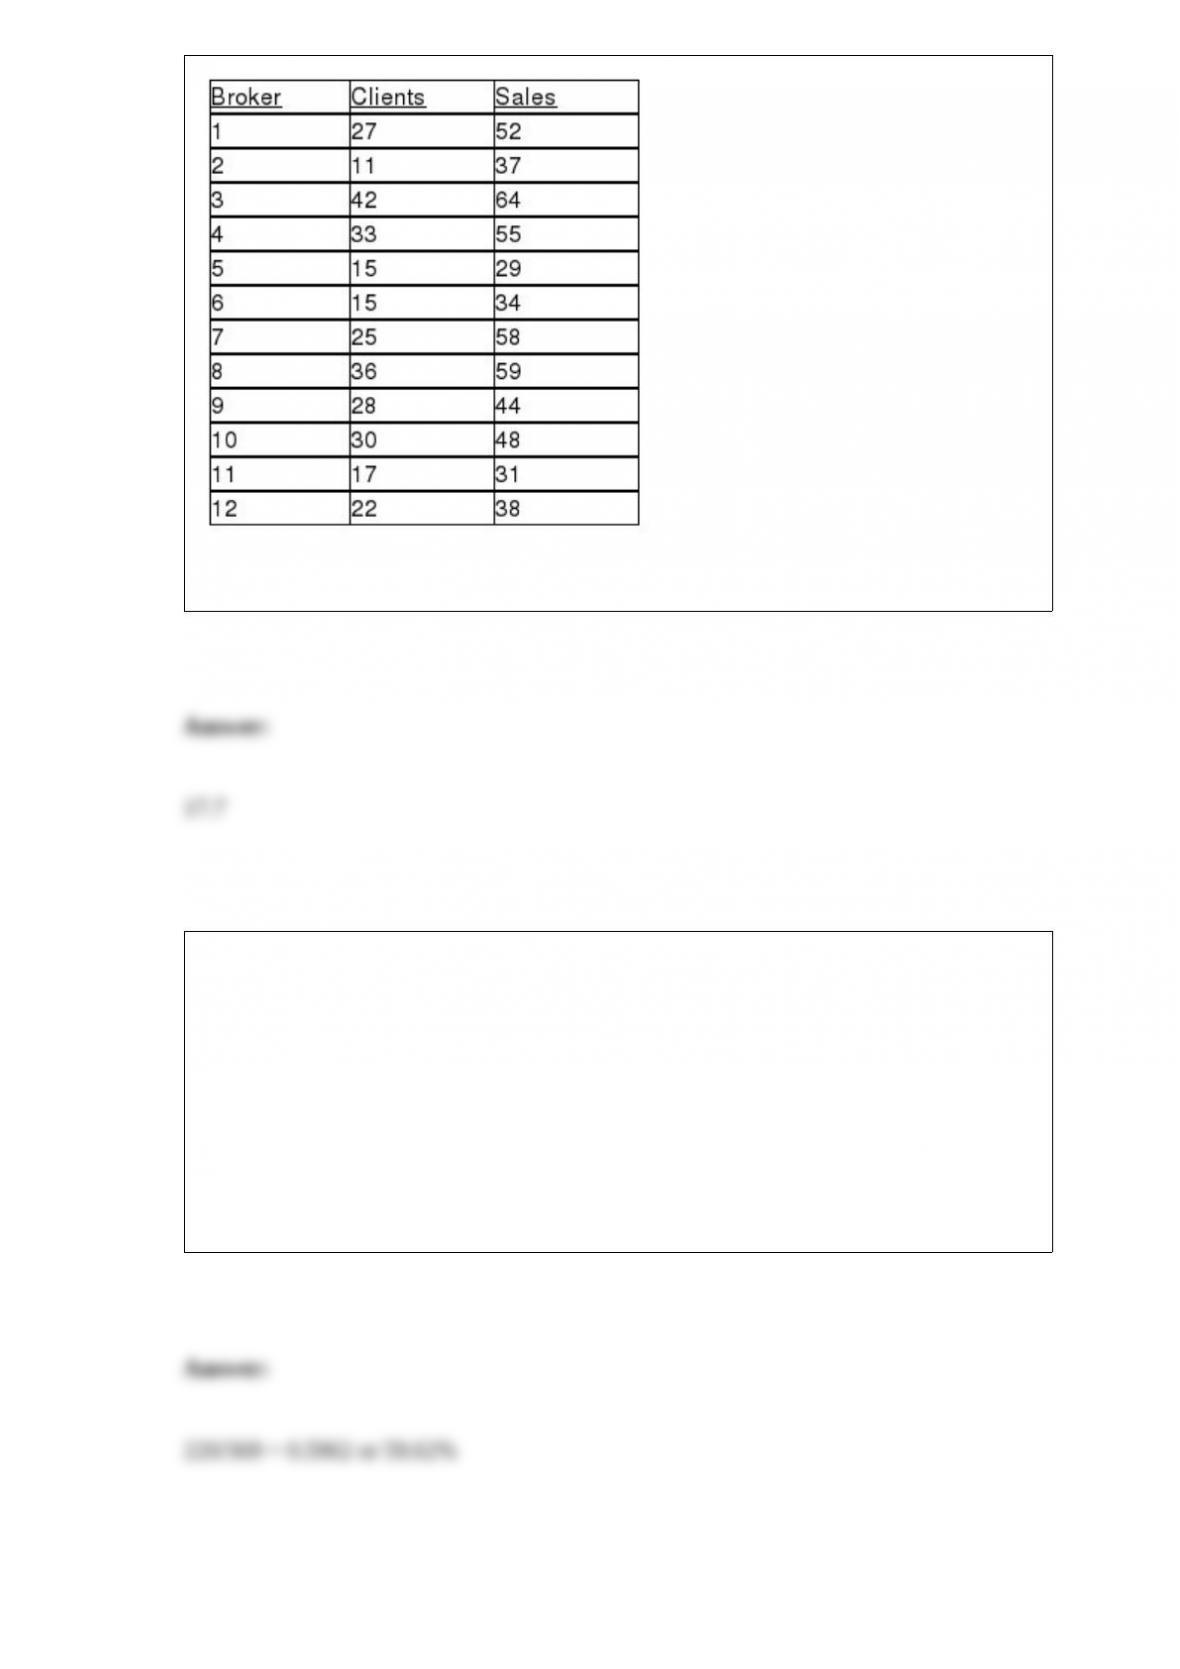
Referring to Table 13-4, the least squares estimate of the Y-intercept is ________.
TABLE 4-9
A survey conducted by the Segal Company of New York found that in a sample of 189
large companies, 40 offered stock options to their board members as part of their
noncash compensation packages. For small- to mid-sized companies, 43 of the 180
surveyed indicated that they offer stock options as part of their noncash compensation
packages to their board members.
Referring to Table 4-9, if a company is selected at random, what is the probability that
the company is small to mid-sized or offered stock options to their board members?