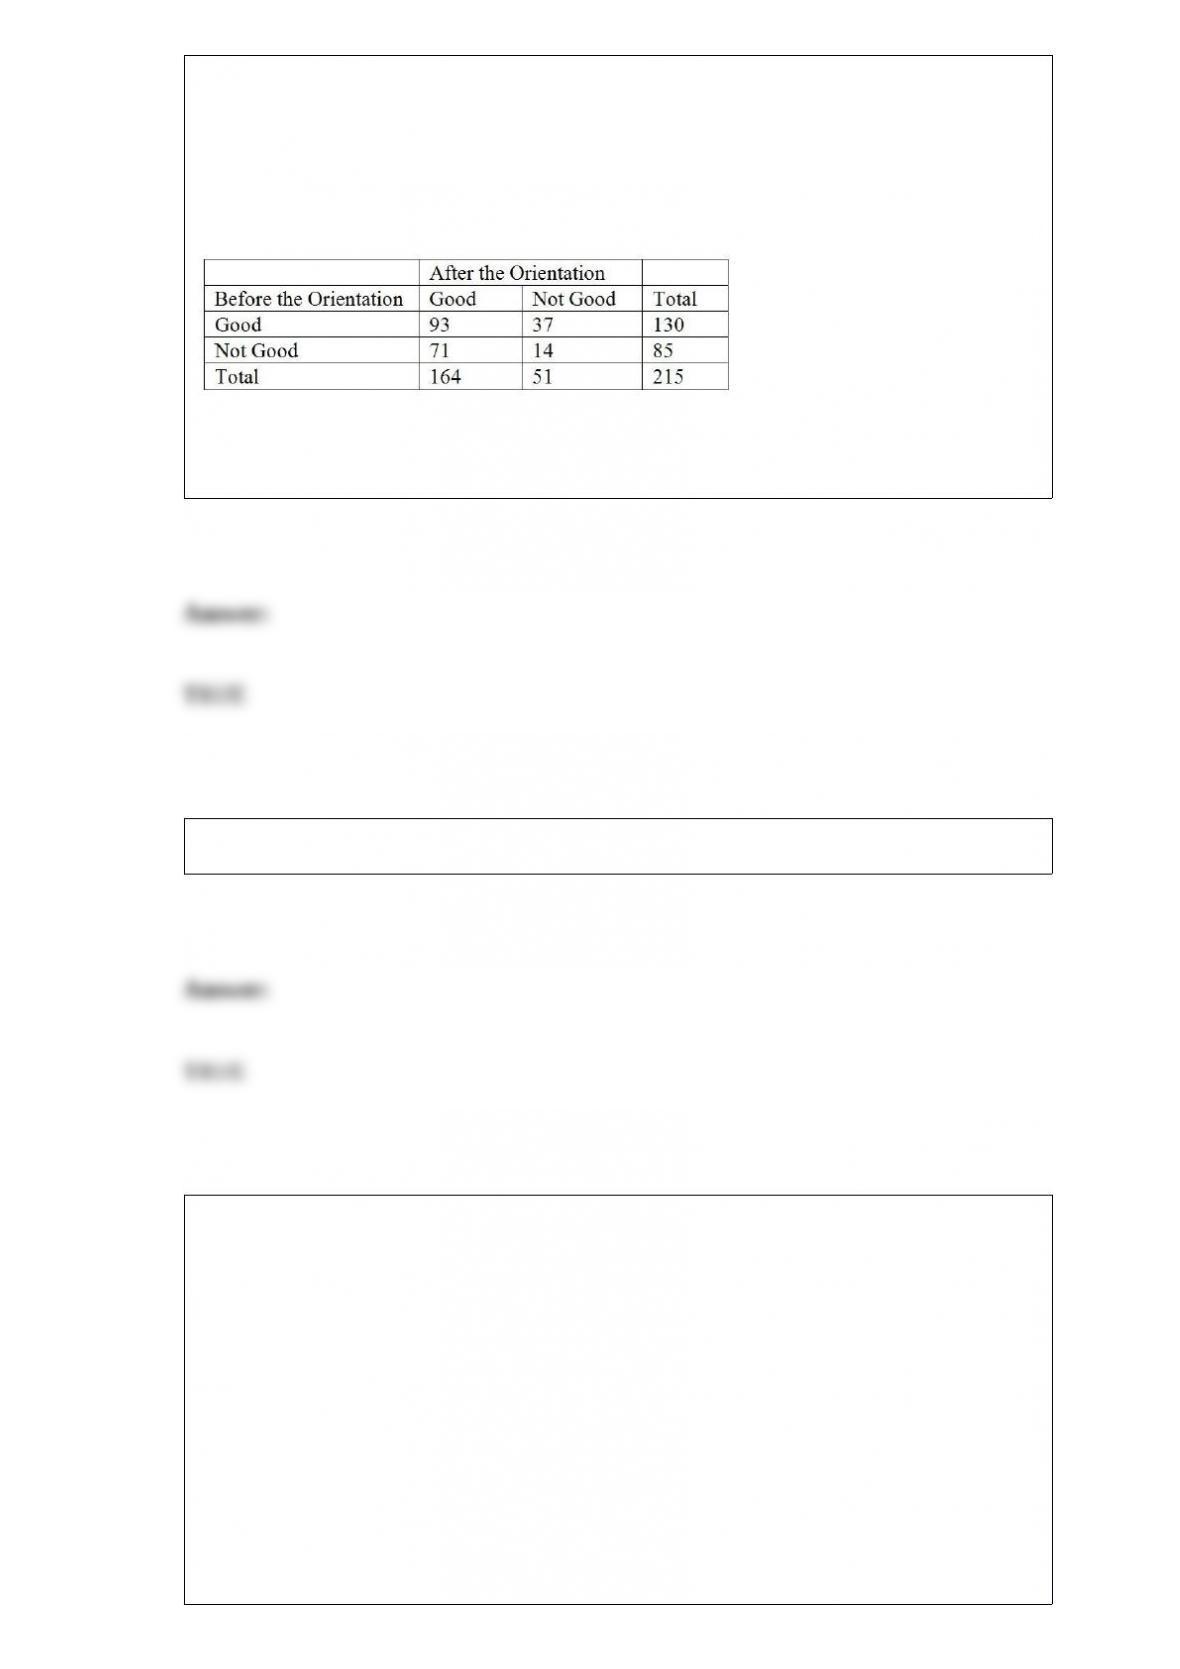
TABLE 12-19
The director of the MBA program of a state university wanted to know if a one-week
orientation would change the proportion among potential incoming students who would
perceive the program as being good. Given below is the result from 215 students’ view
of the program before and after the orientation.
True or False: Referring to Table 12-19, the director should reject the null hypothesis
using a 1% level of significance.
True or False: Systematic samples are less efficient than a stratified sample.
True or False: TABLE 17-12
The marketing manager for a nationally franchised lawn service company would like to
study the characteristics that differentiate home owners who do and do not have a lawn
service. A random sample of 30 home owners located in a suburban area near a large
city was selected; 15 did not have a lawn service (code 0) and 15 had a lawn service
(code 1). Additional information available concerning these 30 home owners includes
family income (Income, in thousands of dollars), lawn size (Lawn Size, in thousands of
square feet), attitude toward outdoor recreational activities (Attitude 0 = unfavorable, 1
= favorable), number of teenagers in the household (Teenager), and age of the head of
the household (Age).
The Minitab output is given below:
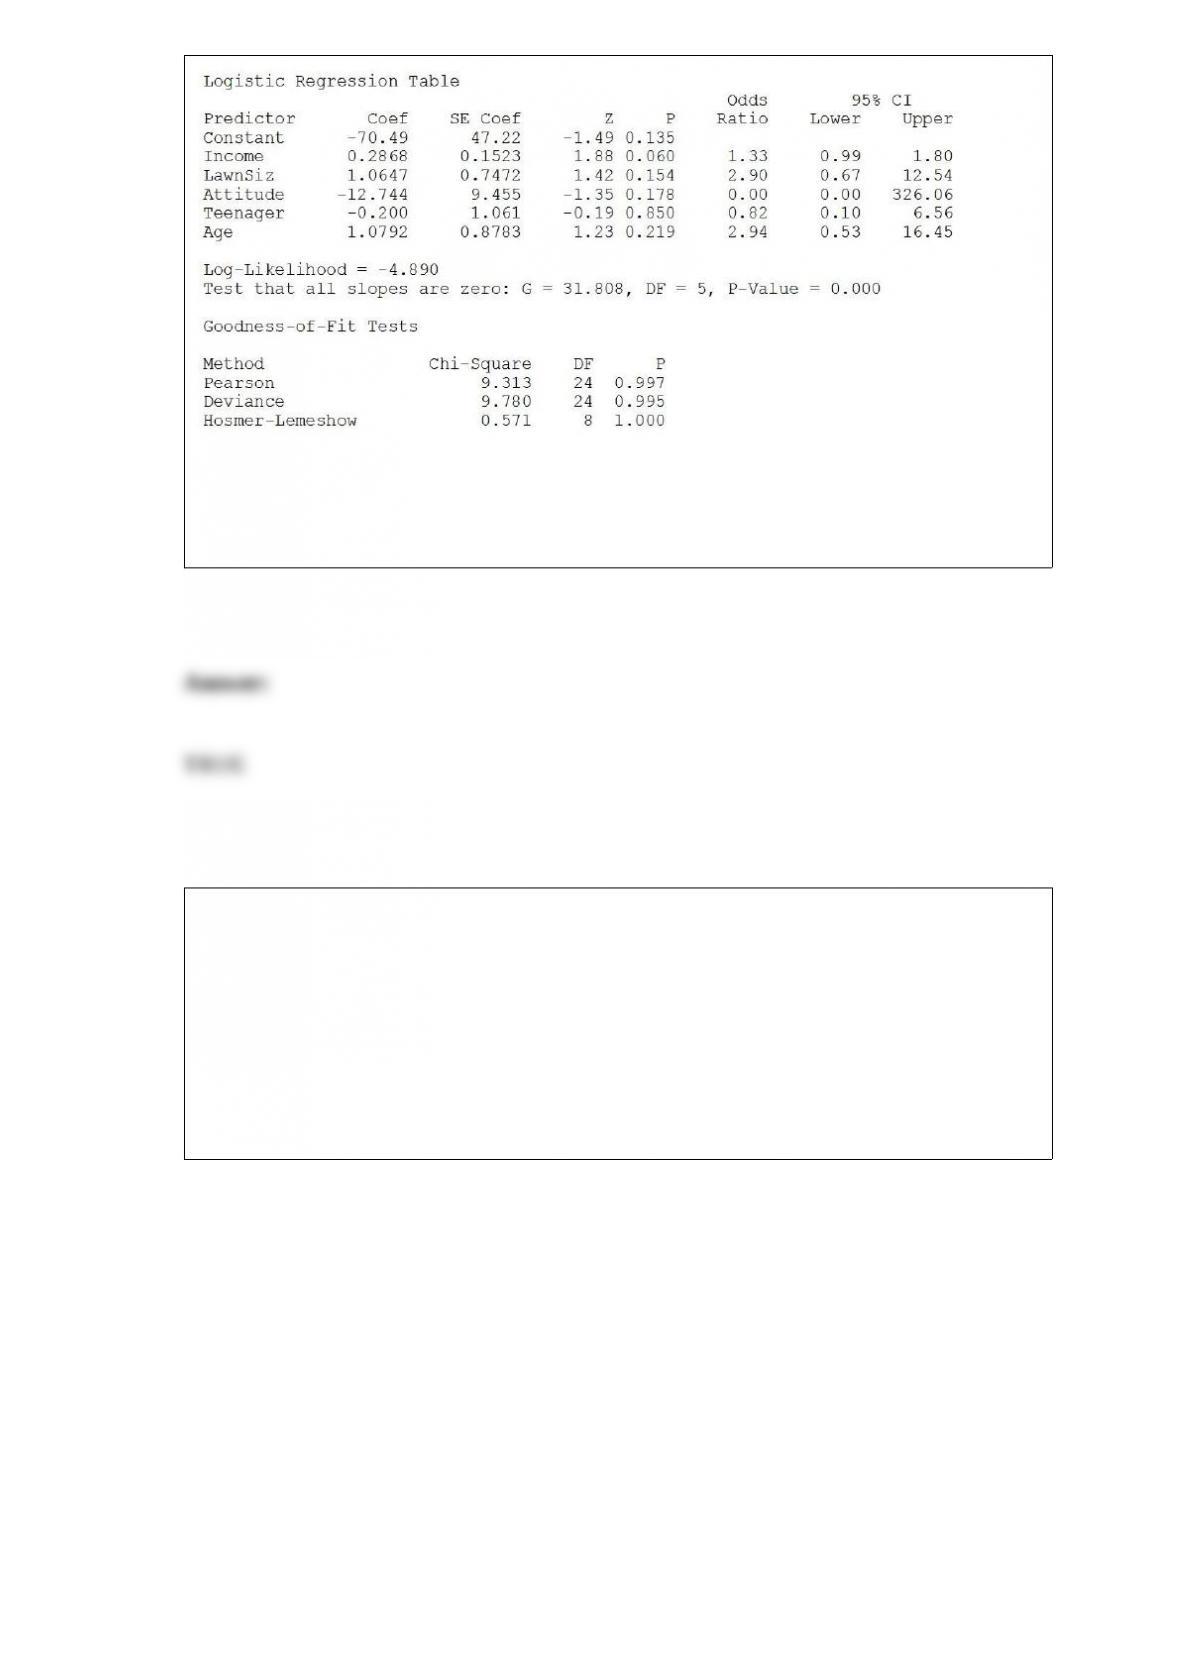
Referring to Table 17-12, there is not enough evidence to conclude that Age makes a
significant contribution to the model in the presence of the other independent variables
at a 0.05 level of significance.
True or False: TABLE 17-8
The superintendent of a school district wanted to predict the percentage of students
passing a sixth-grade proficiency test. She obtained the data on percentage of students
passing the proficiency test (% Passing), daily mean of the percentage of students
attending class (% Attendance), mean teacher salary in dollars (Salaries), and
instructional spending per pupil in dollars (Spending) of 47 schools in the state.
Following is the multiple regression output with Y = % Passing as the dependent
variable, X1 = % Attendance, X2 = Salaries and X3 = Spending:
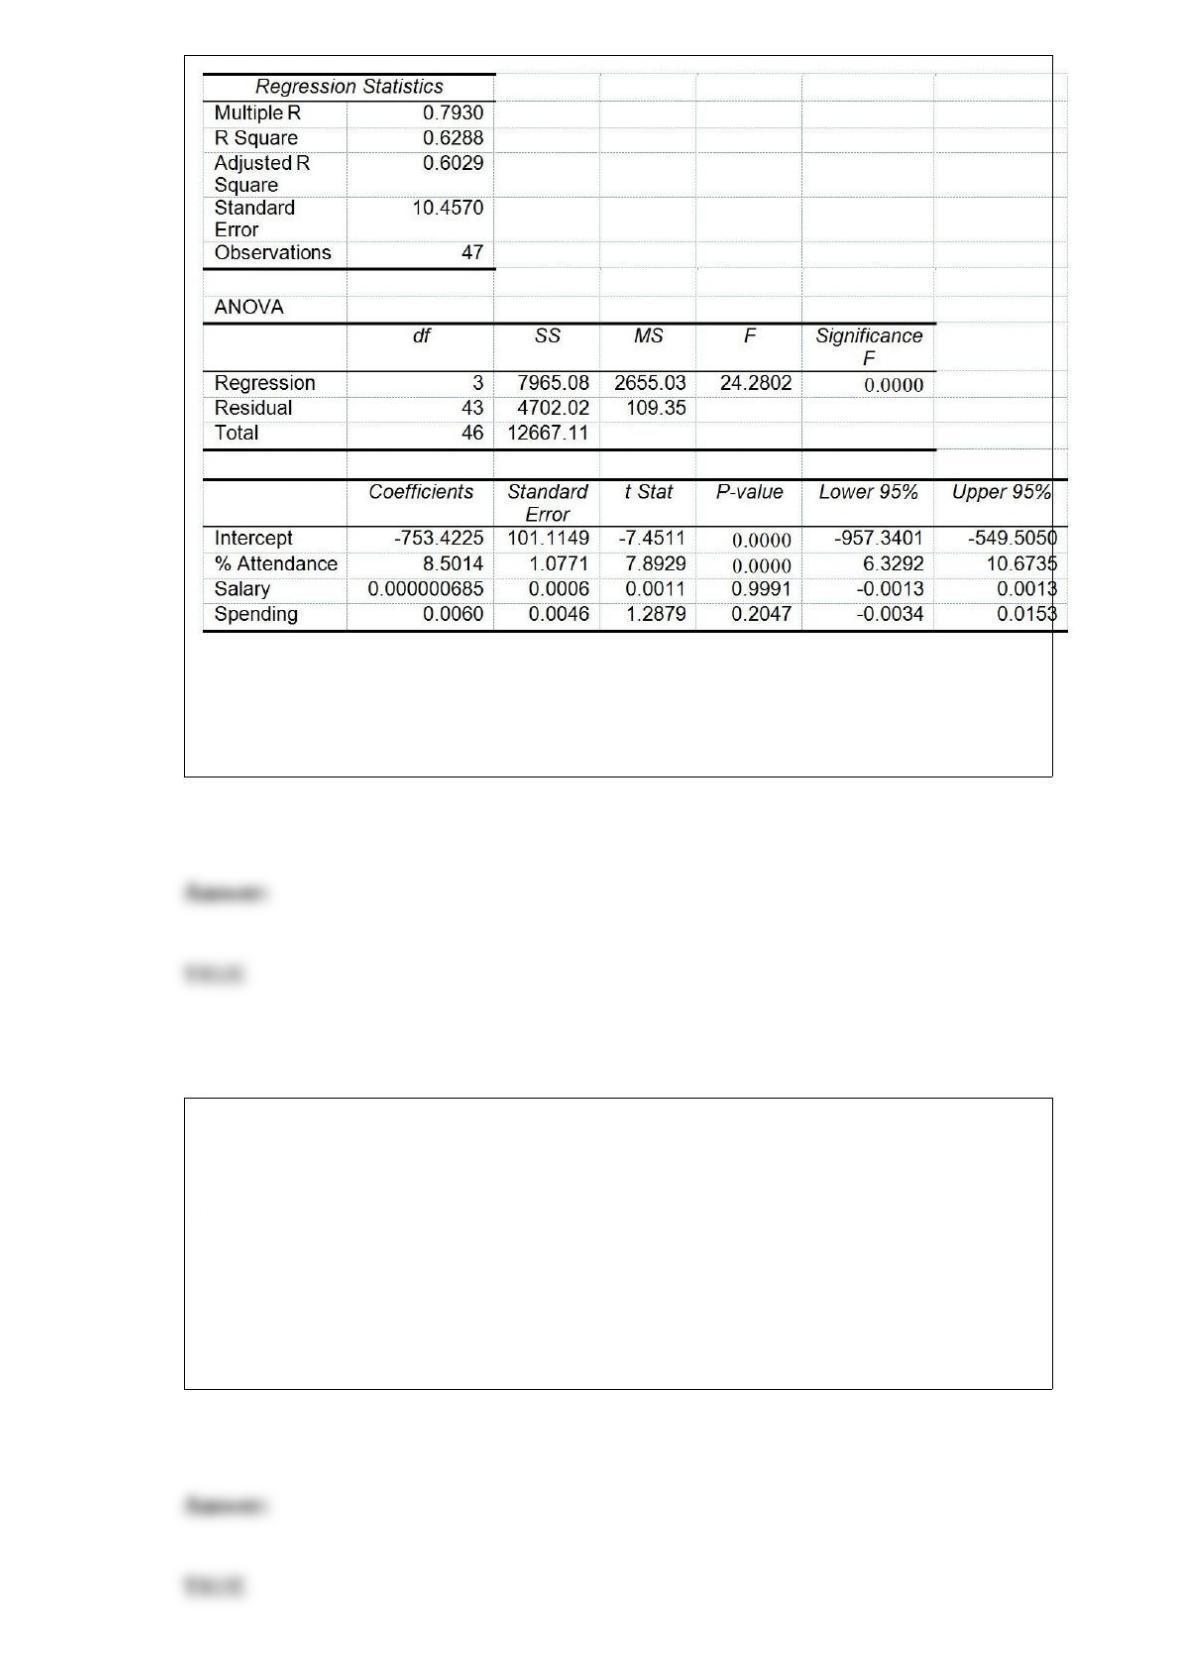
Referring to Table 17-8, you can conclude that instructional spending per pupil has no
impact on the mean percentage of students passing the proficiency test, taking into
account the effect of all the other independent variables, at a 5% level of significance
using the 95% confidence interval estimate for β3.
TABLE 8-7
A hotel chain wants to estimate the mean number of rooms rented daily in a given
month. The population of rooms rented daily is assumed to be normally distributed for
each month with a standard deviation of 240 rooms. During February, a sample of 25
days has a sample mean of 370 rooms.
True or False: Referring to Table 8-7, a 95% confidence interval for the mean number
of rooms rented daily in a given month is narrower than a 99% confidence interval.
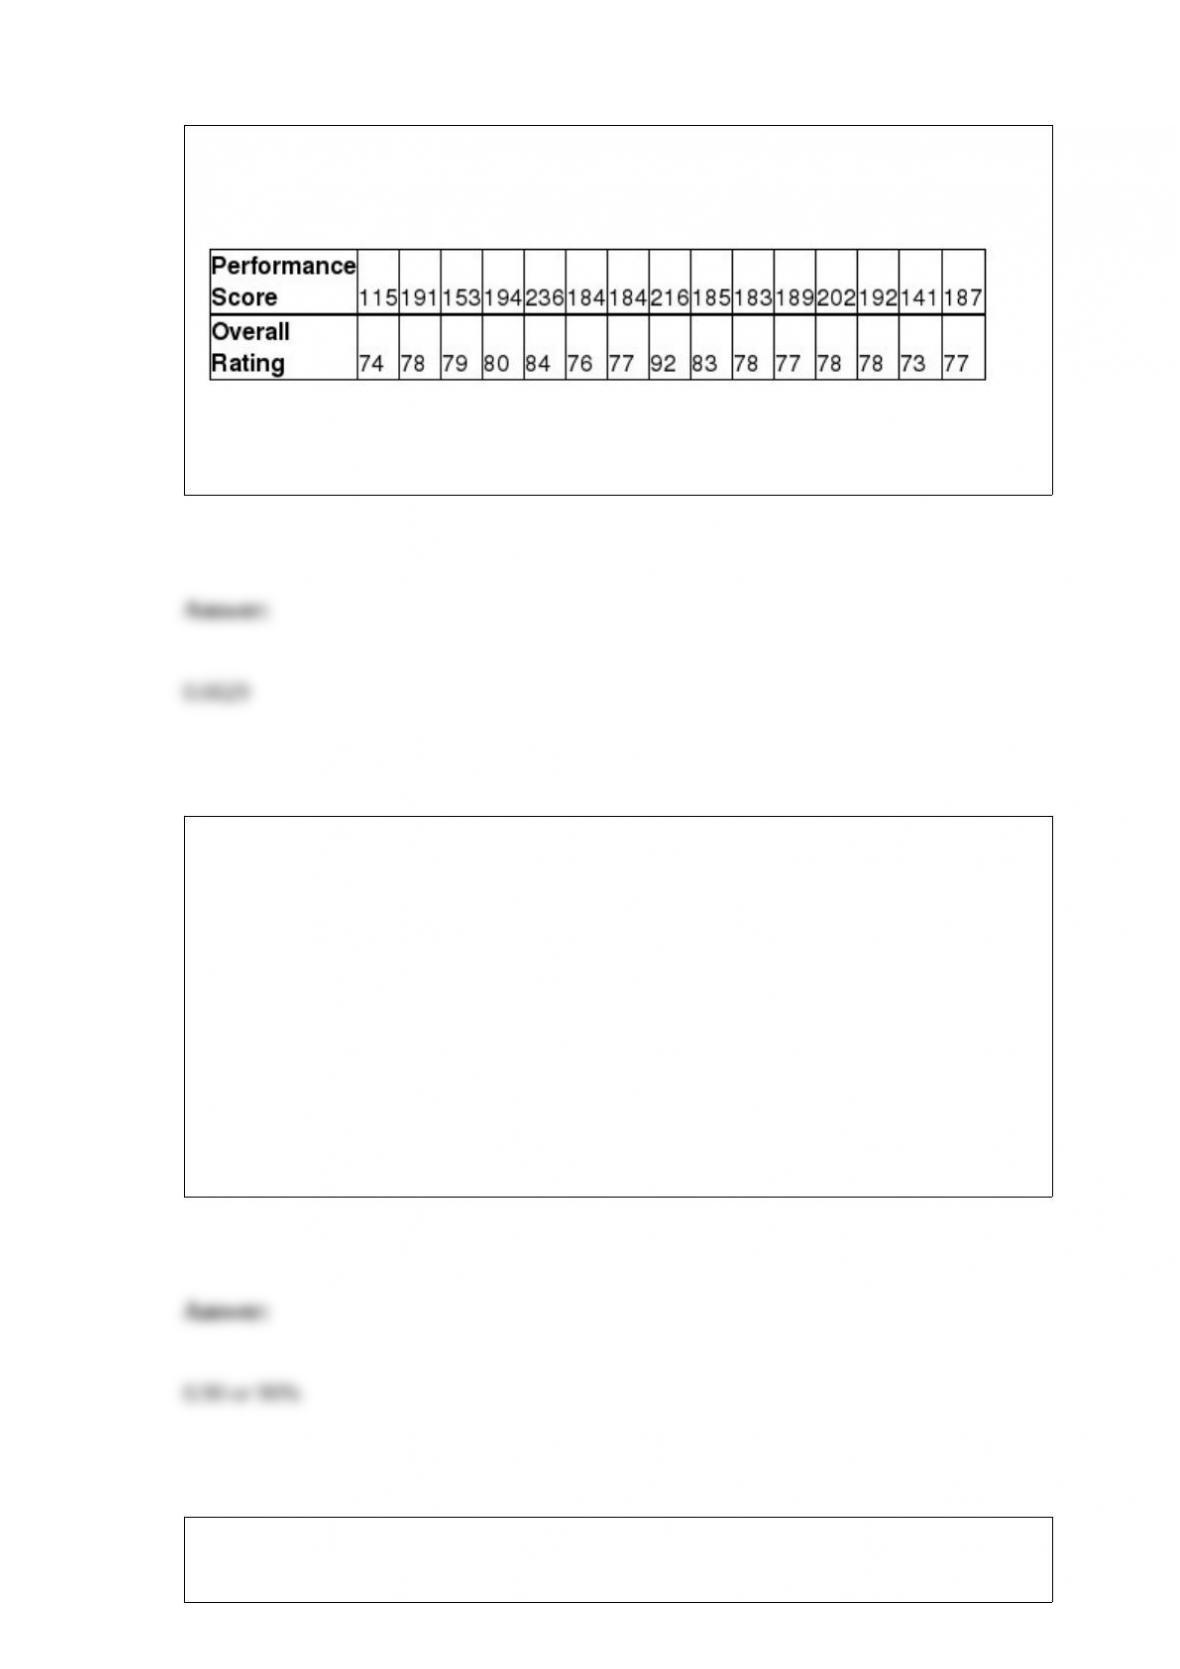
TABLE 3-12
Given below are the rating and performance scores of 15 laptop computers.
Referring to Table 3-12, what is the sample correlation coefficient between the
performance scores and the rating?
TABLE 6-6
According to Investment Digest, the arithmetic mean of the annual return for common
stocks over an 85-year period was 9.5%, but the value of the variance was not
mentioned. Also 25% of the annual returns were below 8%, while 65% of the annual
returns were between 8% and 11.5%. The article claimed that the distribution of annual
return for common stocks was bell-shaped and approximately symmetric. Assume that
this distribution is normal with the mean given above. Answer the following questions
without the help of a calculator, statistical software or statistical table.
Referring to Table 6-6, find the probability that the annual return of a random year will
be less than 11.5%.
TABLE 13-4
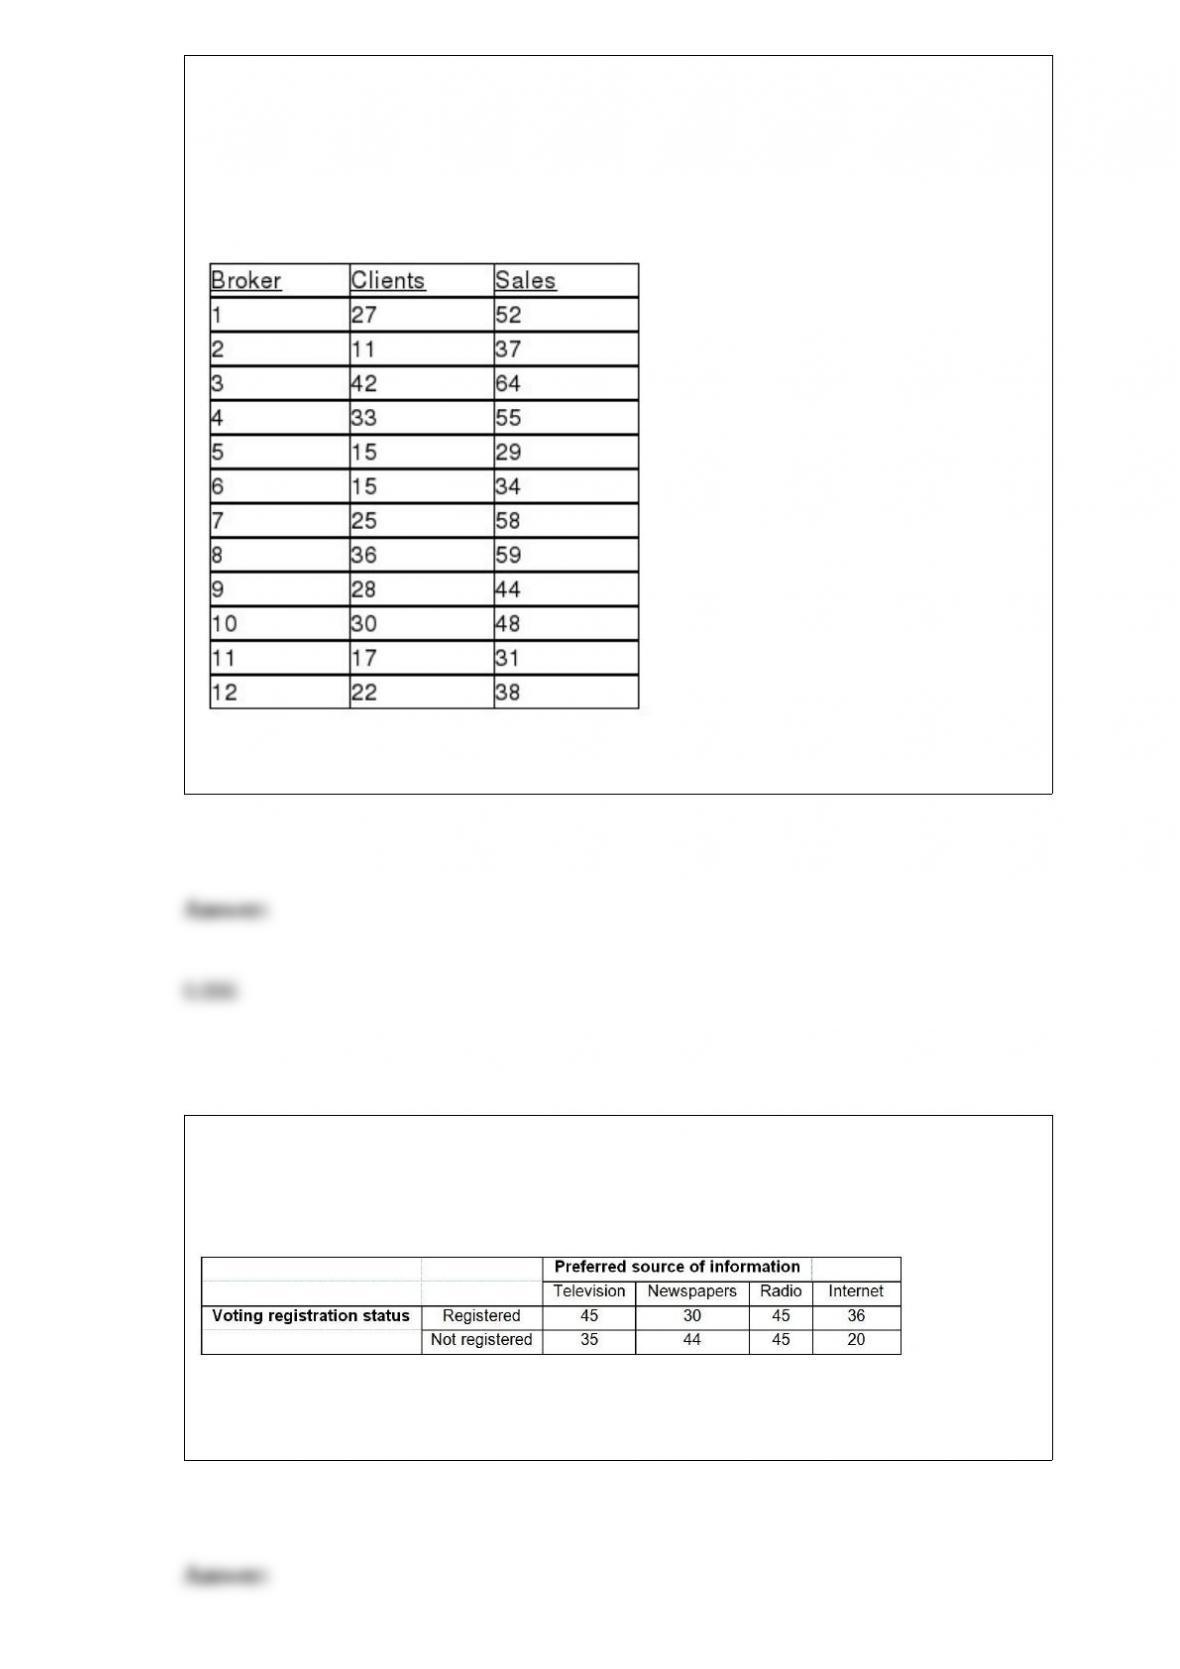
The managers of a brokerage firm are interested in finding out if the number of new
clients a broker brings into the firm affects the sales generated by the broker. They
sample 12 brokers and determine the number of new clients they have enrolled in the
last year and their sales amounts in thousands of dollars. These data are presented in the
table that follows.
Referring to Table 13-4, the coefficient of correlation is ________.
TABLE 4-11
A sample of 300 adults is selected. The contingency table below shows their registration
status and their preferred source of information on current events.
Referring to Table 4-11, if an adult is selected at random, what is the probability that
he/she prefers to get his/her current information from the internet?
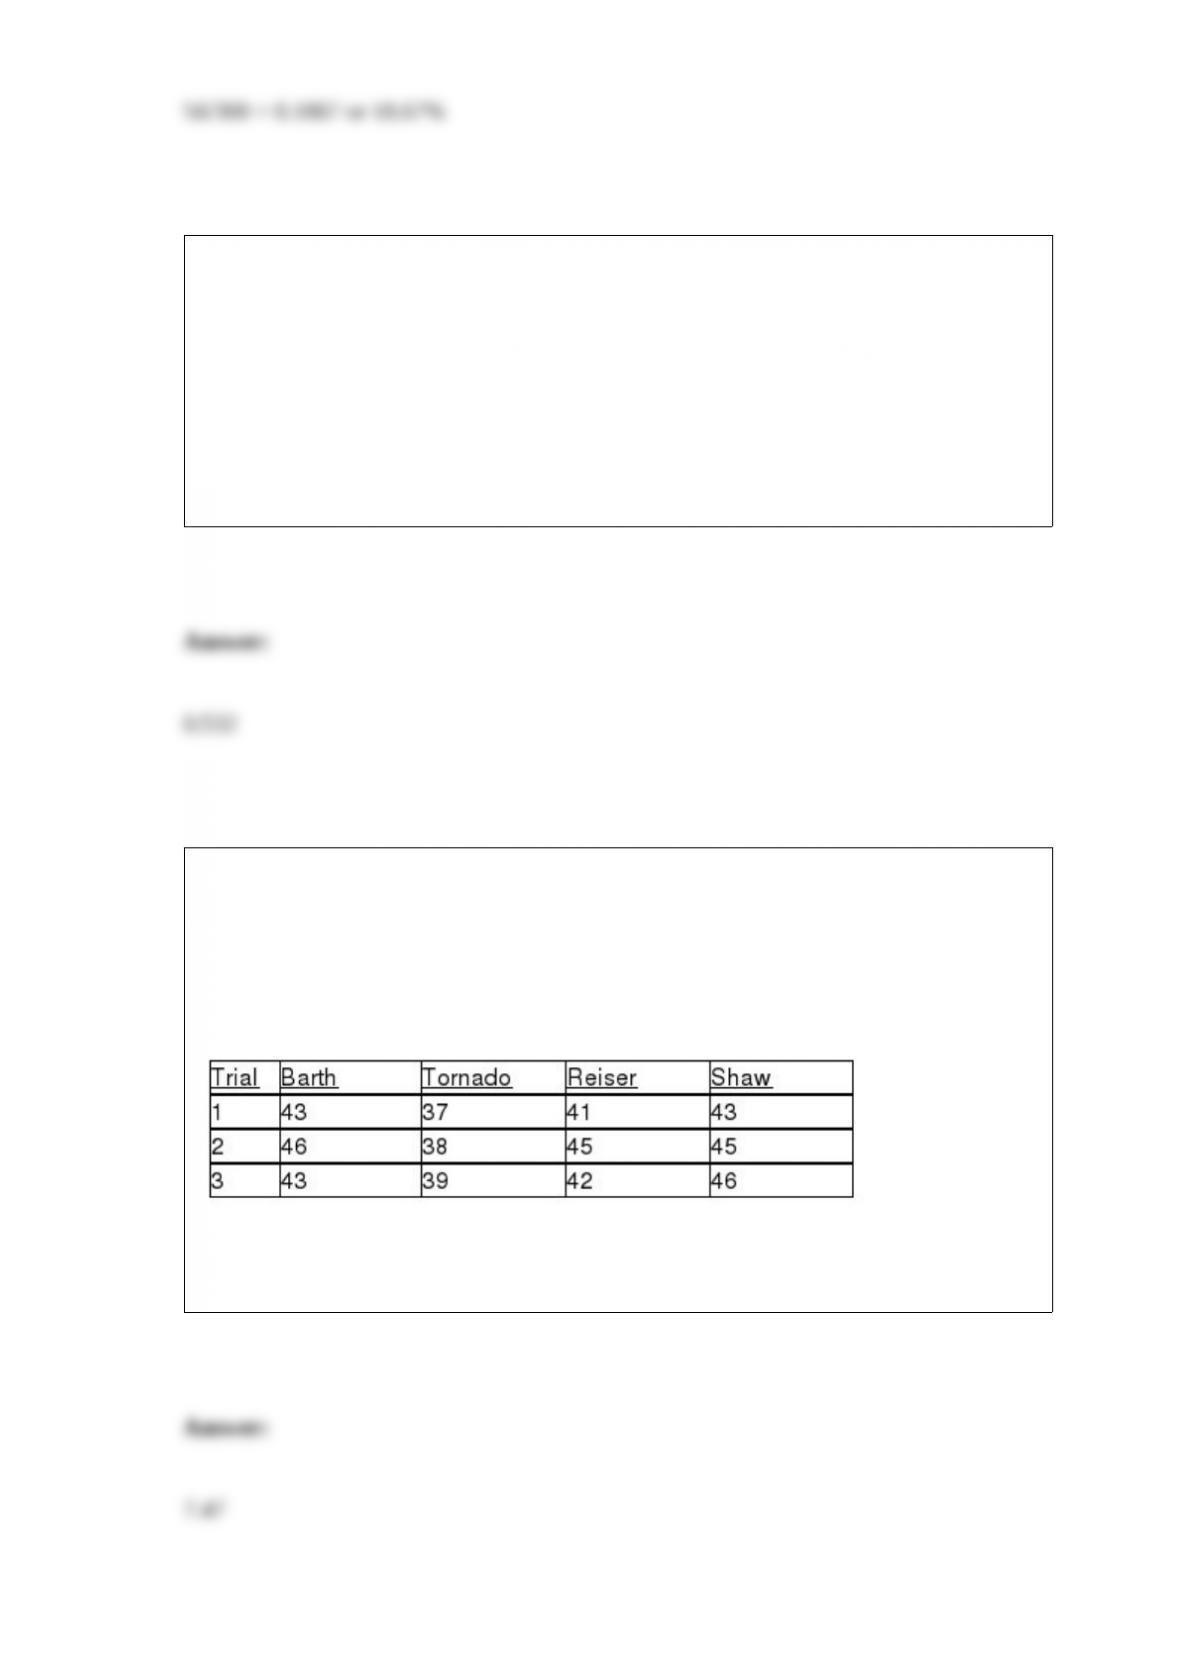
TABLE 4-8
According to the record of the registrar’s office at a state university, 35% of the students
are freshman, 25% are sophomore, 16% are junior and the rest are senior. Among the
freshmen, sophomores, juniors and seniors, the portion of students who live in the
dormitory are, respectively, 80%, 60%, 30% and 20%.
Referring to Table 4-8, if a randomly selected student lives in the dormitory, what is the
probability that the student is a freshman?
TABLE 12-16
As part of an evaluation program, a sporting goods retailer wanted to compare the
downhill coasting speeds of 4 brands of bicycles. She took 3 of each brand and
determined their maximum downhill speeds. The results are presented in miles per hour
in the table below.
Referring to Table 12-16, the calculated value of the Kruskal-Wallis test statistic H is
________.

Referring to Table 14-10, to test the signiticance of the multiple
regression model, the value of the test statistic is ________.
TABLE 14-10
You worked as an intern at We Always Win Car Insurance Company
last summer. You notice that individual car insurance premiums
depend very much on the age of the individual and the number of
traffic tickets received by the individual. You performed a regression
analysis in EXCEL and obtained the following partial information:
You were told that the mean score on a statistics exam is 75 with the scores normally
distributed. In addition, you know the probability of a score between 55 and 60 is
4.41% and that the probability of a score greater than 90 is 6.68%. What is the
probability of a score lower than 55?