TABLE 5-10
An accounting firm in a college town usually recruits employees from two of the
universities in town. This year, there are fifteen graduates from University A and five
from University B and the firm decides to hire six new employees from the two
universities.
Referring to Table 5-10, what is the probability that all six of the new employees will be
from University A?
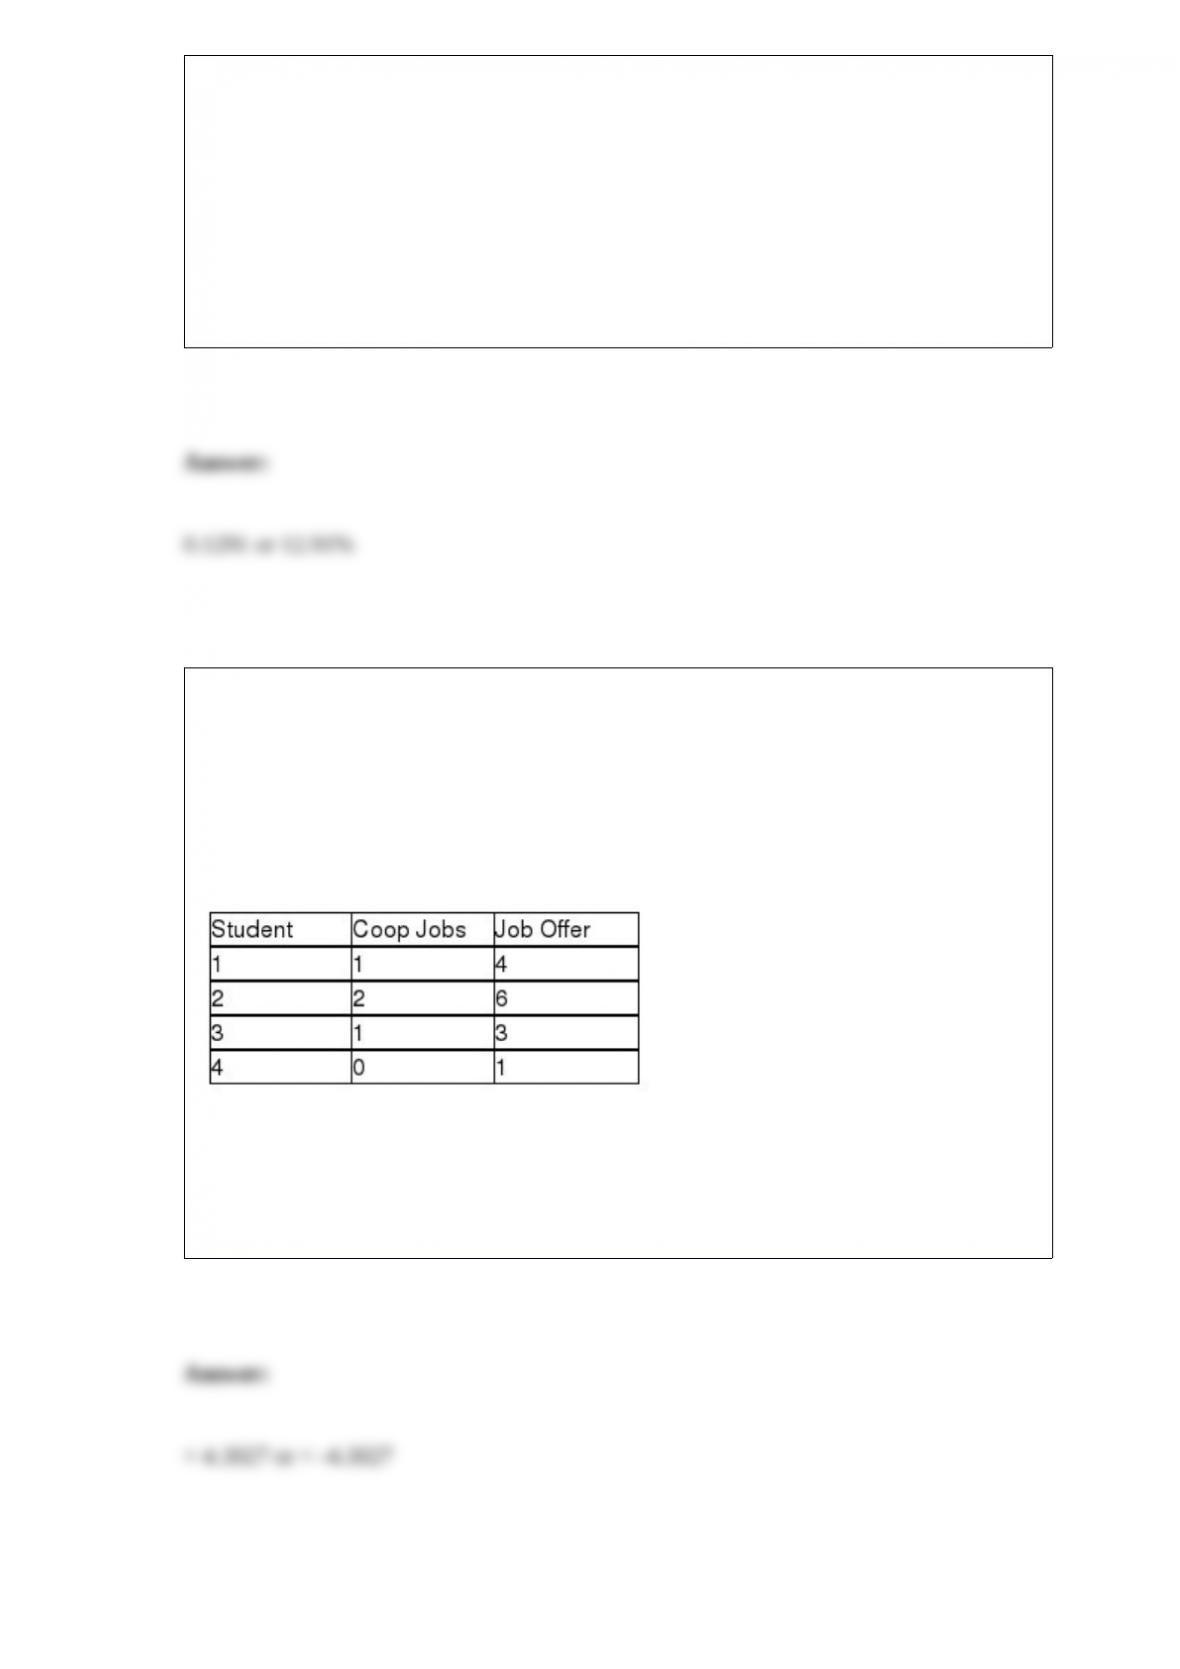
TABLE 13-3
The director of cooperative education at a state college wants to examine the effect of
cooperative education job experience on marketability in the work place. She takes a
random sample of 4 students. For these 4, she finds out how many times each had a
cooperative education job and how many job offers they received upon graduation.
These data are presented in the table below.
Referring to Table 13-3, the director of cooperative education wanted to test the
hypothesis that the population slope was equal to 0. For a test with a level of
significance of 0.05, the null hypothesis should be rejected if the value of the test
statistic is ________.
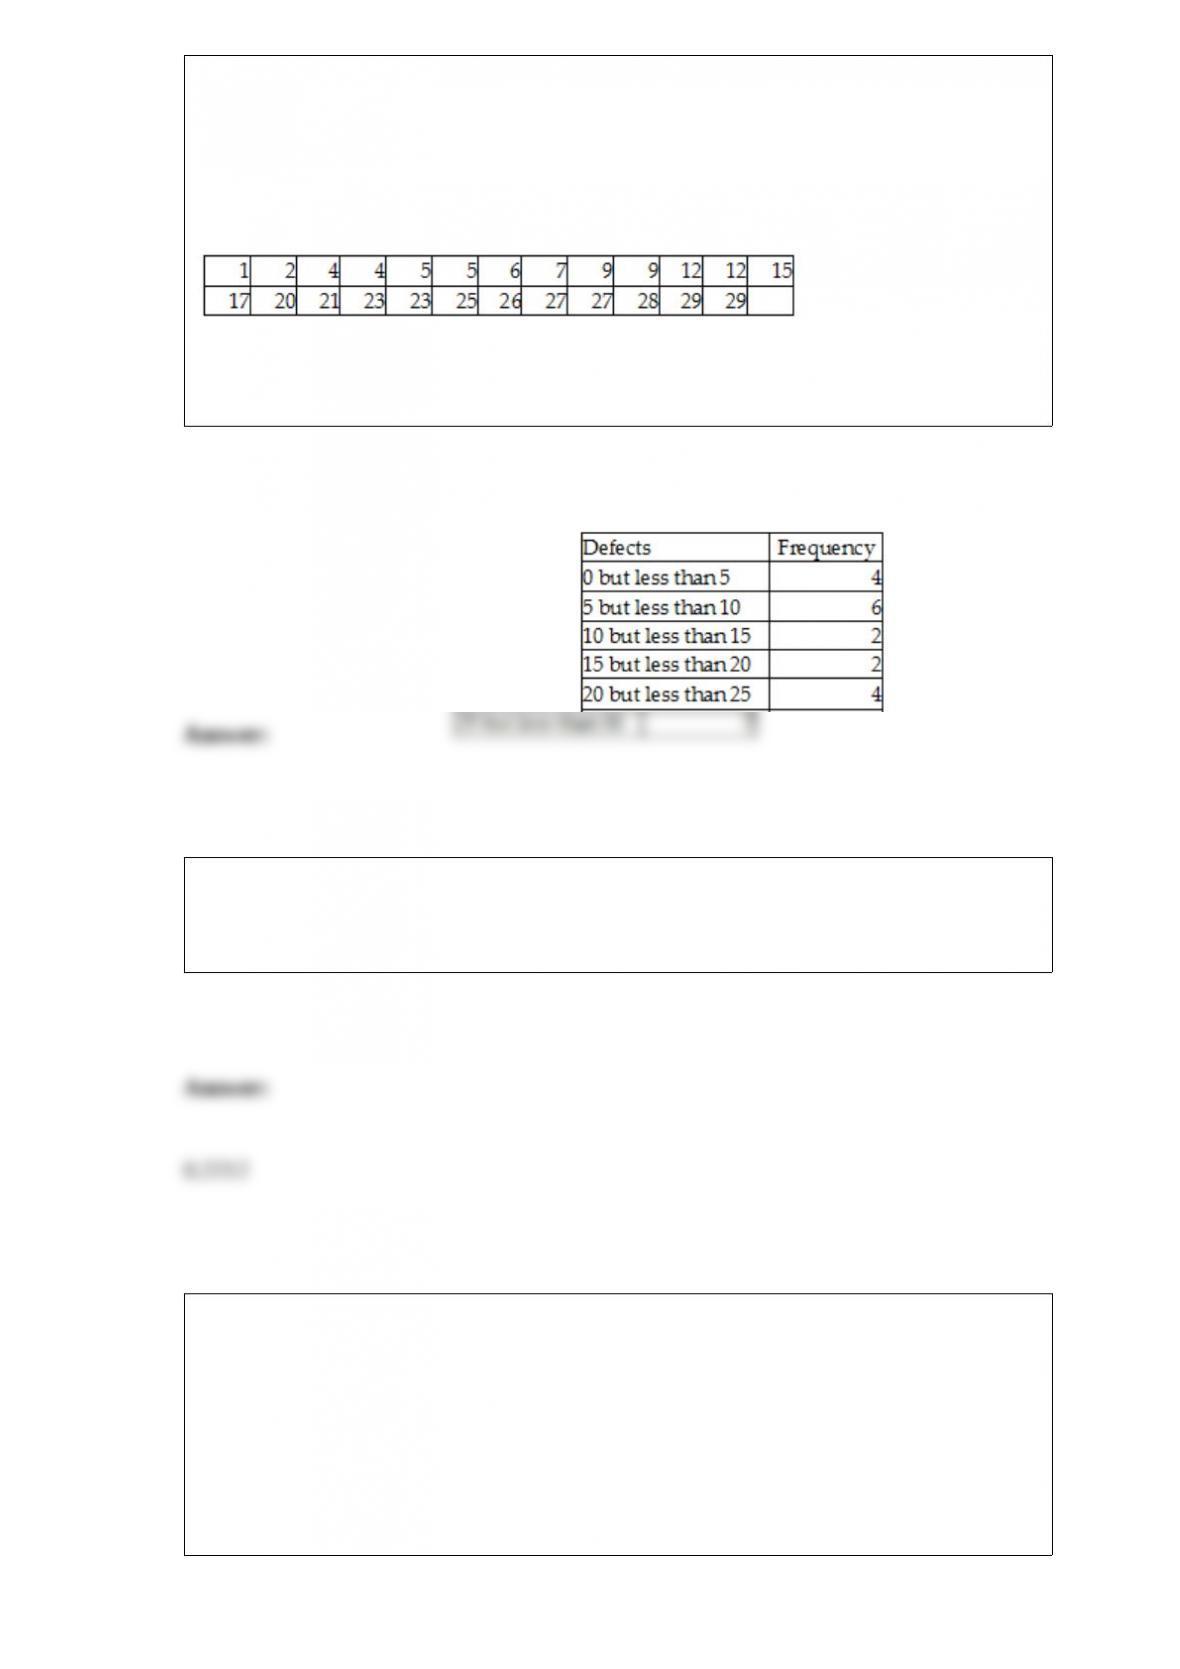
TABLE 2-11
The ordered array below resulted from selecting a sample of 25 batches of 500
computer chips and determining how many in each batch were defective.
Defects
Referring to Table 2-11, construct a frequency distribution for the defects data, using “0
but less than 5″ as the first class.
TABLE 17-10
Given below are results from the regression analysis where the dependent variable is
the number of weeks a worker is unemployed due to a layoff (Unemploy) and the
independent variables are the age of the worker (Age), the number of years of education
received (Edu), the number of years at the previous job (Job Yr), a dummy variable for
marital status (Married: 1 = married, 0 = otherwise), a dummy variable for head of
household (Head: 1 = yes, 0 = no) and a dummy variable for management position
(Manager: 1 = yes, 0 = no). We shall call this Model 1. The coefficient of partial
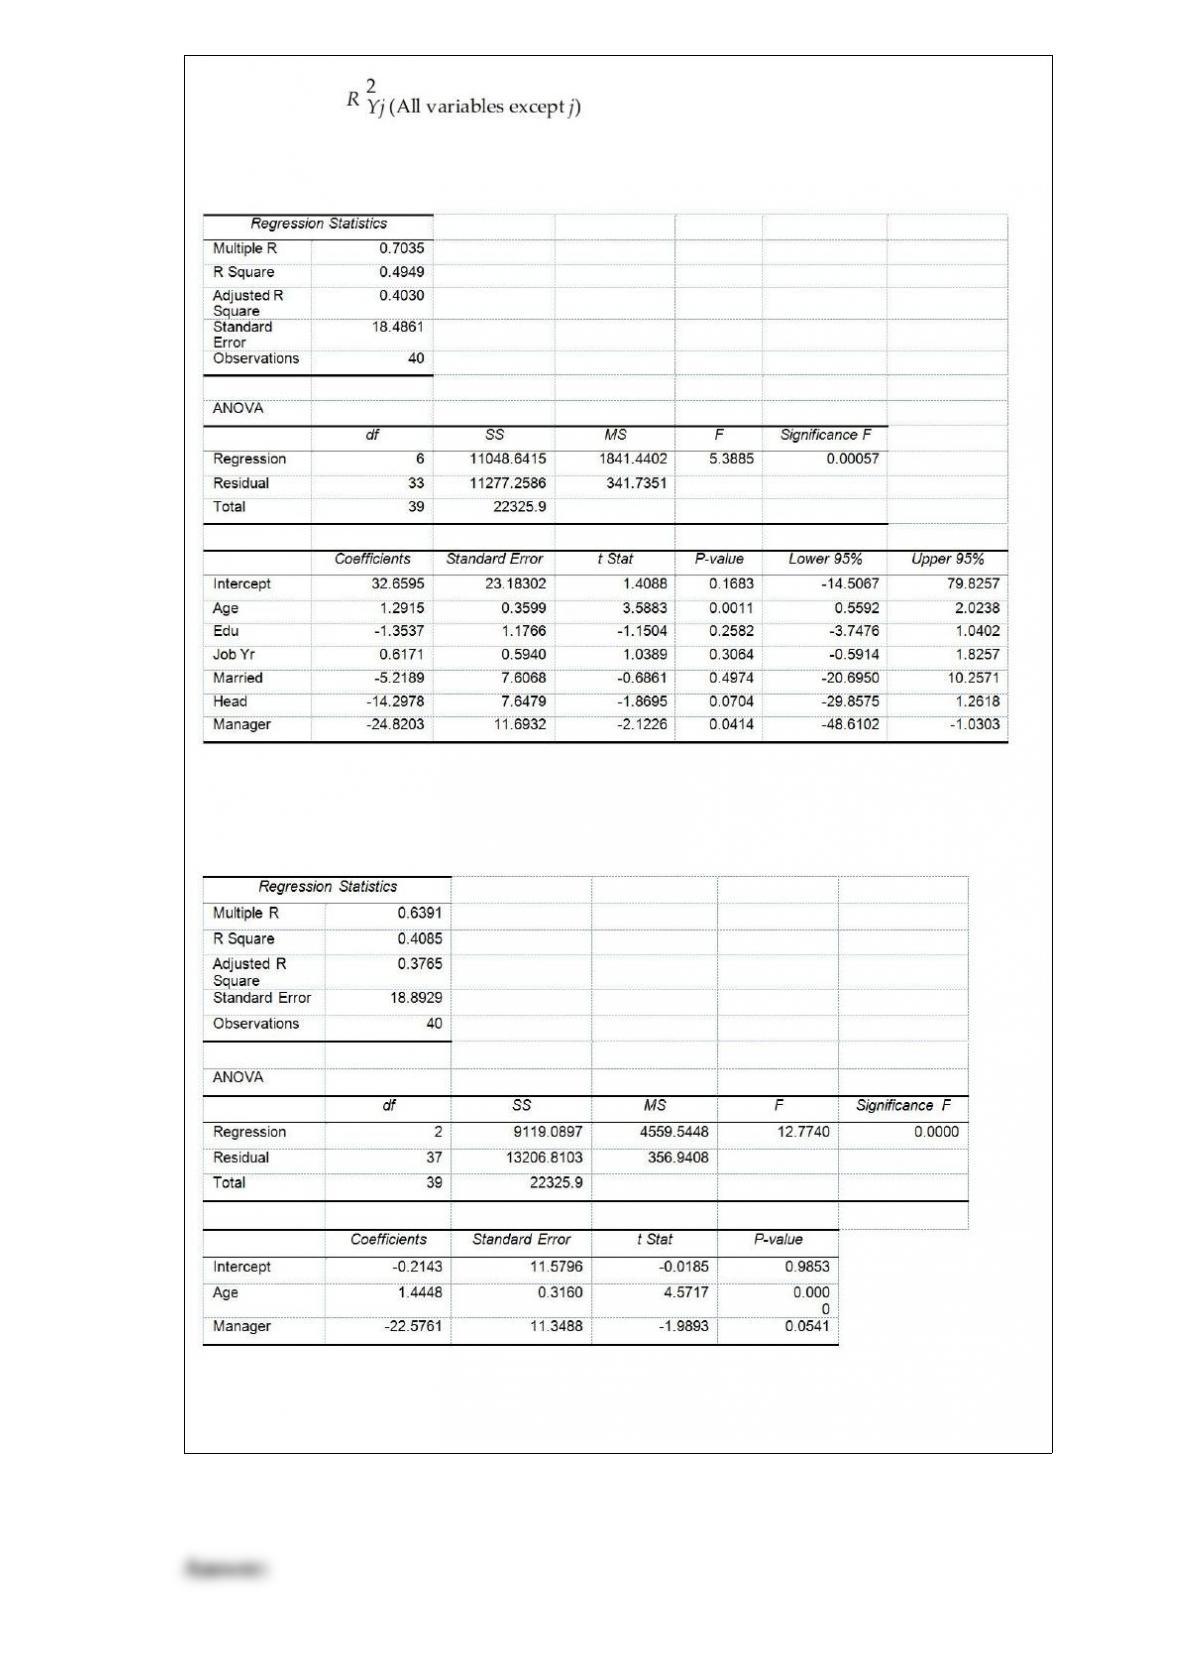
determination ( ) of each of the 6 predictors are, respectively,
0.2807, 0.0386, 0.0317, 0.0141, 0.0958, and 0.1201.
Model 2 is the regression analysis where the dependent variable is Unemploy and the
independent variables are Age and Manager. The results of the regression analysis are
given below:
Referring to Table 17-10, Model 1, what is the value of the test statistic to determine
whether there is a significant relationship between the number of weeks a worker is
unemployed due to a layoff and the entire set of explanatory variables?
The amount of bleach a machine pours into bottles has a mean of 36 oz. with a standard
deviation of 0.15 oz. Suppose we take a random sample of 36 bottles filled by this
machine. So, the middle 95% of the sample means based on sample sizes of 36 will be
between ________ and ________.