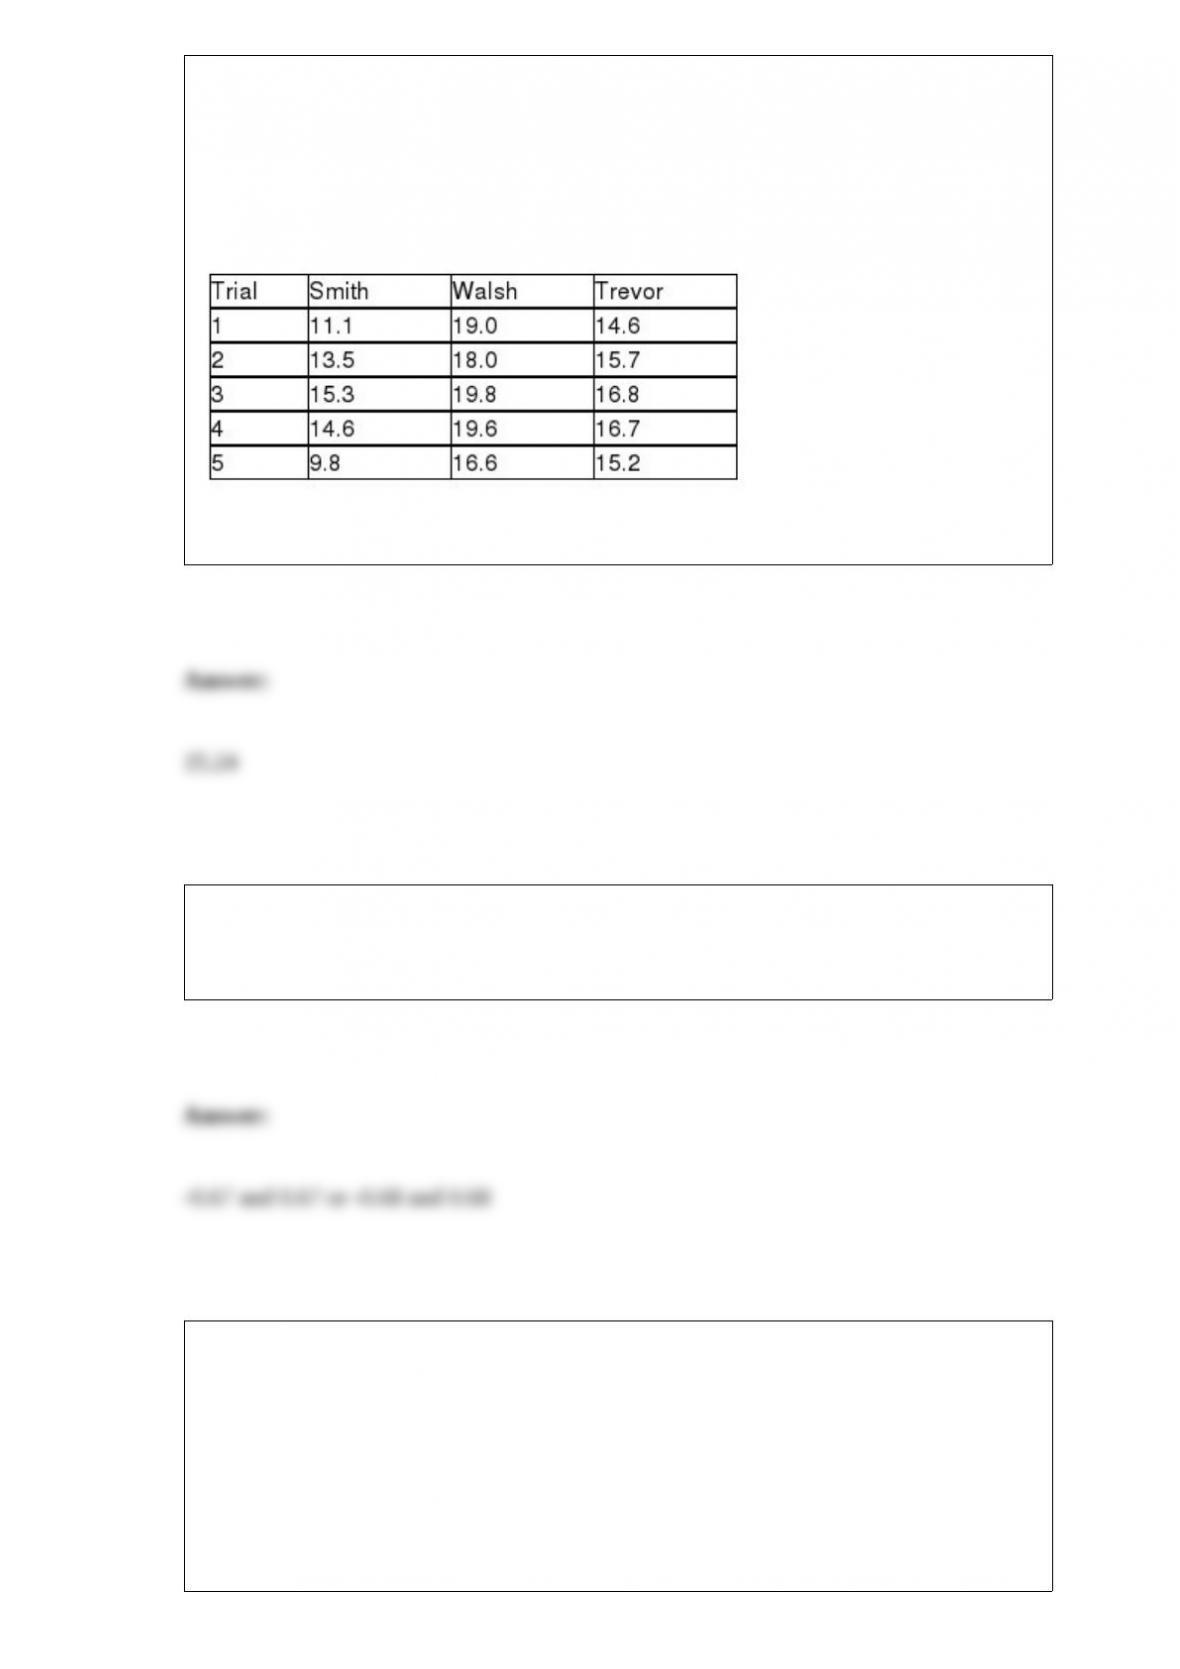
TABLE 11-4
An agronomist wants to compare the crop yield of 3 varieties of chickpea seeds. She
plants 15 fields, 5 with each variety. She then measures the crop yield in bushels per
acre. Treating this as a completely randomized design, the results are presented in the
table that follows.
Referring to Table 11-4, the value of the test statistic is ________.
Suppose Z has a standard normal distribution with a mean of 0 and standard deviation
of 1. So, 50% of the possible Z values are between ________ and ________
(symmetrically distributed about the mean).
TABLE 17-8
The superintendent of a school district wanted to predict the percentage of students
passing a sixth-grade proficiency test. She obtained the data on percentage of students
passing the proficiency test (% Passing), daily mean of the percentage of students
attending class (% Attendance), mean teacher salary in dollars (Salaries), and
instructional spending per pupil in dollars (Spending) of 47 schools in the state.
Following is the multiple regression output with Y = % Passing as the dependent
variable, X1 = % Attendance, X2 = Salaries and X3 = Spending:
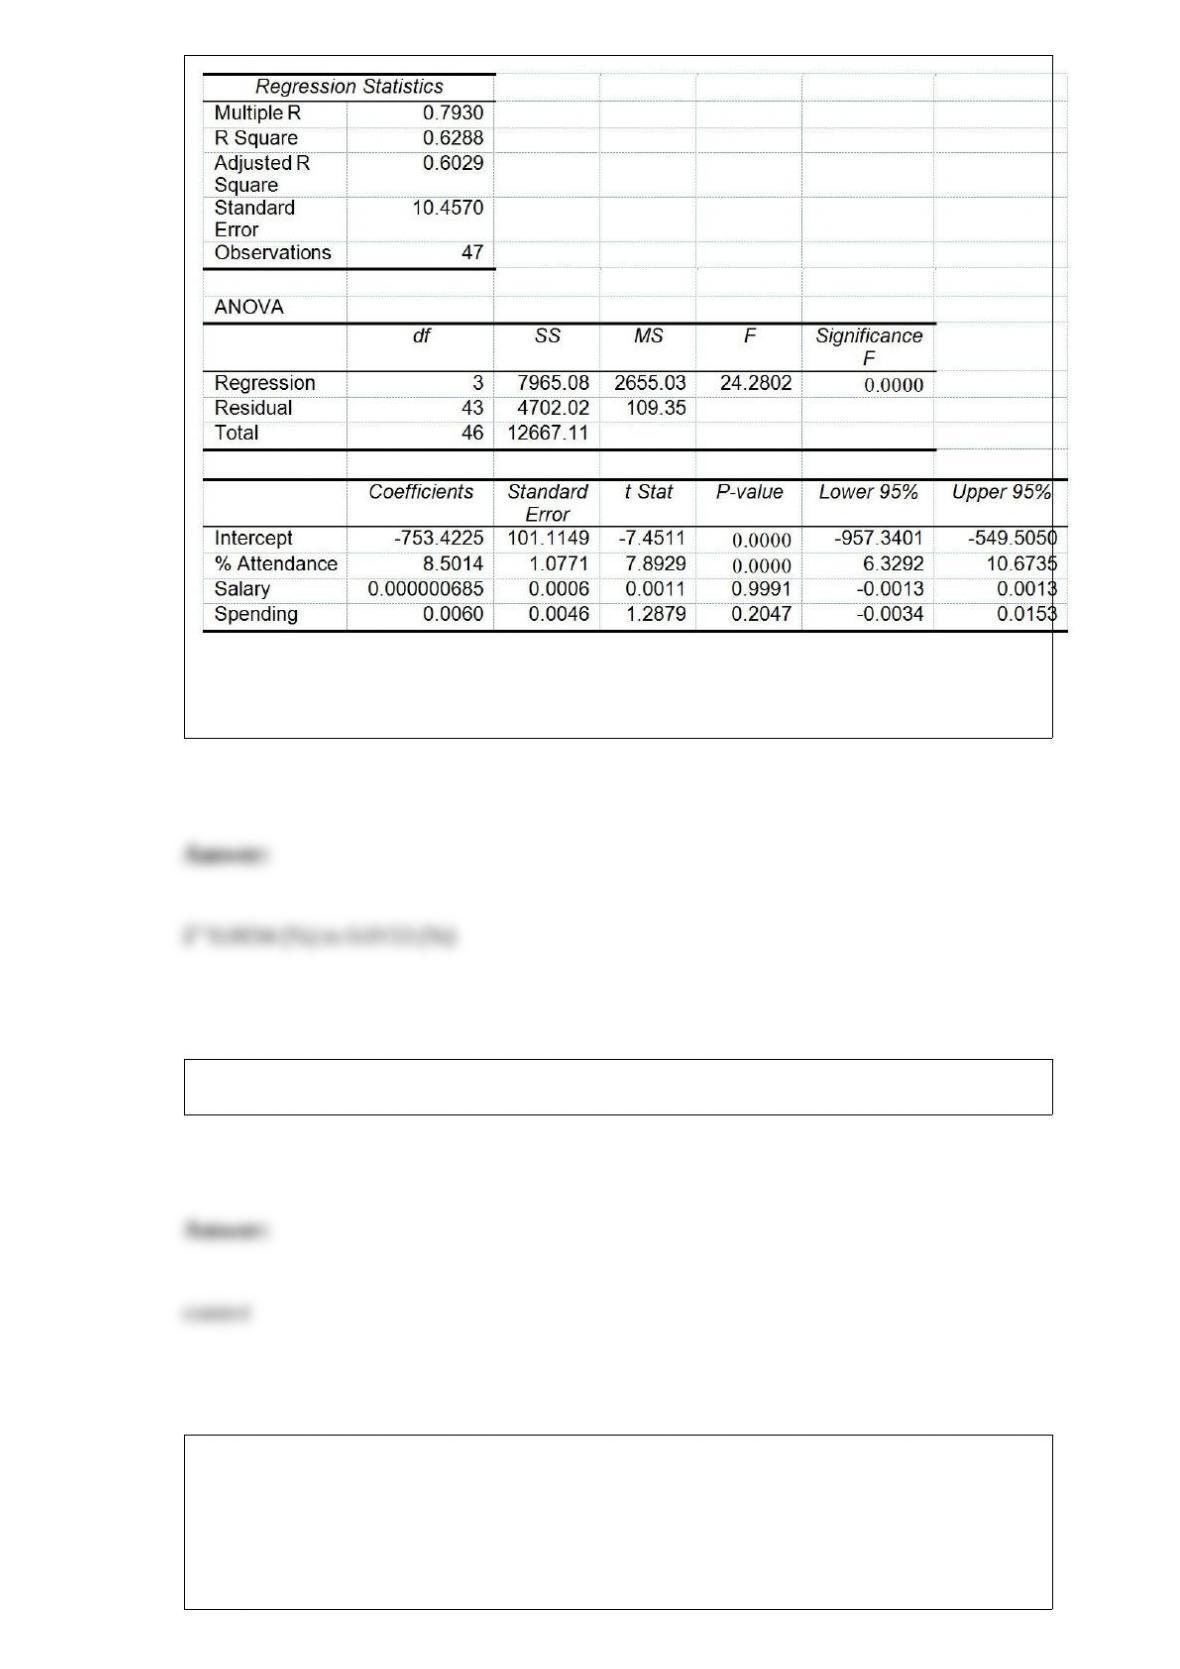
Referring to Table 17-8, what are the lower and upper limits of the 95% confidence
interval estimate for the effect of a one dollar increase in instructional spending per
pupil on the mean percentage of students passing the proficiency test?
If a researcher rejects a false null hypothesis, she has made a(n) ________ decision.
TABLE 17-12
The marketing manager for a nationally franchised lawn service company would like to
study the characteristics that differentiate home owners who do and do not have a lawn
service. A random sample of 30 home owners located in a suburban area near a large
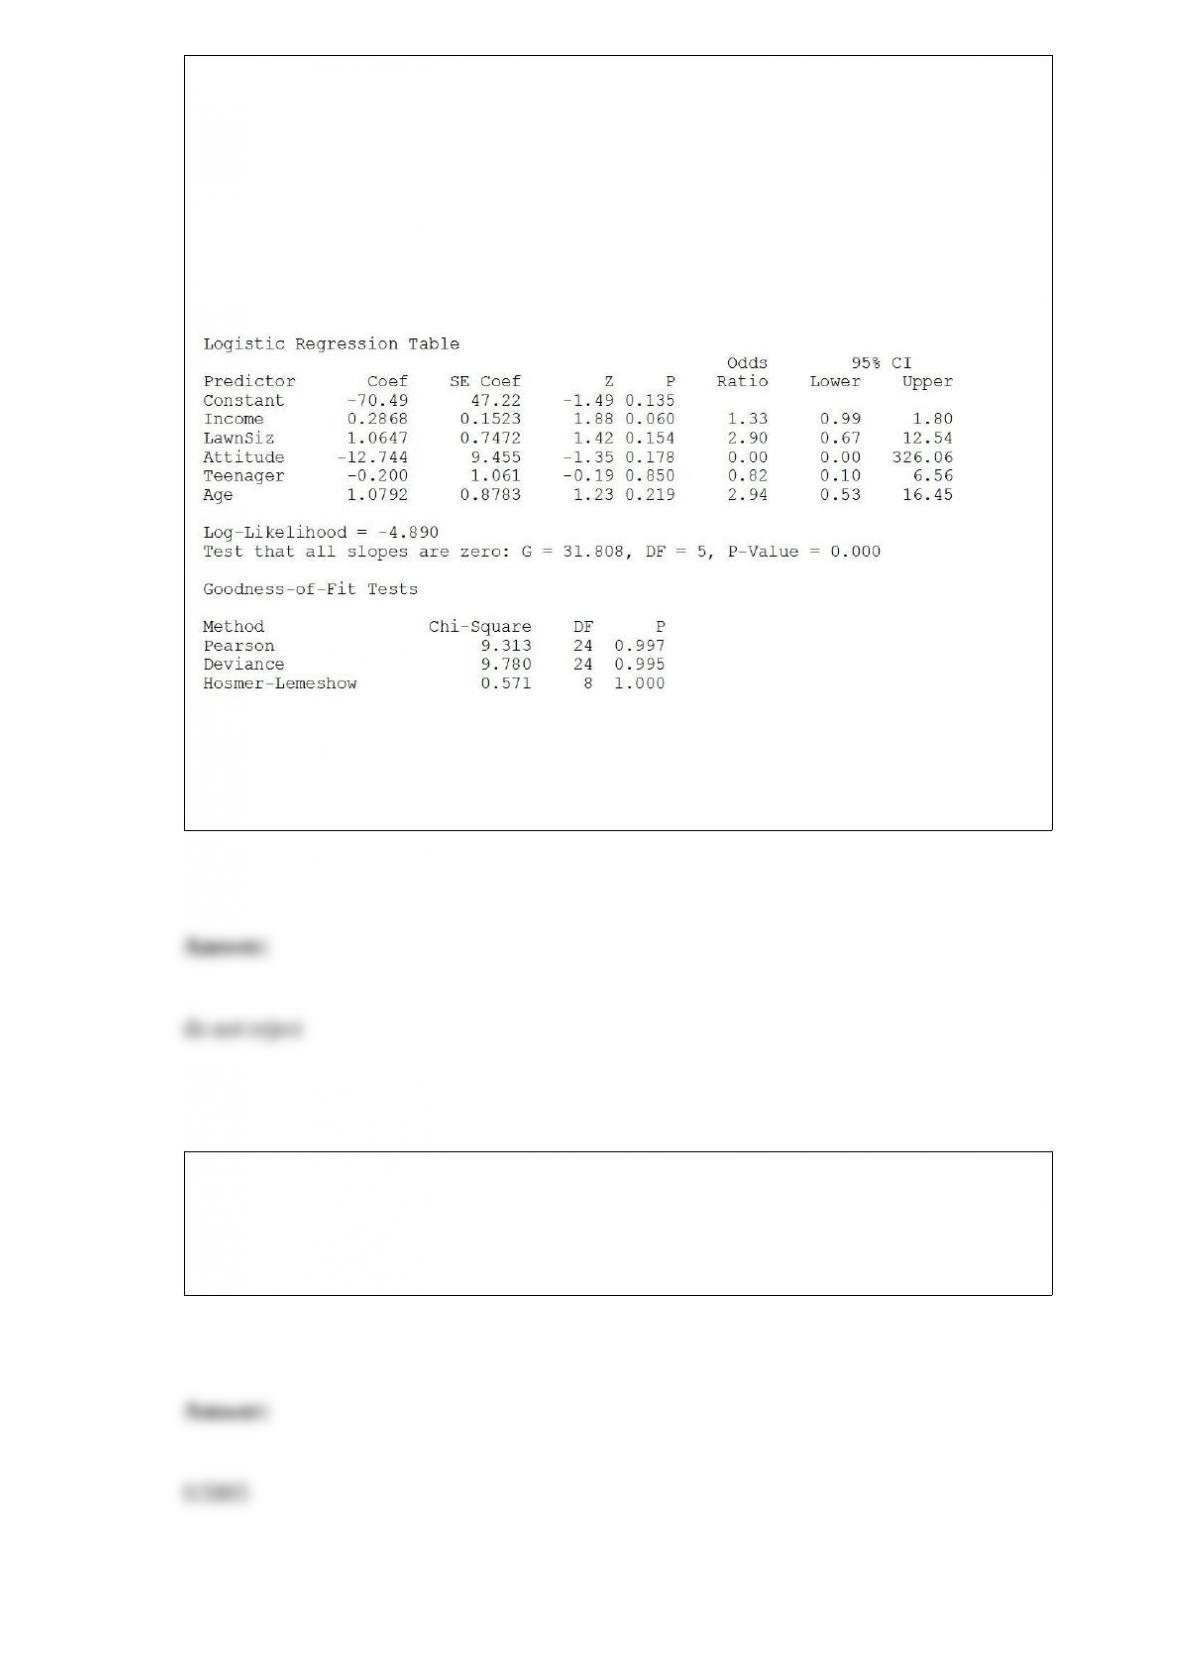
city was selected; 15 did not have a lawn service (code 0) and 15 had a lawn service
(code 1). Additional information available concerning these 30 home owners includes
family income (Income, in thousands of dollars), lawn size (Lawn Size, in thousands of
square feet), attitude toward outdoor recreational activities (Attitude 0 = unfavorable, 1
= favorable), number of teenagers in the household (Teenager), and age of the head of
the household (Age).
The Minitab output is given below:
Referring to Table 17-12, what should be the decision (‘reject’ or ‘do not reject’) on the
null hypothesis when testing whether Teenager makes a significant contribution to the
model in the presence of the other independent variables at a 0.05 level of significance?
The owner of a fish market determined that the average weight for a catfish is 3.2
pounds with a standard deviation of 0.8 pound. Assuming the weights of catfish are
normally distributed, the probability that a randomly selected catfish will weigh
between 3 and 5 pounds is ________.
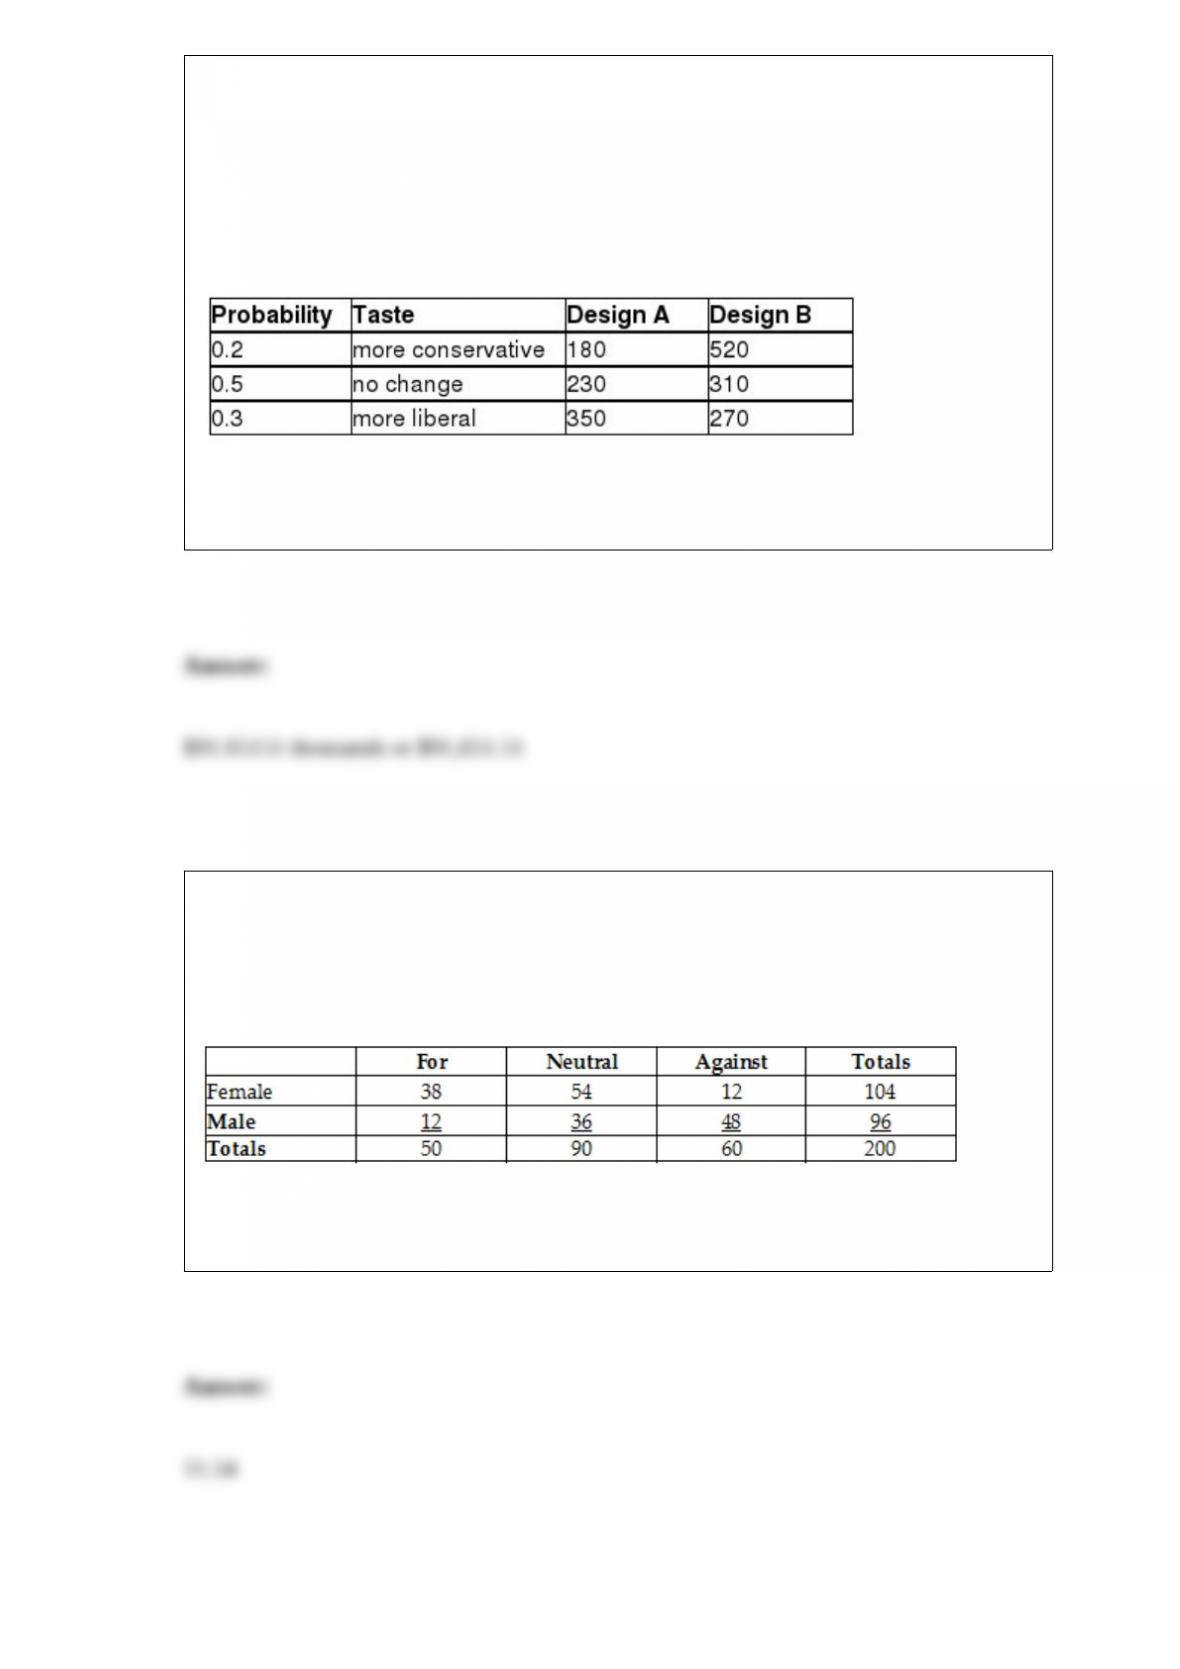
TABLE 5-8
Two different designs on a new line of winter jackets for the coming winter are
available for your manufacturing plants. Your profit (in thousands of dollars) will
depend on the taste of the consumers when winter arrives. The probability of the three
possible different tastes of the consumers and the corresponding profits are presented in
the following table.
Referring to Table 5-8, what is the standard deviation of your profit when Design B is
chosen?
TABLE 2-12
The table below contains the opinions of a sample of 200 people broken down by
gender about the latest congressional plan to eliminate anti-trust exemptions for
professional baseball.
Referring to Table 2-12, of the females in the sample, ________ percent were against
the plan.