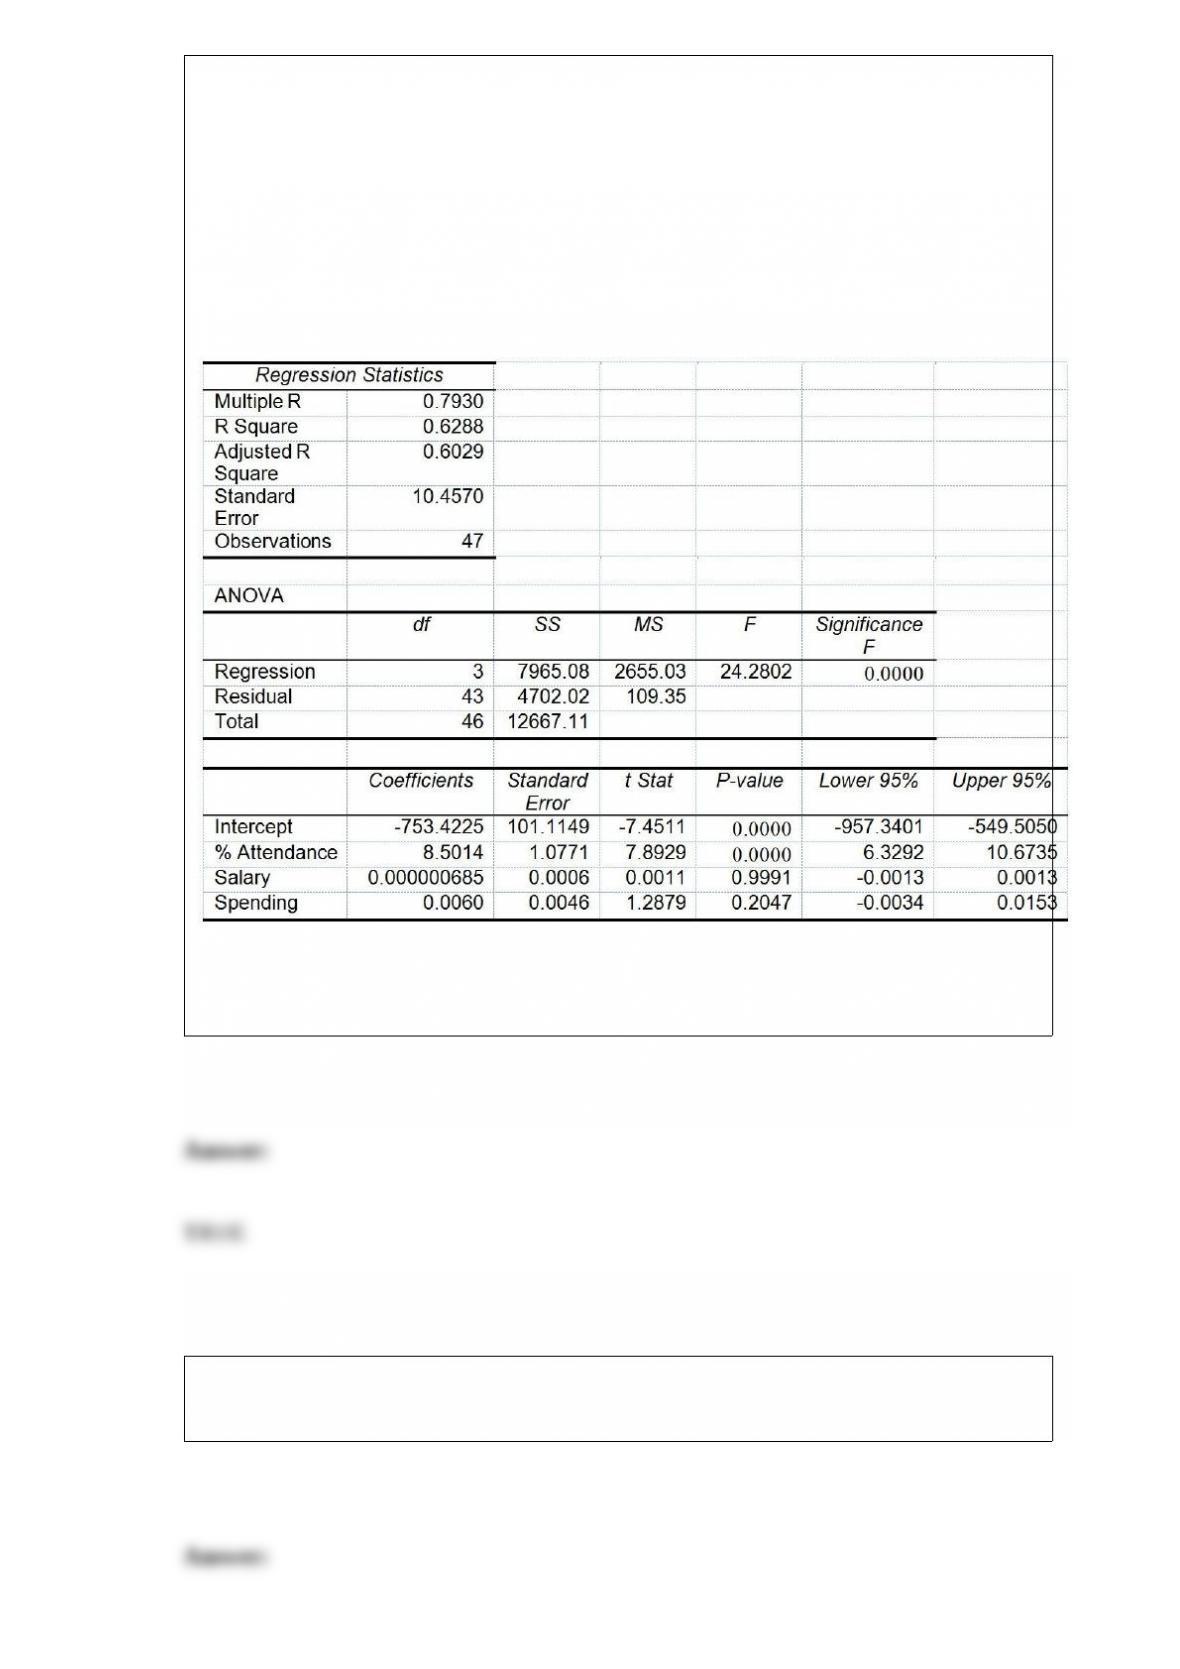
True or False: TABLE 17-8
The superintendent of a school district wanted to predict the percentage of students
passing a sixth-grade proficiency test. She obtained the data on percentage of students
passing the proficiency test (% Passing), daily mean of the percentage of students
attending class (% Attendance), mean teacher salary in dollars (Salaries), and
instructional spending per pupil in dollars (Spending) of 47 schools in the state.
Following is the multiple regression output with Y = % Passing as the dependent
variable, X1 = % Attendance, X2 = Salaries and X3 = Spending:
Referring to Table 17-8, the alternative hypothesis H1 : At least one of βj ≠0 for j =
1, 2, 3 implies that the percentage of students passing the proficiency test is affected by
at least one of the explanatory variables.
True or False: If P(A) = 0.4 and P(B) = 0.6, then A and B must be collectively
exhaustive.
True or False: A survey was conducted to determine how people rated the quality of
programming available on television. Respondents were asked to rate the overall
quality from 0 (no quality at all) to 100 (extremely good quality). A cumulative
percentage polygon (ogive) can be used to present this information.
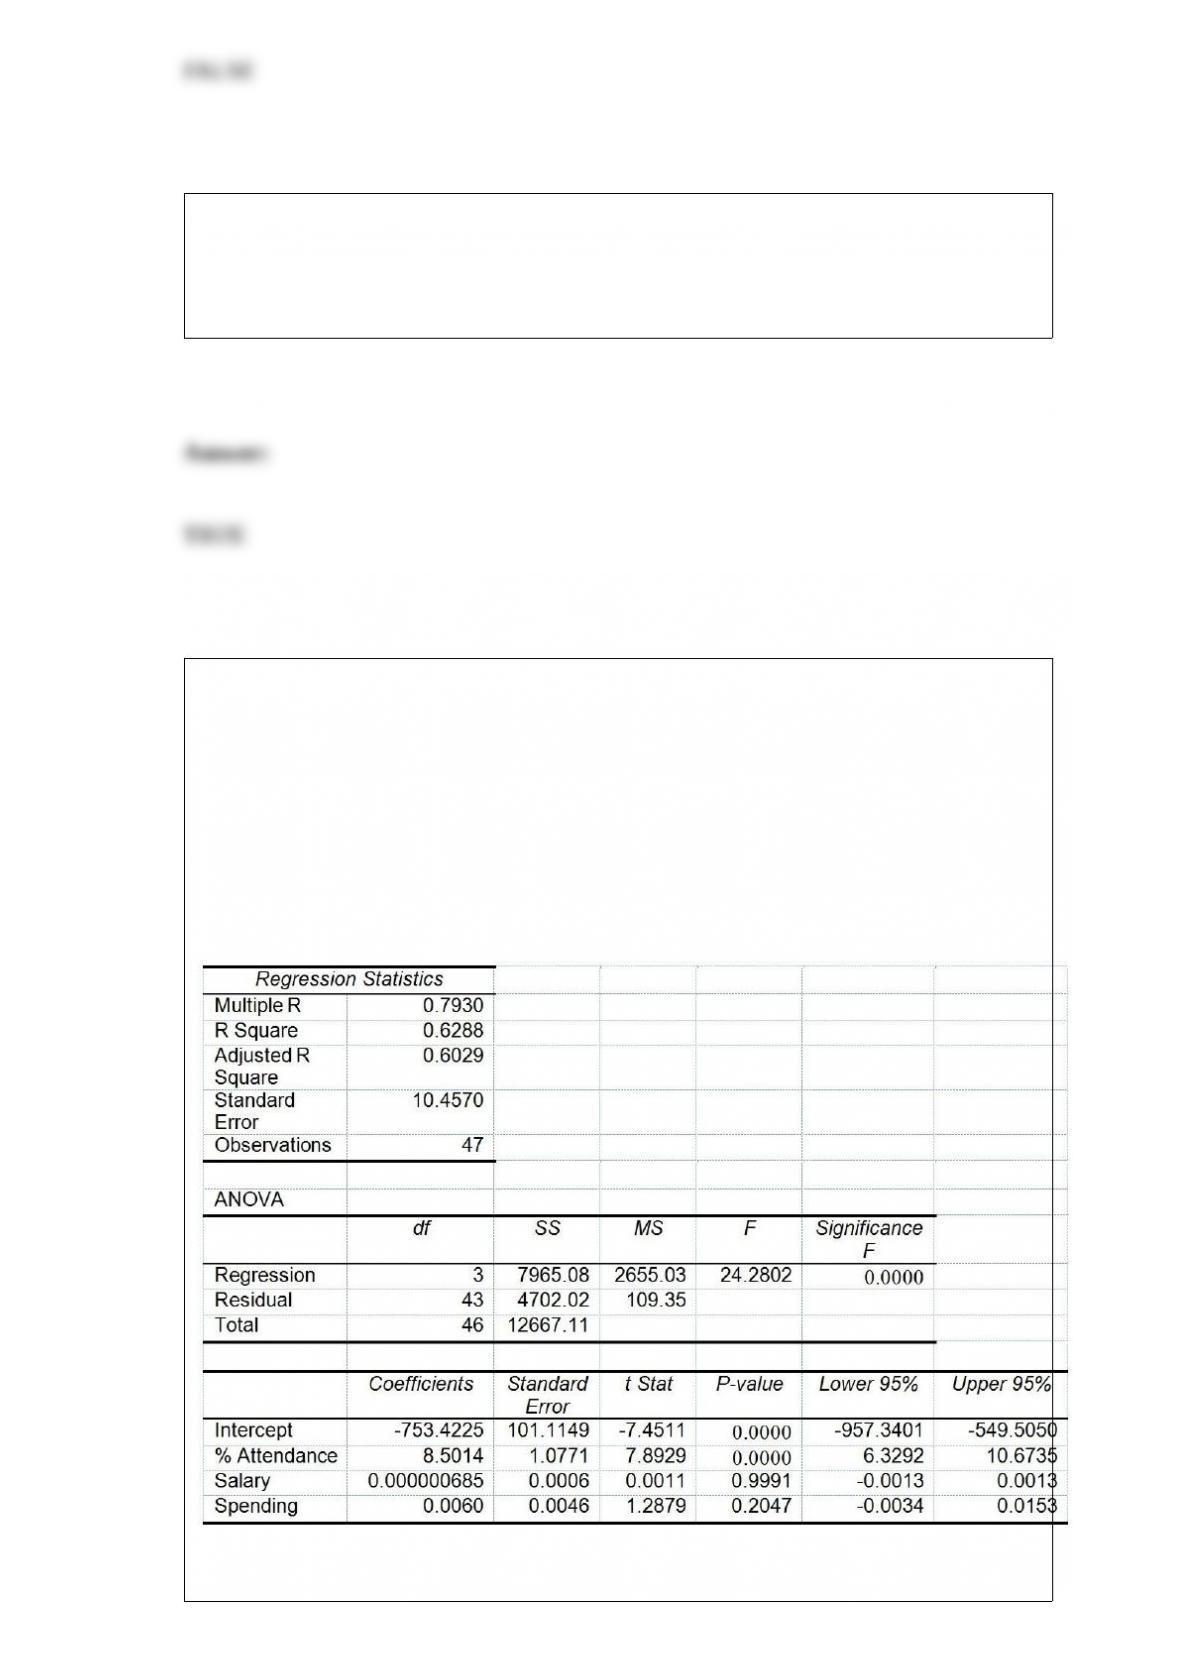
True or False: TABLE 17-8
The superintendent of a school district wanted to predict the percentage of students
passing a sixth-grade proficiency test. She obtained the data on percentage of students
passing the proficiency test (% Passing), daily mean of the percentage of students
attending class (% Attendance), mean teacher salary in dollars (Salaries), and
instructional spending per pupil in dollars (Spending) of 47 schools in the state.
Following is the multiple regression output with Y = % Passing as the dependent
variable, X1 = % Attendance, X2 = Salaries and X3 = Spending:
Referring to Table 17-8, the null hypothesis should be rejected at a 5% level of
significance when testing whether instructional spending per pupil has any effect on the
percentage of students passing the proficiency test, taking into account the effect of all
the other independent variables.
True or False: The possible responses to the question “How many times in the past three
months have you visited a city park?” are values from a discrete variable.
True or False: An investment consultant is recommending a certain class of mutual
funds to the clienteles based on its exceptionally high probability of exceptionally high
gain. It is an unethical practice to tell the clienteles the probability of a loss in her
recommendations.
TABLE 8-2
A quality control engineer is interested in the mean length of sheet insulation being cut
automatically by machine. The desired mean length of the insulation is 12 feet. It is
known that the standard deviation in the cutting length is 0.15 feet. A sample of 70 cut
sheets yields a mean length of 12.14 feet. This sample will be used to obtain a 99%
confidence interval for the mean length cut by machine.
True or False: Referring to Table 8-2, the confidence interval indicates that the machine
is not working properly.
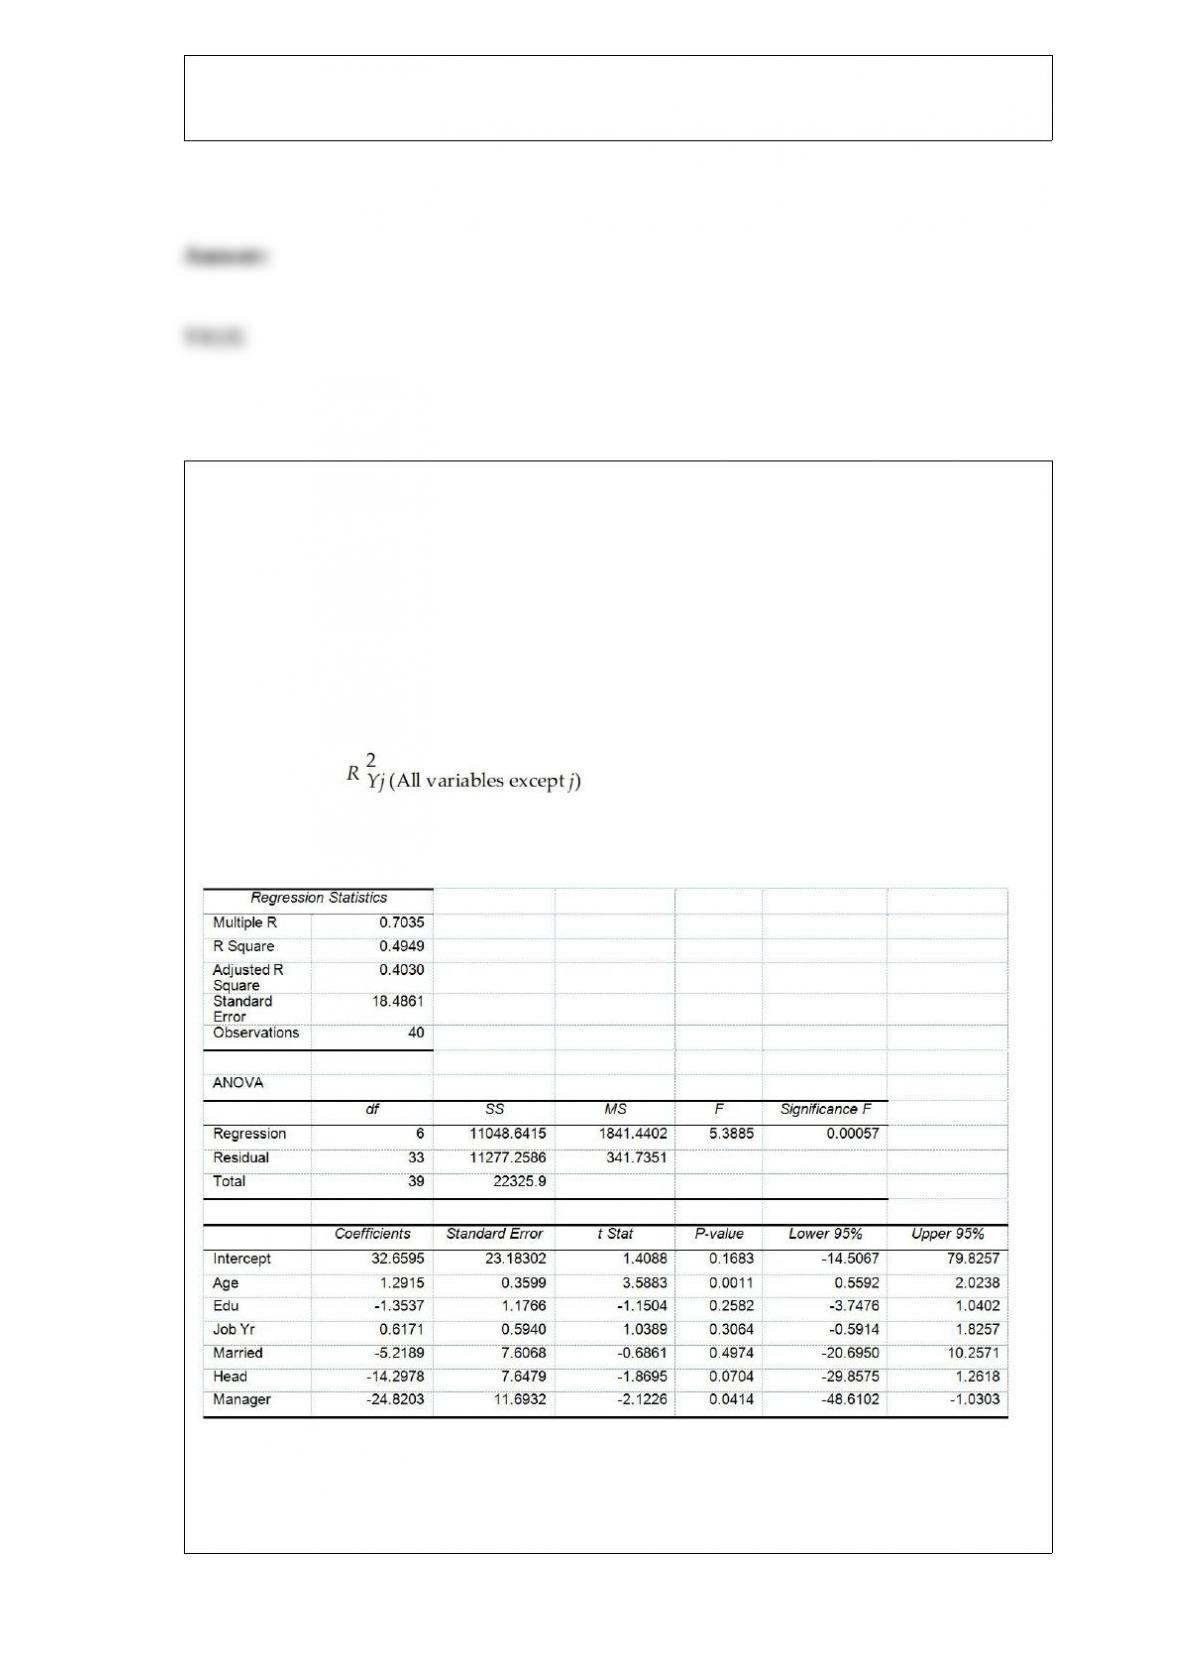
True or False: TABLE 17-10
Given below are results from the regression analysis where the dependent variable is
the number of weeks a worker is unemployed due to a layoff (Unemploy) and the
independent variables are the age of the worker (Age), the number of years of education
received (Edu), the number of years at the previous job (Job Yr), a dummy variable for
marital status (Married: 1 = married, 0 = otherwise), a dummy variable for head of
household (Head: 1 = yes, 0 = no) and a dummy variable for management position
(Manager: 1 = yes, 0 = no). We shall call this Model 1. The coefficient of partial
determination ( ) of each of the 6 predictors are, respectively,
0.2807, 0.0386, 0.0317, 0.0141, 0.0958, and 0.1201.
Model 2 is the regression analysis where the dependent variable is Unemploy and the
independent variables are Age and Manager. The results of the regression analysis are
given below:
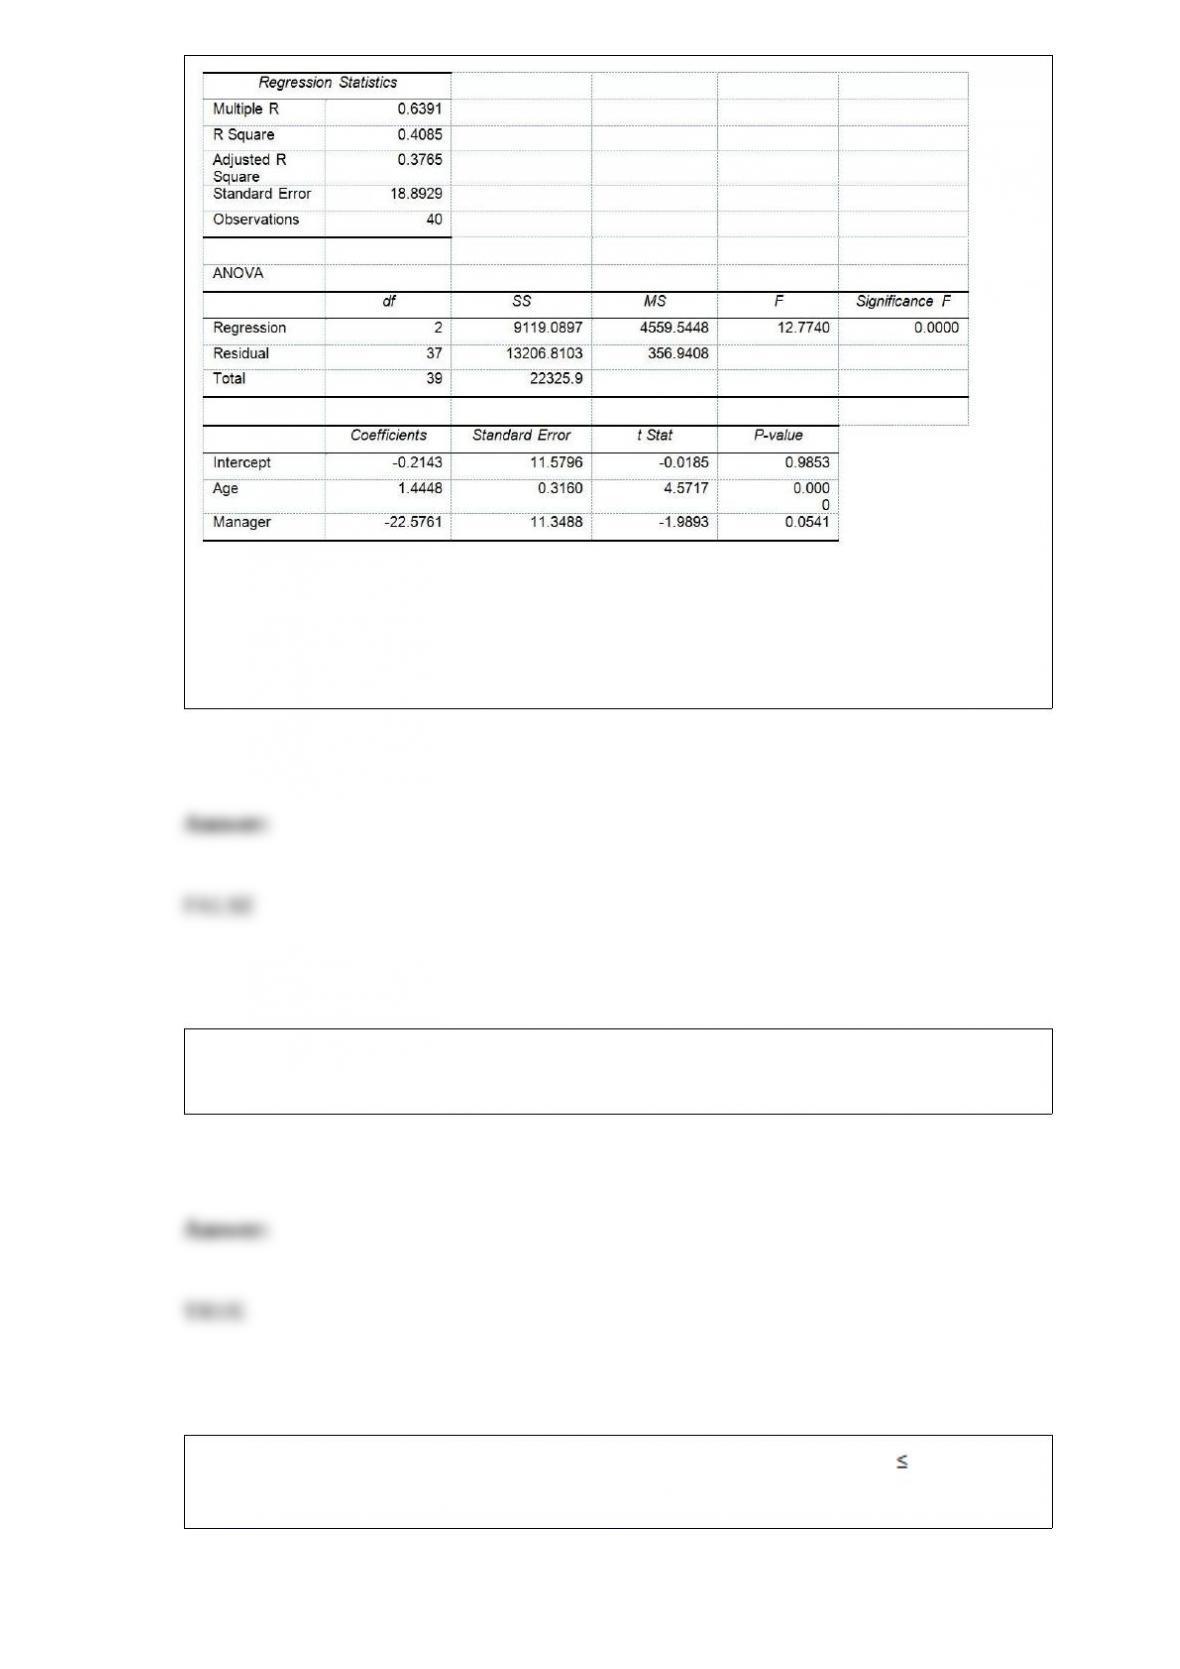
Referring to Table 17-10 and using both Model 1 and Model 2, the null hypothesis for
testing whether the independent variables that are not significant individually are also
not significant as a group in explaining the variation in the dependent variable should
be rejected at a 5% level of significance.
True or False: The amount of time a student spent studying for an exam is an example
of a continuous variable.
True or False: Using the Cpstatistic in model building, all models with Cp (k + 1) are
equally good.
The owner of a local nightclub has recently surveyed a random sample of n = 250
customers of the club. She would now like to determine whether or not the mean age of
her customers is greater than 30. If so, she plans to alter the entertainment to appeal to
an older crowd. If not, no entertainment changes will be made. Suppose she found that
the sample mean was 30.45 years and the sample standard deviation was 5 years. What
is the p-value associated with the test statistic?
A) 0.3577
B) 0.1423
C) 0.0780
D) 0.02
A catalog company that receives the majority of its orders by telephone conducted a
study to determine how long customers were willing to wait on hold before ordering a
product. The length of waiting time was found to be a variable best approximated by an
exponential distribution with a mean length of waiting time equal to 2.8 minutes (i.e.
the mean number of calls answered in a minute is ). What is the probability that a
randomly selected caller is placed on hold fewer than 7 minutes?
A) 0.0009119
B) 0.082085
C) 0.917915
D) 0.9990881
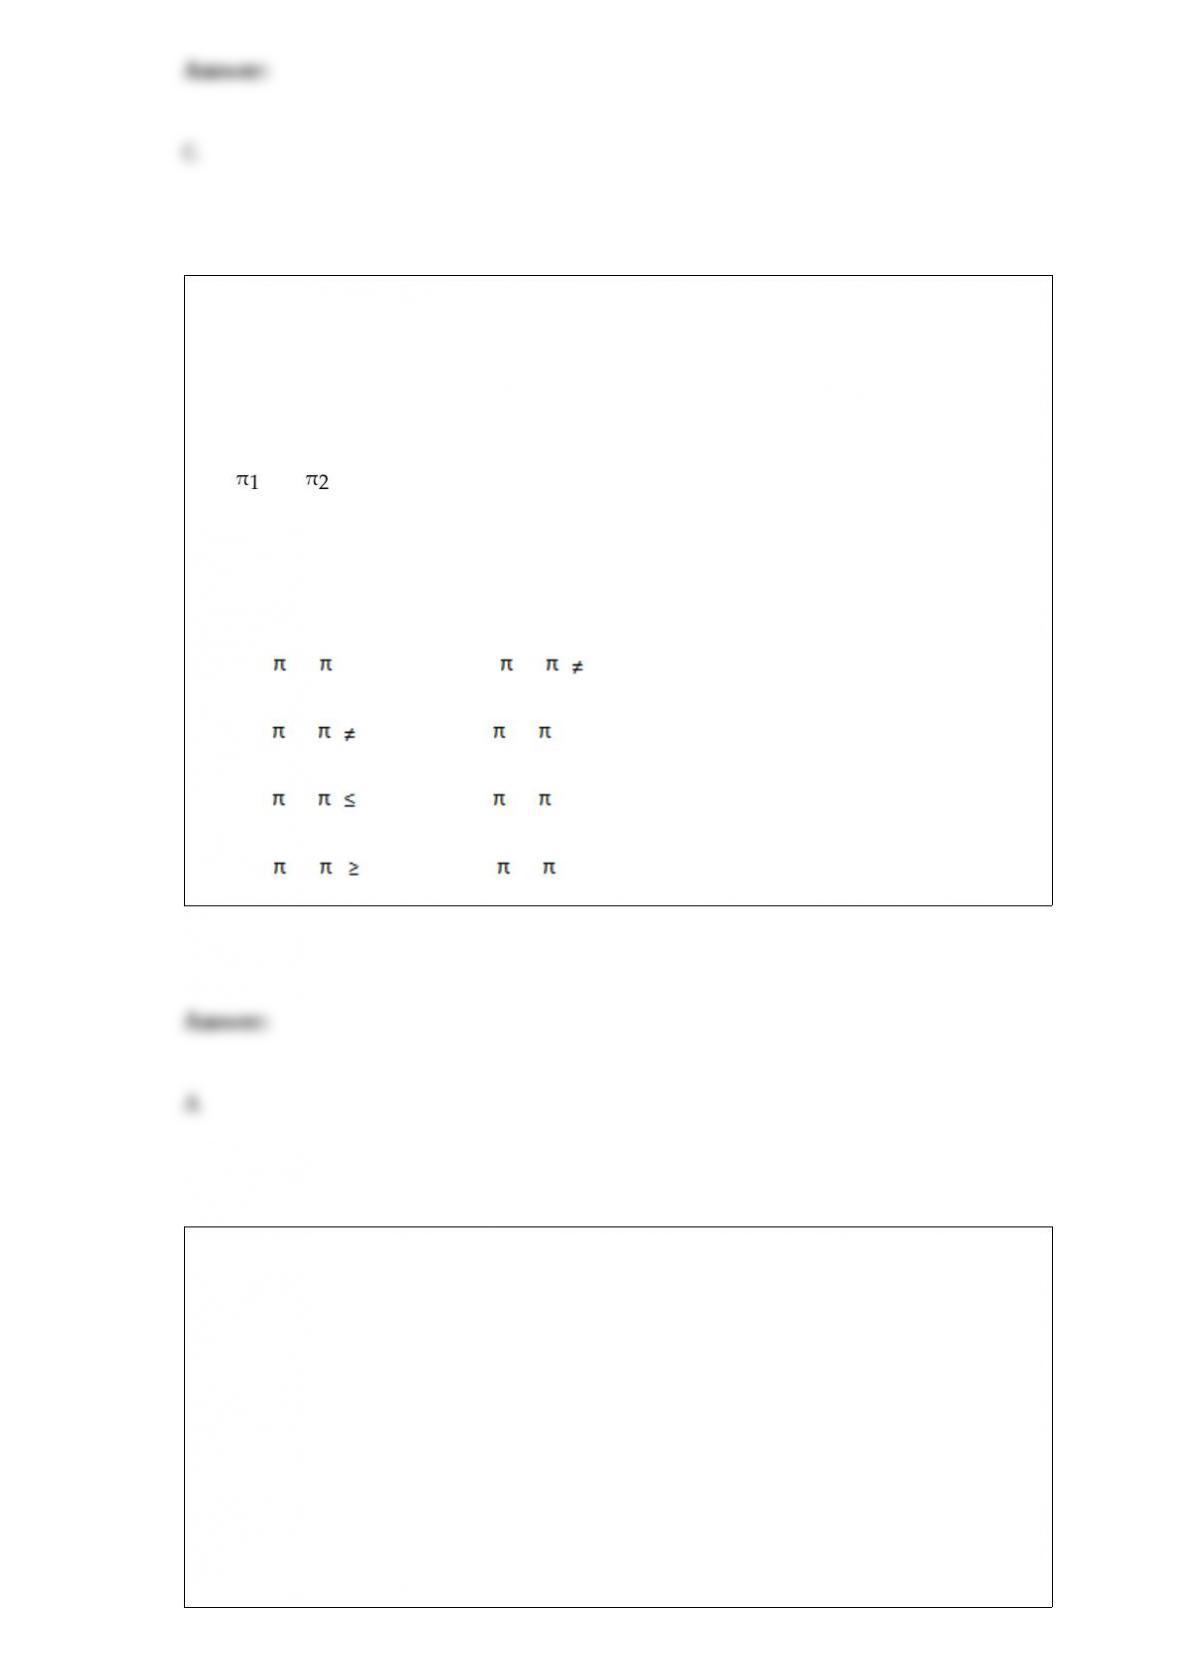
TABLE 12-1
A corporation randomly selects 150 salespeople and finds that 66% who have never
taken a self-improvement course would like such a course. The firm did a similar study
10 years ago in which 60% of a random sample of 160 salespeople wanted a
self-improvement course. The groups are assumed to be independent random samples.
Let and represent the true proportion of workers who would like to attend a
self-improvement course in the recent study and the past study, respectively.
Referring to Table 12-1, if the firm wanted to test whether this proportion has changed
from the previous study, which represents the relevant hypotheses?
A) H0 : 1 – 2 = 0 versus H1 : 1 – 2 0
B) H0 : 1 – 2 0 versus H1 : 1 – 2 = 0
C) H0 : 1 – 2 0 versus H1 : 1 – 2 > 0
D) H0 : 1 – 2 0 versus H1 : 1 – 2 < 0
According to a survey of American households, the probability that the residents own 2
cars if annual household income is over $50,000 is 80%. Of the households surveyed,
60% had incomes over $50,000 and 70% had 2 cars. The probability that the residents
of a household do not own 2 cars and have an income over $50,000 a year is
A) 0.12.
B) 0.18.
C) 0.22.
D) 0.48.
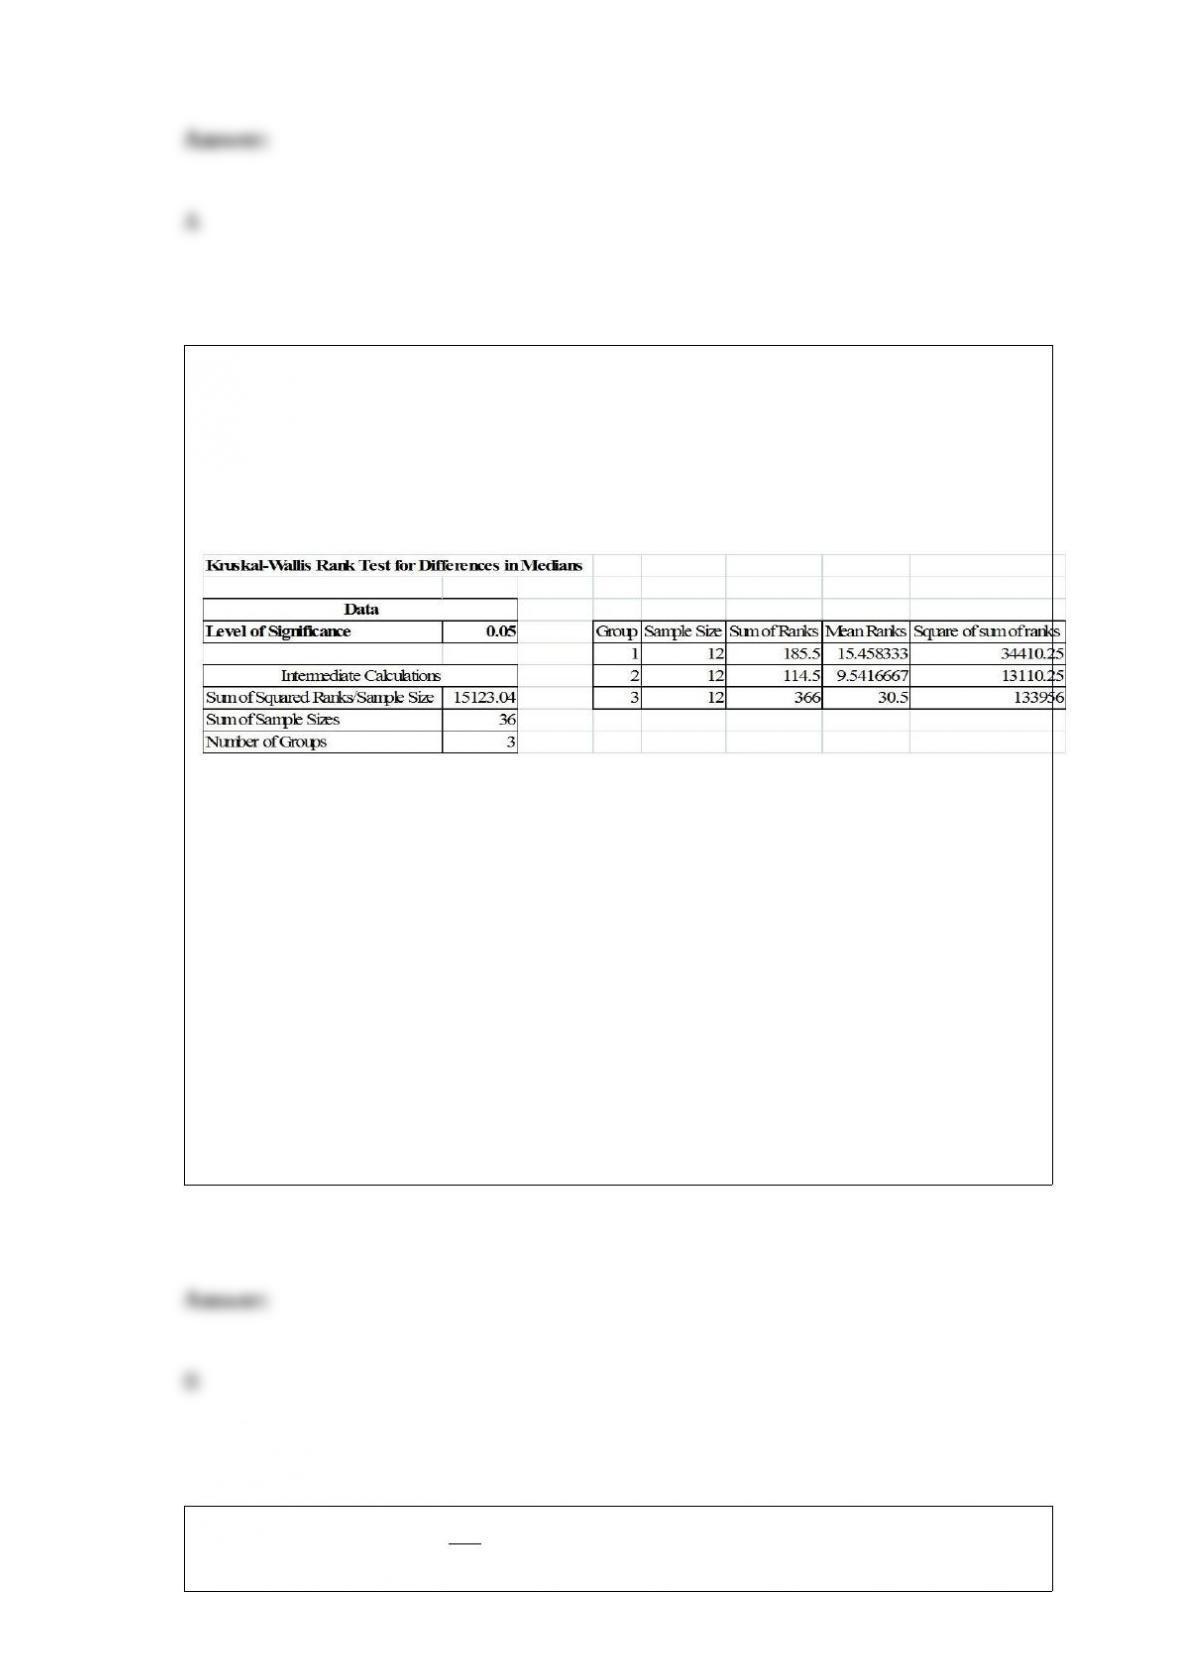
TABLE 12-17
Three new different models of compact SUVs have just arrived at the market. You are
interested in comparing the gas mileage performance of all three models to see if they
are the same. A partial computer output for twelve compact SUVs of each model is
given below:
You are told that the gas mileage population distributions for all three models are not
normally distributed.
Referring to Table 12-17, what is your conclusion on the test using a 5% level of
significance?
A) There is not enough evidence of a difference in median gas mileage.
B) There is evidence of a difference in median gas mileage.
C) There is not enough evidence of a difference in mean gas mileage.
D) There is evidence of a difference in mean gas mileage.
Which of the following is not a decision-making criterion?
A) Maximizing the expected monetary value of an action
B) Minimizing the expected opportunity loss of an action
C) Minimizing expected profit under certainty
D) Maximizing the return-to-risk ratio
In its standardized form, the normal distribution
A) has a mean of 0 and a standard deviation of 1.
B) has a mean of 1 and a variance of 0.
C) has an area equal to 0.5.
D) cannot be used to approximate discrete probability distributions.
True or False: A normal probability plot may be used to assess the assumption of
normality for a particular set of data.
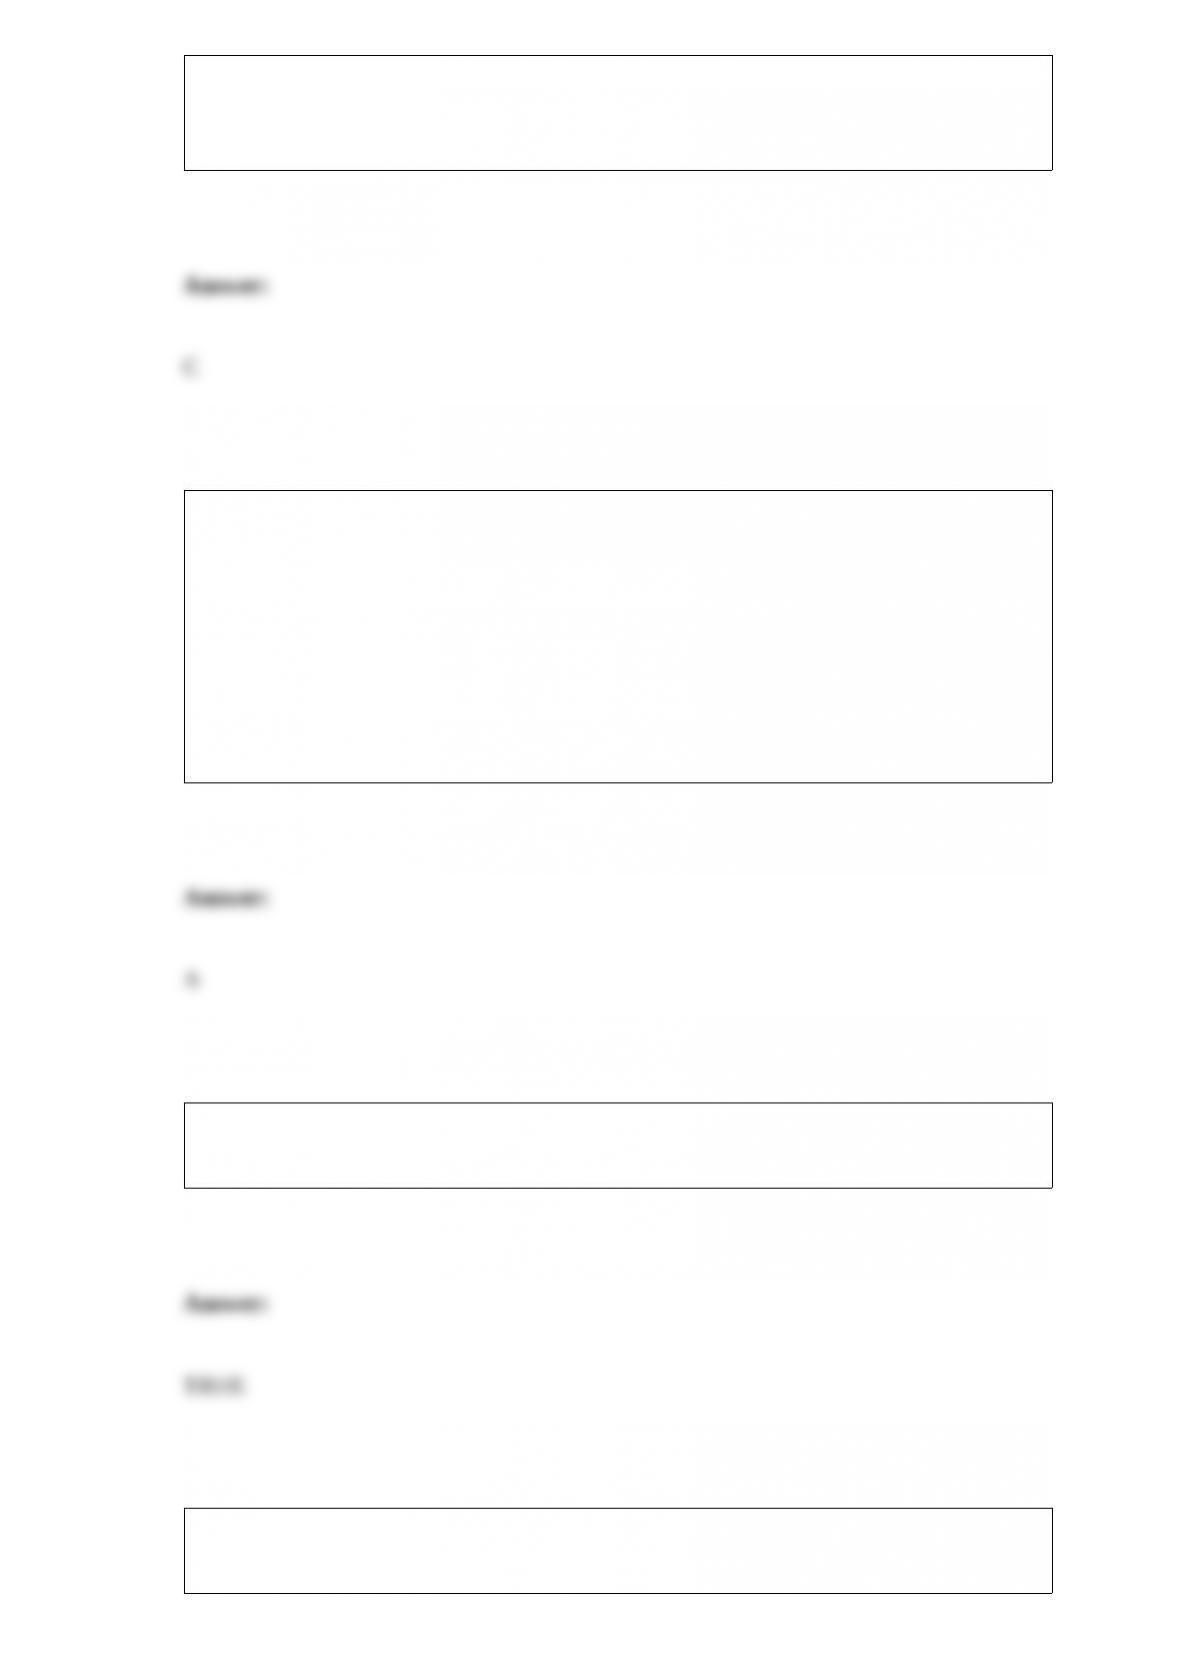
Referring to Table 14-5, what are the predicted sales (in millions of dollars) for a
company spending $500 million on capital and $200 million on wages?
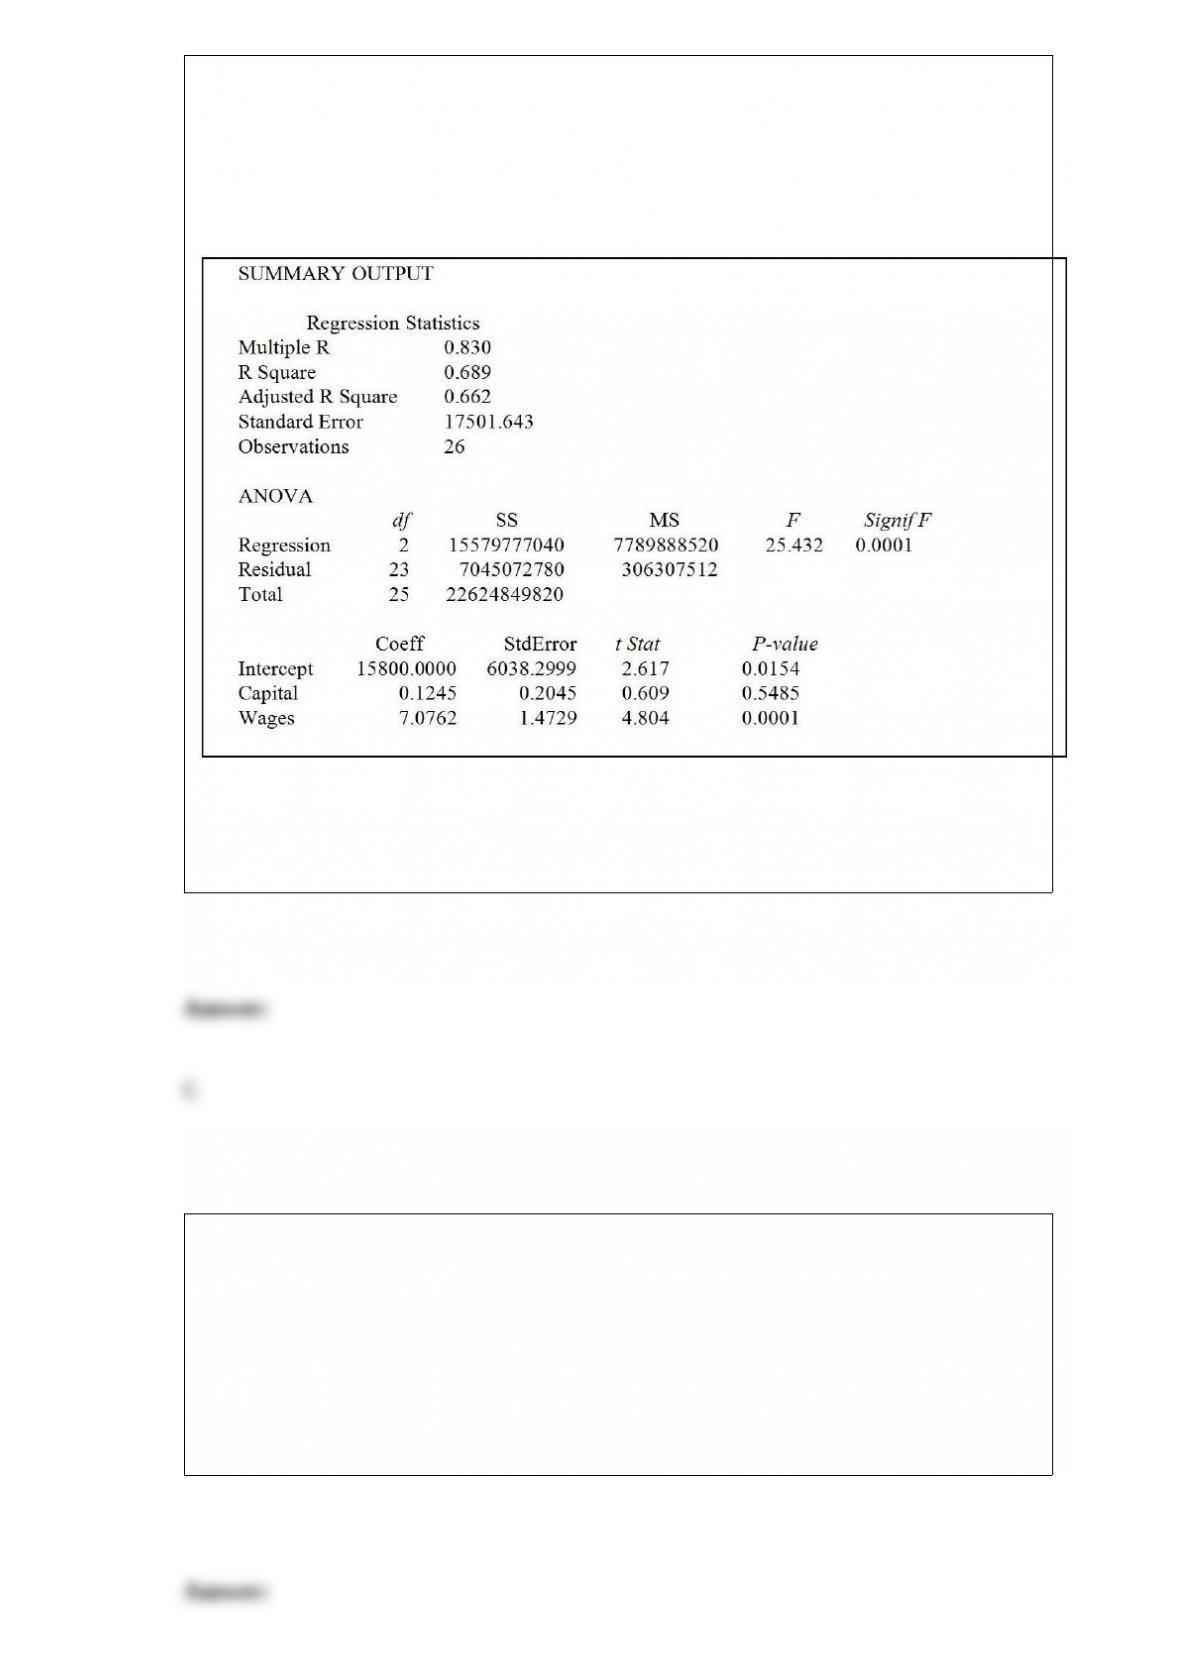
TABLE 14-5
A microeconomist wants to determine how corporate sales are influenced by capital and
wage spending by companies. She proceeds to randomly select 26 large corporations
and record information in millions of dollars. The Microsoft Excel output below shows
results of this multiple regression.
A) 15,800.00
B) 16,520.07
C) 17,277.49
D) 20,455.98
A realtor wants to compare the variability of sales-to-appraisal ratios of residential
properties sold in four neighborhoods (A, B, C, and D). Four properties are randomly
selected from each neighborhood and the ratios recorded for each were collected.
Which of the following tests will be the most appropriate?
A) McNemar test
B) Tukey-Kramer multiple comparisons procedure for one-way ANOVA
C) Levene’s test
D) Wilcoxon rank sum test
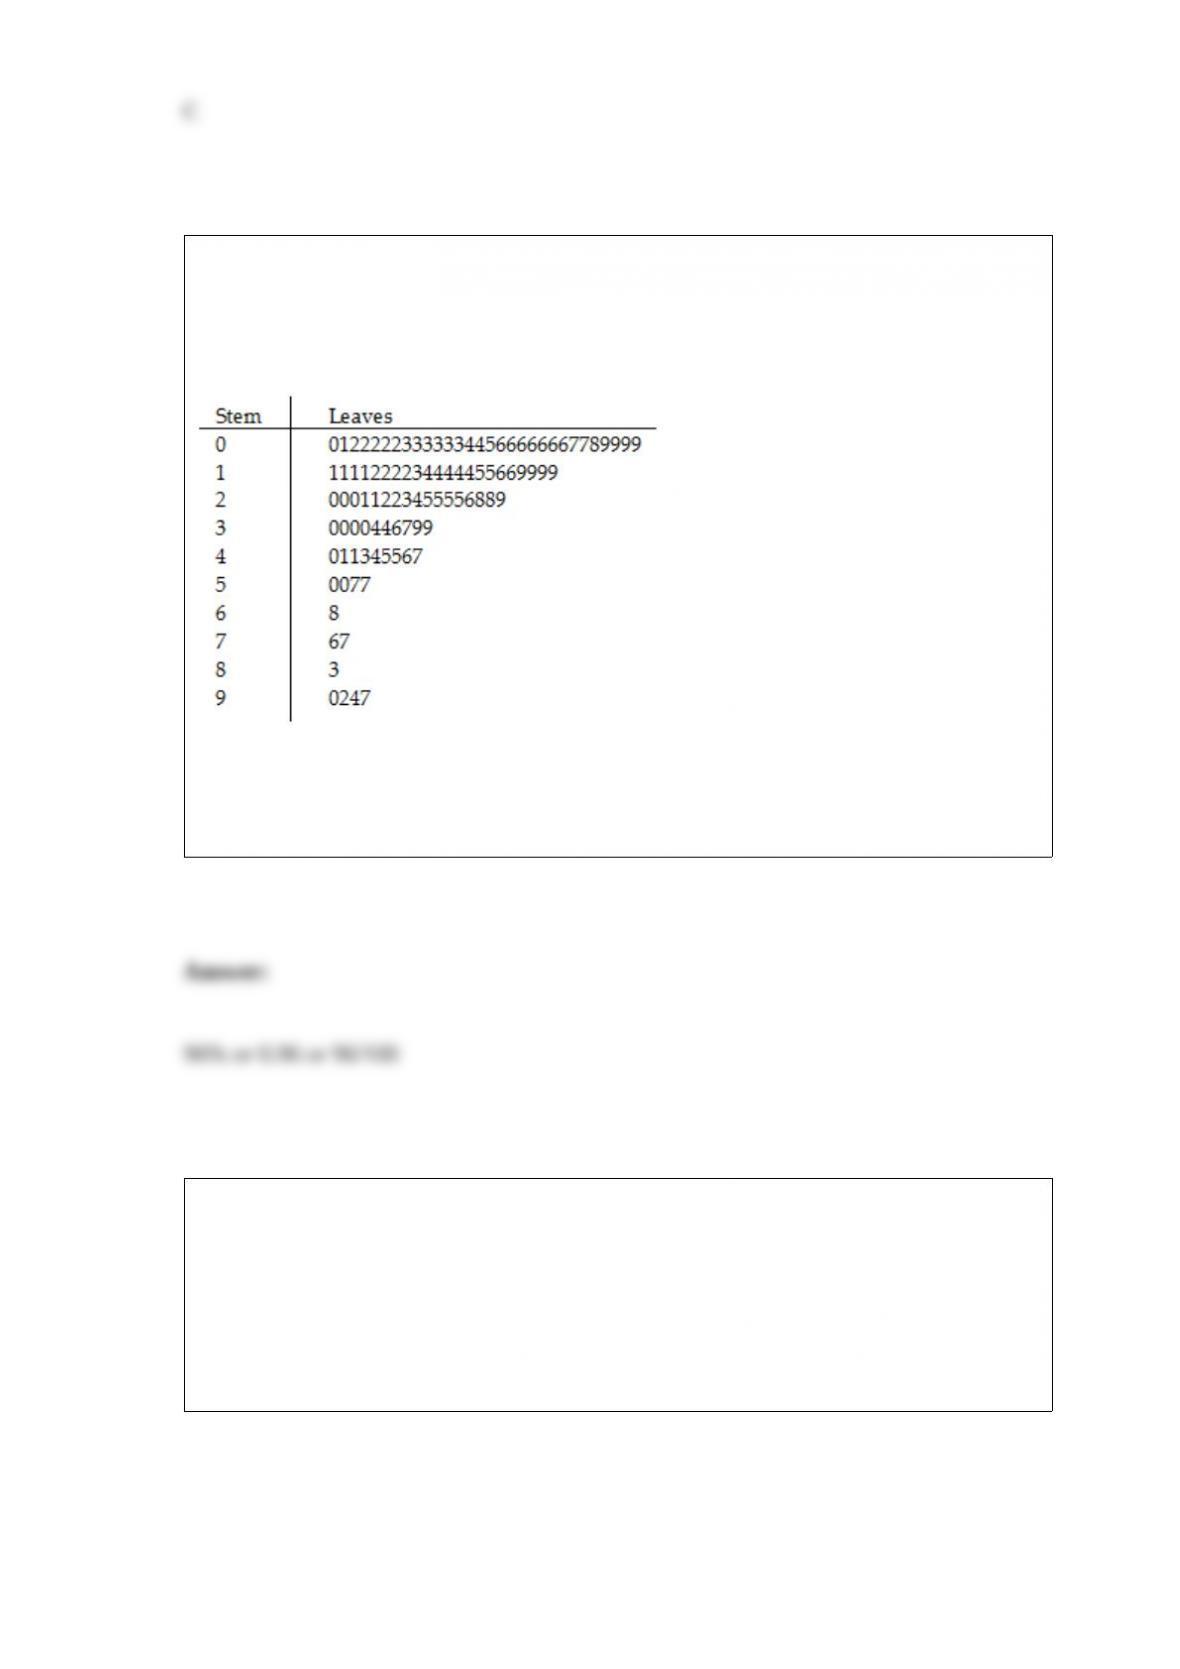
TABLE 2-8
The Stem-and-Leaf display represents the number of times in a year that a random
sample of 100 “lifetime” members of a health club actually visited the facility.
Referring to Table 2-8, if a frequency distribution with equal sized classes was made
from this data, and the first class was “0 but less than 10,” the cumulative percentage of
the next-to-last class would be ________.
TABLE 18-8
Recently, a university switched to a new type of computer-based registration. The
registrar is concerned with the amount of time students are spending on the computer
registering under the new system. She decides to randomly select 8 students on each of
the 12 days of the registration and determine the time each spends on the computer
registering. The range, mean, and standard deviation of the times required to register are
in the table that follows.
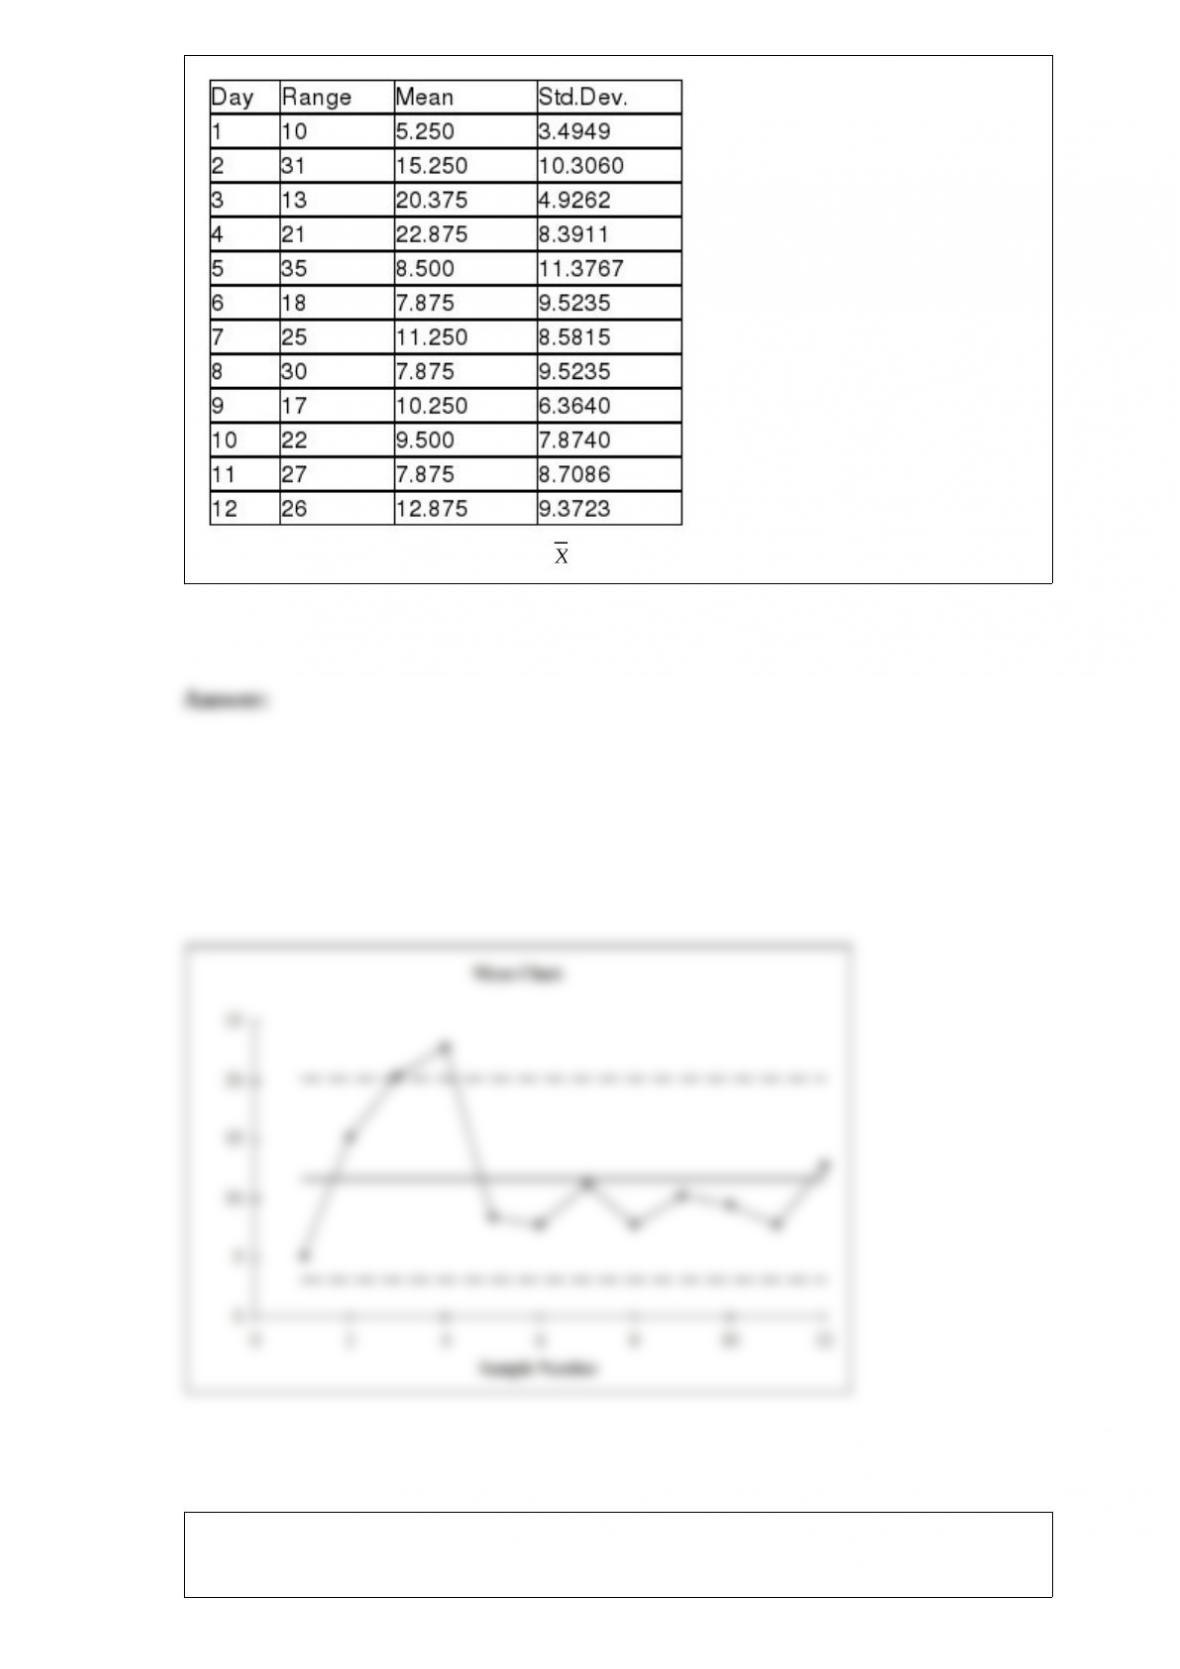
Referring to Table 18-8, construct an chart for the time required to register.
TABLE 13-10
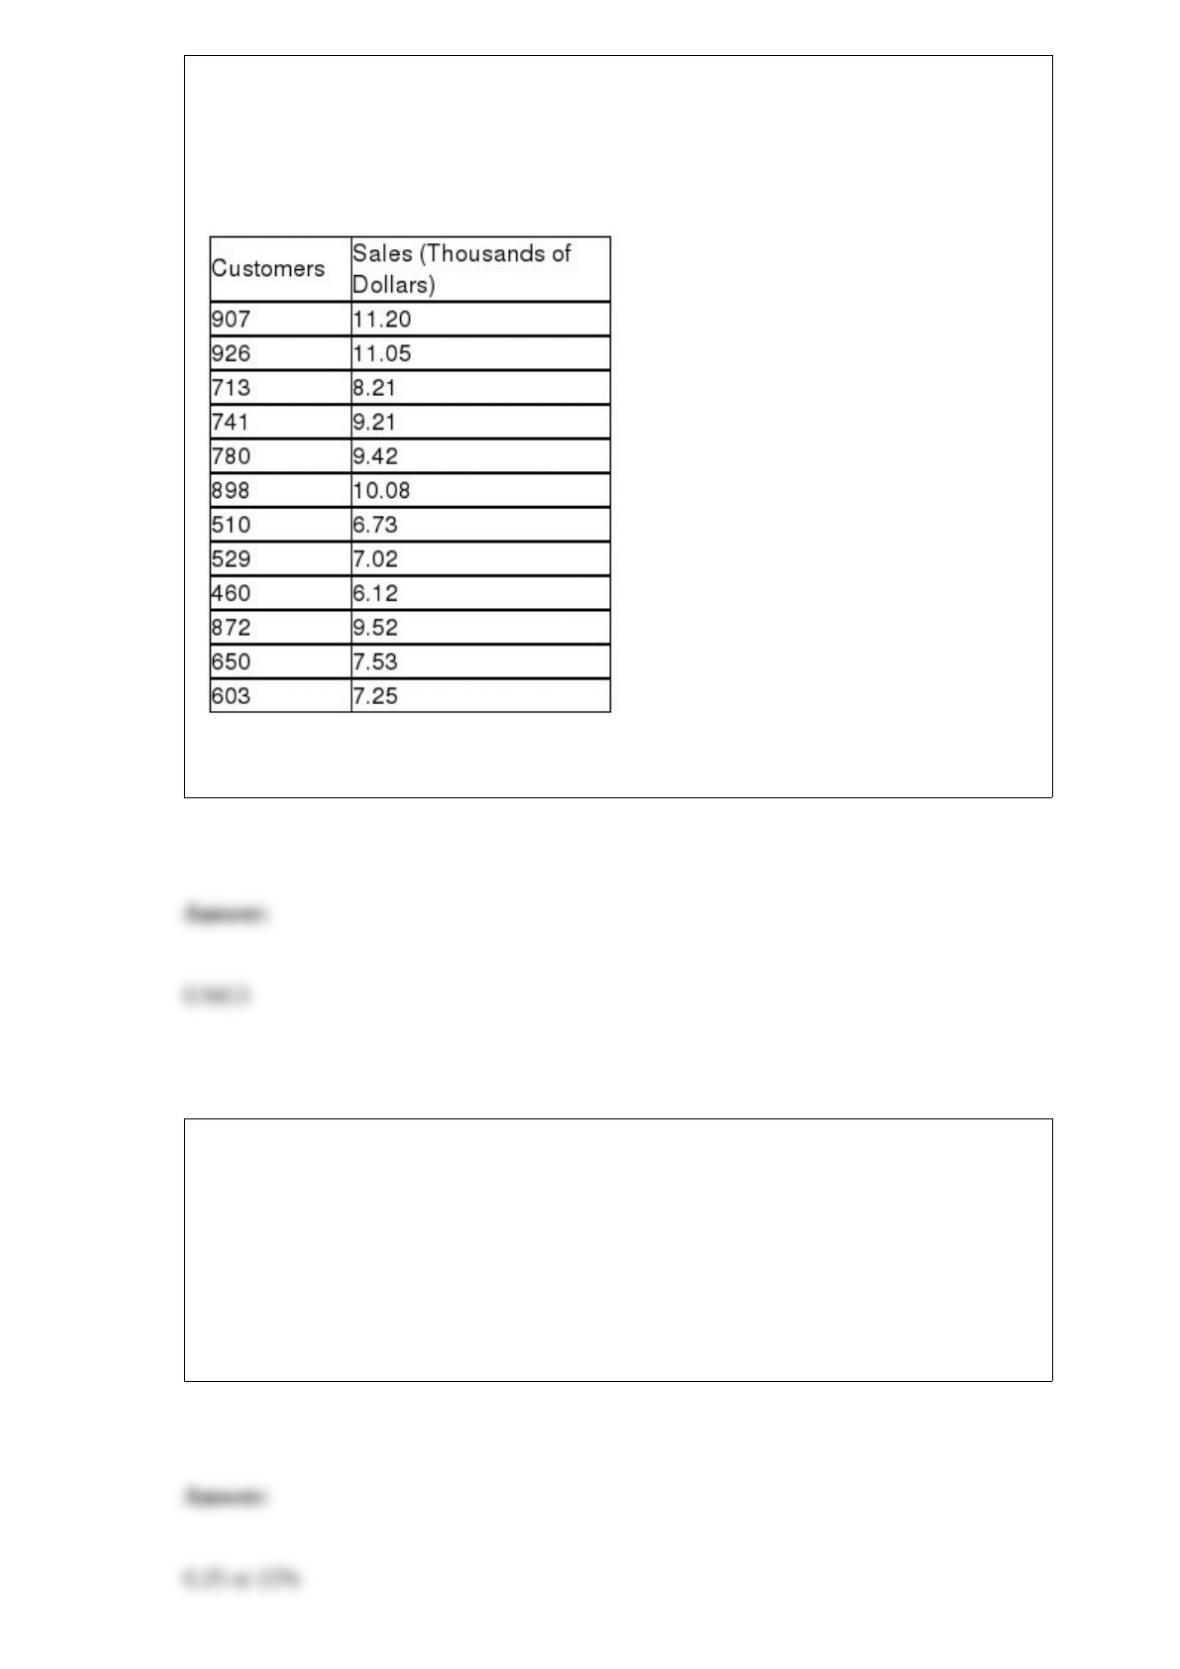
The management of a chain electronic store would like to develop a model for
predicting the weekly sales (in thousands of dollars) for individual stores based on the
number of customers who made purchases. A random sample of 12 stores yields the
following results:
Referring to Table 13-10, what is the value of the coefficient of determination?
TABLE 7-8
According to a survey, only 15% of customers who visited the website of a major retail
store made a purchase. Random samples of size 50 are selected from a population of
900. Use the finite population correction factor.
Referring to Table 7-8, the mean of all the sample proportions of 50 customers who will
make a purchase after visiting the website is ________.
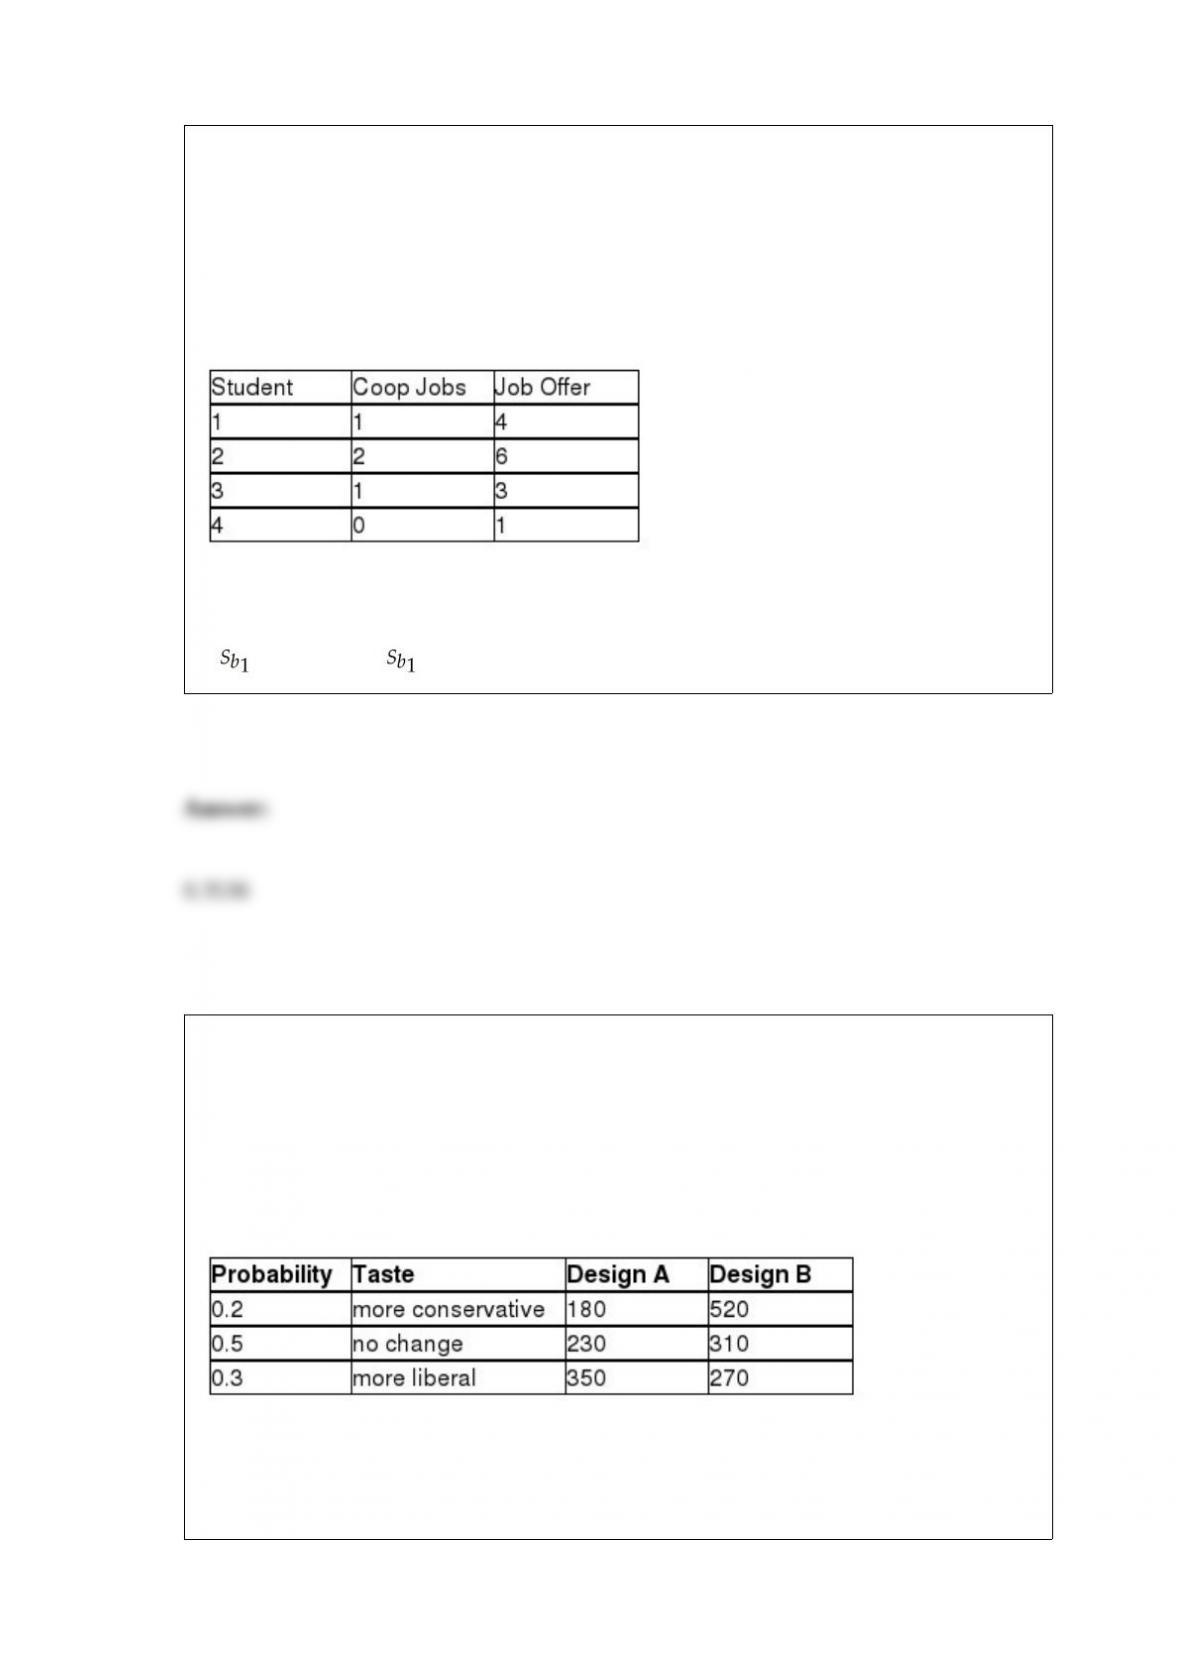
TABLE 13-3
The director of cooperative education at a state college wants to examine the effect of
cooperative education job experience on marketability in the work place. She takes a
random sample of 4 students. For these 4, she finds out how many times each had a
cooperative education job and how many job offers they received upon graduation.
These data are presented in the table below.
Referring to Table 13-3, the director of cooperative education wanted to test the
hypothesis that the population slope was equal to 0. The denominator of the test statistic
is . The value of in this sample is ________.
TABLE 5-8
Two different designs on a new line of winter jackets for the coming winter are
available for your manufacturing plants. Your profit (in thousands of dollars) will
depend on the taste of the consumers when winter arrives. The probability of the three
possible different tastes of the consumers and the corresponding profits are presented in
the following table.
Referring to Table 5-8, if you decide to choose Design A for 10% of the production
lines and Design B for the remaining production lines, what is the risk of your
investment?
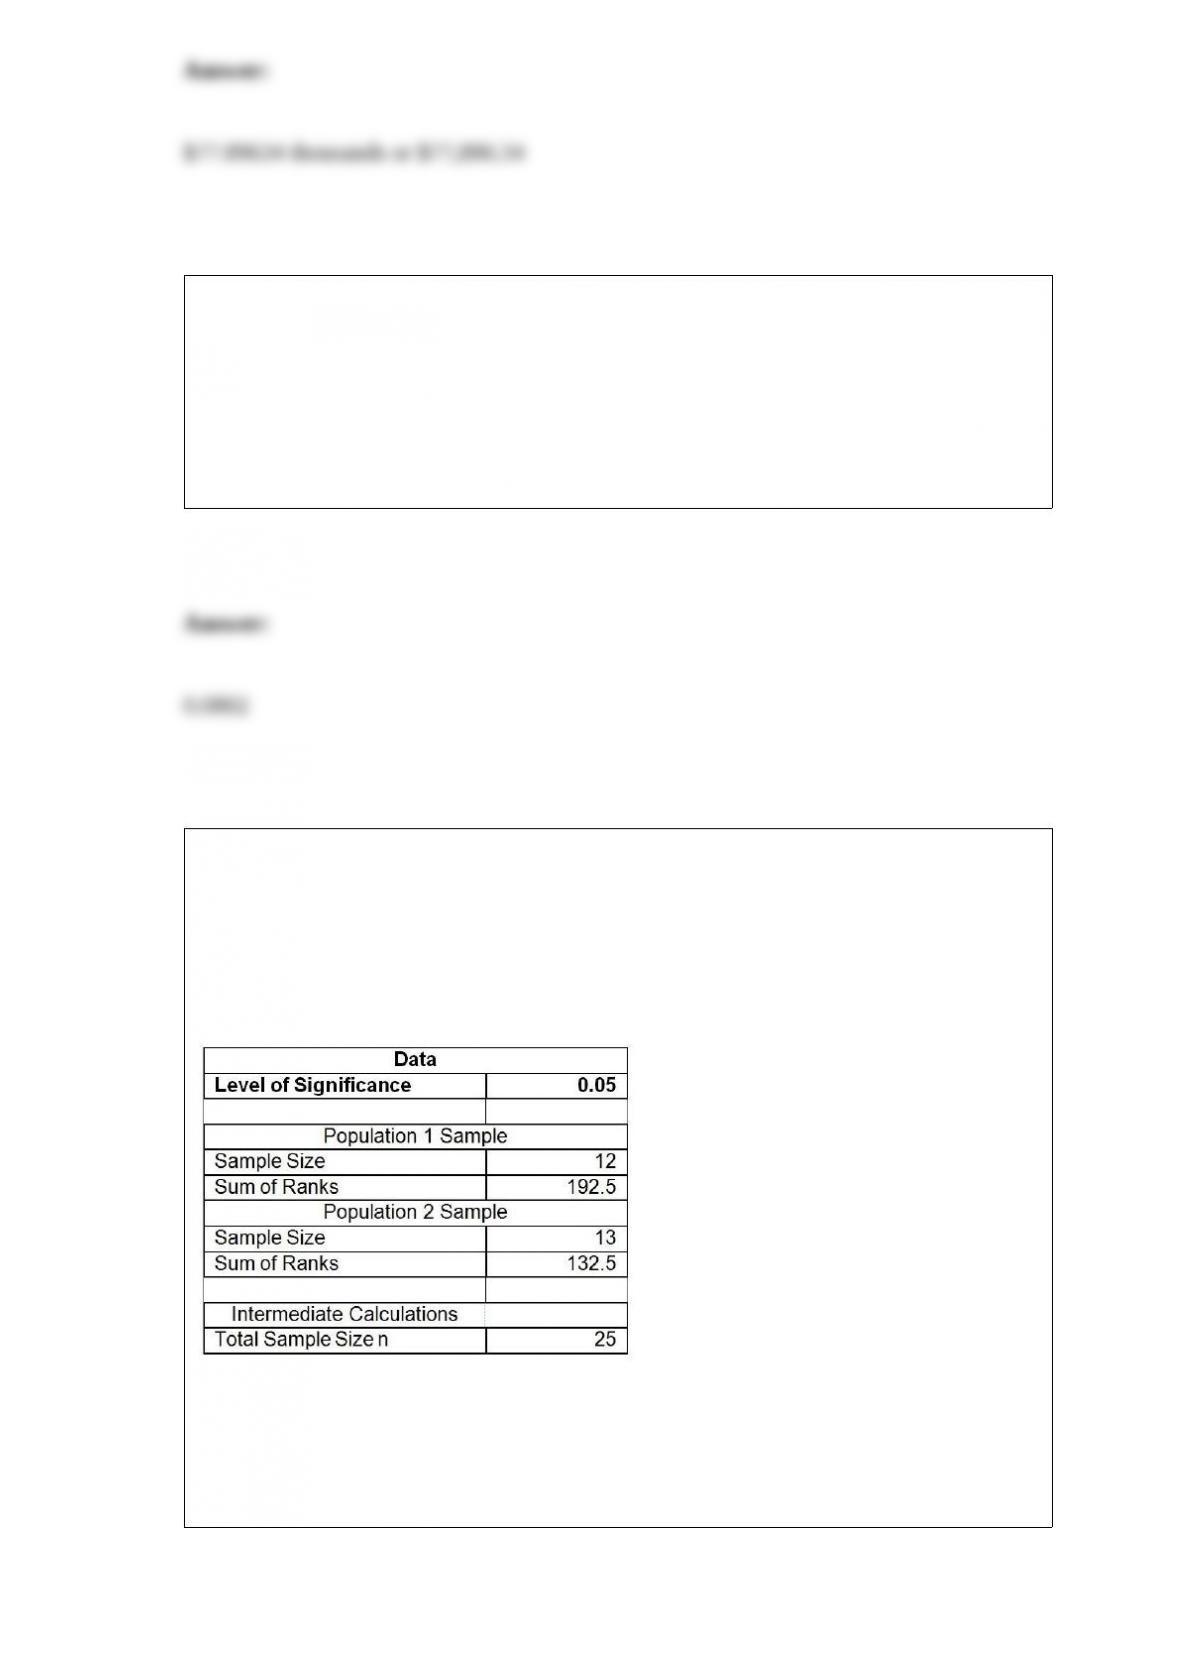
TABLE 5-5
From an inventory of 48 new cars being shipped to local dealerships, corporate reports
indicate that 12 have defective radios installed.
Referring to Table 5-5, what is the probability out of the 8 new cars it just received that,
when each is tested, none of the cars have defective radios?
TABLE 12-15
Two new different models of compact SUVs have just arrived at the market. You are
interested in comparing the gas mileage performance of both models to see if they are
the same. A partial computer output for twelve compact SUVs of model 1 and thirteen
of model 2 is given below:
You are told that the gas mileage population distributions for both models are not
normally distributed.
Referring to Table 12-15, what is the value of the Wilcoxon rank sum test statistic T1?
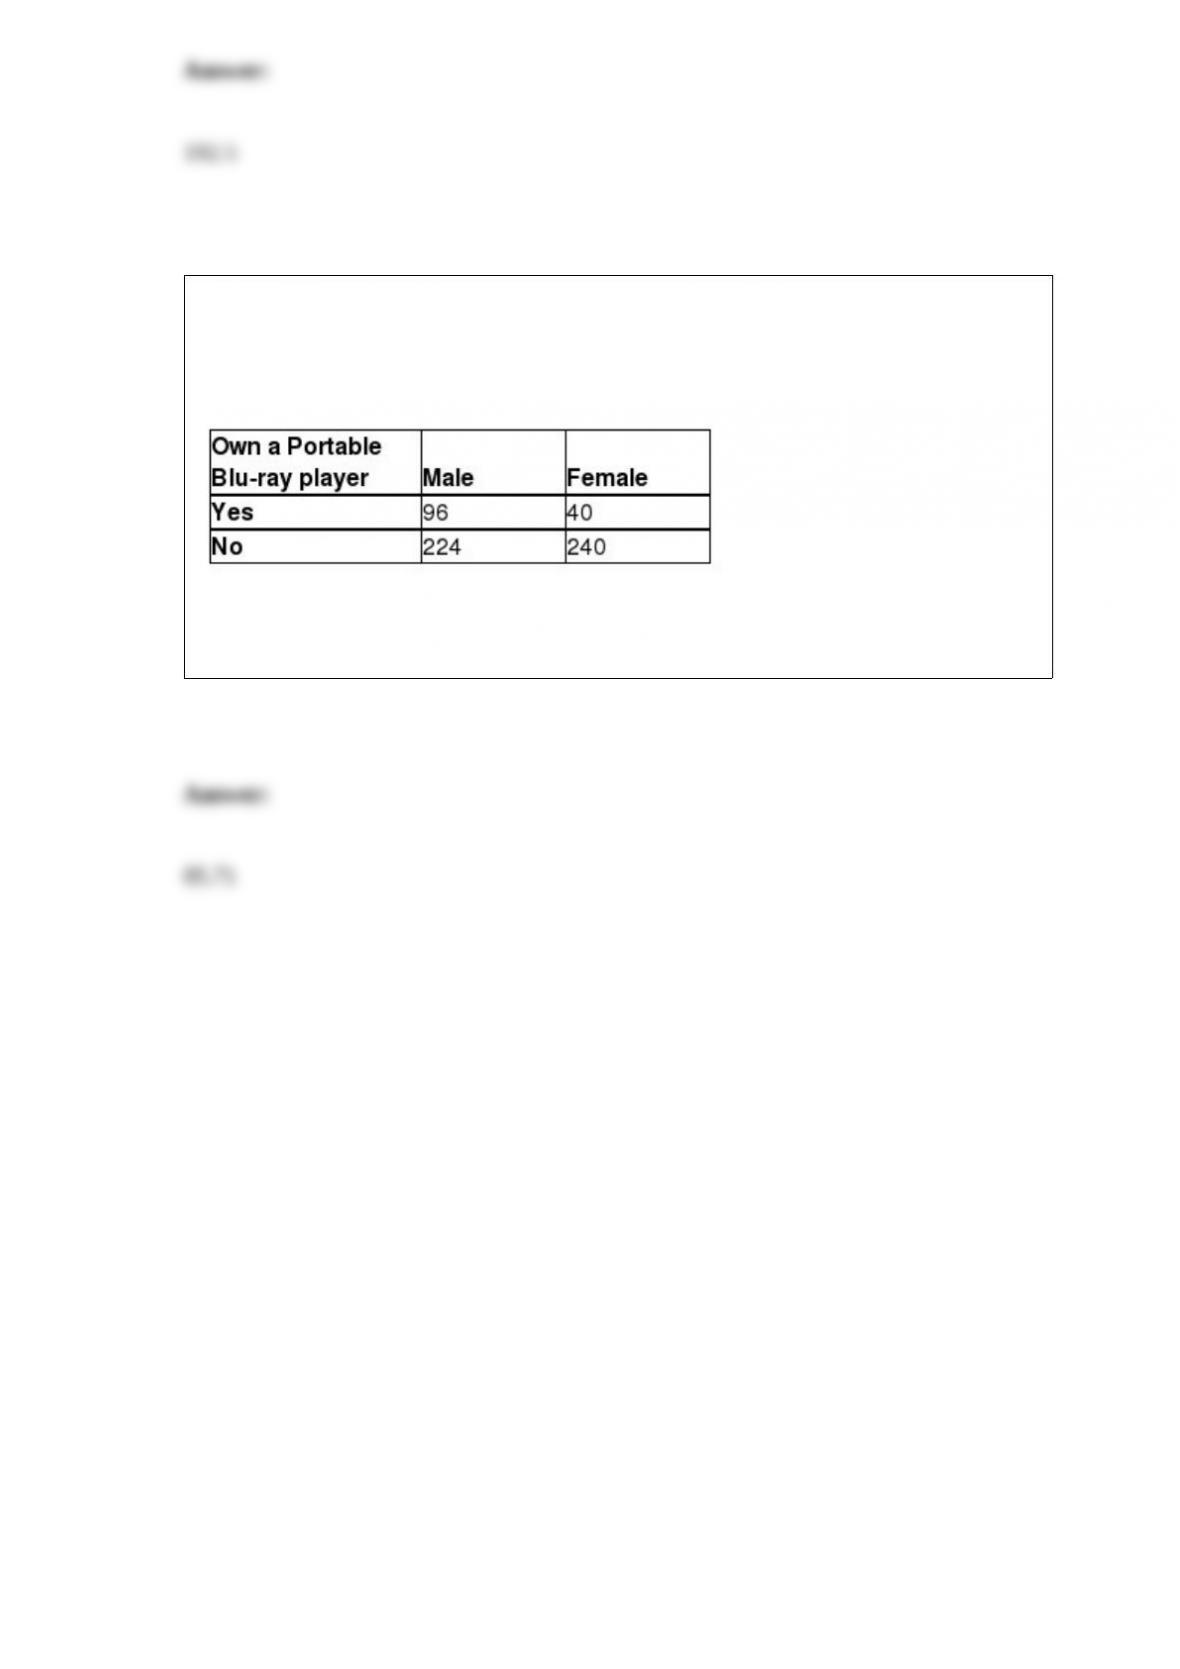
TABLE 2-14
The table below contains the number of people who own a portable Blu-ray player in a
sample of 600 broken down by gender.
Referring to Table 2-14, of the females in the sample, ________ percent did not own a
portable Blu-ray player.