
True or False: A worker earns $15 per hour at a plant in China and is told that only
2.5% of all workers make a higher wage. If the wage is assumed to be normally
distributed and the standard deviation of wage rates is $5 per hour, the average wage for
the plant is $7.50 per hour.
TABLE 8-8
The president of a university would like to estimate the proportion of the student
population that owns a personal computer. In a sample of 500 students, 417 own a
personal computer.
True or False: Referring to Table 8-8, the parameter of interest is the mean number of
students in the population who own a personal computer.
True or False: Problems may arise when statistically unsophisticated users who do not
understand the assumptions behind the statistical procedures or their limitations are
misled by results obtained from computer software.
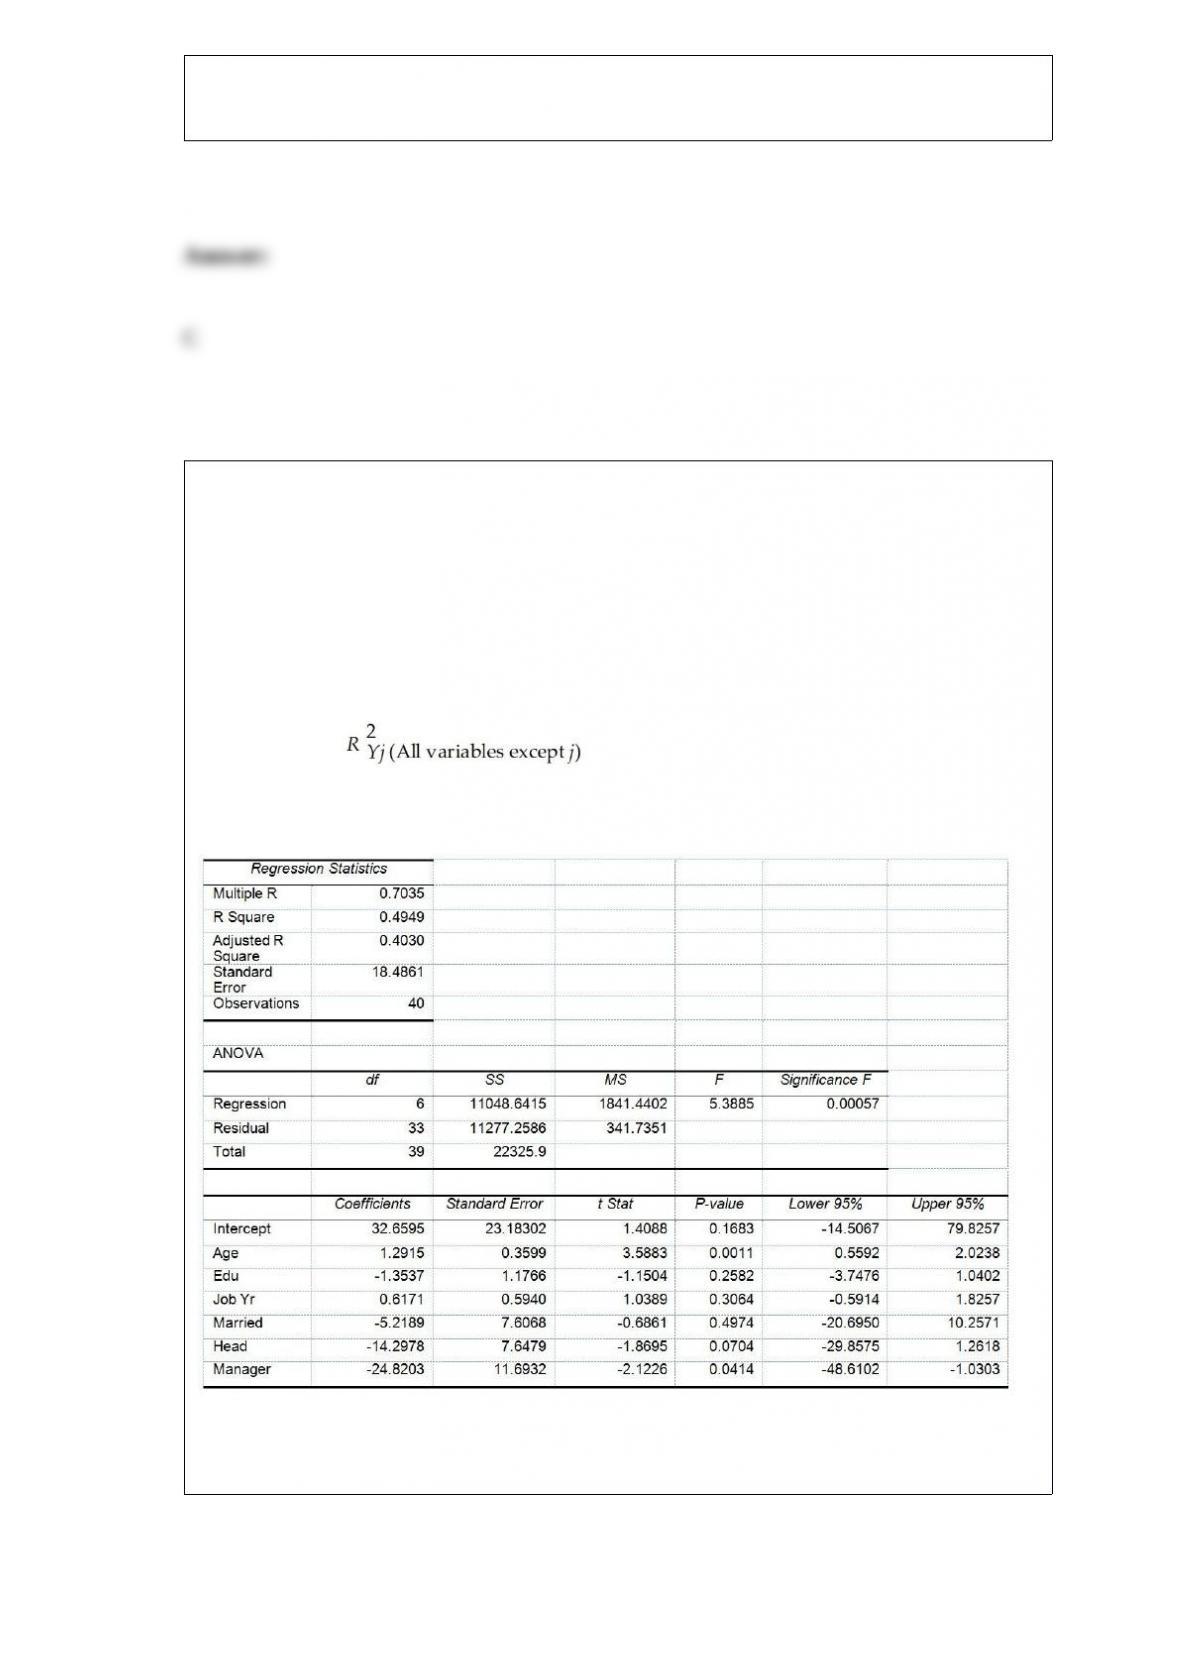
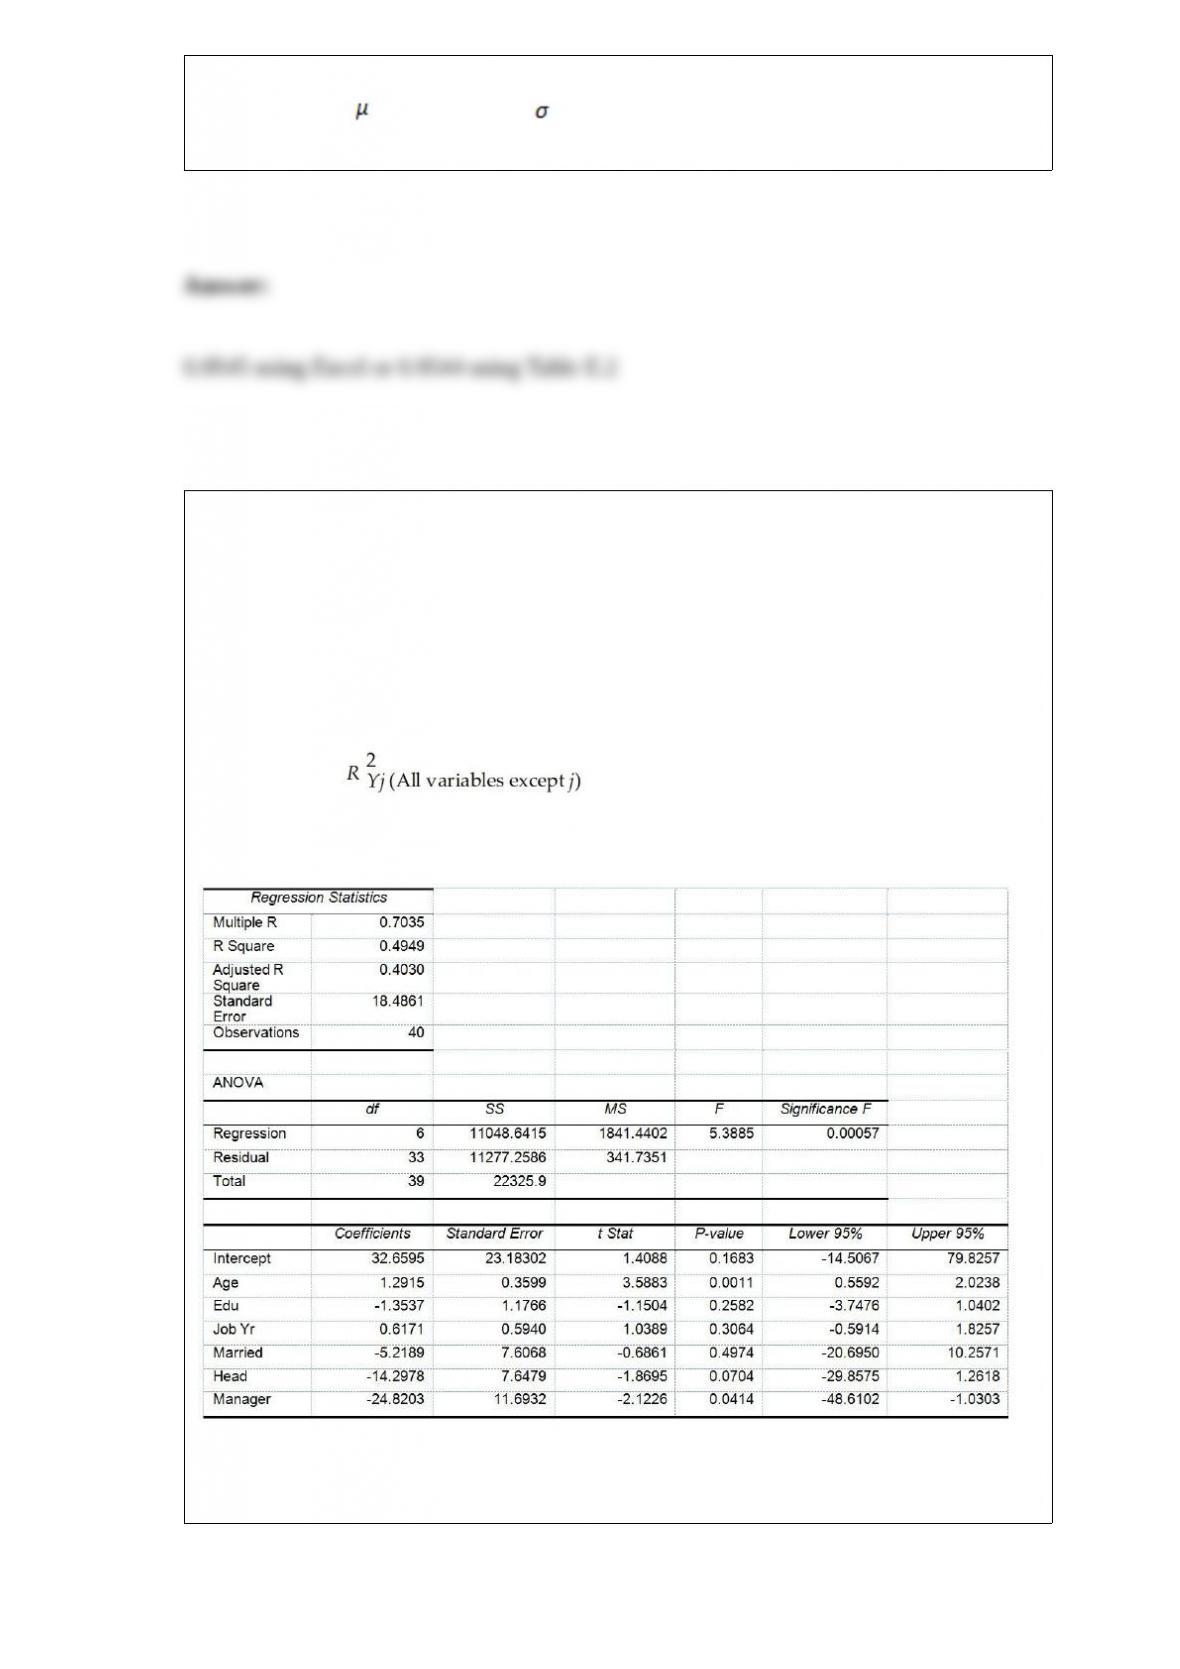
True or False: TABLE 17-10
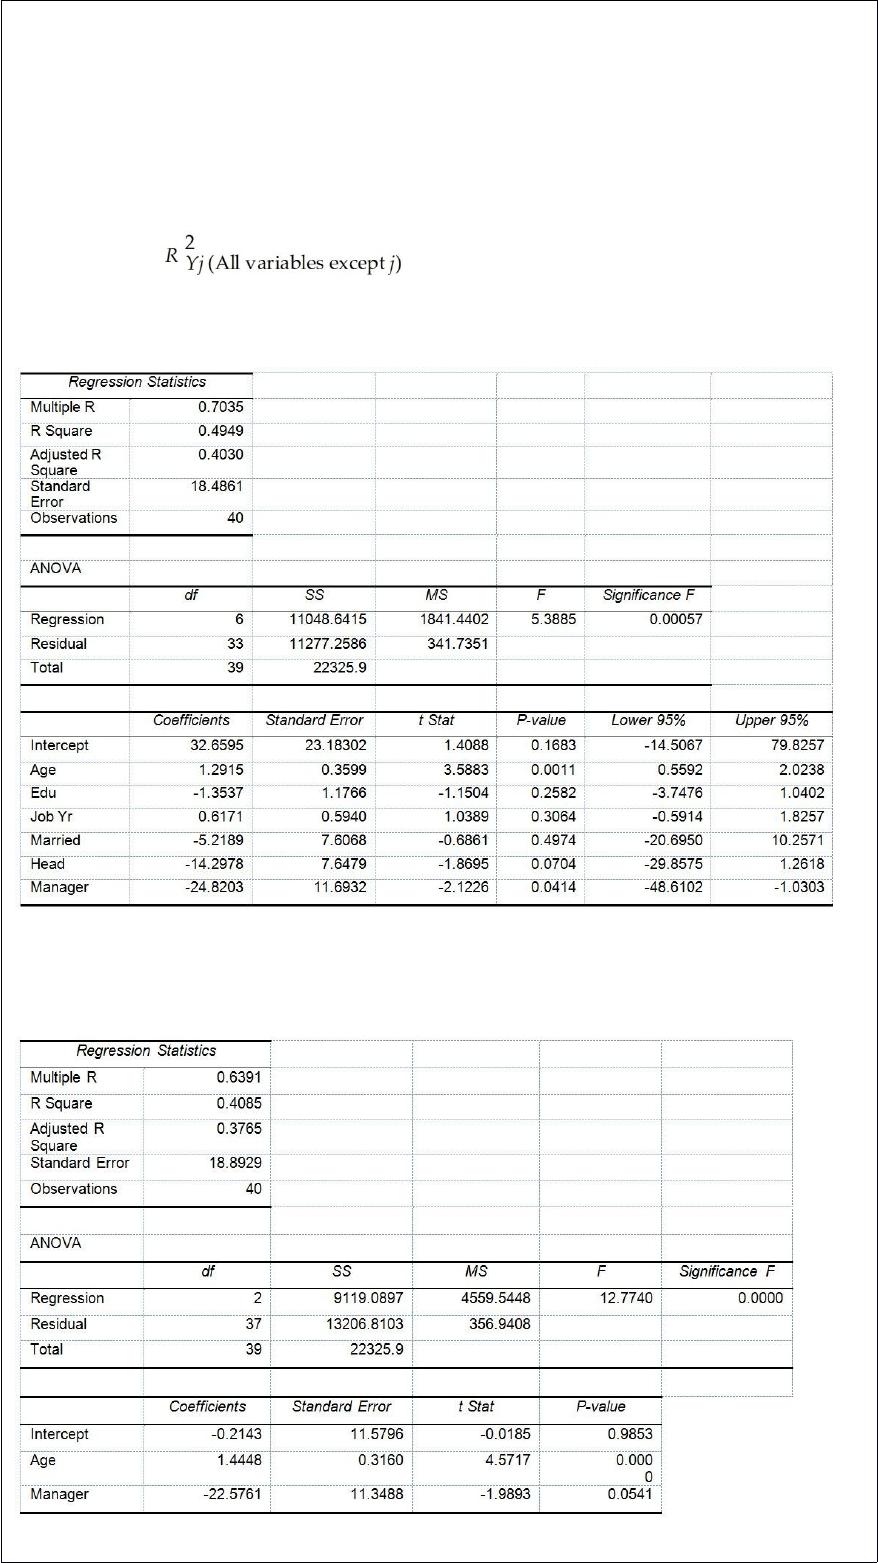
Given below are results from the regression analysis where the dependent variable is
the number of weeks a worker is unemployed due to a layoff (Unemploy) and the
independent variables are the age of the worker (Age), the number of years of education
received (Edu), the number of years at the previous job (Job Yr), a dummy variable for
marital status (Married: 1 = married, 0 = otherwise), a dummy variable for head of
household (Head: 1 = yes, 0 = no) and a dummy variable for management position
(Manager: 1 = yes, 0 = no). We shall call this Model 1. The coefficient of partial
determination ( ) of each of the 6 predictors are, respectively,
0.2807, 0.0386, 0.0317, 0.0141, 0.0958, and 0.1201.
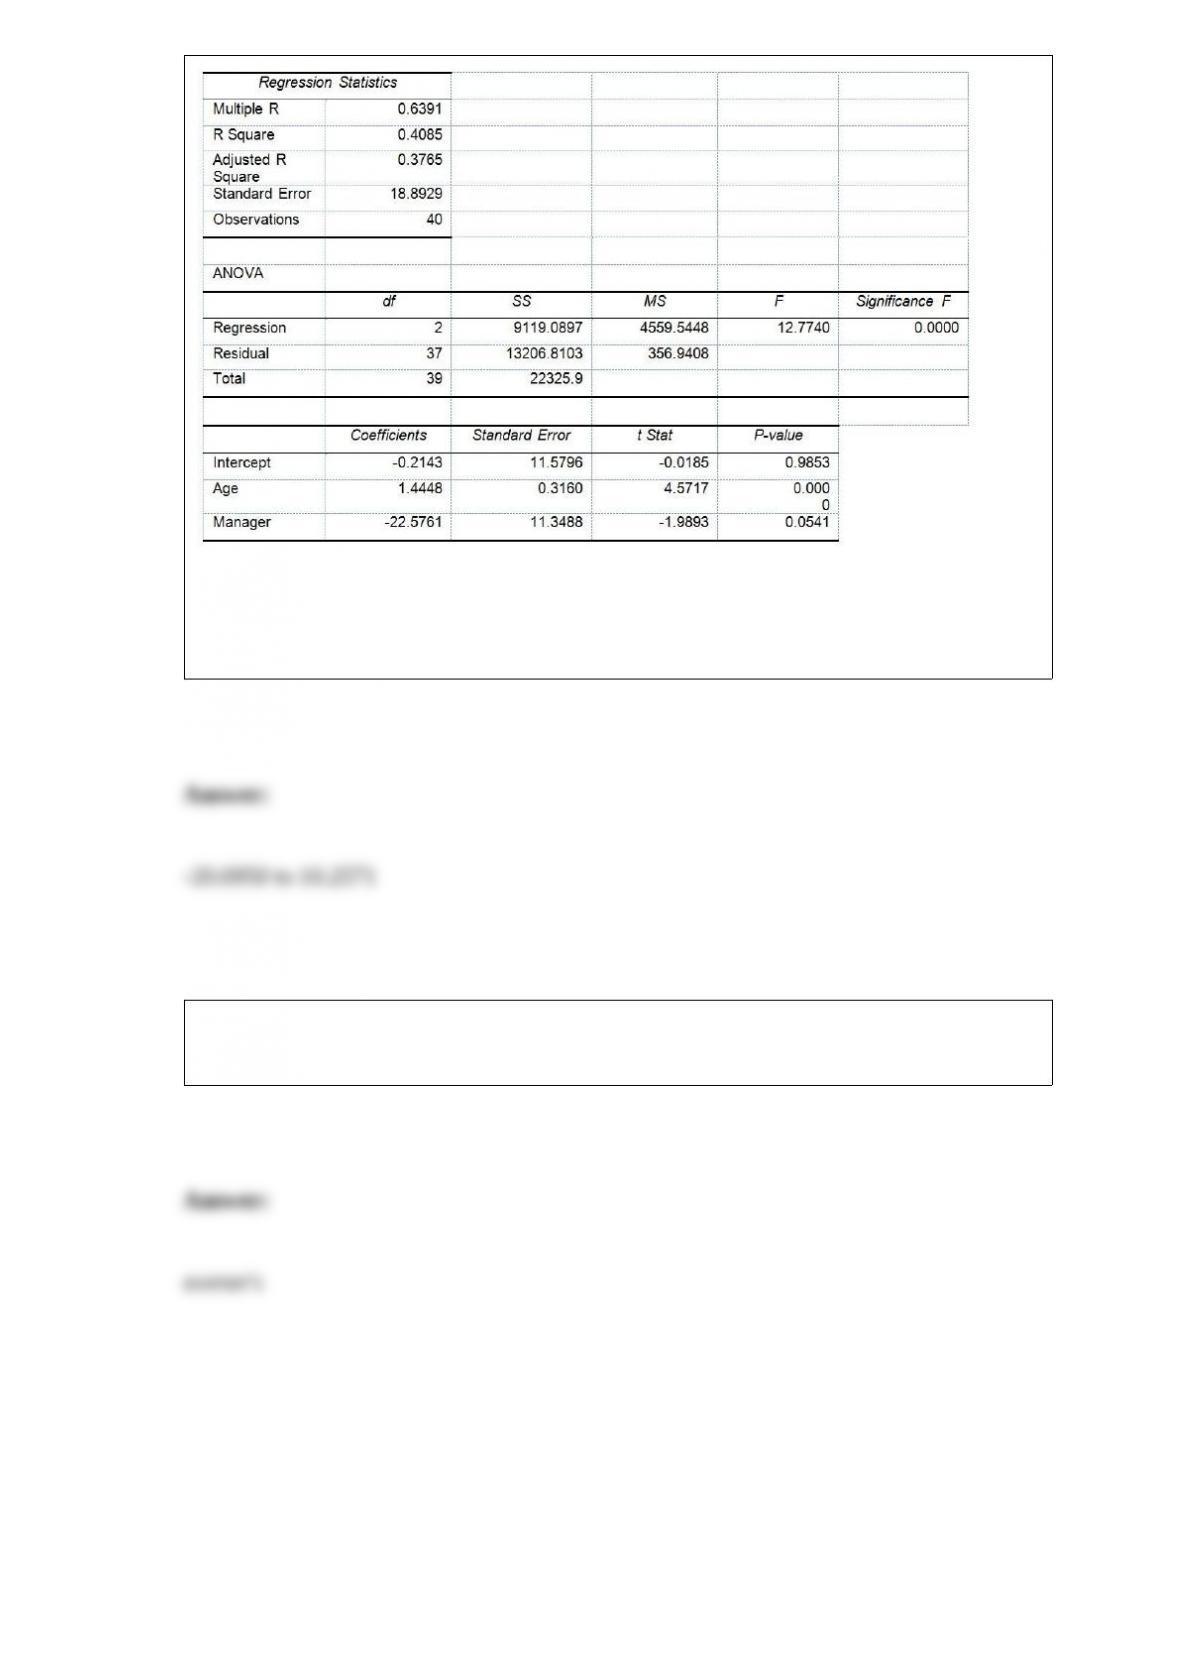
Model 2 is the regression analysis where the dependent variable is Unemploy and the
independent variables are Age and Manager. The results of the regression analysis are
given below:
Referring to Table 17-10, Model 1, there is sufficient evidence that the number of

weeks a worker is unemployed due to a layoff depends on at least one of the
explanatory variables at a 10% level of significance.
True or False: A research analyst was directed to arrange raw data collected on the yield
of wheat, ranging from 40 to 93 bushels per acre, in a frequency distribution. He should
choose 30 as the class interval width.
TABLE 8-8
The president of a university would like to estimate the proportion of the student
population that owns a personal computer. In a sample of 500 students, 417 own a
personal computer.
True or False: Referring to Table 8-8, a 99% confidence interval will contain 99% of the
student population who own a personal computer.
TABLE 8-12
A random sample of 100 stores from a large chain of 500 garden supply stores was
selected to determine the mean number of lawnmowers sold at an end-of-season
clearance sale. The sample results indicated a mean of 6 and a standard deviation of 2
lawnmowers sold. A 95% confidence interval (5.623 to 6.377) was established based on
these results.
True or False: Referring to Table 8-12, of all possible samples of 100 stores taken from
the population of 1,000 stores, 95% of the confidence intervals developed will contain
the true population mean within the interval.
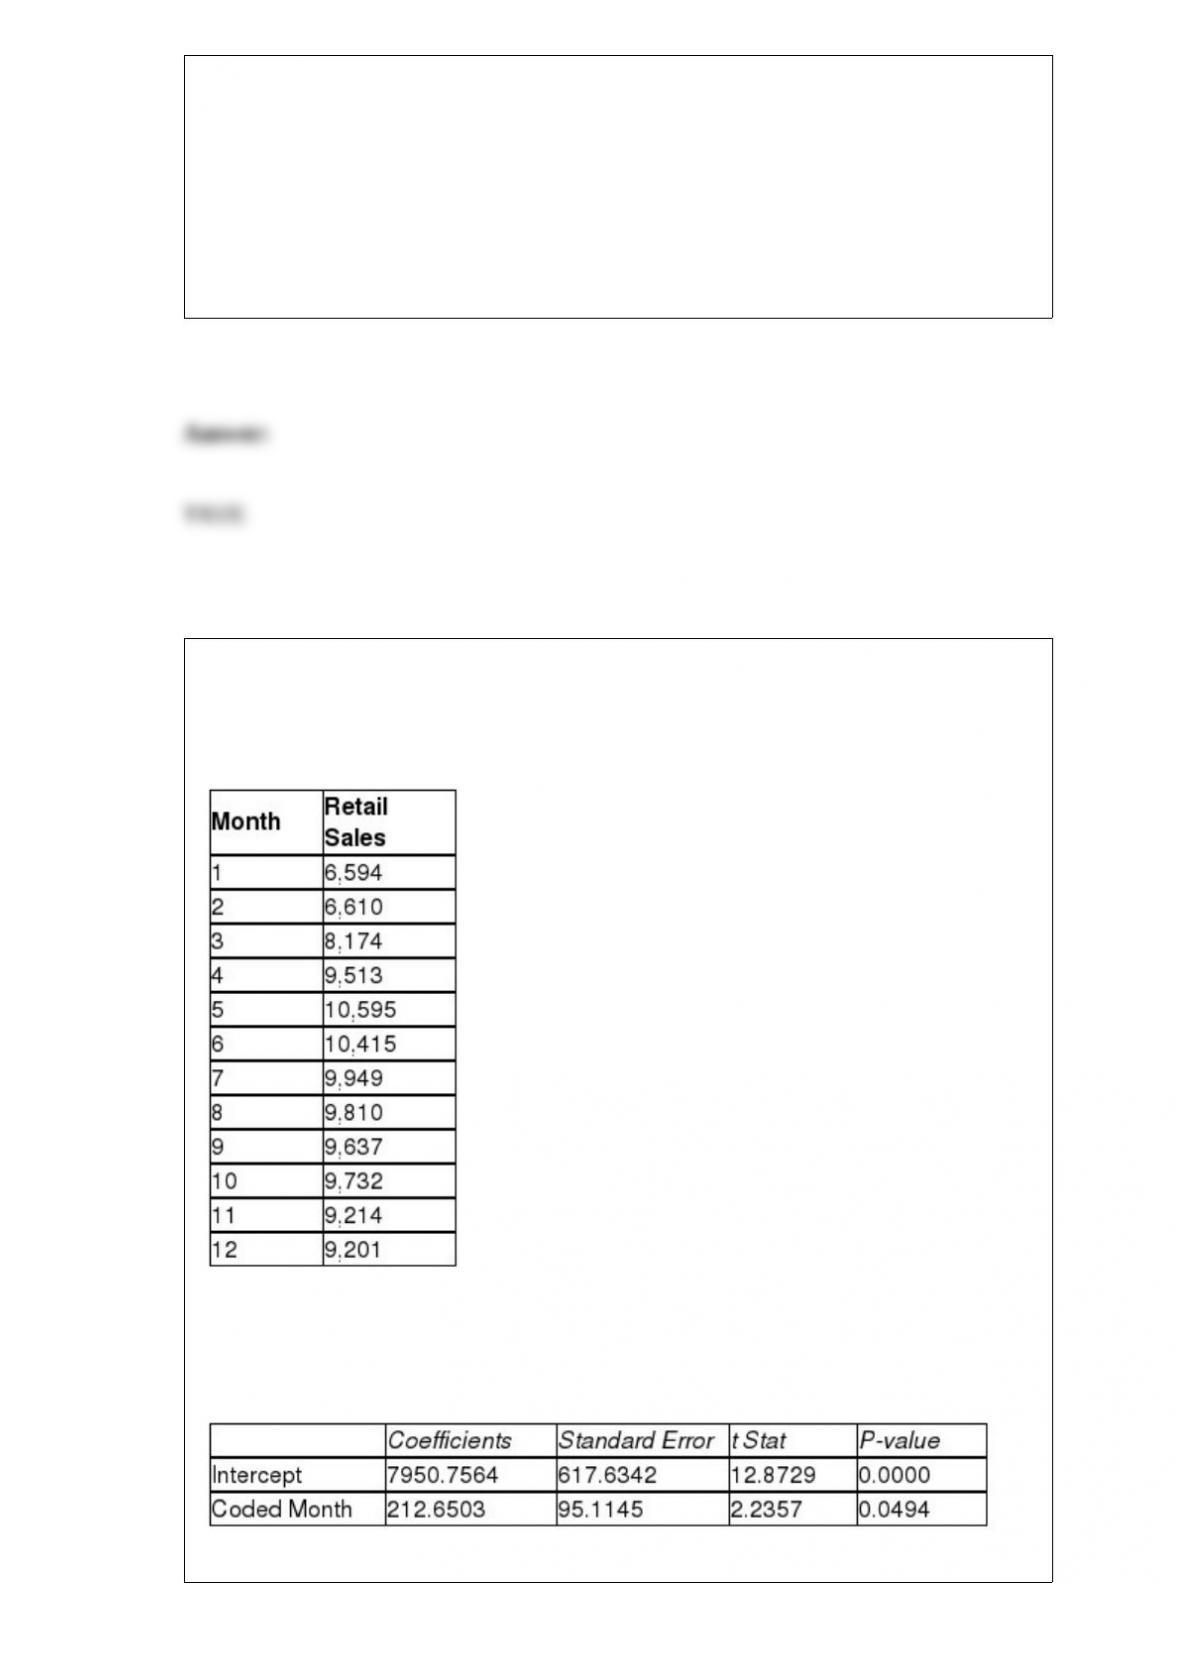
TABLE 16-13
Given below is the monthly time-series data for U.S. retail sales of building materials
over a specific year.
The results of the linear trend, quadratic trend, exponential trend, first-order
autoregressive, second-order autoregressive and third-order autoregressive model are
presented below in which the coded month for the 1st month is 0:
Linear trend model:
Quadratic trend model:
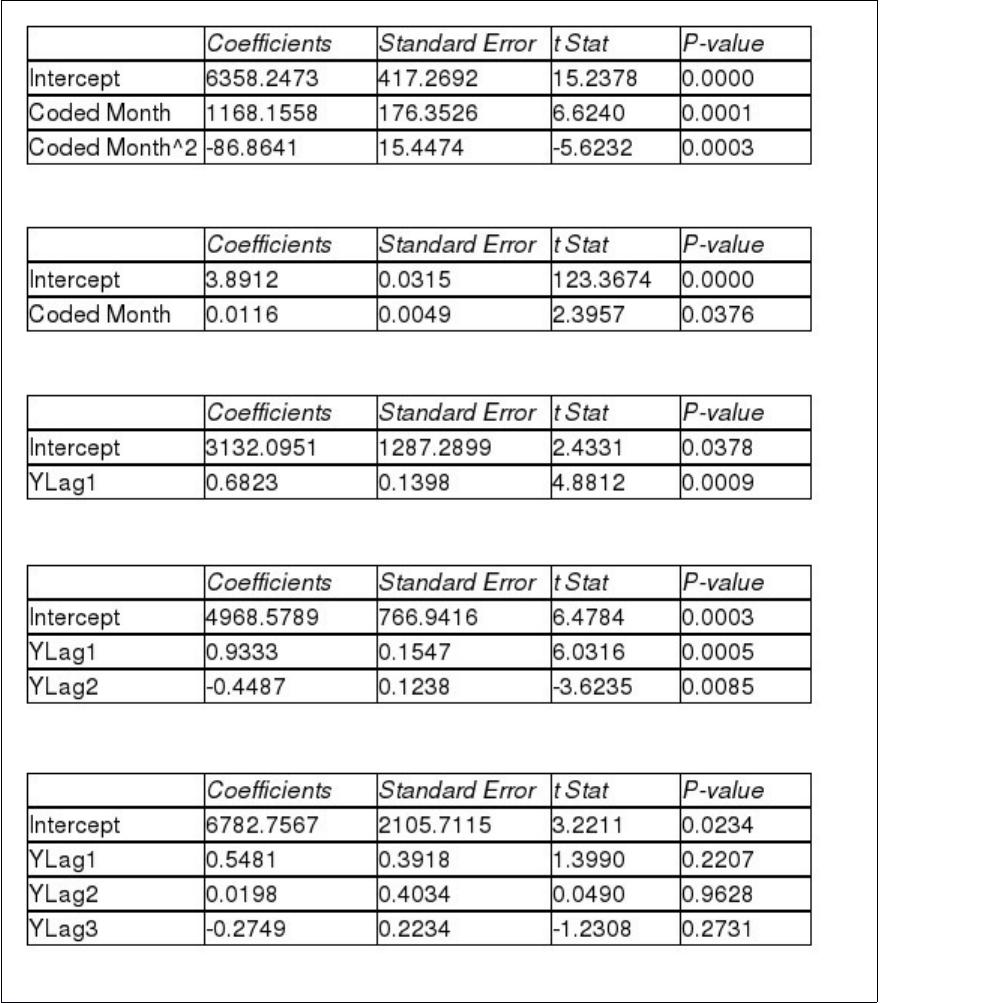
Exponential trend model:
First-order autoregressive:
Second-order autoregressive:
Third-order autoregressive:
Below is the residual plot of the various models:
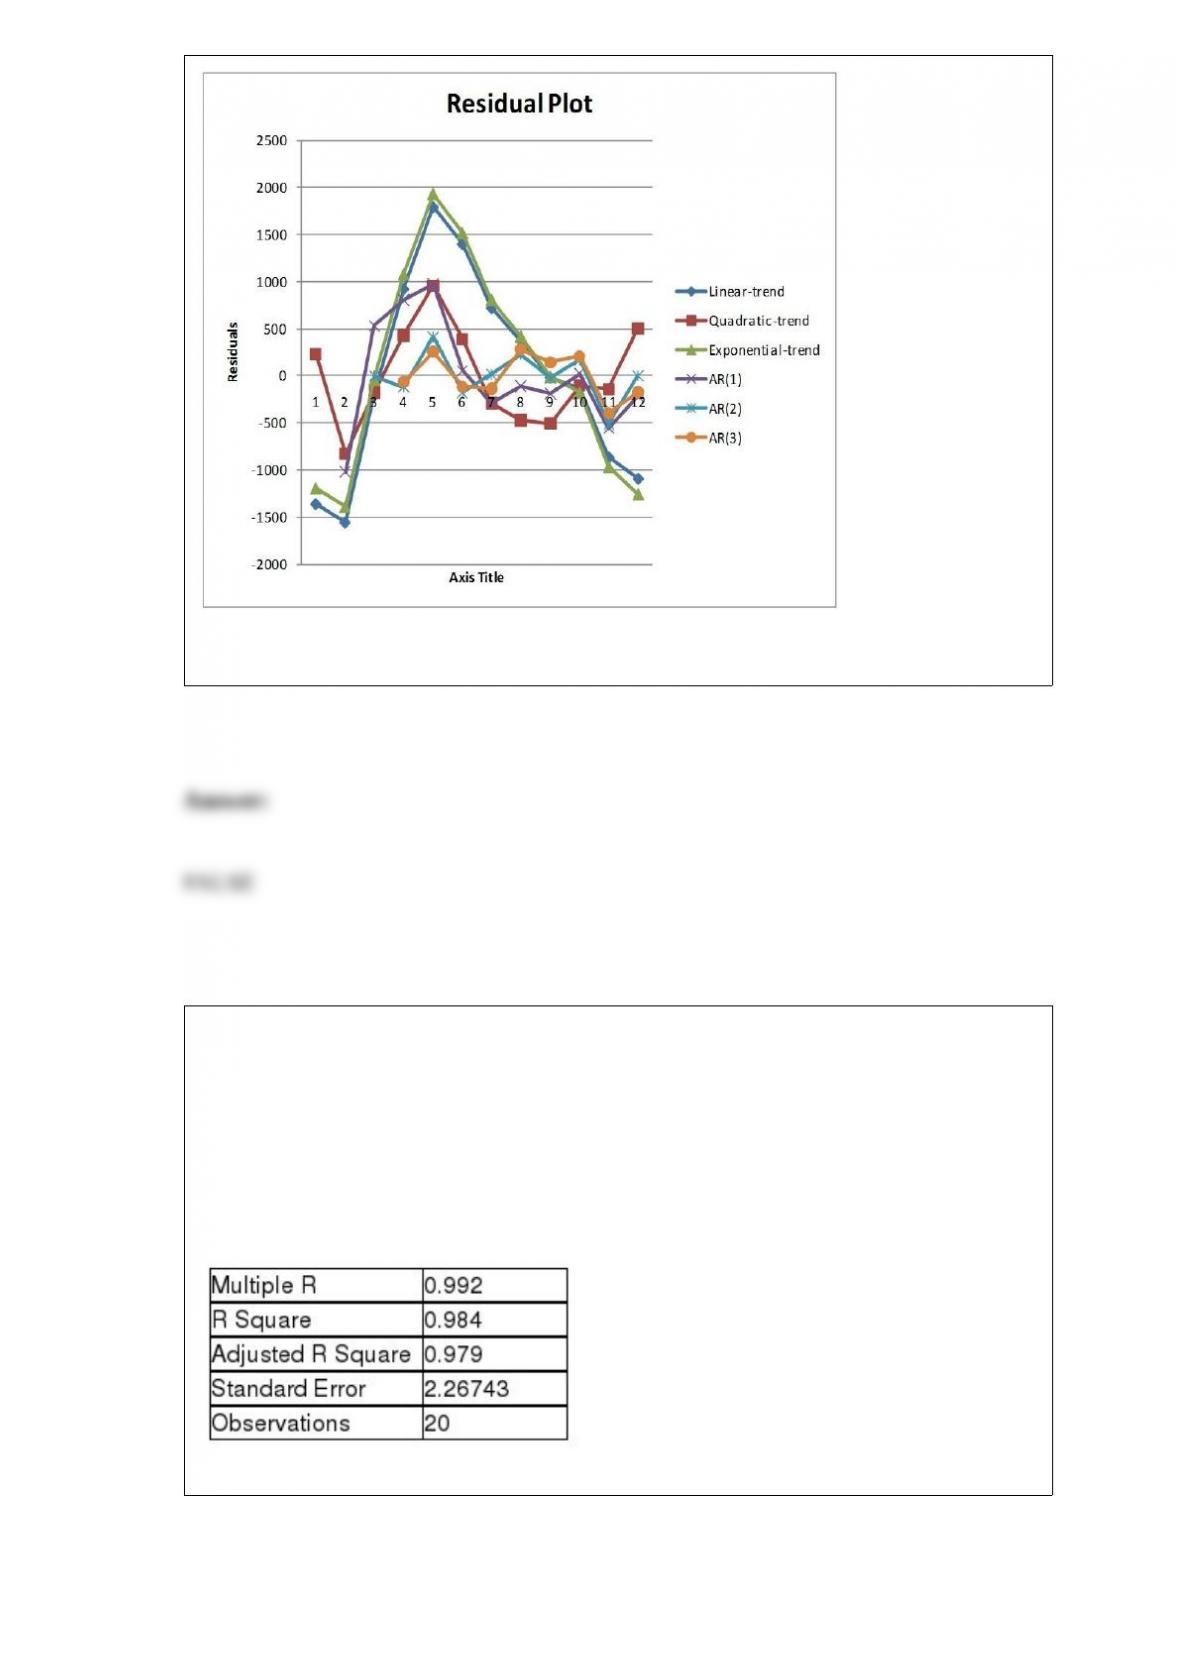
True or False: Referring to Table 16-13, the best model based on the residual plots is the
exponential-trend regression model.
True or False: TABLE 17-3
A financial analyst wanted to examine the relationship between salary (in $1,000) and 4
variables: age (X1 = Age), experience in the field (X2 = Exper), number of degrees (X3 =
Degrees), and number of previous jobs in the field (X4 = Prevjobs). He took a sample of
20 employees and obtained the following Microsoft Excel output:
SUMMARY OUTPUT
Regression Statistics
ANOVA
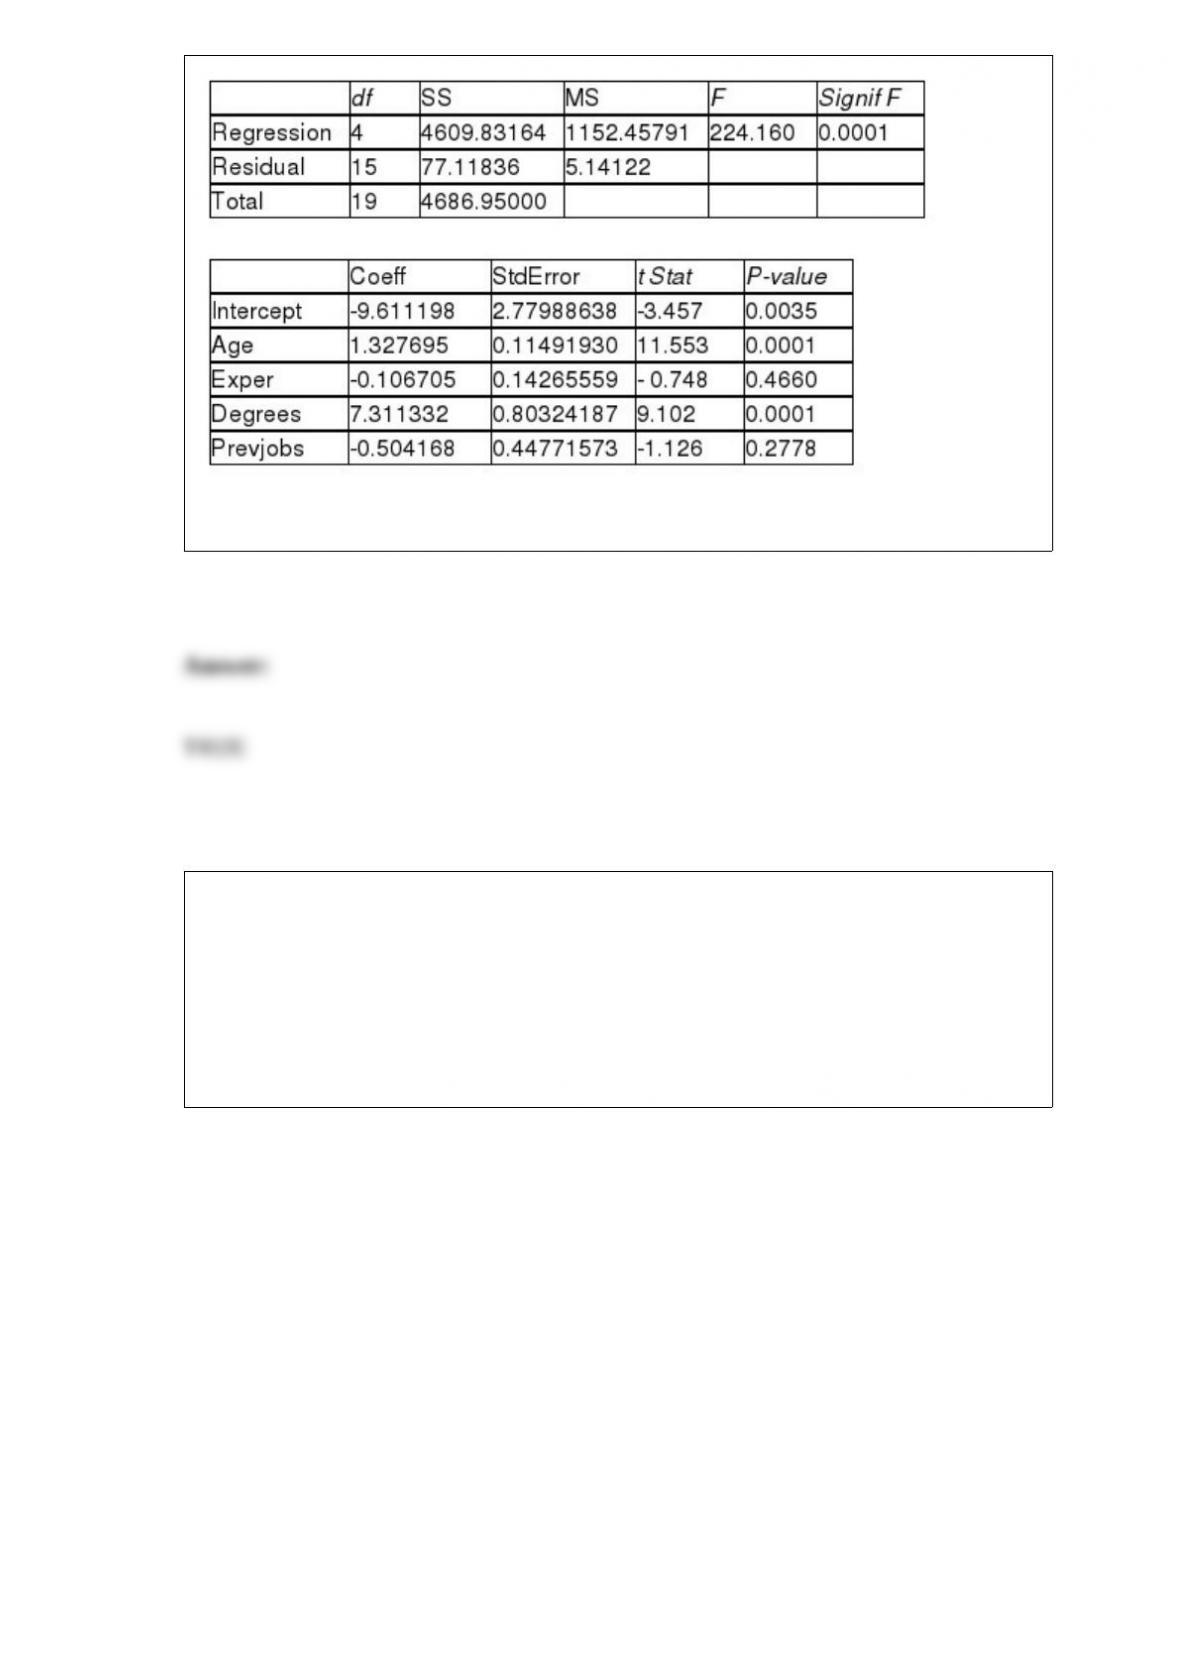
Referring to Table 17-3, the F test for the significance of the entire regression
performed at a level of significance of 0.01 leads to a rejection of the null hypothesis.
TABLE 14-10
You worked as an intern at We Always Win Car Insurance Company
last summer. You notice that individual car insurance premiums
depend very much on the age of the individual and the number of
tra&c tickets received by the individual. You performed a regression
analysis in EXCEL and obtained the following partial information:

True or False: Referring to Table 14-10, to test the signi,cance of the
multiple regression model, the null hypothesis should be rejected
while allowing for 1% probability of committing a type I error.
True or False: The question: “Have you used any form of illicit drugs over the past 2
months?” will most likely result in measurement error if the question is answered.
The personnel director at a large company studied the eating habits of the company’s
employees. The director noted whether employees brought their own lunches to work,
ate at the company cafeteria, or went out to lunch. The goal of the study was to improve
the food service at the company cafeteria. This type of data collection would best be
considered as
A) an observational study.
B) a designed experiment.
C) a random sample.
D) a quota sample.
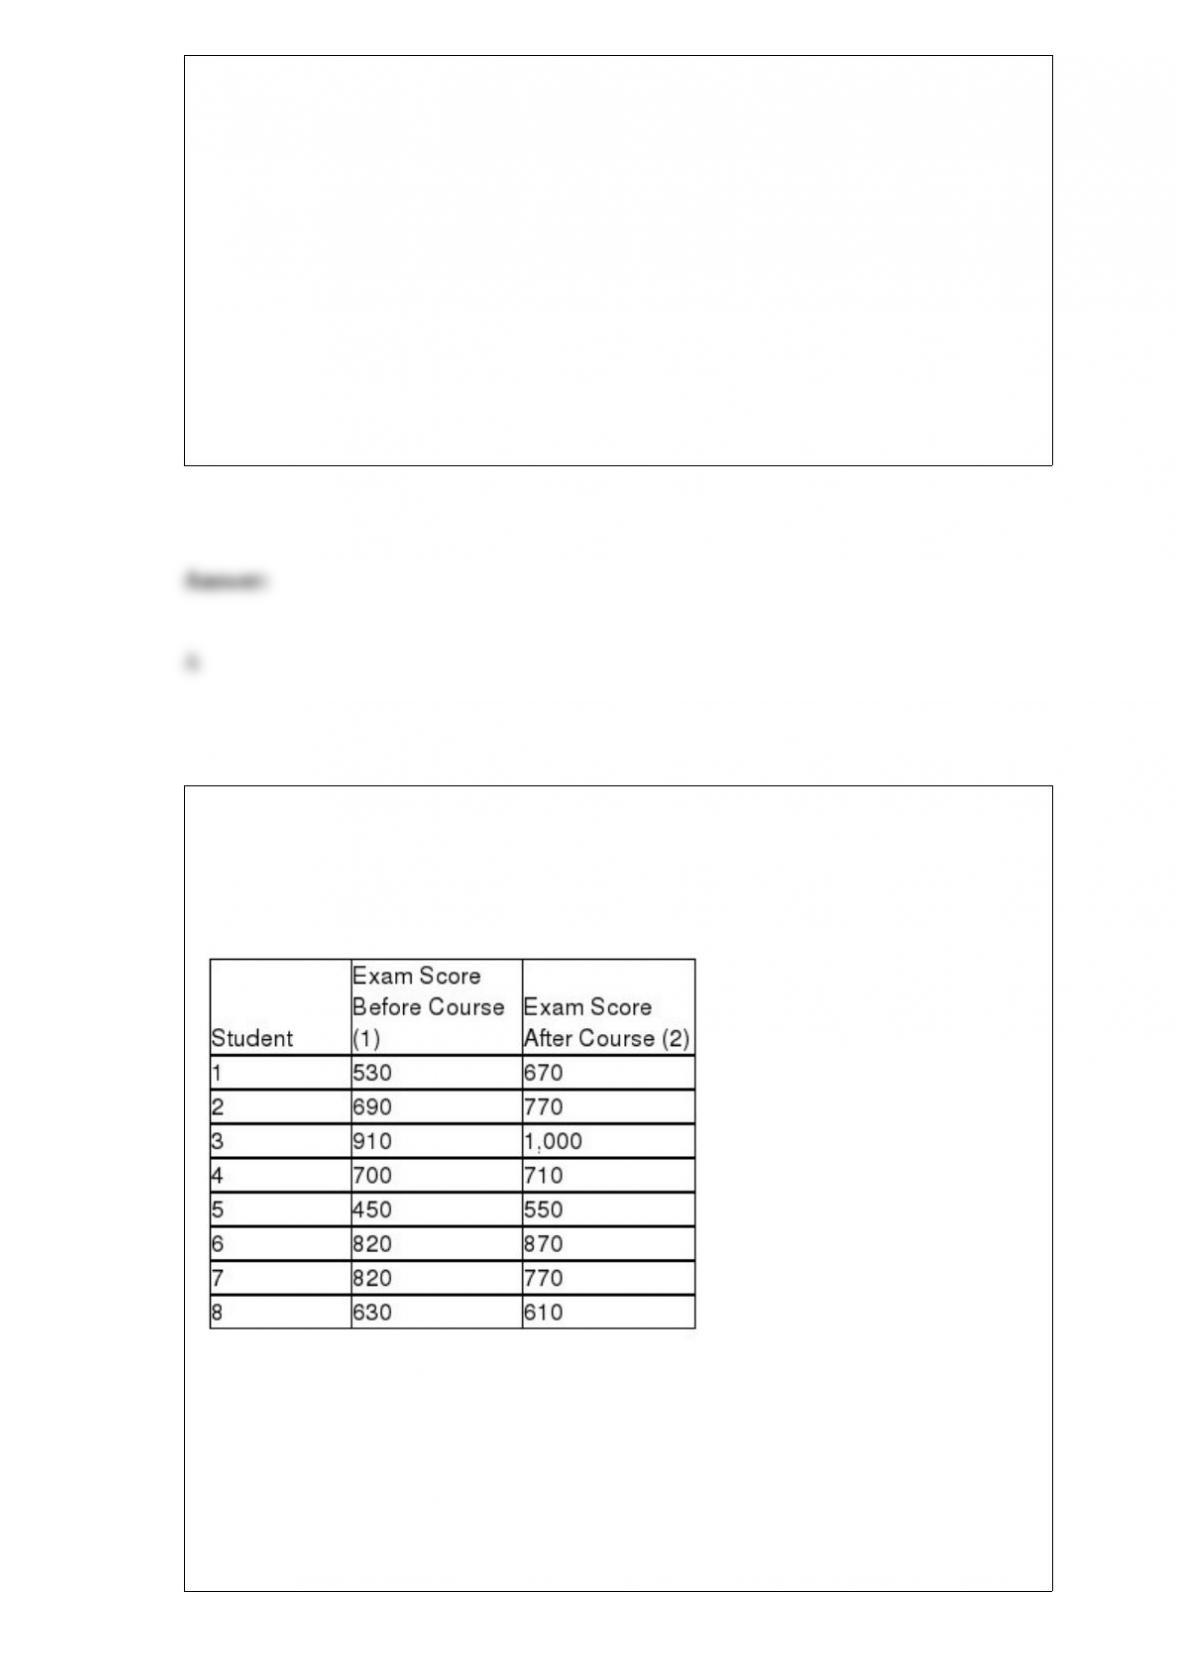
TABLE 10-5
To test the effectiveness of a business school preparation course, 8 students took a
general business test before and after the course. The results are given below.
Referring to Table 10-5, the value of the standard error of the difference scores is
A) 65.027.
B) 60.828.
C) 22.991.
D) 14.696.
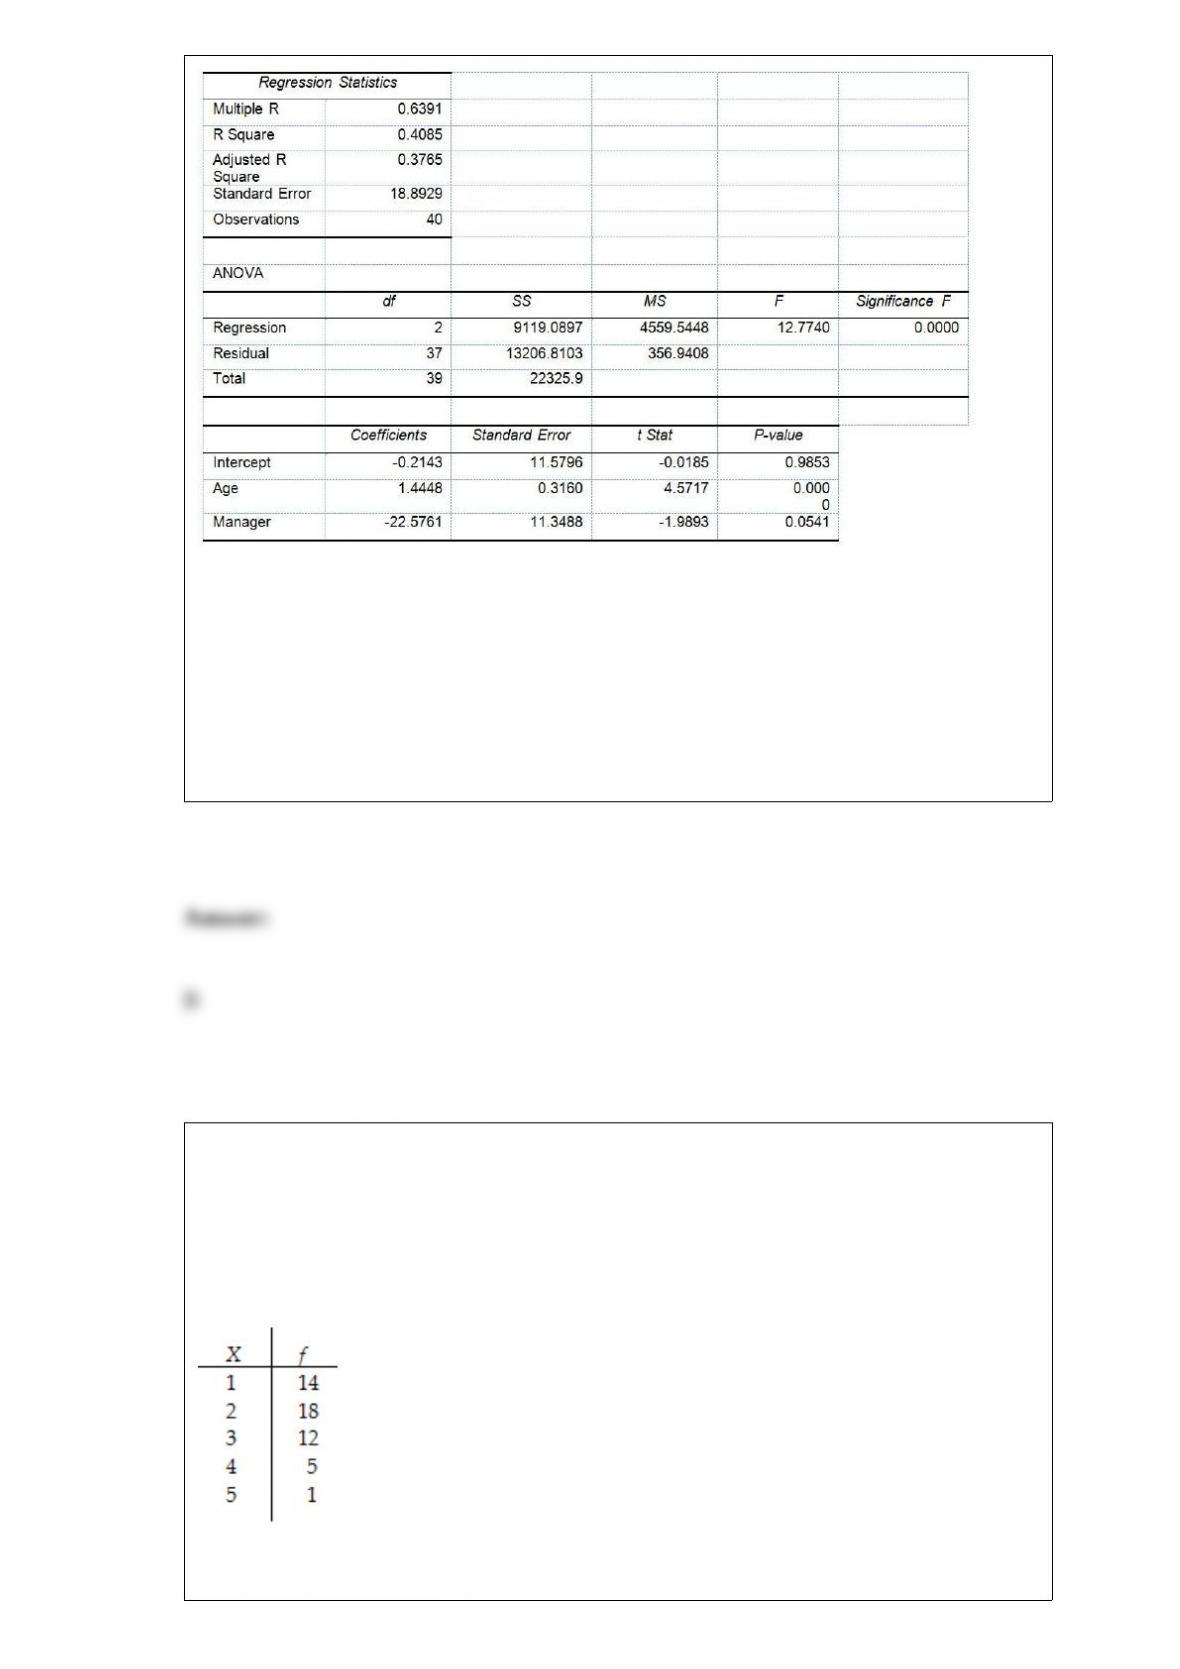
TABLE 17-10
Given below are results from the regression analysis where the dependent variable is
the number of weeks a worker is unemployed due to a layoff (Unemploy) and the
independent variables are the age of the worker (Age), the number of years of education
received (Edu), the number of years at the previous job (Job Yr), a dummy variable for
marital status (Married: 1 = married, 0 = otherwise), a dummy variable for head of
household (Head: 1 = yes, 0 = no) and a dummy variable for management position
(Manager: 1 = yes, 0 = no). We shall call this Model 1. The coefficient of partial
determination ( ) of each of the 6 predictors are, respectively,
0.2807, 0.0386, 0.0317, 0.0141, 0.0958, and 0.1201.
Model 2 is the regression analysis where the dependent variable is Unemploy and the
independent variables are Age and Manager. The results of the regression analysis are
given below:
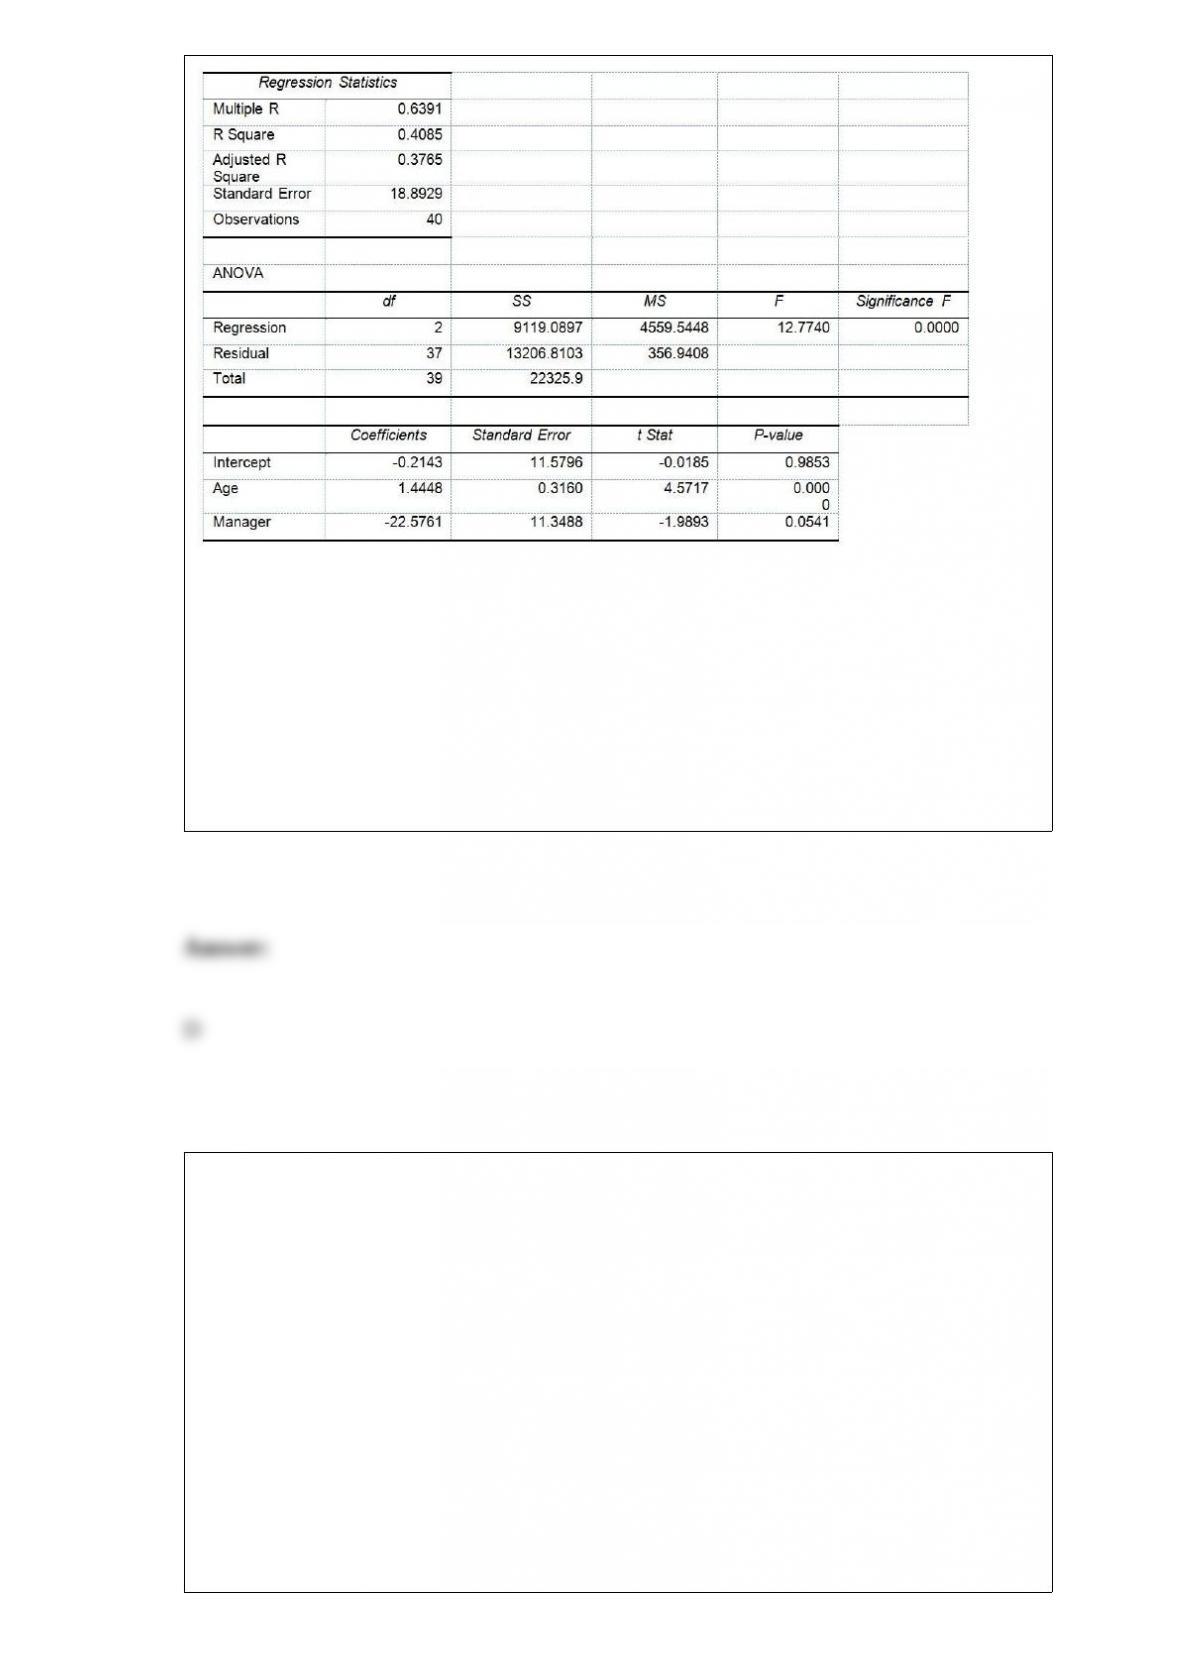
Referring to Table 17-10, Model 1, which of the following is the correct null hypothesis
to test whether being married or not makes a difference in the mean number of weeks a
worker is unemployed due to a layoff while holding constant the effect of all the other
independent variables?
A) H0 : β1 = 0
B) H0 : β2 = 0
C) H0 : β3 = 0
D) H0 : β4 = 0
The head librarian at the Library of Congress has asked her assistant for an interval
estimate of the mean number of books checked out each day. The assistant provides the
following interval estimate: from 740 to 920 books per day. If the head librarian knows
that the population standard deviation is 150 books checked out per day, and she asked
her assistant for a 95% confidence interval, approximately how large a sample did her
assistant use to determine the interval estimate?
A) 125
B) 13
C) 11
D) 4

A marketing research firm, in conducting a comparative taste test, provided three types
of peanut butter to a sample of households randomly selected within the state. Which of
the 4 methods of data collection is involved when people are asked to compare the three
types of peanut butter?
A) published sources
B) experimentation
C) surveying
D) observation
TABLE 11-8
A physician and president of a Tampa Health Maintenance Organization (HMO) are
attempting to show the benefits of managed health care to an insurance company. The
physician believes that certain types of doctors are more cost-effective than others. One
theory is that Primary Specialty is an important factor in measuring the
cost-effectiveness of physicians. To investigate this, the president obtained independent
random samples of 20 HMO physicians from each of 4 primary specialties – General
Practice (GP), Internal Medicine (IM), Pediatrics (PED), and Family Physicians (FP) –
and recorded the total charges per member per month for each. A second factor which
the president believes influences total charges per member per month is whether the
doctor is a foreign or USA medical school graduate. The president theorizes that foreign
graduates will have higher mean charges than USA graduates. To investigate this, the
president also collected data on 20 foreign medical school graduates in each of the 4
primary specialty types described above. So information on charges for 40 doctors (20
foreign and 20 USA medical school graduates) was obtained for each of the 4
specialties. The results for the ANOVA are summarized in the following table.
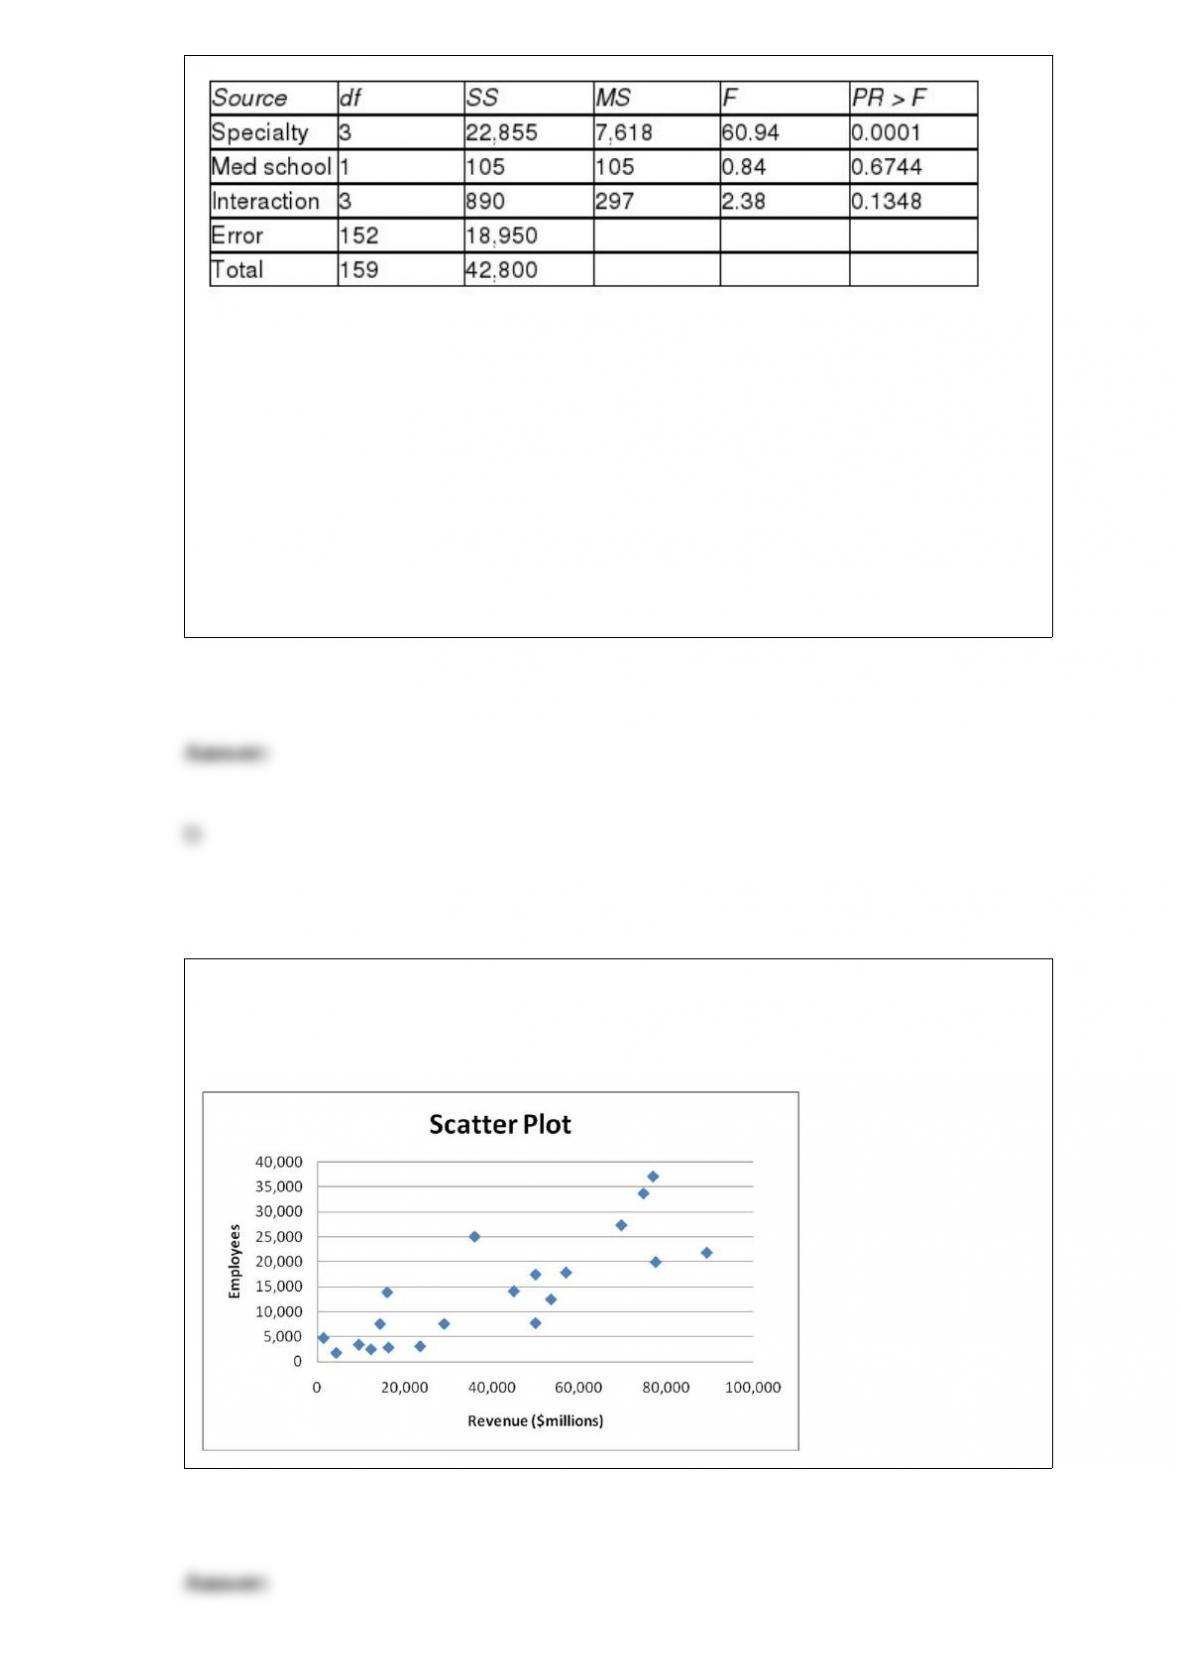
Referring to Table 11-8, what degrees of freedom should be used to determine the
critical value of the F ratio against which to test for interaction between the two factors?
A) numerator df = 1, denominator df = 159
B) numerator df = 3, denominator df = 159
C) numerator df = 1, denominator df = 152
D) numerator df = 3, denominator df = 152
True or False: Given below is the scatter plot of the number of employees and the total
revenue (millions$) of 20 U.S. companies. Companies that have higher numbers of
employees appear to also have higher total revenue.
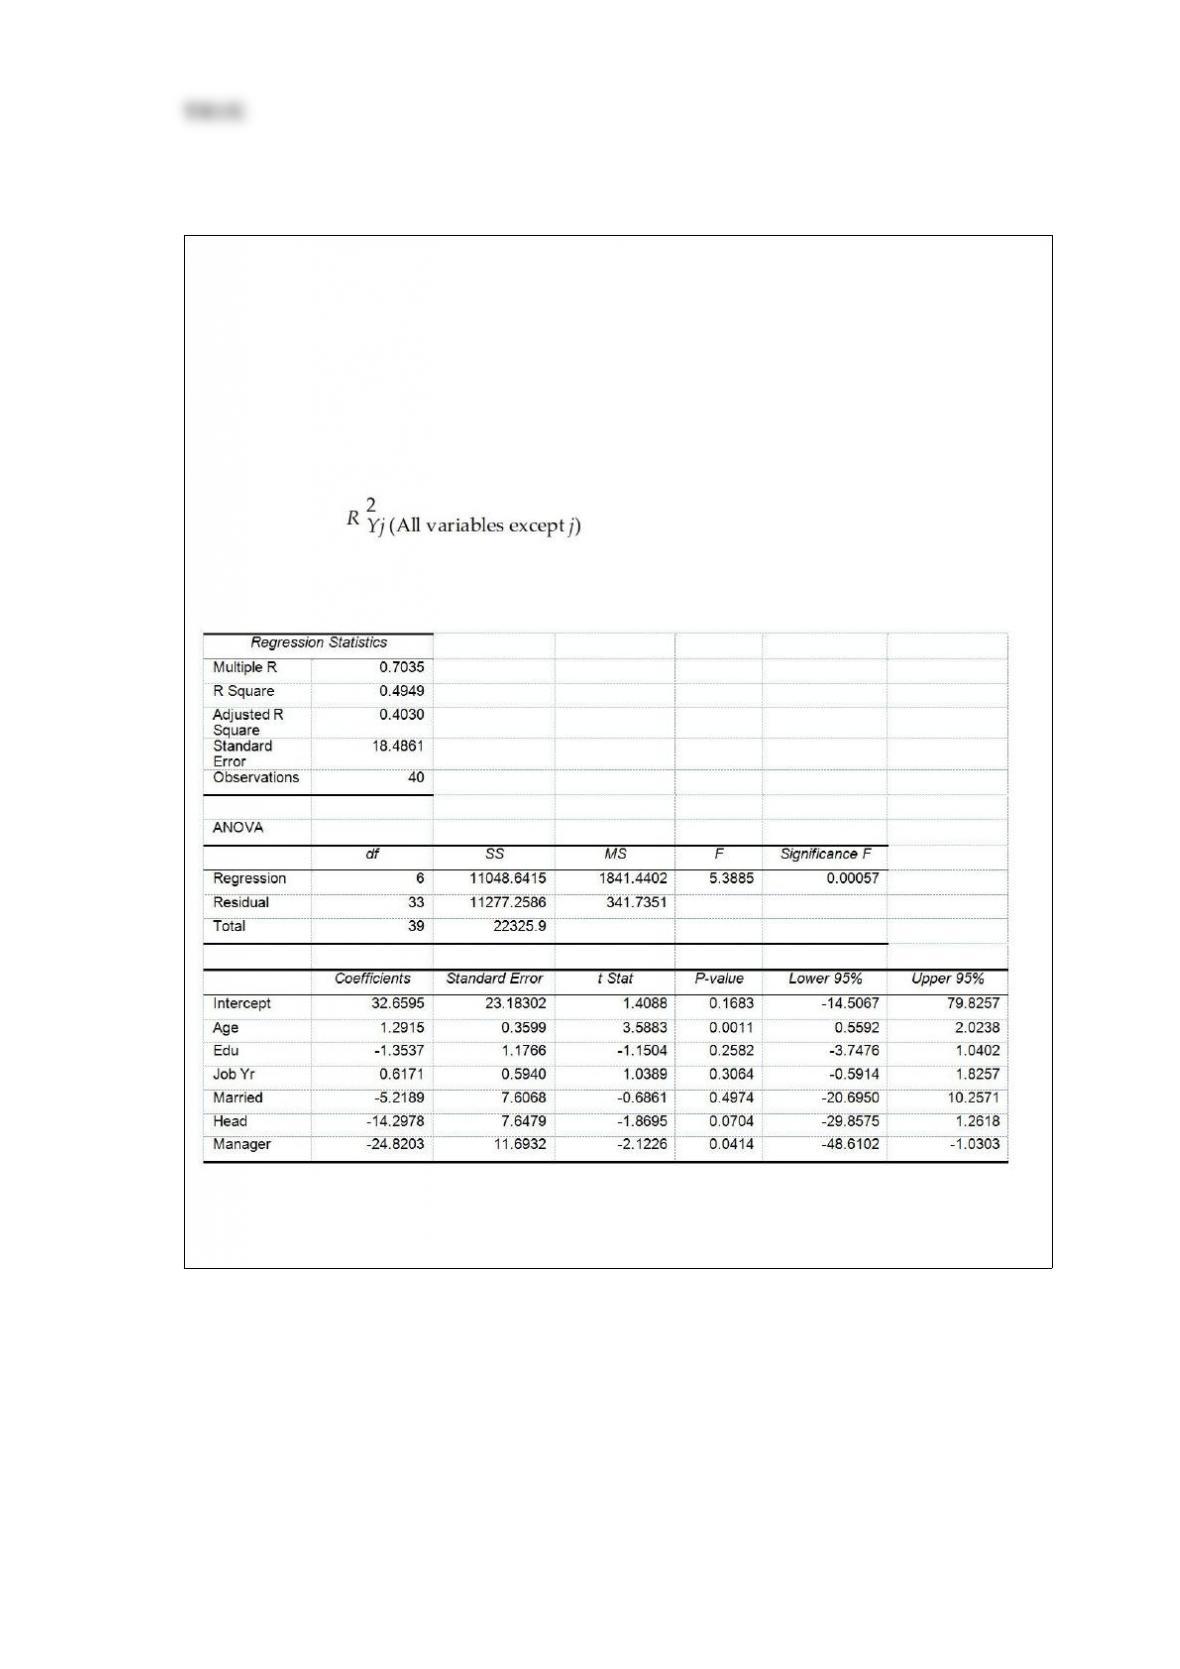
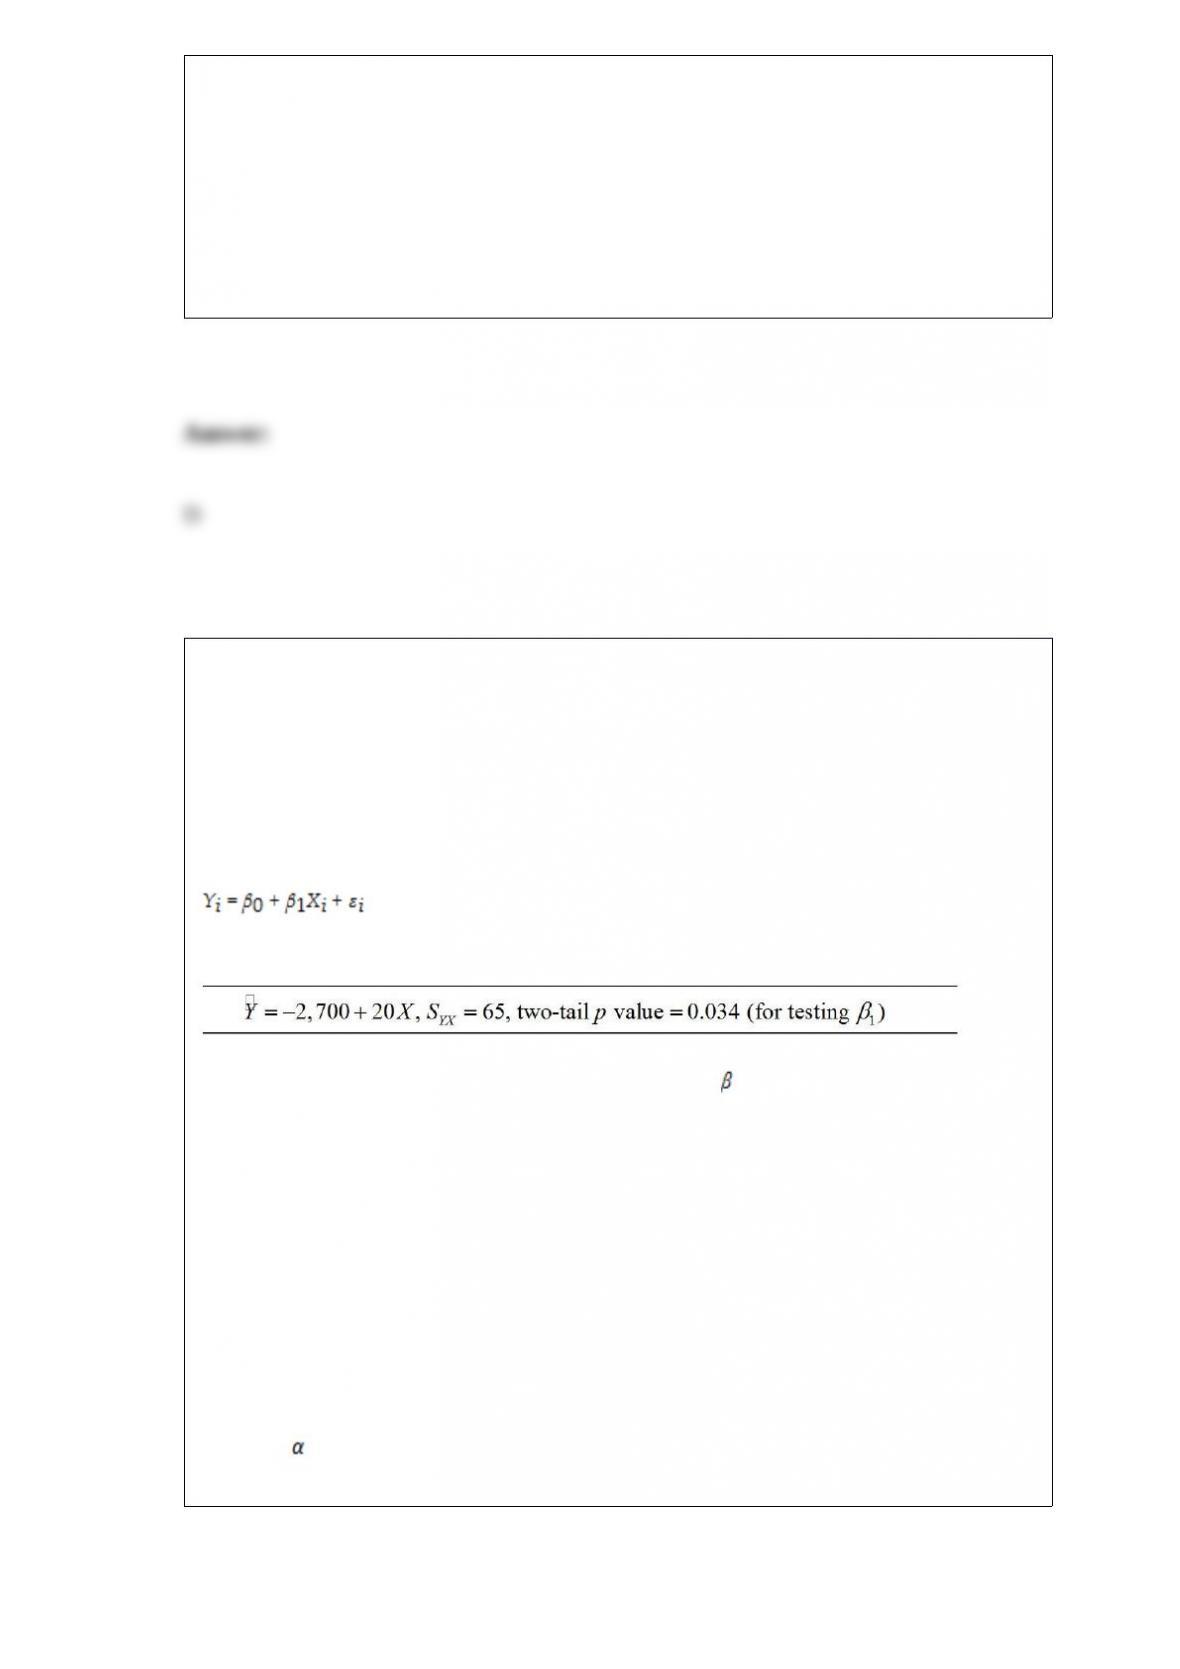
TABLE 17-10
Given below are results from the regression analysis where the dependent variable is
the number of weeks a worker is unemployed due to a layoff (Unemploy) and the
independent variables are the age of the worker (Age), the number of years of education
received (Edu), the number of years at the previous job (Job Yr), a dummy variable for
marital status (Married: 1 = married, 0 = otherwise), a dummy variable for head of
household (Head: 1 = yes, 0 = no) and a dummy variable for management position
(Manager: 1 = yes, 0 = no). We shall call this Model 1. The coefficient of partial
determination ( ) of each of the 6 predictors are, respectively,
0.2807, 0.0386, 0.0317, 0.0141, 0.0958, and 0.1201.
Model 2 is the regression analysis where the dependent variable is Unemploy and the
independent variables are Age and Manager. The results of the regression analysis are
given below:
Referring to Table 17-10, Model 1, which of the following is the correct null hypothesis
to determine whether there is a significant relationship between the number of weeks a
worker is unemployed due to a layoff and the entire set of explanatory variables?
A) H0 : β0 = β1 = β2= β3 = β4 = β5 = β6 = 0
B) H0 : β1 = β2= β3 = β4 = β5 = β6 = 0
C) H0 : β0 = β1 = β2= β3 = β4 = β5 = β6
D)H0 : β1 = β2= β3 = β4 = β5 = β6
TABLE 2-1
An insurance company evaluates many numerical variables about a person before
deciding on an appropriate rate for automobile insurance. A representative from a local
insurance agency selected a random sample of insured drivers and recorded, X, the
number of claims each made in the last 3 years, with the following results.
Referring to Table 2-1, how many drivers are represented in the sample?
A) 5
B) 15
C) 18
D) 50
TABLE 13-1
A large national bank charges local companies for using their services. A bank official
reported the results of a regression analysis designed to predict the bank’s charges (Y) –
measured in dollars per month – for services rendered to local companies. One
independent variable used to predict service charges to a company is the company’s
sales revenue (X) – measured in millions of dollars. Data for 21 companies who use the
bank’s services were used to fit the model:
The results of the simple linear regression are provided below.
Referring to Table 13-1, a 95% confidence interval for 1 is (15, 30). Interpret the
interval.
A) You are 95% confident that the mean service charge will fall between $15 and $30
per month.
B) You are 95% confident that the sales revenue (X) will increase between $15 and $30
million for every $1 increase in service charge (Y).
C) You are 95% confident that mean service charge (Y) will increase between $15 and
$30 for every $1 million increase in sales revenue (X).
D) At the = 0.05 level, there is no evidence of a linear relationship between service
charge (Y) and sales revenue (X).
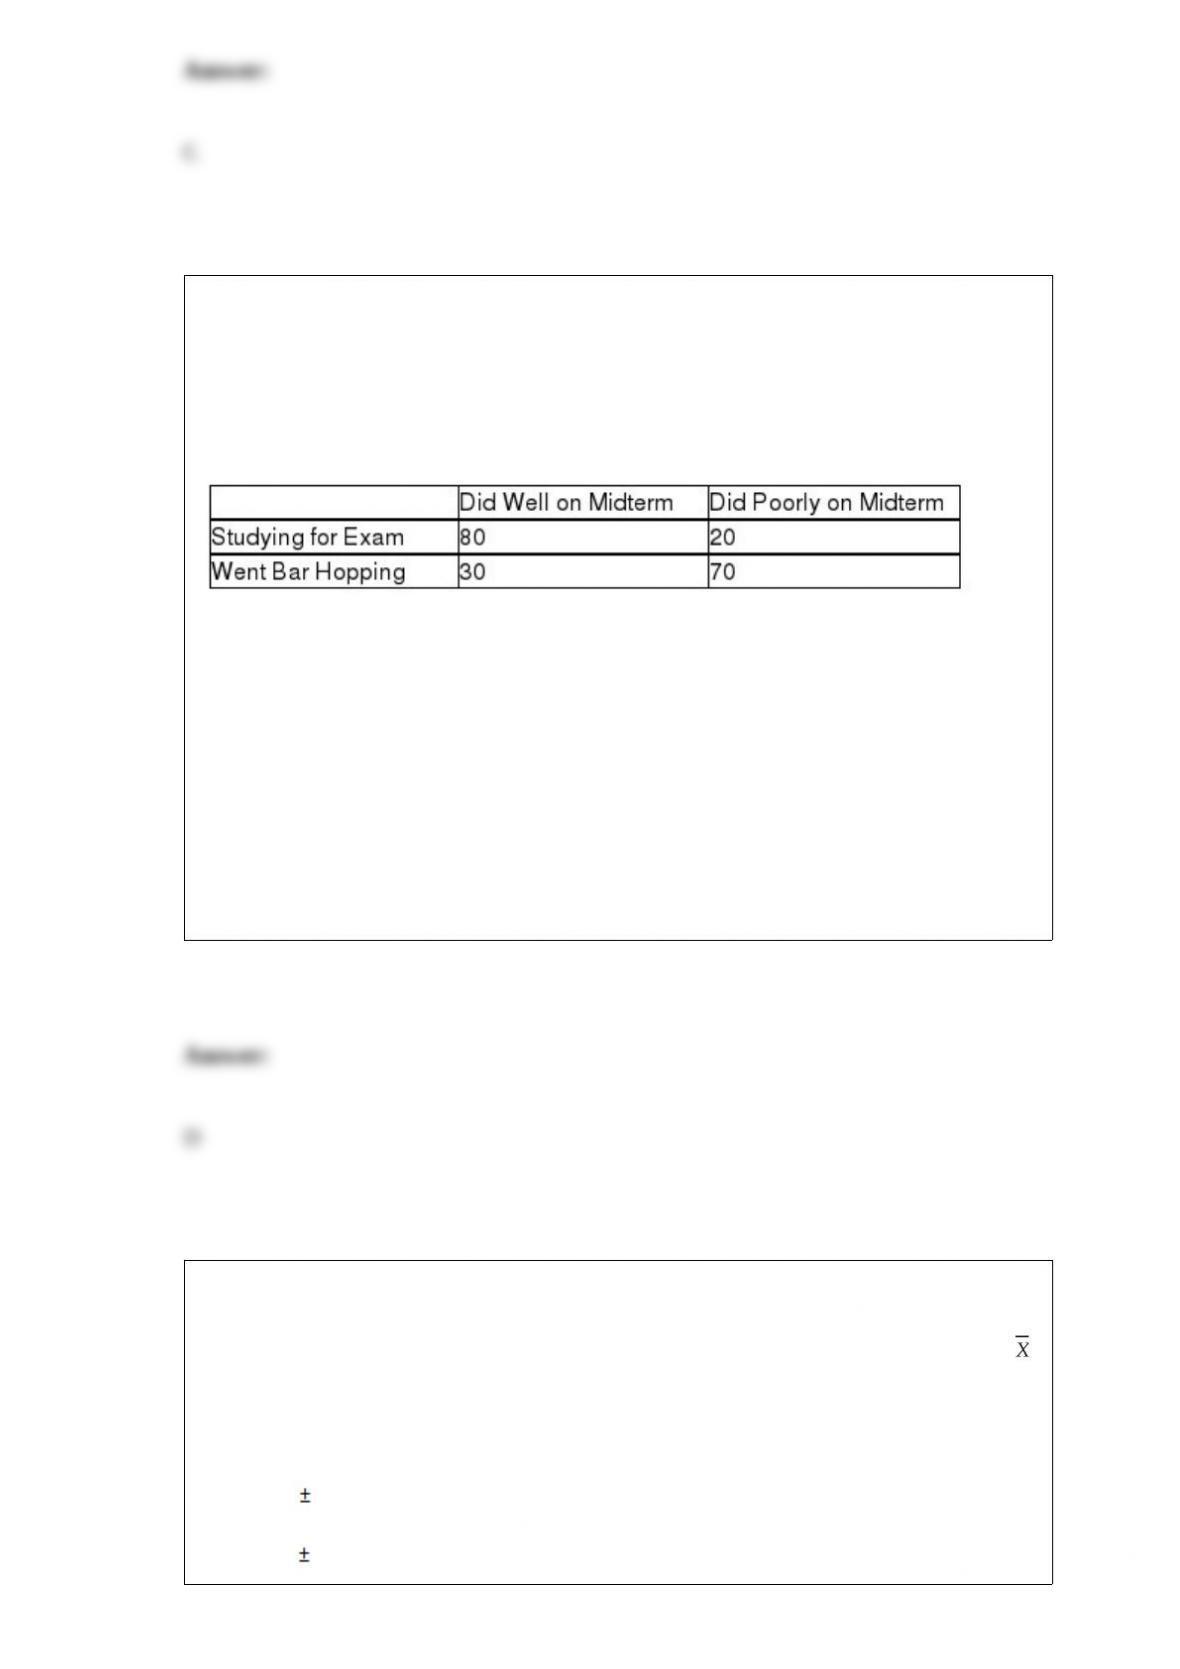
TABLE 4-2
An alcohol awareness task force at a Big-Ten university sampled 200 students after the
midterm to ask them whether they went bar hopping the weekend before the midterm or
spent the weekend studying, and whether they did well or poorly on the midterm. The
following result was obtained.
Referring to Table 4-2, what is the probability that a randomly selected student did well
on the midterm or went bar hopping the weekend before the midterm?
A) 30/200 or 15%
B) (80 + 30)/200 or (30 + 80)/200 or 55%
C) (30 + 70)/200 or (70 + 30)/200 or 50%
D) (80 + 30 + 70)/200 or (110 + 100 – 30)/200 or 90%
A major department store chain is interested in estimating the mean amount its credit
card customers spent on their first visit to the chain’s new store in the mall. Fifteen
credit card accounts were randomly sampled and analyzed with the following results:
= $50.50 and S = 20. Construct a 95% confidence interval for the mean amount its
credit card customers spent on their first visit to the chain’s new store in the mall
assuming that the amount spent follows a normal distribution.
A) $50.50 $9.09
B) $50.50 $10.12
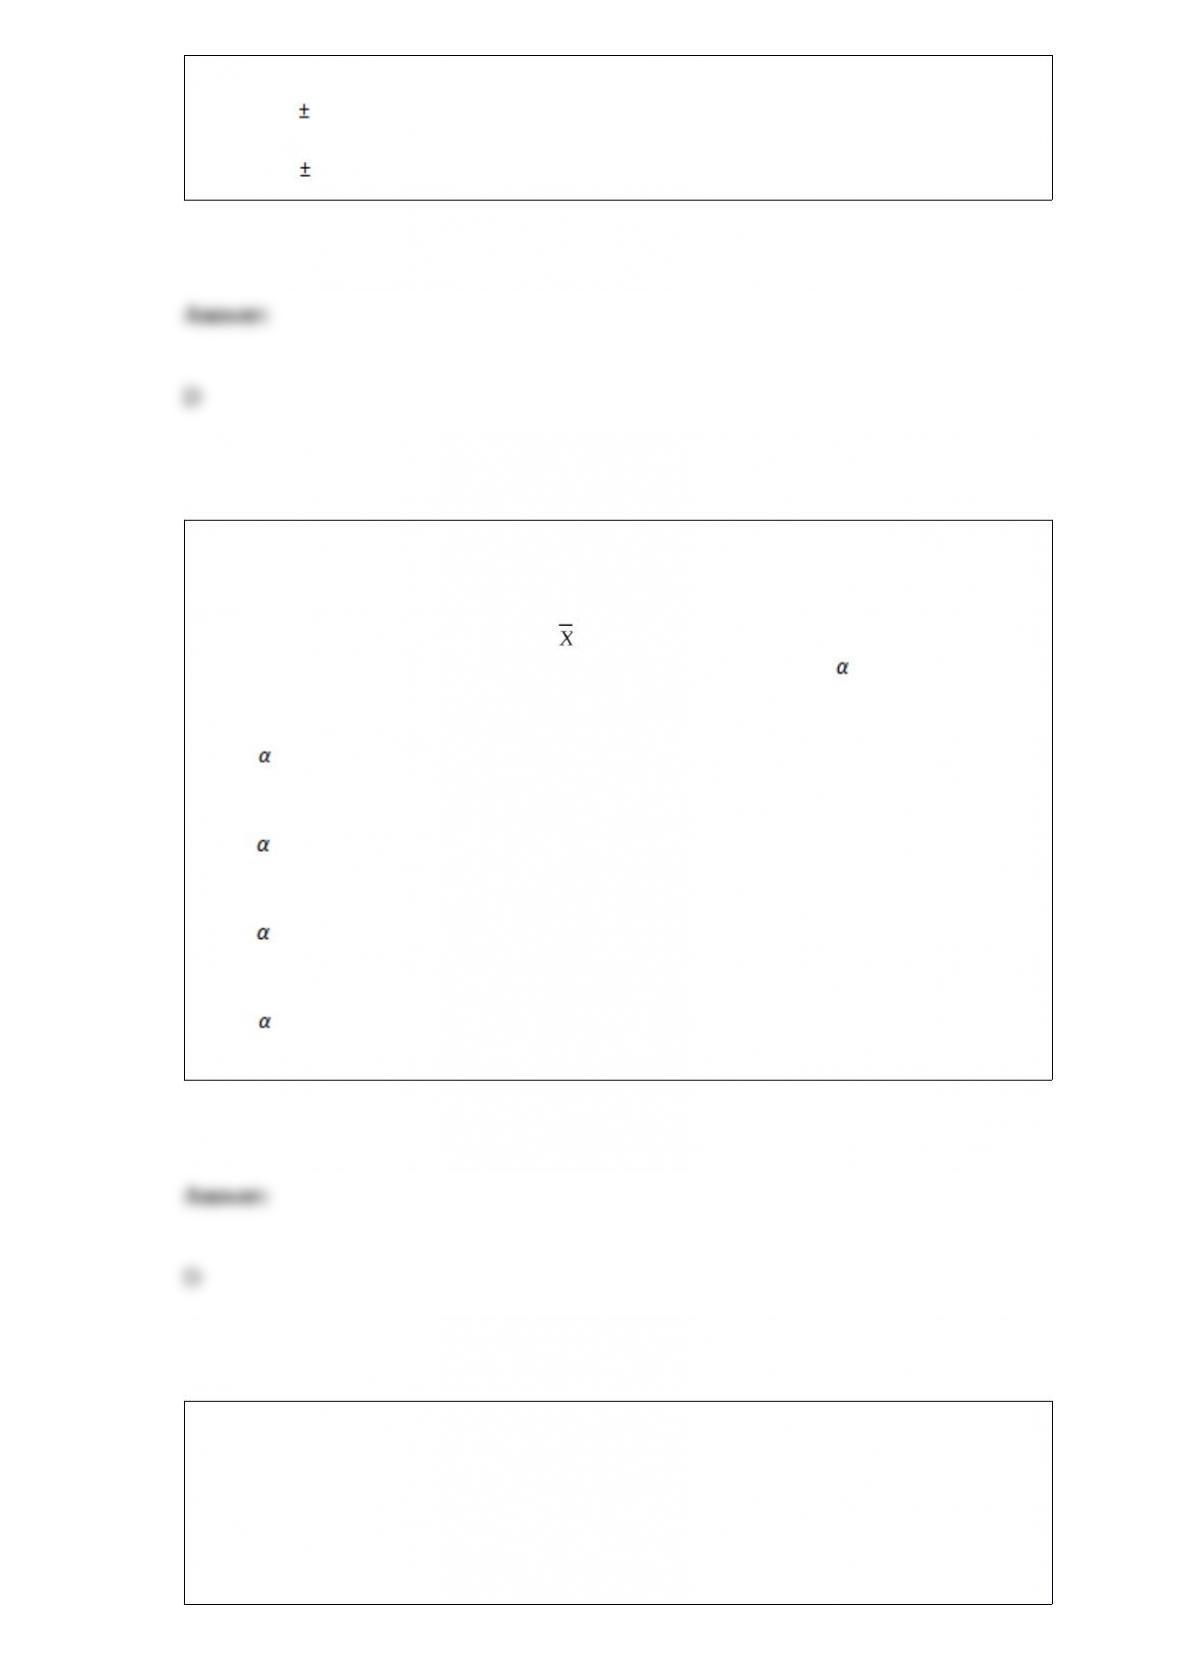
C) $50.50 $11.00
D) $50.50 $11.08
How many tissues should the Kimberly Clark Corporation package of Kleenex contain?
Researchers determined that 60 tissues is the mean number of tissues used during a
cold. Suppose a random sample of 100 Kleenex users yielded the following data on the
number of tissues used during a cold: = 52,
S = 22. Suppose the test statistic does fall in the rejection region at = 0.05. Which of
the following conclusions is correct?
A) At = 0.05, there is not sufficient evidence to conclude that the mean number of
tissues used during a cold is 60 tissues.
B) At = 0.05, there is sufficient evidence to conclude that the mean number of tissues
used during a cold is 60 tissues.
C) At = 0.05, there is insufficient evidence to conclude that the mean number of
tissues used during a cold is not 60 tissues.
D) At = 0.10, there is sufficient evidence to conclude that the mean number of tissues
used during a cold is not 60 tissues.
An agronomist wants to compare the crop yield of 3 varieties of chickpea seeds. She
plants all 3 varieties of the seeds on each of 5 different patches of fields. She then
measures the crop yield in bushels per acre. Which of the following tests will be the
most appropriate to find out whether using different patches is advantageous in
reducing the random error?
A) One-way ANOVA F test for differences among more than two means

B) Randomized block F test for differences among more than two means
C) Randomized block F test for block effect
D) Two-way ANOVA F test for the variety effect
The oranges grown in corporate farms in an agricultural state were damaged by some
unknown fungi a few years ago. Suppose the manager of a large farm wanted to study
the impact of the fungi on the orange crops on a daily basis over a 6-week period. On
each day a random sample of orange trees was selected from within a random sample of
acres. The daily average number of damaged oranges per tree and the proportion of
trees having damaged oranges were calculated. In this study, drawing conclusions on
any one day about the true population characteristics based on information obtained
from the sample is called ________.
TABLE 2-10
The histogram below represents scores achieved by 200 job applicants on a personality
profile.
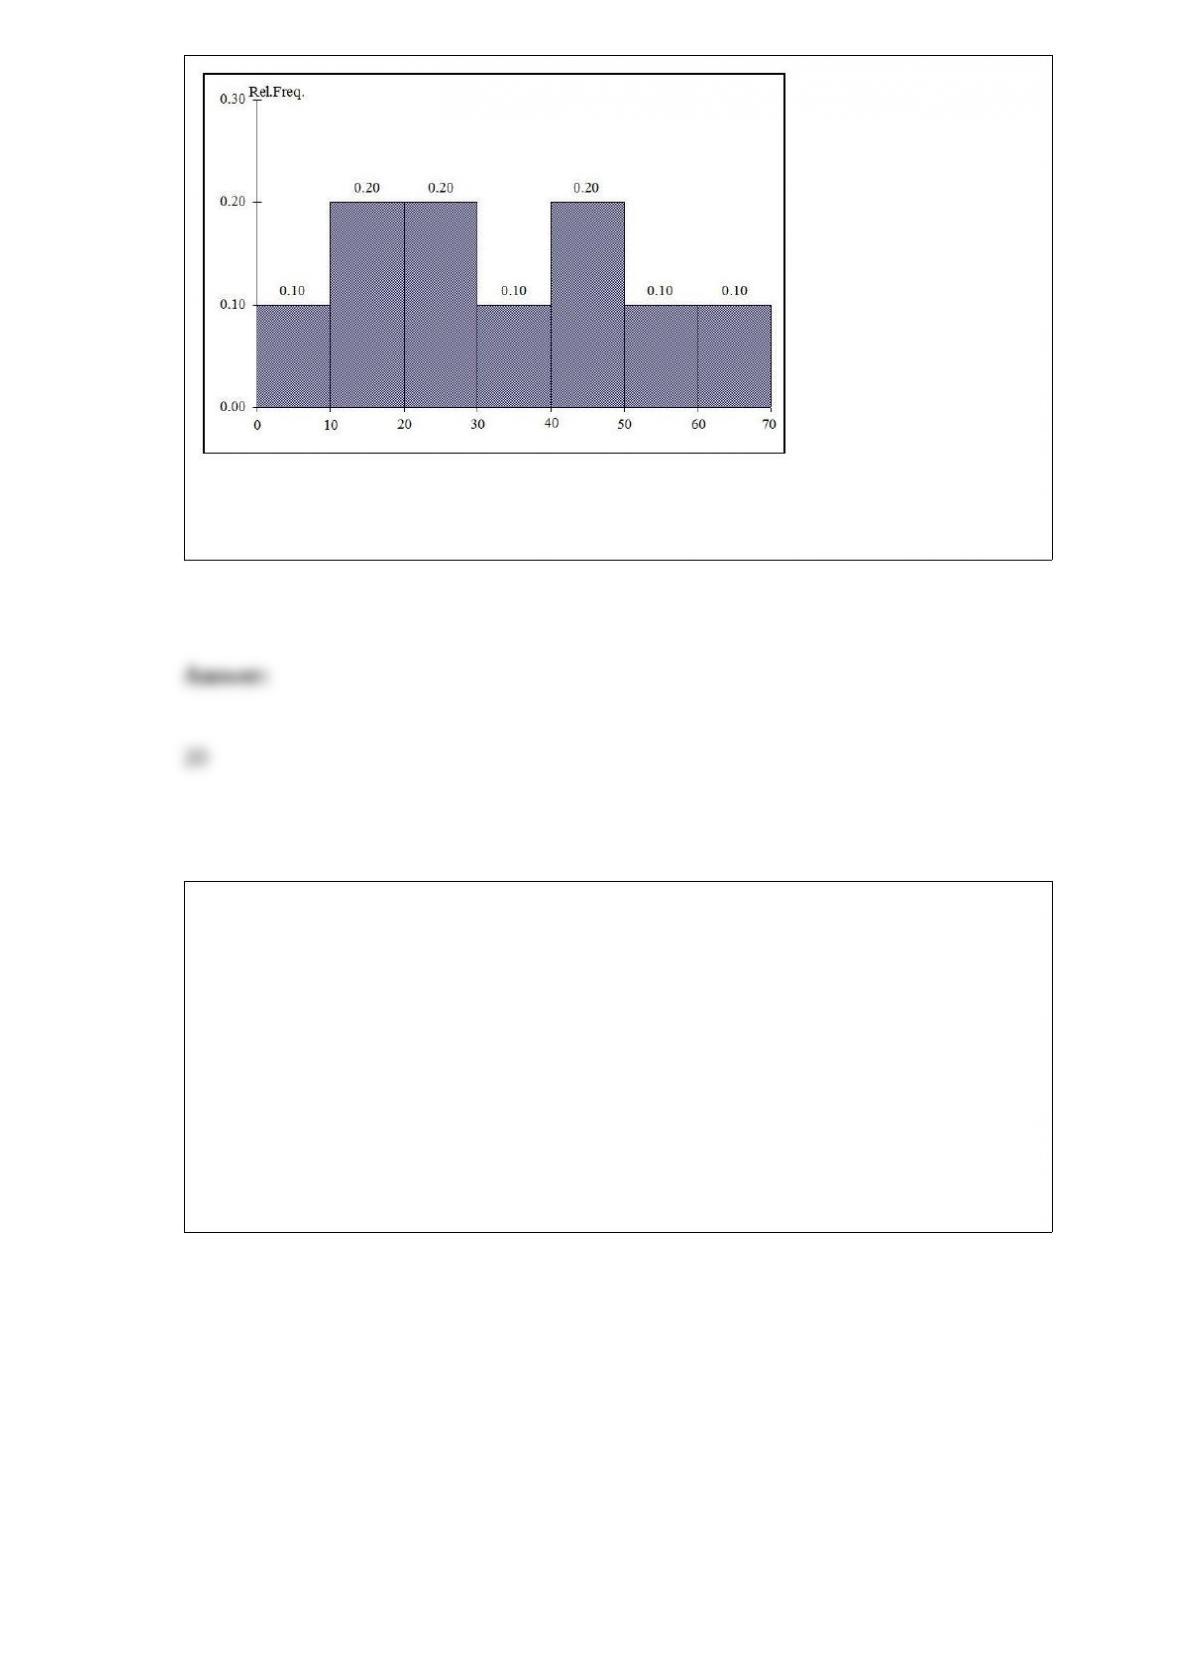
Referring to the histogram from Table 2-10, ________ percent of the job applicants
scored between 10 and 20.
TABLE 17-12
The marketing manager for a nationally franchised lawn service company would like to
study the characteristics that differentiate home owners who do and do not have a lawn
service. A random sample of 30 home owners located in a suburban area near a large
city was selected; 15 did not have a lawn service (code 0) and 15 had a lawn service
(code 1). Additional information available concerning these 30 home owners includes
family income (Income, in thousands of dollars), lawn size (Lawn Size, in thousands of
square feet), attitude toward outdoor recreational activities (Attitude 0 = unfavorable, 1
= favorable), number of teenagers in the household (Teenager), and age of the head of
the household (Age).
The Minitab output is given below:
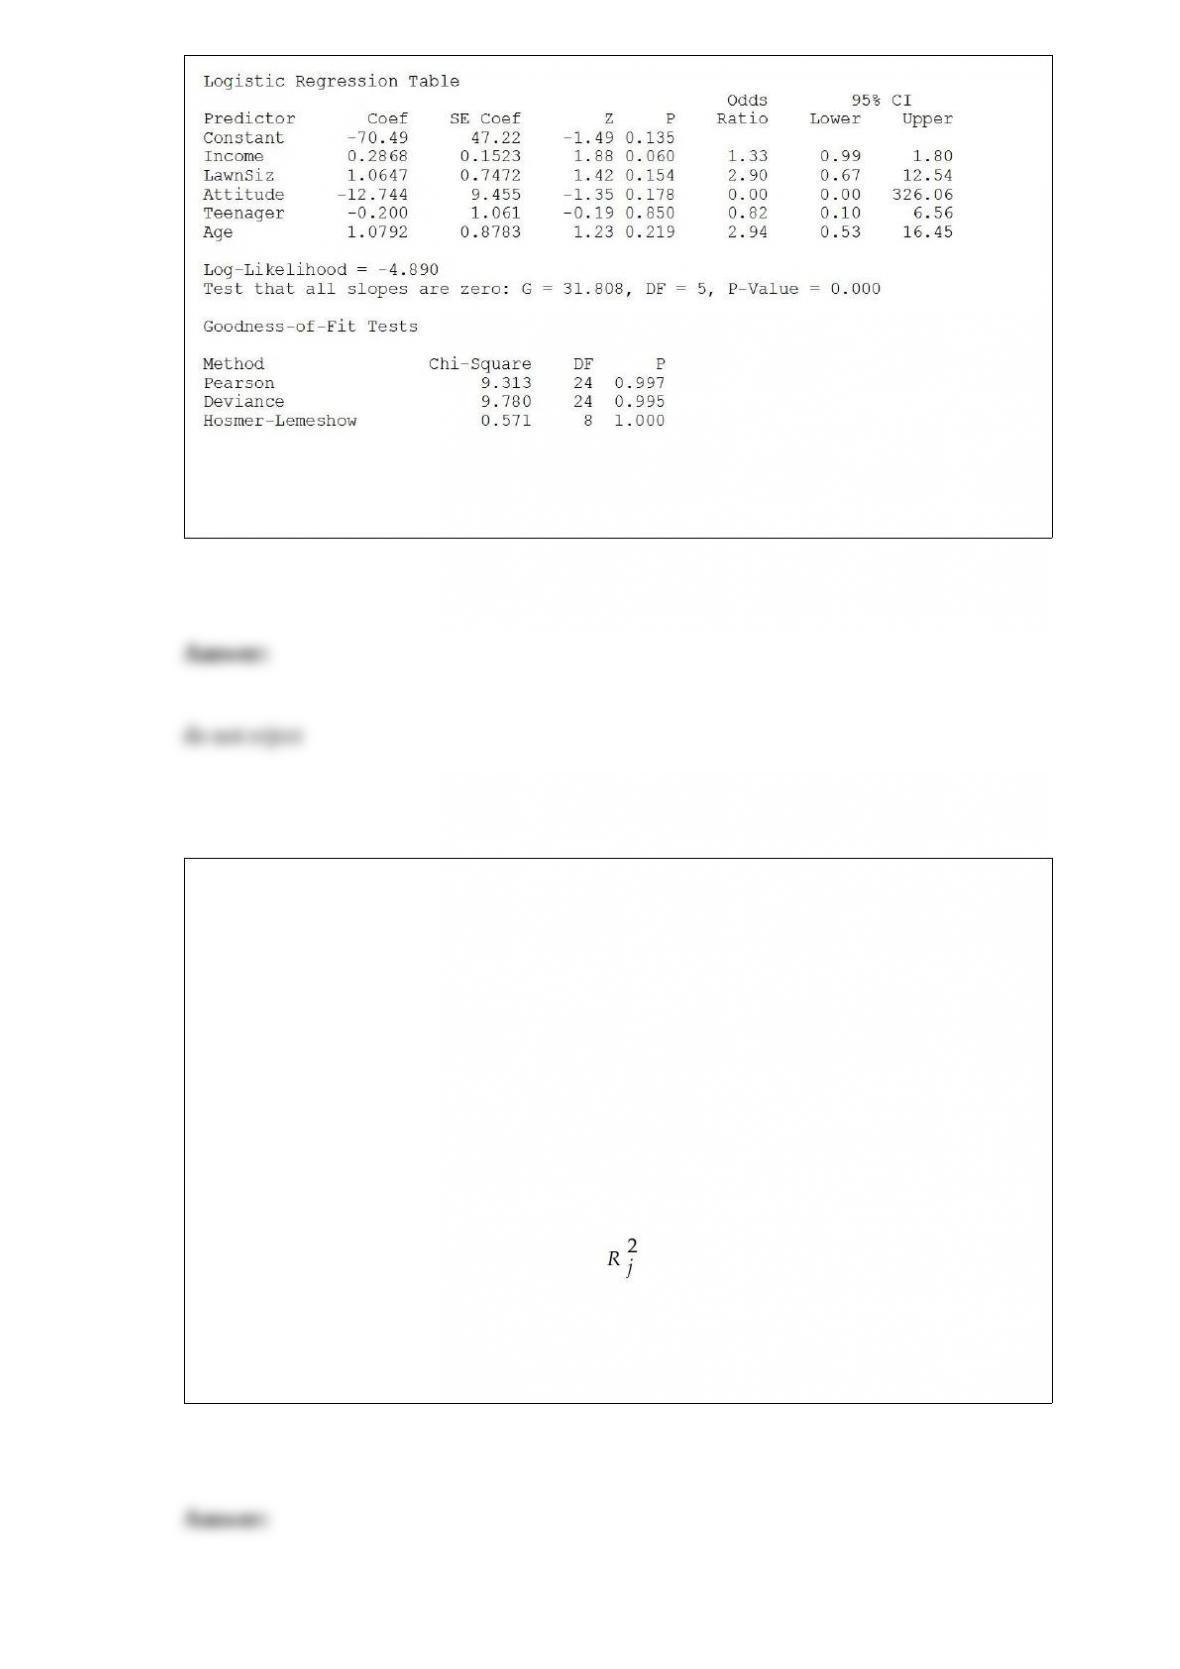
Referring to Table 17-12, what should be the decision (‘reject’ or ‘do not reject’) on the
null hypothesis when testing whether Age makes a significant contribution to the model
in the presence of the other independent variables at a 0.05 level of significance?
TABLE 15-5
What are the factors that determine the acceleration time (in sec.) from 0 to 60 miles per
hour of a car? Data on the following variables for 171 different vehicle models were
collected:
Accel Time: Acceleration time in sec.
Cargo Vol: Cargo volume in cu. ft.
HP: Horsepower
MPG: Miles per gallon
SUV: 1 if the vehicle model is an SUV with Coupe as the base when SUV and Sedan
are both 0
Sedan: 1 if the vehicle model is a sedan with Coupe as the base when SUV and Sedan
are both 0
The coefficient of multiple determination ( ) for the regression model using each of
the 5 variables Xj as the dependent variable and all other X variables as independent
variables are, respectively, 0.7461, 0.5676, 0.6764, 0.8582, 0.6632.
Referring to Table 15-5, what is the value of the variance inflationary factor of Sedan?

Referring to Table 14-4, what is the predicted house size (in hundreds of square feet) for
an individual earning an annual income of $40,000 and having a family size of 4?
TABLE 3-2
The data below represent the amount of grams of carbohydrates in a serving of
breakfast cereal in a sample of 11 different servings.
Referring to Table 3-2, the arithmetic mean carbohydrates in this sample is ________
grams.
The distribution of the number of loaves of bread sold per week by a large bakery over
the past 5 years has a mean of 7,750 and a standard deviation of 145 loaves. Suppose a
random sample of n = 40 weeks has been selected. What is the approximate probability
that the mean number of loaves sold in the sampled weeks exceeds 7,895 loaves?
The amount of tea leaves in a can from a particular production line is normally
distributed with = 110 grams and = 25 grams. A sample of 25 cans is to be selected.
What is the probability that the sample mean will be between 100 and 120 grams?
TABLE 17-10
Given below are results from the regression analysis where the dependent variable is
the number of weeks a worker is unemployed due to a layoff (Unemploy) and the
independent variables are the age of the worker (Age), the number of years of education
received (Edu), the number of years at the previous job (Job Yr), a dummy variable for
marital status (Married: 1 = married, 0 = otherwise), a dummy variable for head of
household (Head: 1 = yes, 0 = no) and a dummy variable for management position
(Manager: 1 = yes, 0 = no). We shall call this Model 1. The coefficient of partial
determination ( ) of each of the 6 predictors are, respectively,
0.2807, 0.0386, 0.0317, 0.0141, 0.0958, and 0.1201.
Model 2 is the regression analysis where the dependent variable is Unemploy and the
independent variables are Age and Manager. The results of the regression analysis are
given below:
Referring to Table 17-10, Model 1, what are the lower and upper limits of the 95%
confidence interval estimate for the difference in the mean number of weeks a worker is
unemployed due to a layoff between a worker who is married and one who is not after
taking into consideration the effect of all the other independent variables?
The risk-________ curve shows a rapid increase in utility for initial amounts of money
followed by a gradual leveling off for increasing dollar amounts.