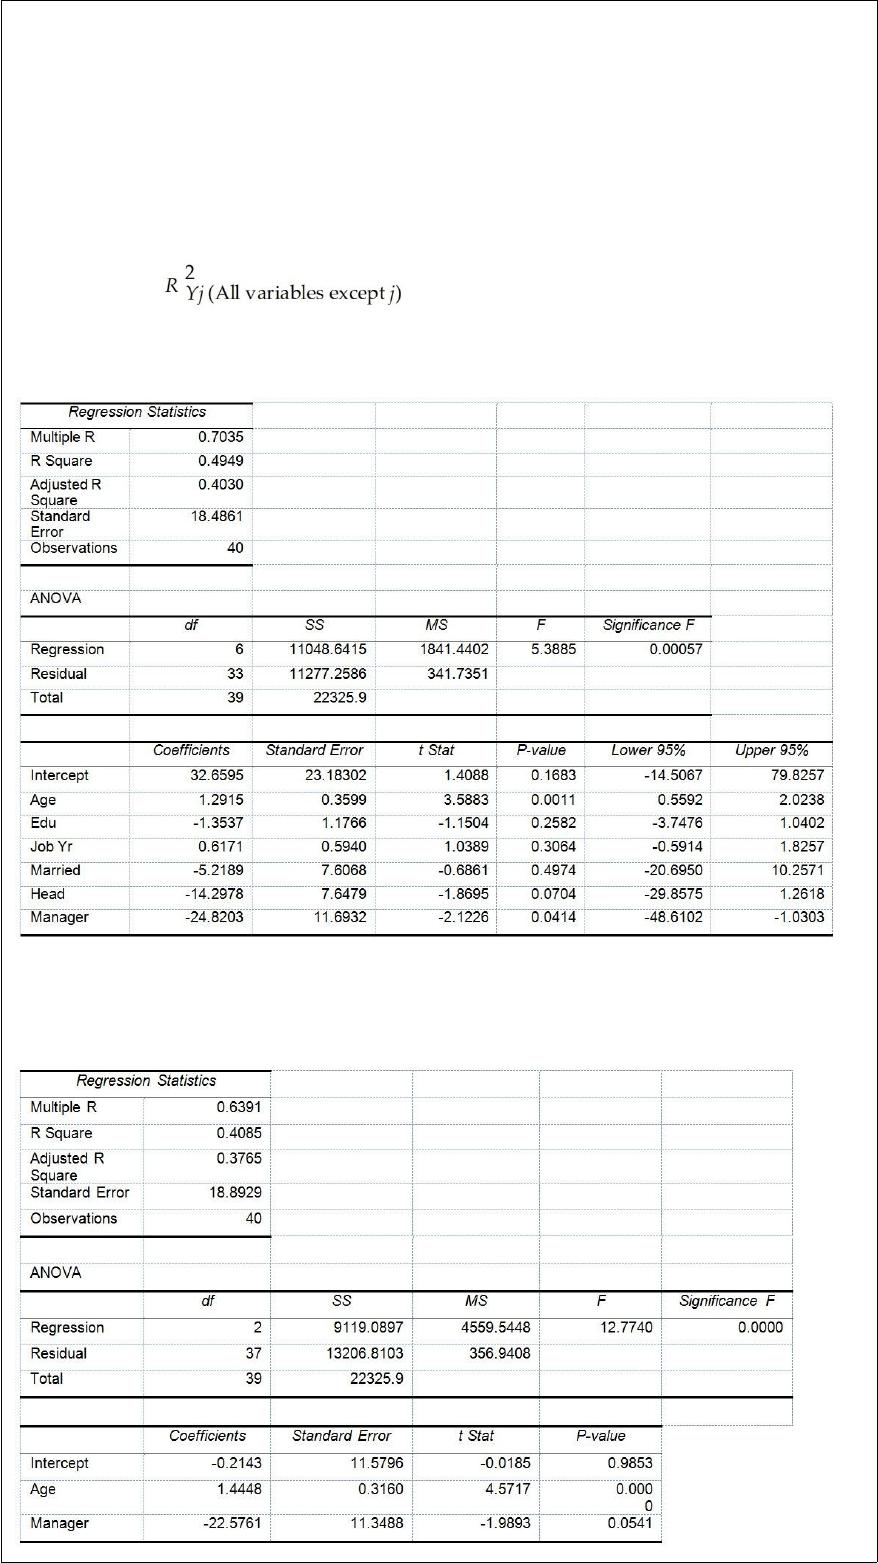
TABLE 17-10
Given below are results from the regression analysis where the dependent variable is
the number of weeks a worker is unemployed due to a layoff (Unemploy) and the
independent variables are the age of the worker (Age), the number of years of education
received (Edu), the number of years at the previous job (Job Yr), a dummy variable for
marital status (Married: 1 = married, 0 = otherwise), a dummy variable for head of
household (Head: 1 = yes, 0 = no) and a dummy variable for management position
(Manager: 1 = yes, 0 = no). We shall call this Model 1. The coefficient of partial
determination ( ) of each of the 6 predictors are, respectively,
0.2807, 0.0386, 0.0317, 0.0141, 0.0958, and 0.1201.
Model 2 is the regression analysis where the dependent variable is Unemploy and the
independent variables are Age and Manager. The results of the regression analysis are
given below:
Referring to Table 17-10, Model 1, the null hypothesis H0 : β1 = β2= β3 = β4 = β5 = β6
= 0 implies that the number of weeks a worker is unemployed due to a layoff is not
related to any of the explanatory variables.
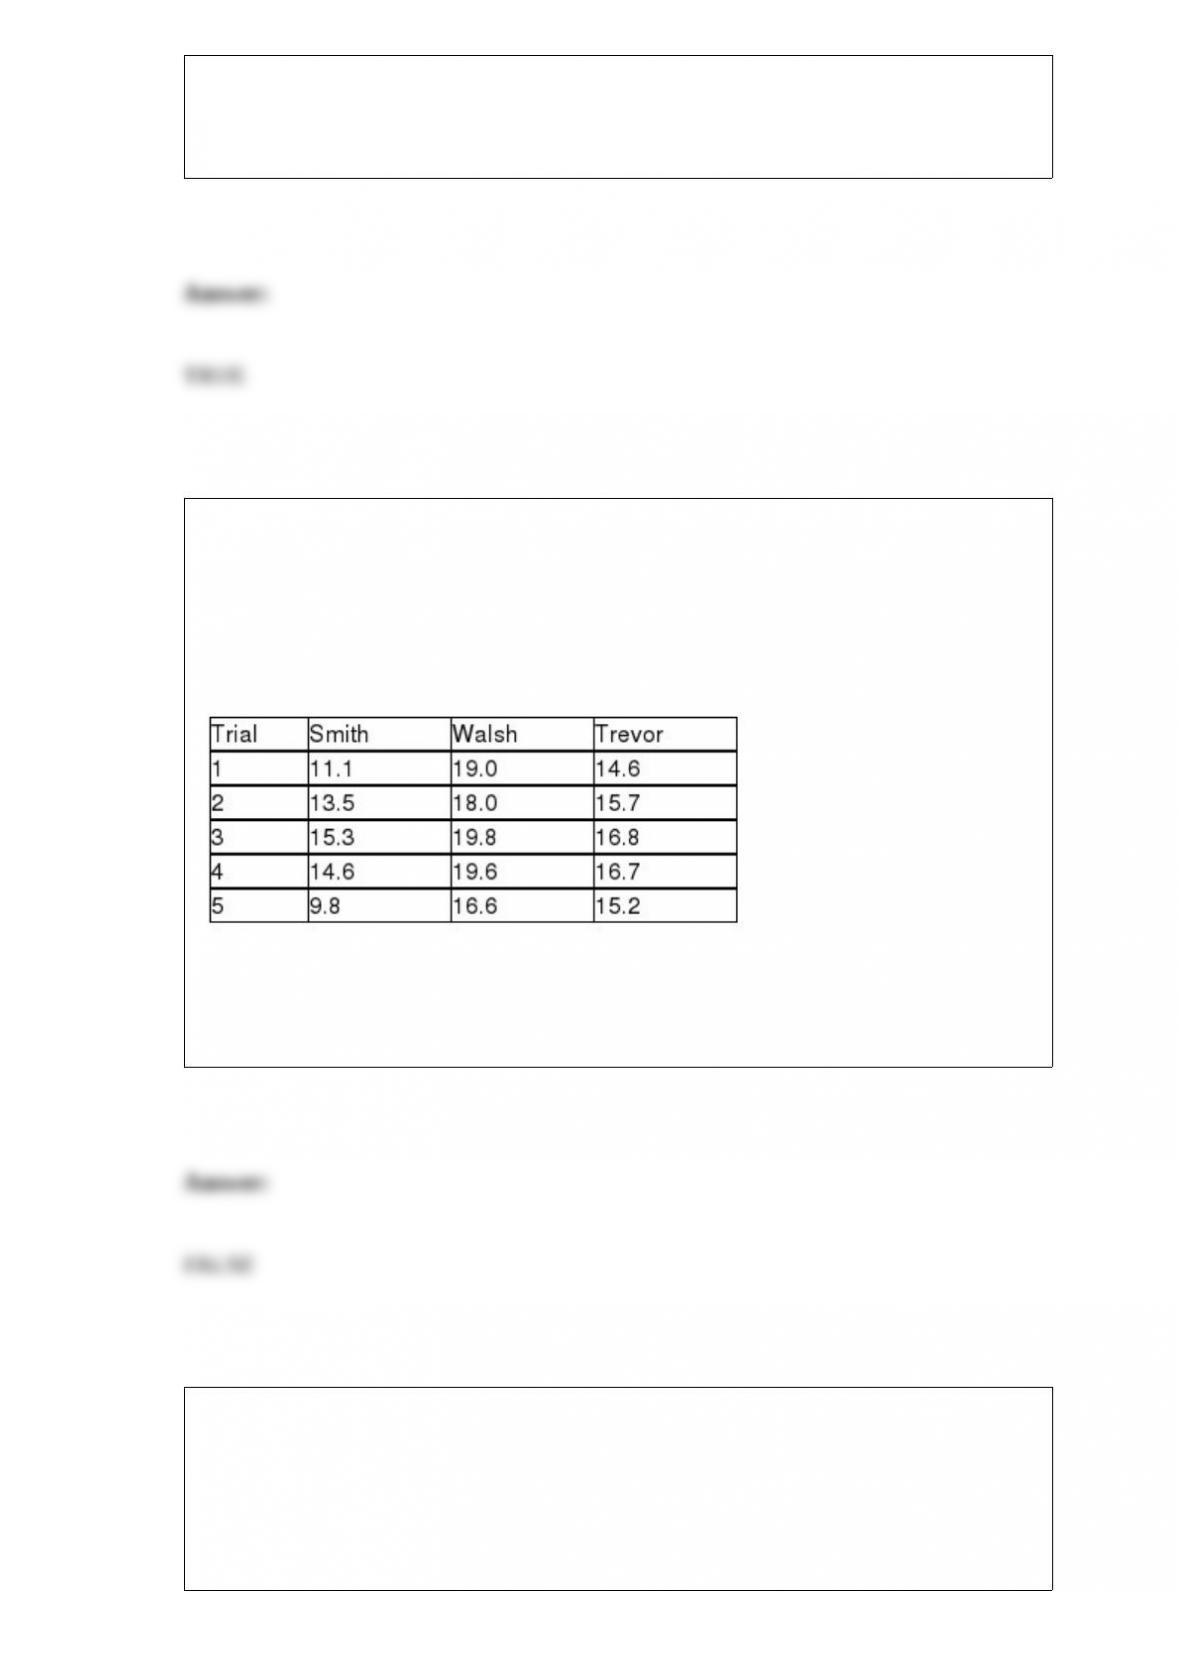
TABLE 11-4
An agronomist wants to compare the crop yield of 3 varieties of chickpea seeds. She
plants 15 fields, 5 with each variety. She then measures the crop yield in bushels per
acre. Treating this as a completely randomized design, the results are presented in the
table that follows.
True or False: Referring to Table 11-4, based on the Tukey-Kramer procedure with an
overall level of significance of 0.01, the agronomist would decide that there is a
significant difference between the crop yield of Walsh and Trevor seeds.
TABLE 8-5
A sample of salary offers (in thousands of dollars) given to management majors is: 48,
51, 46, 52, 47, 48, 47, 50, 51, and 59. Using this data to obtain a 95% confidence
interval resulted in an interval from 47.19 to 52.61.

True or False: Referring to Table 8-5, 95% of all confidence intervals constructed
similarly to this one with a sample size of 10 will contain the mean of the population.
True or False: The sample mean is a point estimate of the population mean.
True or False: The number of defective apples in a single box will be measured on an
interval scale.
TABLE 5-7
There are two houses with almost identical characteristics available for investment in
two different neighborhoods with drastically different demographic composition. The
anticipated gain in value when the houses are sold in 10 years has the following
probability distribution:

Referring to Table 5-7, what is the covariance of the two houses?
Referring to Table 14-8, the coefficient of partial determination is
________.TABLE 14-8
A !nancial analyst wanted to examine the relationship between salary
(in $1,000) and 2 variables: age
(X1 = Age) and experience in the !eld (X2 = Exper). He took a sample
of 20 employees and obtained the following Microsoft Excel output:
Also, the sum of squares due to the regression for the model that
includes only Age is 5022.0654 while the sum of squares due to the
regression for the model that includes only Exper is 125.9848.

TABLE 6-6
According to Investment Digest, the arithmetic mean of the annual return for common
stocks over an 85-year period was 9.5%, but the value of the variance was not
mentioned. Also 25% of the annual returns were below 8%, while 65% of the annual
returns were between 8% and 11.5%. The article claimed that the distribution of annual
return for common stocks was bell-shaped and approximately symmetric. Assume that
this distribution is normal with the mean given above. Answer the following questions
without the help of a calculator, statistical software or statistical table.
Referring to Table 6-6, find the probability that the annual return of a random year will
be more than 11.5%.
TABLE 2-14
The table below contains the number of people who own a portable Blu-ray player in a
sample of 600 broken down by gender.
Referring to Table 2-14, construct a table of row percentages.

You were told that the mean score on a statistics exam is 75 with the scores normally
distributed. In addition, you know the probability of a score between 55 and 60 is
4.41% and that the probability of a score greater than 90 is 6.68%. What is the
probability of a score between 60 and 95?