True or False: In a Poisson distribution, the mean and standard deviation are equal.
True or False: TABLE 17-10
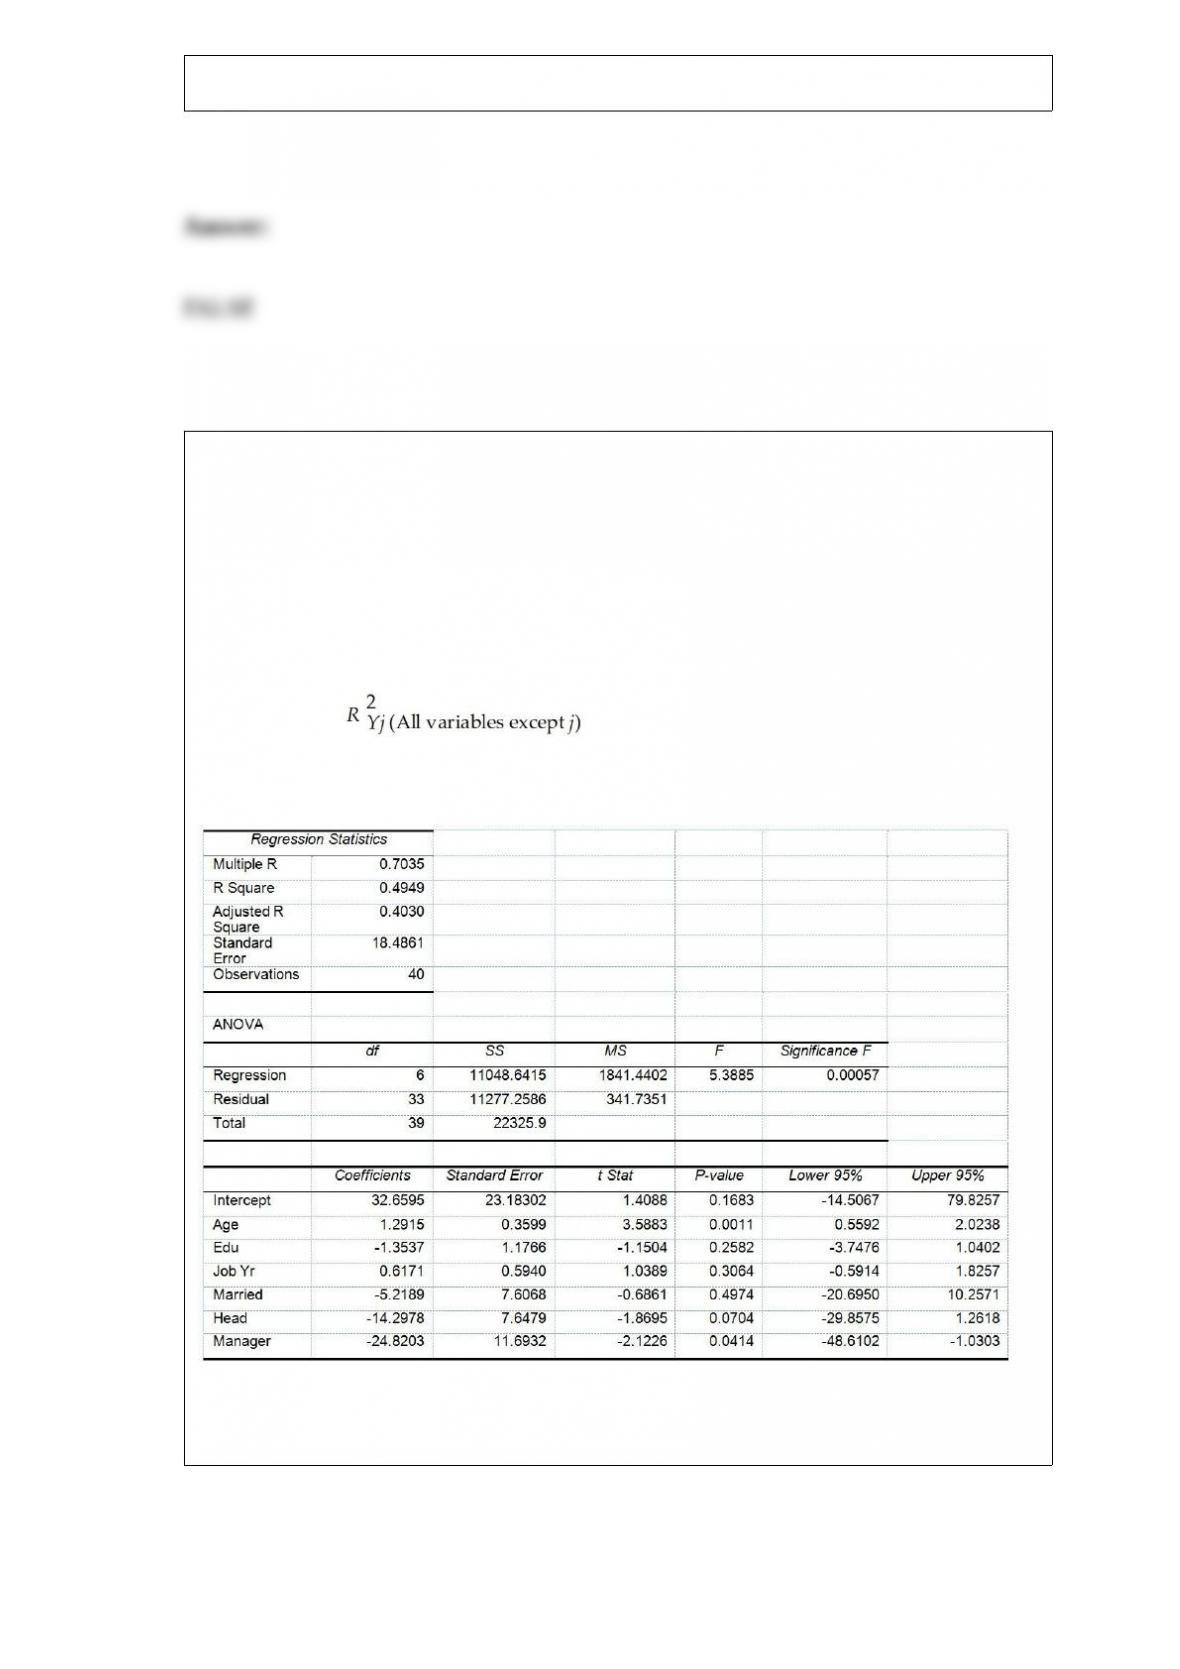
Given below are results from the regression analysis where the dependent variable is
the number of weeks a worker is unemployed due to a layoff (Unemploy) and the
independent variables are the age of the worker (Age), the number of years of education
received (Edu), the number of years at the previous job (Job Yr), a dummy variable for
marital status (Married: 1 = married, 0 = otherwise), a dummy variable for head of
household (Head: 1 = yes, 0 = no) and a dummy variable for management position
(Manager: 1 = yes, 0 = no). We shall call this Model 1. The coefficient of partial
determination ( ) of each of the 6 predictors are, respectively,
0.2807, 0.0386, 0.0317, 0.0141, 0.0958, and 0.1201.
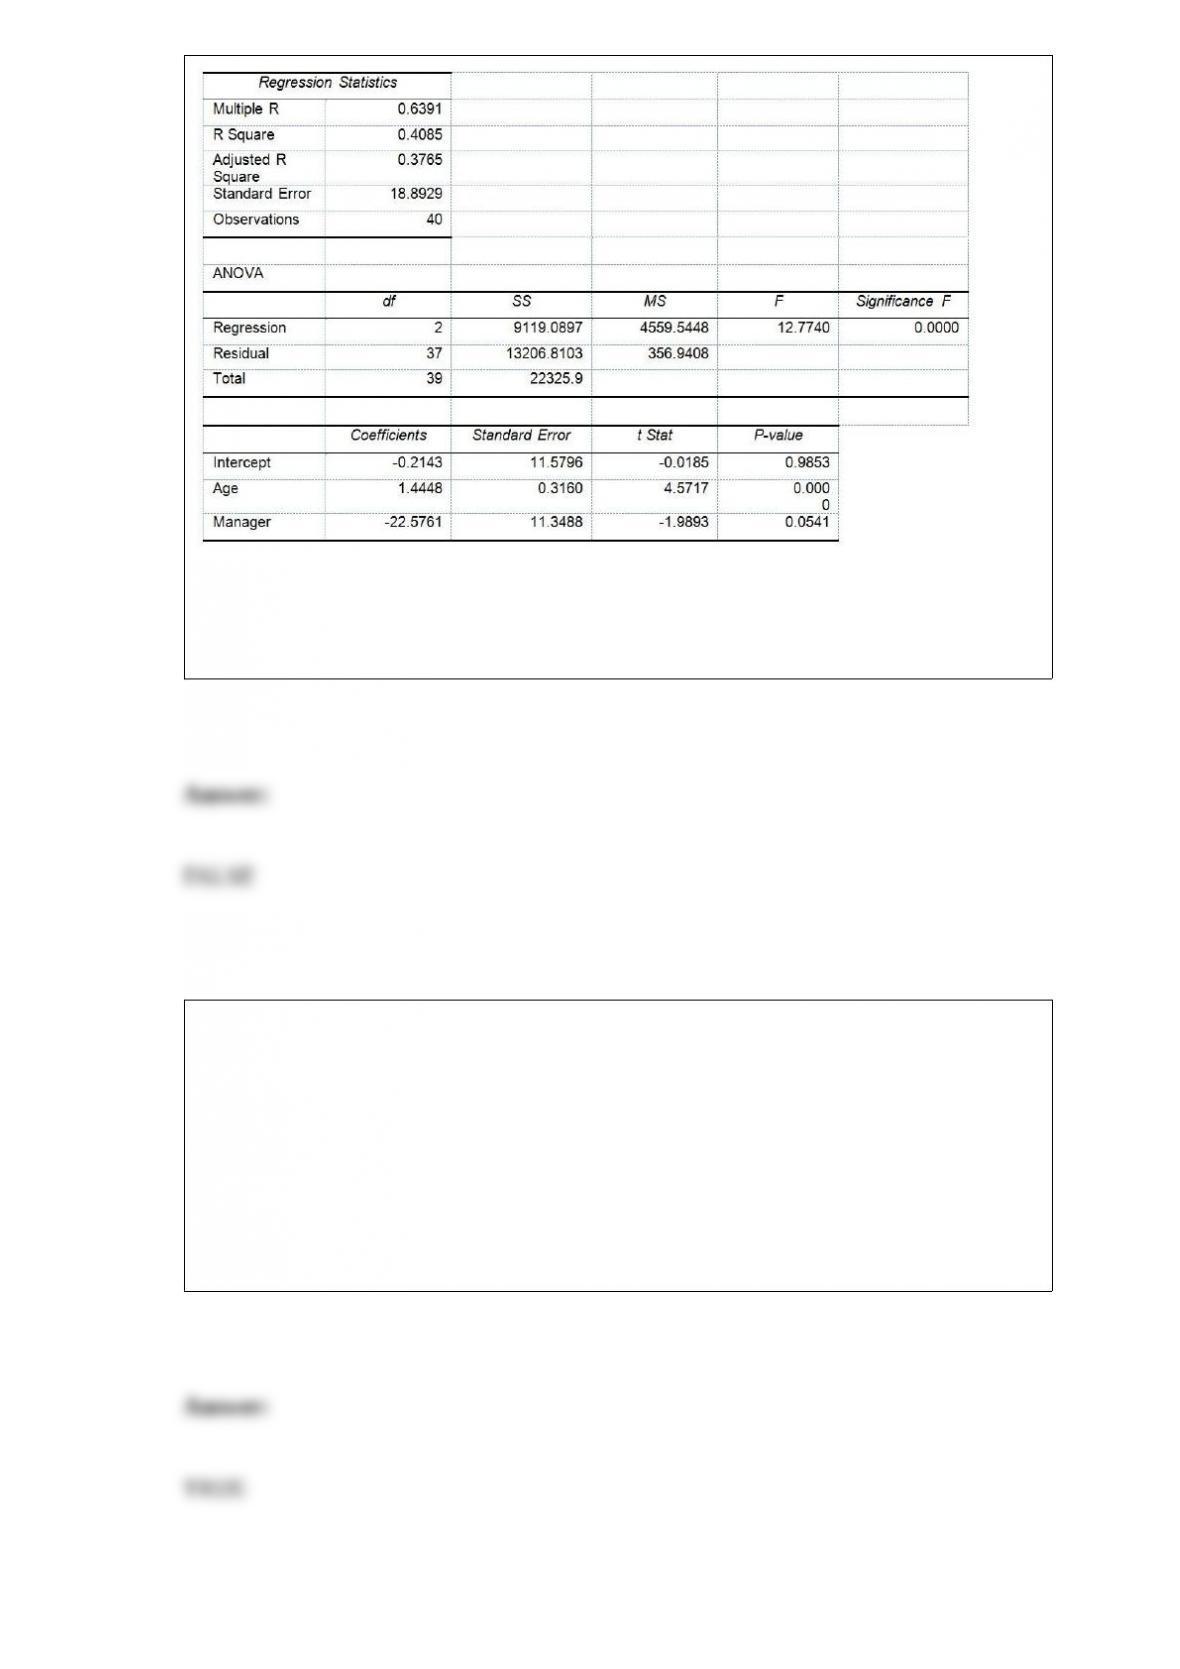
Model 2 is the regression analysis where the dependent variable is Unemploy and the
independent variables are Age and Manager. The results of the regression analysis are
given below:
Referring to Table 17-10, Model 1, there is sufficient evidence that being married or not
makes a difference in the mean number of weeks a worker is unemployed due to a
layoff while holding constant the effect of all the other independent variables at a 10%
level of significance.
TABLE 8-9
A university wanted to find out the percentage of students who felt comfortable
reporting cheating by their fellow students. A survey of 2,800 students was conducted
and the students were asked if they felt comfortable reporting cheating by their fellow
students. The results were 1,344 answered “Yes” and 1,456 answered “No.”
True or False: Referring to Table 8-9, a 90% confidence interval calculated from the
same data would be narrower than a 99% confidence interval.

TABLE 8-16
The president of a university is concerned that the percentage of students who have
cheated on an exam is higher than the 1% acceptable level. A confidential random
sample of 1,000 students from a population of 7,000 revealed that 6 of them said that
they had cheated on an exam during the last semester.
True or False: Referring to Table 8-16, the president can be 90% confident that no more
than 1% of the students at the university had cheated on an exam during the last
semester.
True or False: The squared difference between the observed and theoretical frequencies
should be large if there is no significant difference between the proportions.
True or False: TABLE 17-9
What are the factors that determine the acceleration time (in sec.) from 0 to 60 miles per
hour of a car? Data on the following variables for 171 different vehicle models were
collected:
Accel Time: Acceleration time in sec.
Cargo Vol: Cargo volume in cu. ft.
HP: Horsepower
MPG: Miles per gallon
SUV: 1 if the vehicle model is an SUV with Coupe as the base when SUV and Sedan
are both 0
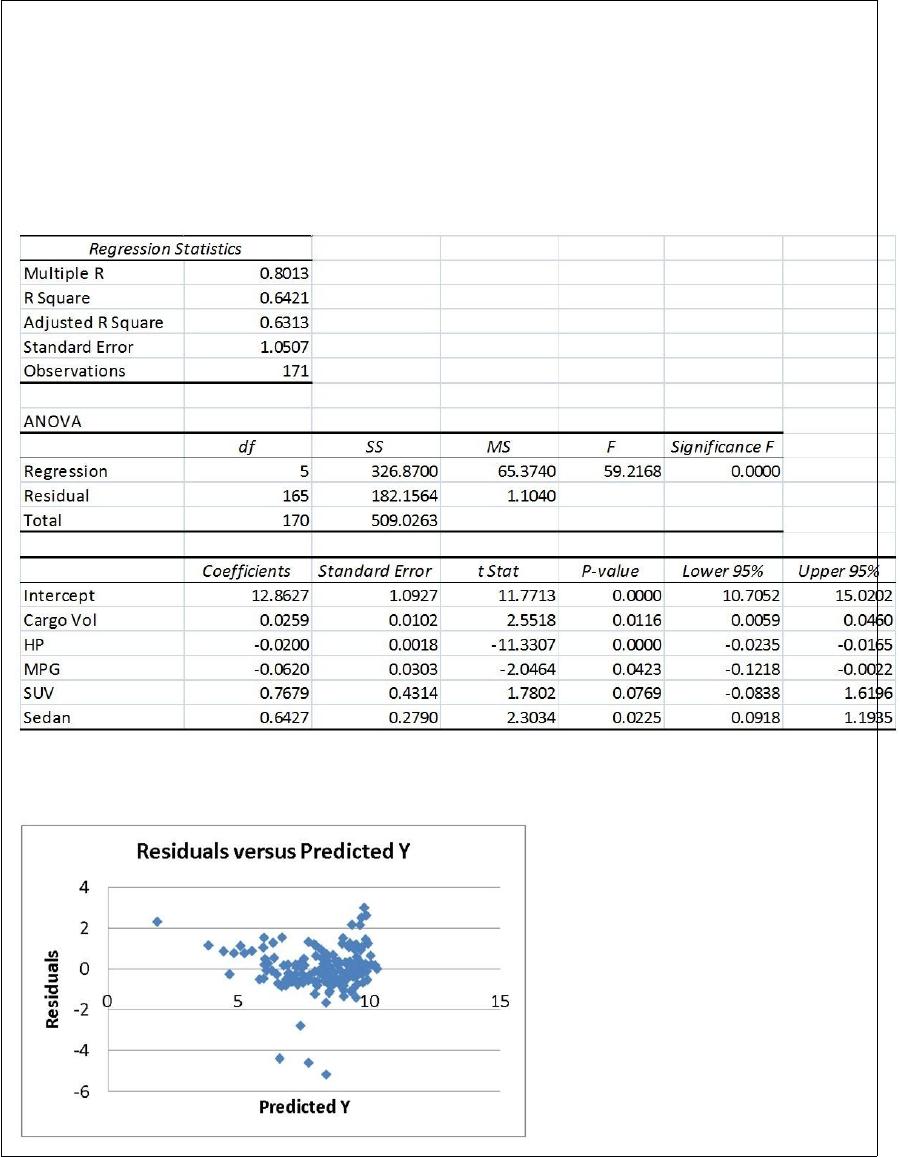
Sedan: 1 if the vehicle model is a sedan with Coupe as the base when SUV and Sedan
are both 0
The regression results using acceleration time as the dependent variable and the
remaining variables as the independent variables are presented below.
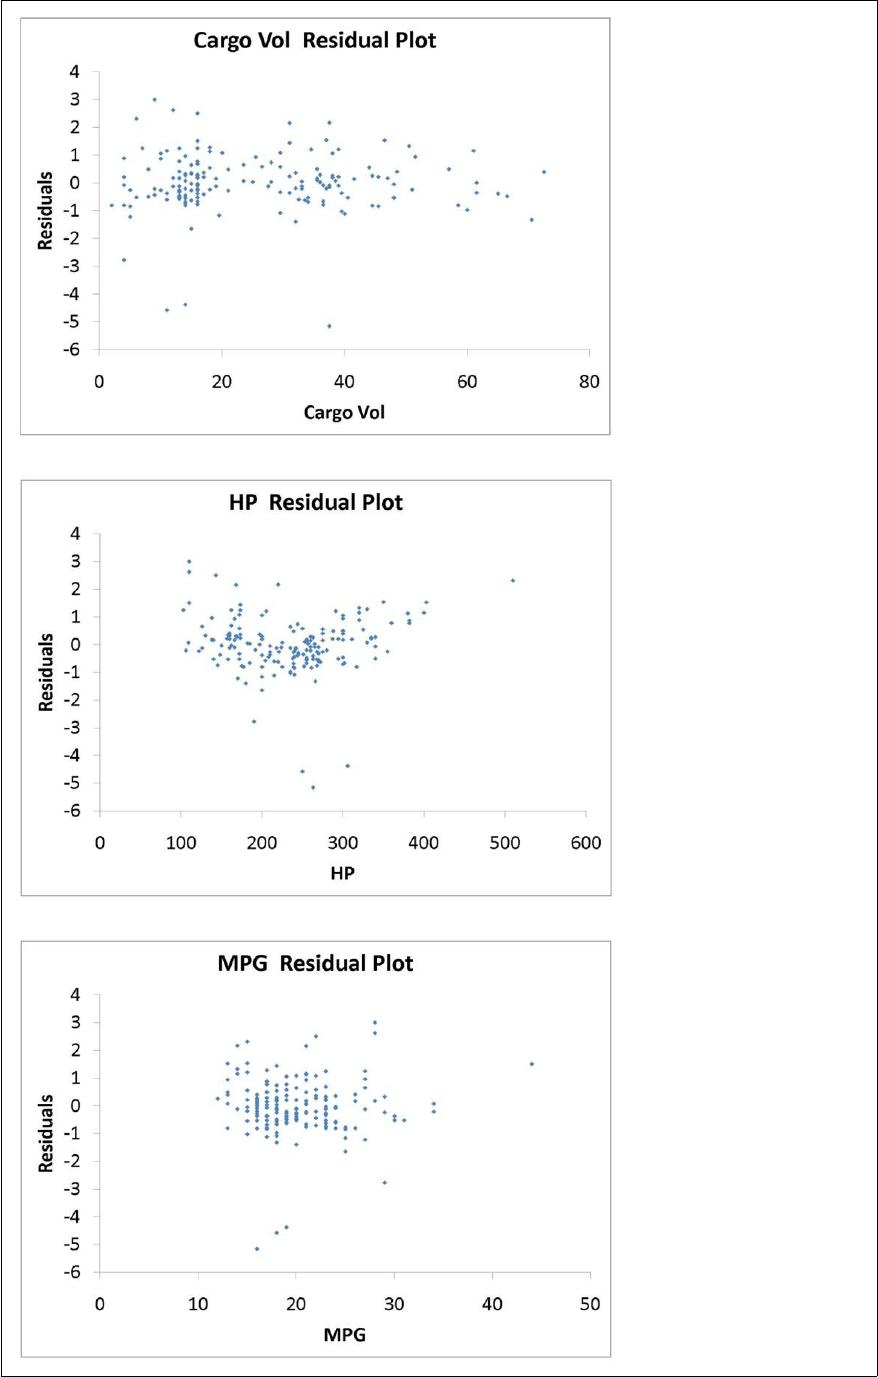
The various residual plots are as shown below.
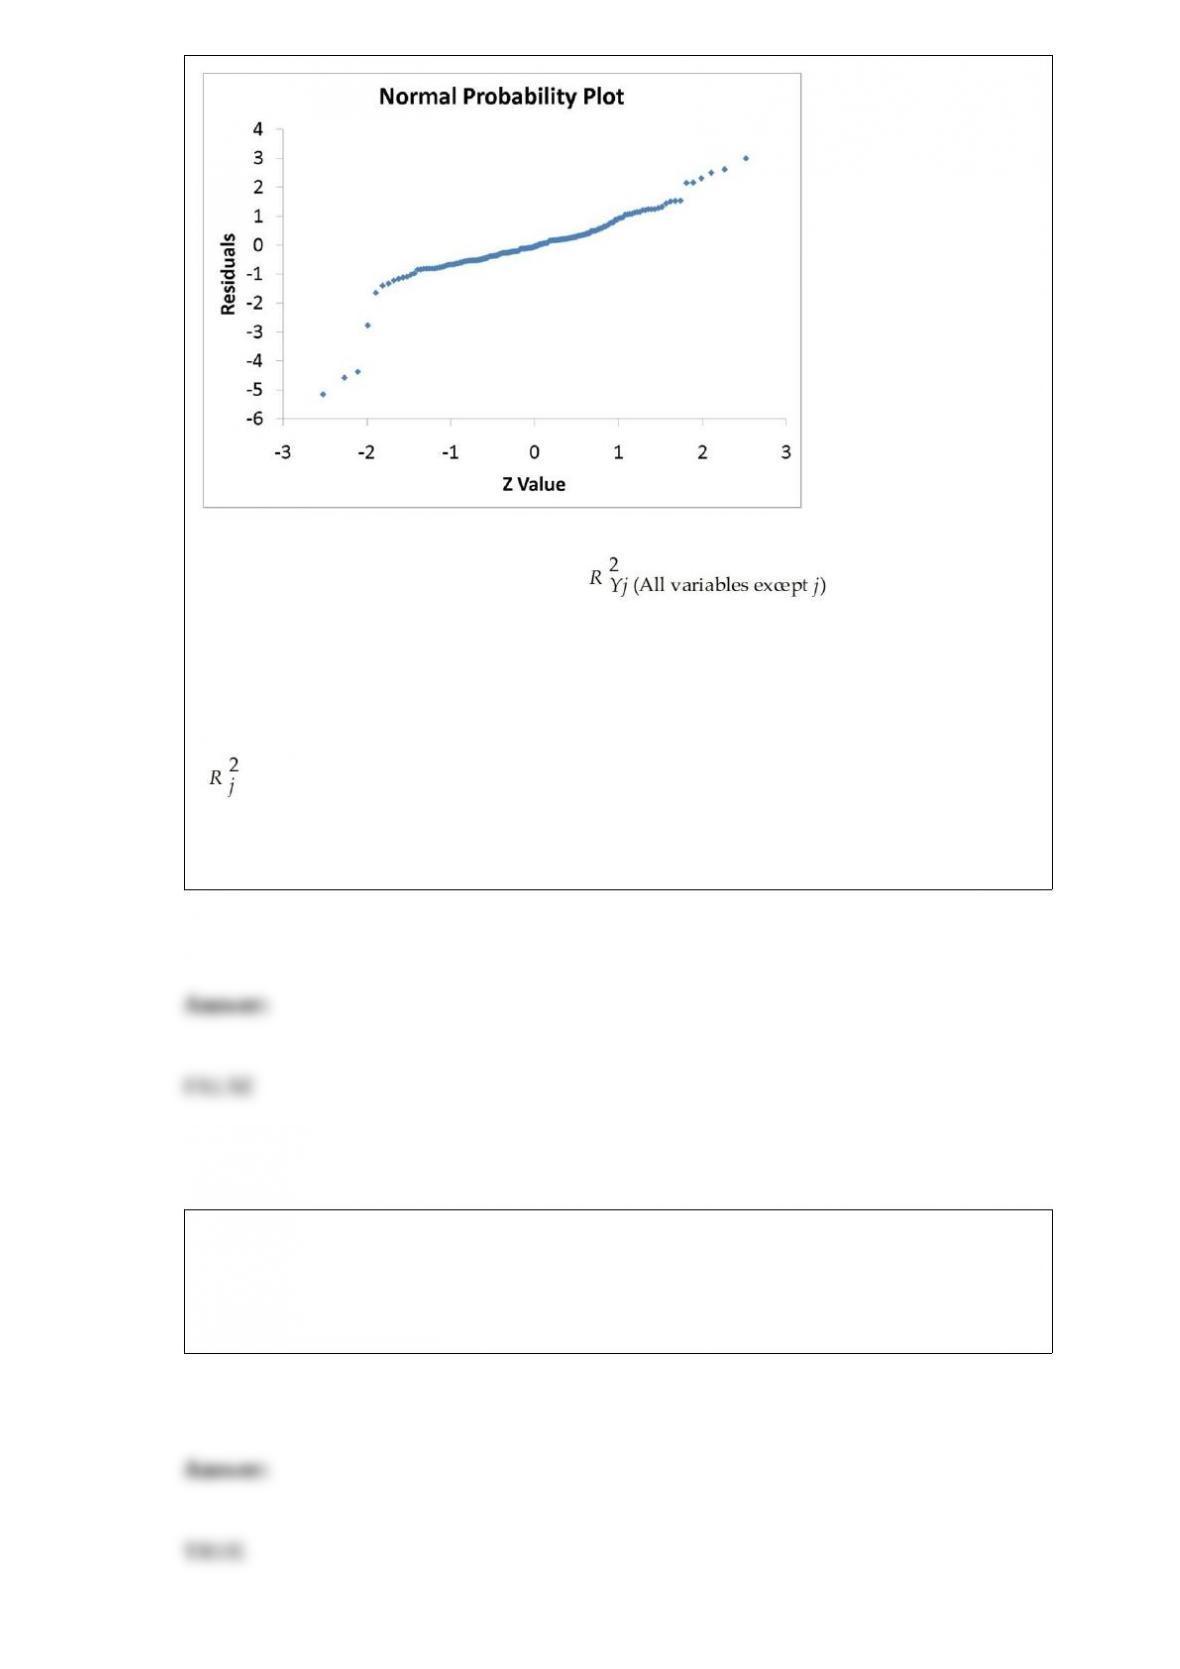
The coefficient of partial determination ( ) of each of the 5
predictors are, respectively, 0.0380, 0.4376, 0.0248, 0.0188, and 0.0312.
The coefficient of multiple determination for the regression model using each of the 5
variables Xj as the dependent variable and all other X variables as independent variables
( ) are, respectively, 0.7461, 0.5676, 0.6764, 0.8582, 0.6632.
Referring to Table 17-9, the errors (residuals) appear to be normally distributed.
True or False: The amount of bleach a machine pours into bottles has a mean of 36 oz.
with a standard deviation of 0.15 oz. Suppose we take a random sample of 36 bottles
filled by this machine. The sampling distribution of the sample mean has a mean of 36
oz.

TABLE 14-15
The superintendent of a school district wanted to predict the
percentage of students passing a sixth-grade proficiency test. She
obtained the data on percentage of students passing the proficiency
test (% Passing), mean teacher salary in thousands of dollars
(Salaries), and instructional spending per pupil in thousands of dollars
(Spending) of 47 schools in the state.
Following is the multiple regression output with Y = % Passing as the
dependent variable, X1 = Salaries and X2 = Spending:
True or False: Referring to Table 14-15, the null hypothesis H0 : β1 =
β2 = 0 implies that percentage of students passing the proficiency
test is not a.ected by either of the explanatory variables.
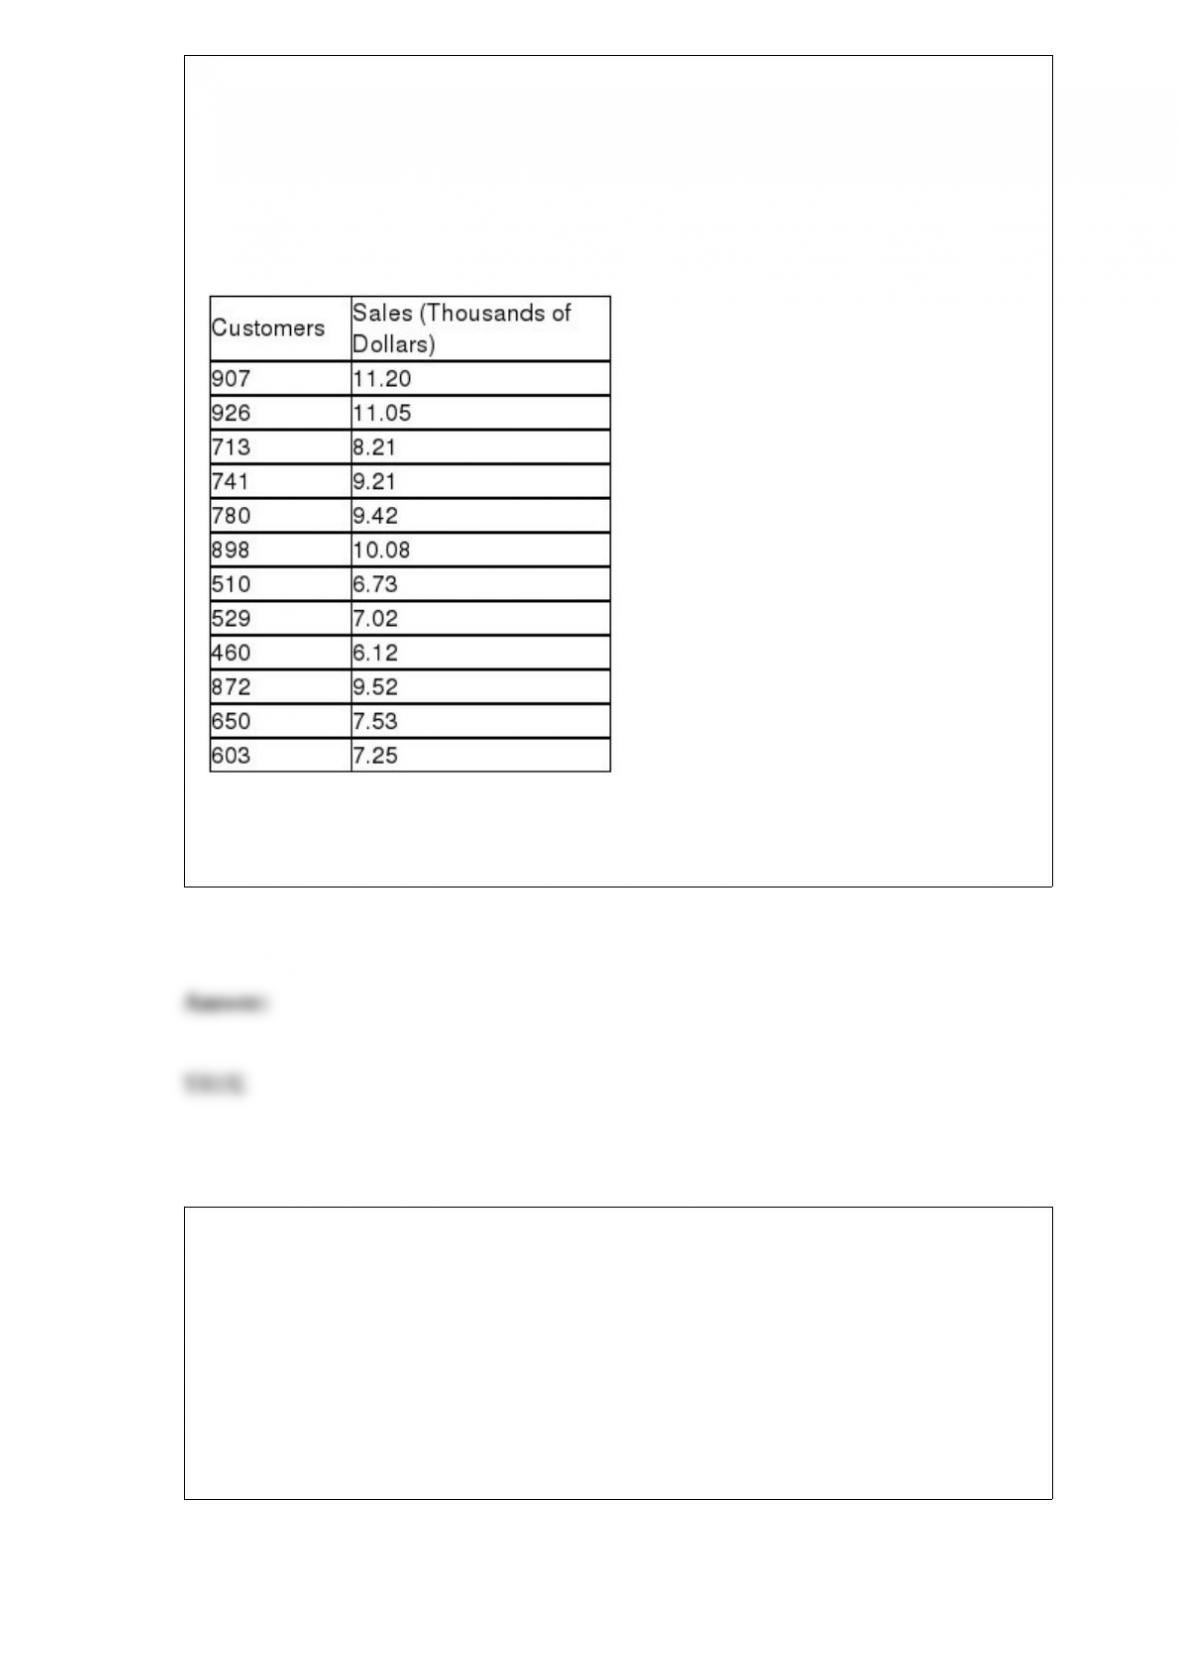
TABLE 13-10
The management of a chain electronic store would like to develop a model for
predicting the weekly sales (in thousands of dollars) for individual stores based on the
number of customers who made purchases. A random sample of 12 stores yields the
following results:
True or False: Referring to Table 13-10, the mean weekly sales will increase by an
estimated $10 for each additional purchasing customer.
TABLE 8-15
The president of a university is concerned that illicit drug use on campus is higher than
the 5% targeted level. A random sample of 250 students from a population of 2,000
revealed that 7 of them had used illicit drugs during the last 12 months.
True or False: Referring to Table 8-15, using the 90% one-sided confidence interval, the
president can be 95% confident that no more than 5% of the students at the university
had used illicit drugs during the last 12 months.

True or False: The larger the p-value, the more likely you are to reject the null
hypothesis.
Referring to Table 14-18, which of the following is the correct
expression for the estimated model?
TABLE 14-18
A logistic regression model was estimated in order to predict the
probability that a randomly chosen university or college would be a
private university using information on mean total Scholastic Aptitude
Test score (SAT) at the university or college and whether the TOEFL
criterion is at least 90 (Toe90 = 1 if yes, 0 otherwise). The
dependent variable, Y, is school type (Type = 1 if private and 0
otherwise).
The PHStat output is given below:
A) Y = -3.9594 + 0.0028 SAT + 0.1928 Toe90
B) = -3.9594 + 0.0028 SAT + 0.1928 Toe90

C) ln (odds ratio) = -3.9594 + 0.0028 SAT + 0.1928 Toe90
D) ln (estimated odds ratio) = -3.9594 + 0.0028 SAT + 0.1928
Toe90
The head librarian at the Library of Congress has asked her assistant for an interval
estimate of the mean number of books checked out each day. The assistant provides the
following interval estimate: from 740 to 920 books per day. What is an efficient,
unbiased point estimate of the number of books checked out each day at the Library of
Congress?
A) 740
B) 830
C) 920
D) 1,660
As an aid to the establishment of personnel requirements, the director of a hospital
wishes to estimate the mean number of people who are admitted to the emergency room
during a 24-hour period. The director randomly selects 64 different 24-hour periods and
determines the number of admissions for each. For this sample, = 396 and S = 100.
Which of the following assumptions is necessary in order for a confidence interval to be
valid?
A) The population sampled from has an approximate normal distribution.
B) The population sampled from has an approximate t distribution.
C) The mean of the sample equals the mean of the population.
D) None of these assumptions are necessary.
The coefficient of multiple determination
A) measures the variation around the predicted regression equation.
B) measures the proportion of variation in Y that is explained by X1 and X2.
C) measures the proportion of variation in Y that is explained by X1 holding X2
constant.
D) will have the same sign as b1.
An insurance company evaluates many variables about a person before deciding on an
appropriate rate for automobile insurance. A representative from a local insurance
agency selected a random sample of 15 insured drivers and recorded the amount of
claims each made in the last 3 years. Based on this information, which of the following
will you construct to learn about the mean amount of claims made by the company’s
customer?
A) Confidence interval estimate for the mean using the standard normal distribution
B) Confidence interval estimate for the mean using the Student’s t distribution
C) Confidence interval estimate for the proportion using the standard normal
distribution
D) Confidence interval estimate for the difference between two means using the
standard normal distribution

A certain type of rare gem serves as a status symbol for many of its owners. In theory,
for low prices, the demand increases and it decreases as the price of the gem increases.
However, experts hypothesize that when the gem is valued at very high prices, the
demand increases with price due to the status owners believe they gain in obtaining the
gem. Data on price and quantity sold were collected for a sample of 35 rare gems of this
type. Which of the following would be the most appropriate analysis to perform?
A) Quadratic regression model
B) Exponential smoothing
C) Autoregressive modeling for trend fitting and forecasting
D) Least-squares forecasting with monthly or quarterly data
An airline wants to select a computer software package for its reservation system. Four
software packages (1, 2, 3, and 4) are commercially available. The airline will choose
the package that bumps as few passengers, on the average, as possible during a month.
An experiment is set up in which each package is used to make reservations for 5
randomly selected weeks. (A total of 20 weeks was included in the experiment.) Which
of the following tests will be the most appropriate?
A) Paired t test
B) Wilcoxon rank sum test
C) McNemar test
D) Tukey-Kramer multiple comparisons procedure for one-way ANOVA
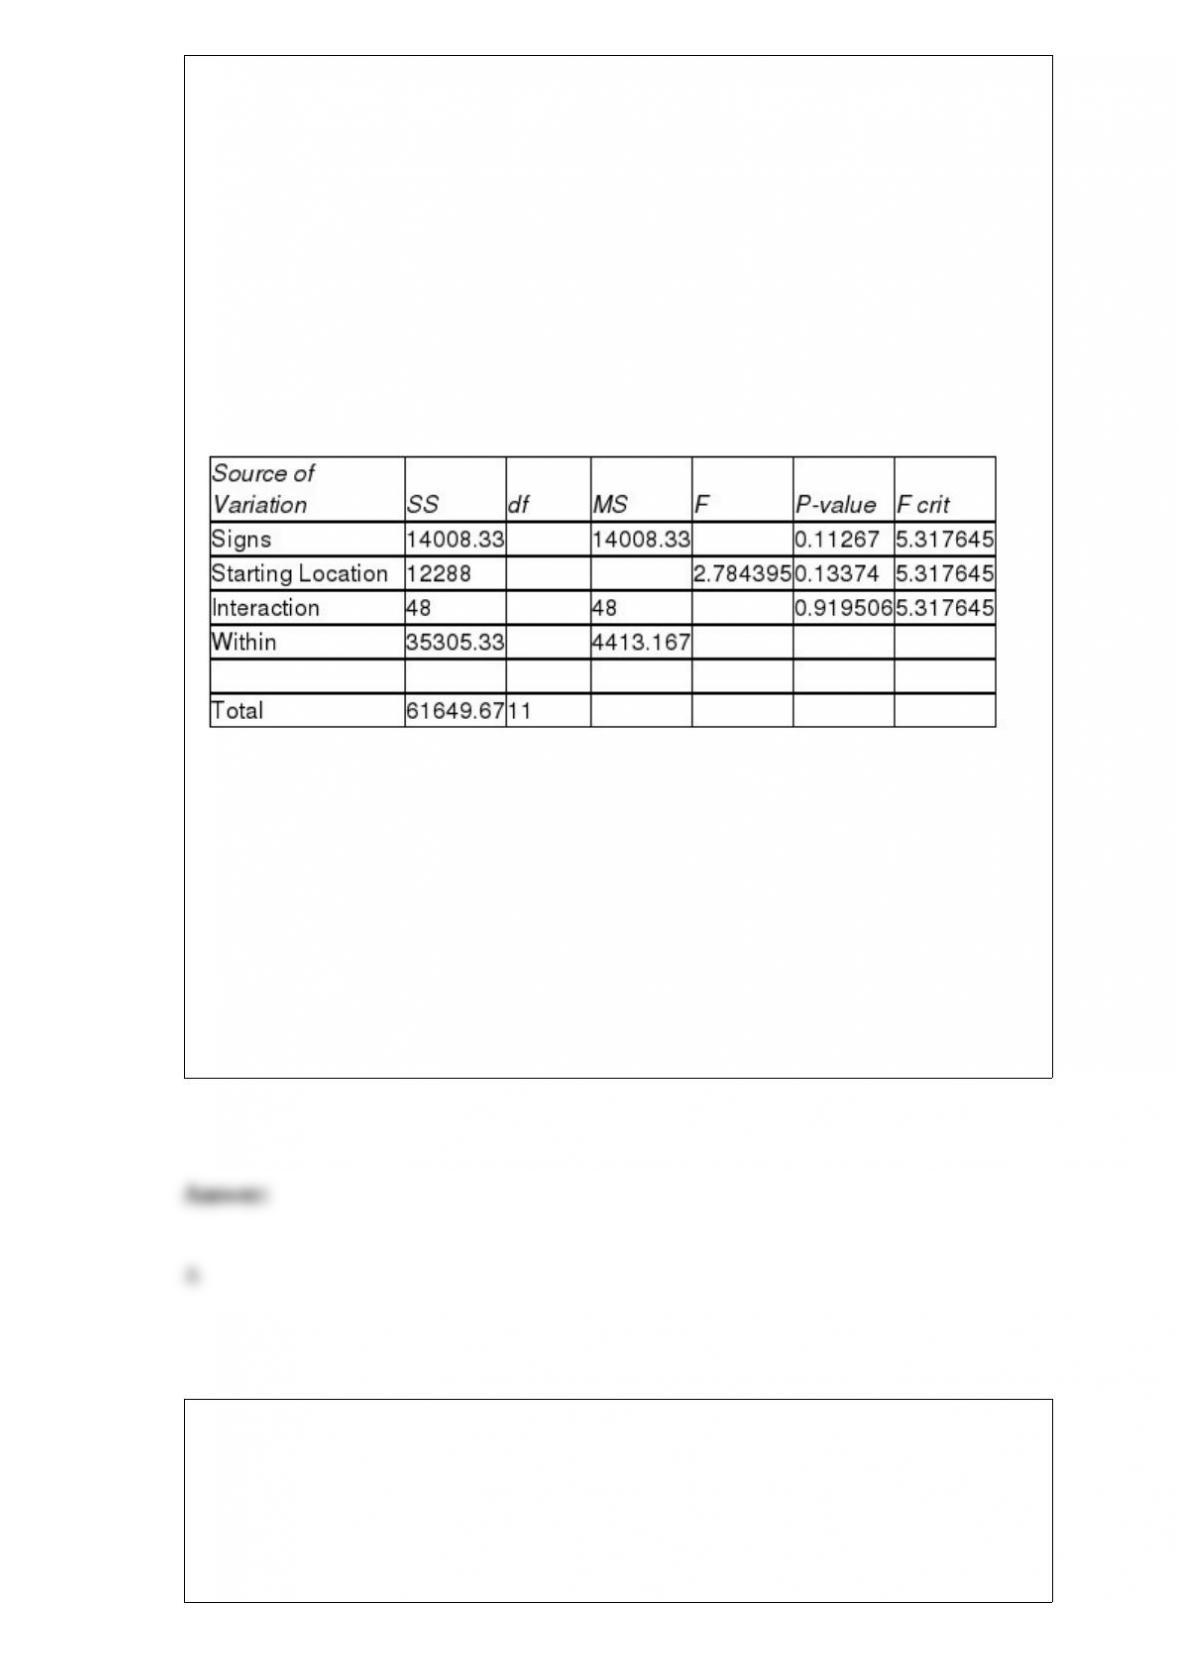
TABLE 11-7
A campus researcher wanted to investigate the factors that affect visitor travel time in a
complex, multilevel building on campus. Specifically, he wanted to determine whether
different building signs (building maps versus wall signage) affect the total amount of
time visitors require to reach their destination and whether that time depends on
whether the starting location is inside or outside the building. Three subjects were
assigned to each of the combinations of signs and starting locations, and travel time in
seconds from beginning to destination was recorded. An Excel output of the appropriate
analysis is given below:
ANOVA
Referring to Table 11-7, the degrees of freedom for the different building signs (factor
A) is
A) 1.
B) 2.
C) 3.
D) 8.
TABLE 13-2
A candy bar manufacturer is interested in trying to estimate how sales are influenced by
the price of their product. To do this, the company randomly chooses 6 small cities and
offers the candy bar at different prices. Using candy bar sales as the dependent variable,
the company will conduct a simple linear regression on the data below:

Referring to Table 13-2, to test whether a change in price will have any impact on sales,
what would be the critical values? Use = 0.05.
A) 2.5706
B) 2.7765
C) 3.1634
D) 3.4954
An airline wants to select a computer software package for its reservation system. Four
software packages (1, 2, 3, and 4) are commercially available. An experiment is set up
in which each package is used to make reservations for 5 randomly selected weeks and
data on the number of passengers that are bumped over a month are collected. (A total
of 20 weeks was included in the experiment.) The variability of the number of
passengers that are bumped is found to be roughly the same for the 4 packages. The
distribution on the number of passengers that are bumped has been found out to be
right-skewed for package 1 and 4, left-skewed for package 2 and normal for package 3.
Which of the following tests will be the most appropriate to find out if the mean
number of passengers being bumped over a month is the same across the 4 packages?
A) Paired t test
B) Pooled-variance t test
C) One-way ANOVA F test for differences among more than two means
D) Kruskal-Wallis rank test
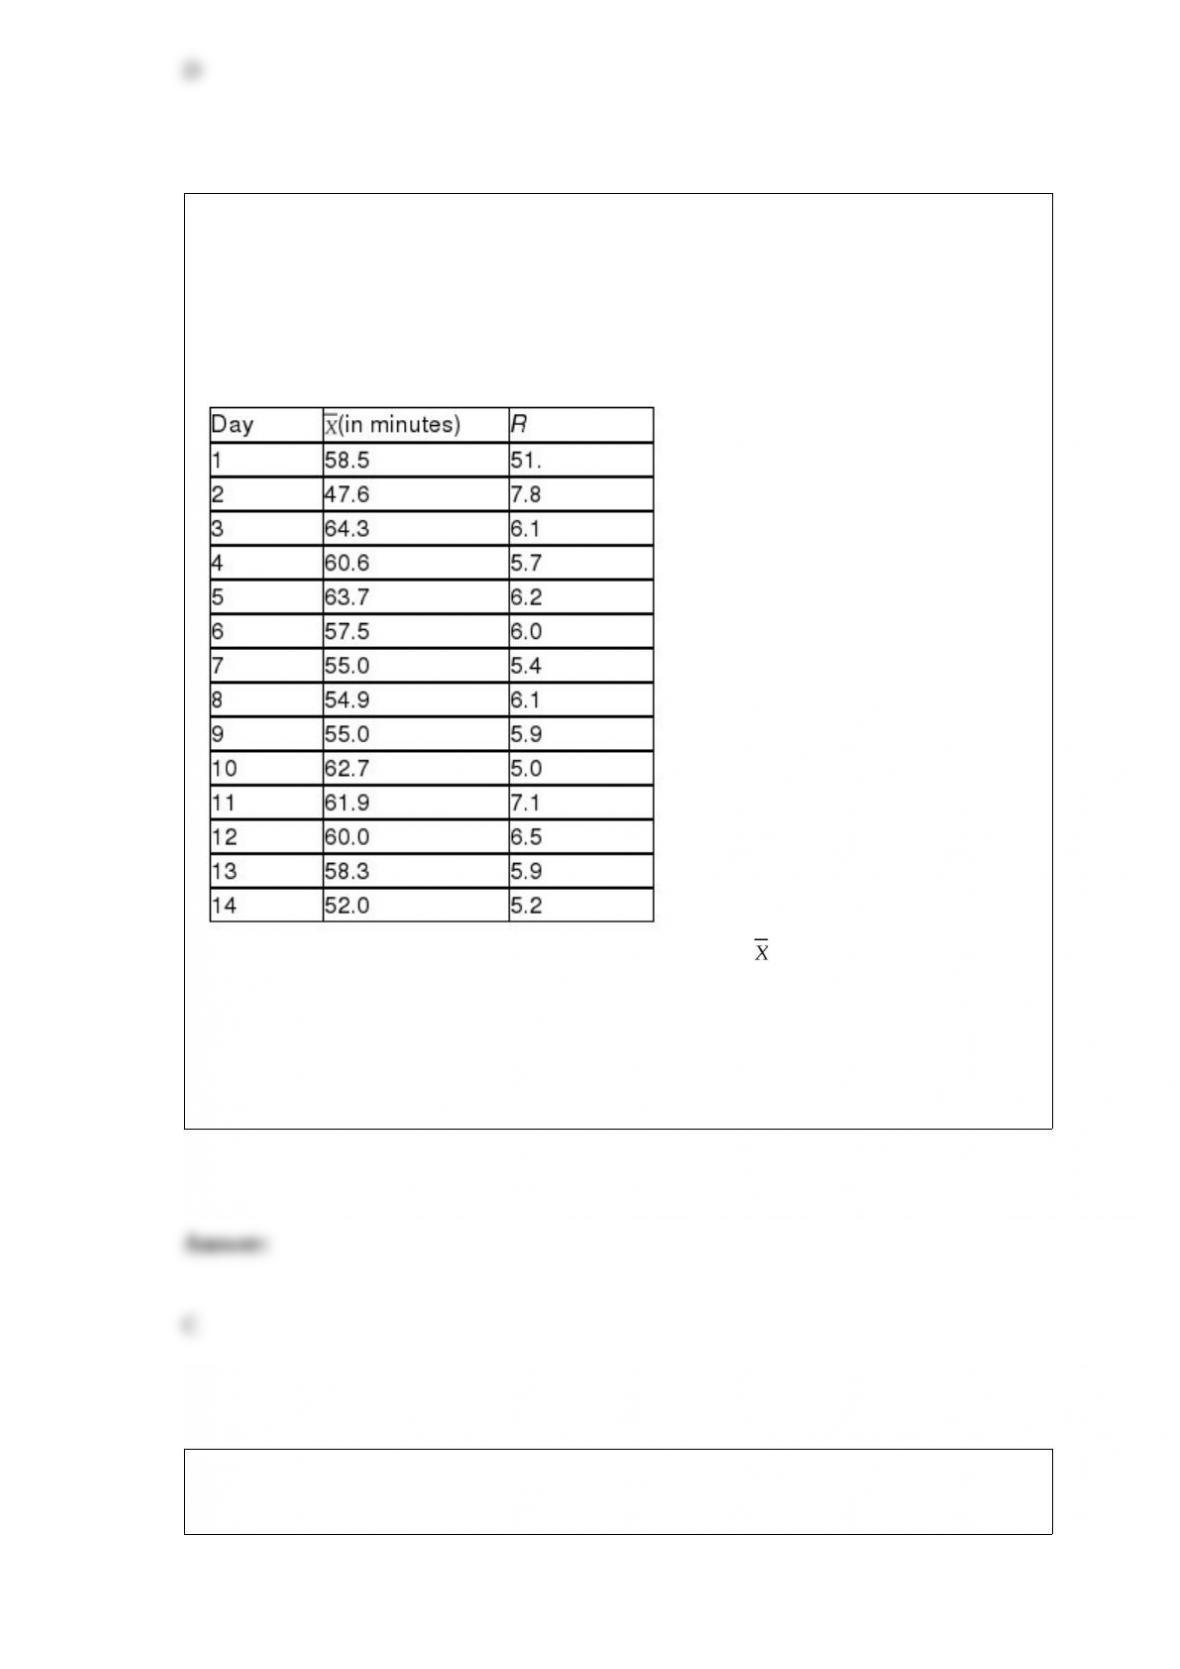
TABLE 18-3
A quality control analyst for a light bulb manufacturer is concerned that the time it takes
to produce a batch of light bulbs is too erratic. Accordingly, the analyst randomly
surveys 10 production periods each day for 14 days and records the sample mean and
range for each day.
Referring to Table 18-3, suppose the analyst constructs an chart to see if the
production process is in-control. What is the upper control limit (UCL) for this chart?
A) 62.15
B) 60.95
C) 59.85
D) 58.75
True or False: Faculty rank (professor to lecturer) is an example of discrete numerical
data.

Which of the following yields a simple random sample?
A) All students in a class are divided into groups of 15. One student is randomly chosen
from the 1st group, the remaining observations are every 15th student thereafter.
B) The best 15 students, according to the opinion of the instructor, in a class are
selected.
C) The names of 50 students in a class are written on 50 different pieces of paper and
put in a hat. The first 15 pieces of paper are selected blindly one at a time without
replacing them back in the hat after shuffling the papers thoroughly.
D) All students in a class are divided into groups according to the rows that they are
seated. One of the groups is randomly selected.
Referring to Table 14-11, what null hypothesis would you test to
determine whether the slope of the linear relationship between
weight loss (Y) and time on the program (X1) varies according to time
of session?
TABLE 14-11
A weight-loss clinic wants to use regression analysis to build a model
for weight loss of a client (measured in pounds). Two variables
thought to a.ect weight loss are client’s length of time on the
weight-loss program and time of session. These variables are
described below:
Y = Weight loss (in pounds)
X1 = Length of time in weight-loss program (in months)
X2 = 1 if morning session, 0 if not
Data for 25 clients on a weight-loss program at the clinic were

collected and used to fit the interaction model:
Y = β0 + β1X1 + β2X2 + β3X1X2 + ε
Output from Microsoft Excel follows:
A) H0 : β1 = 0
B) H0 : β2 = 0
C) H0 : β3 = 0
D) H0 : β1 = β2 = 0
True or False: Student grades (A to F) are an example of continuous numerical data.
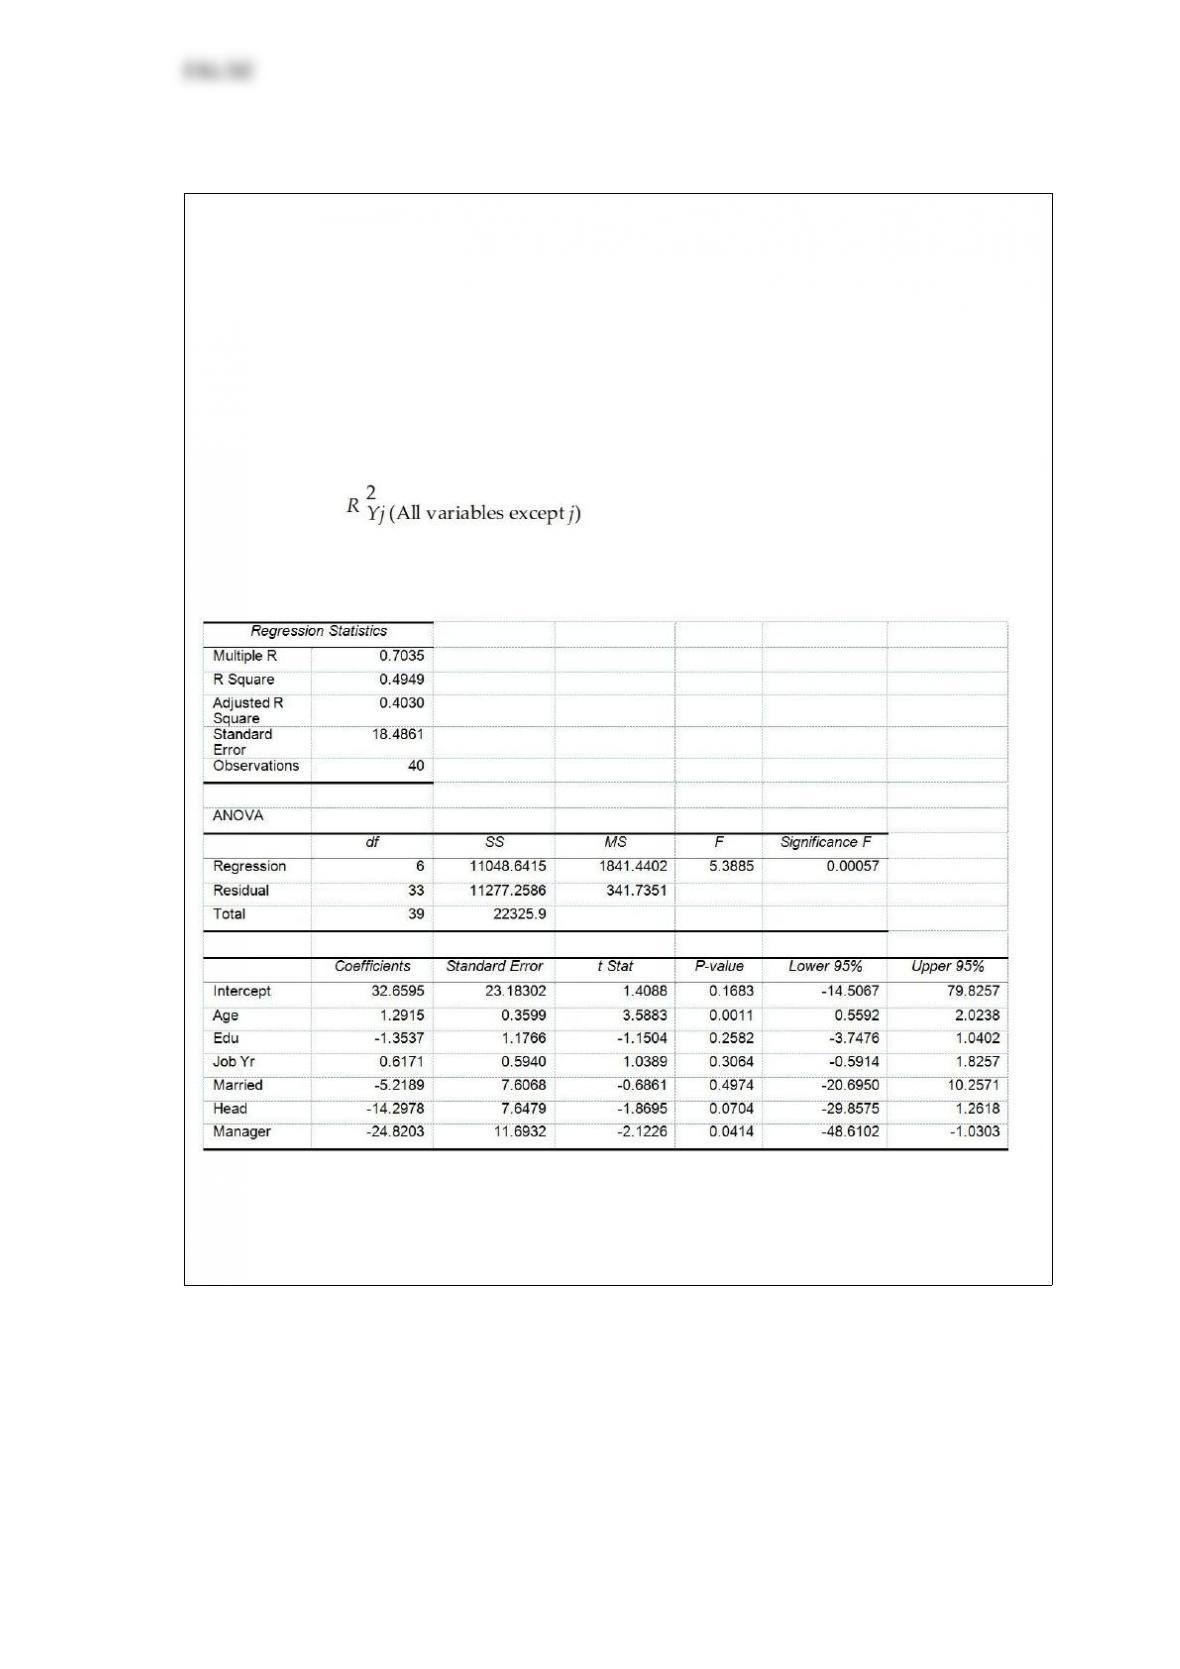
TABLE 17-10
Given below are results from the regression analysis where the dependent variable is
the number of weeks a worker is unemployed due to a layoff (Unemploy) and the
independent variables are the age of the worker (Age), the number of years of education
received (Edu), the number of years at the previous job (Job Yr), a dummy variable for
marital status (Married: 1 = married, 0 = otherwise), a dummy variable for head of
household (Head: 1 = yes, 0 = no) and a dummy variable for management position
(Manager: 1 = yes, 0 = no). We shall call this Model 1. The coefficient of partial
determination ( ) of each of the 6 predictors are, respectively,
0.2807, 0.0386, 0.0317, 0.0141, 0.0958, and 0.1201.
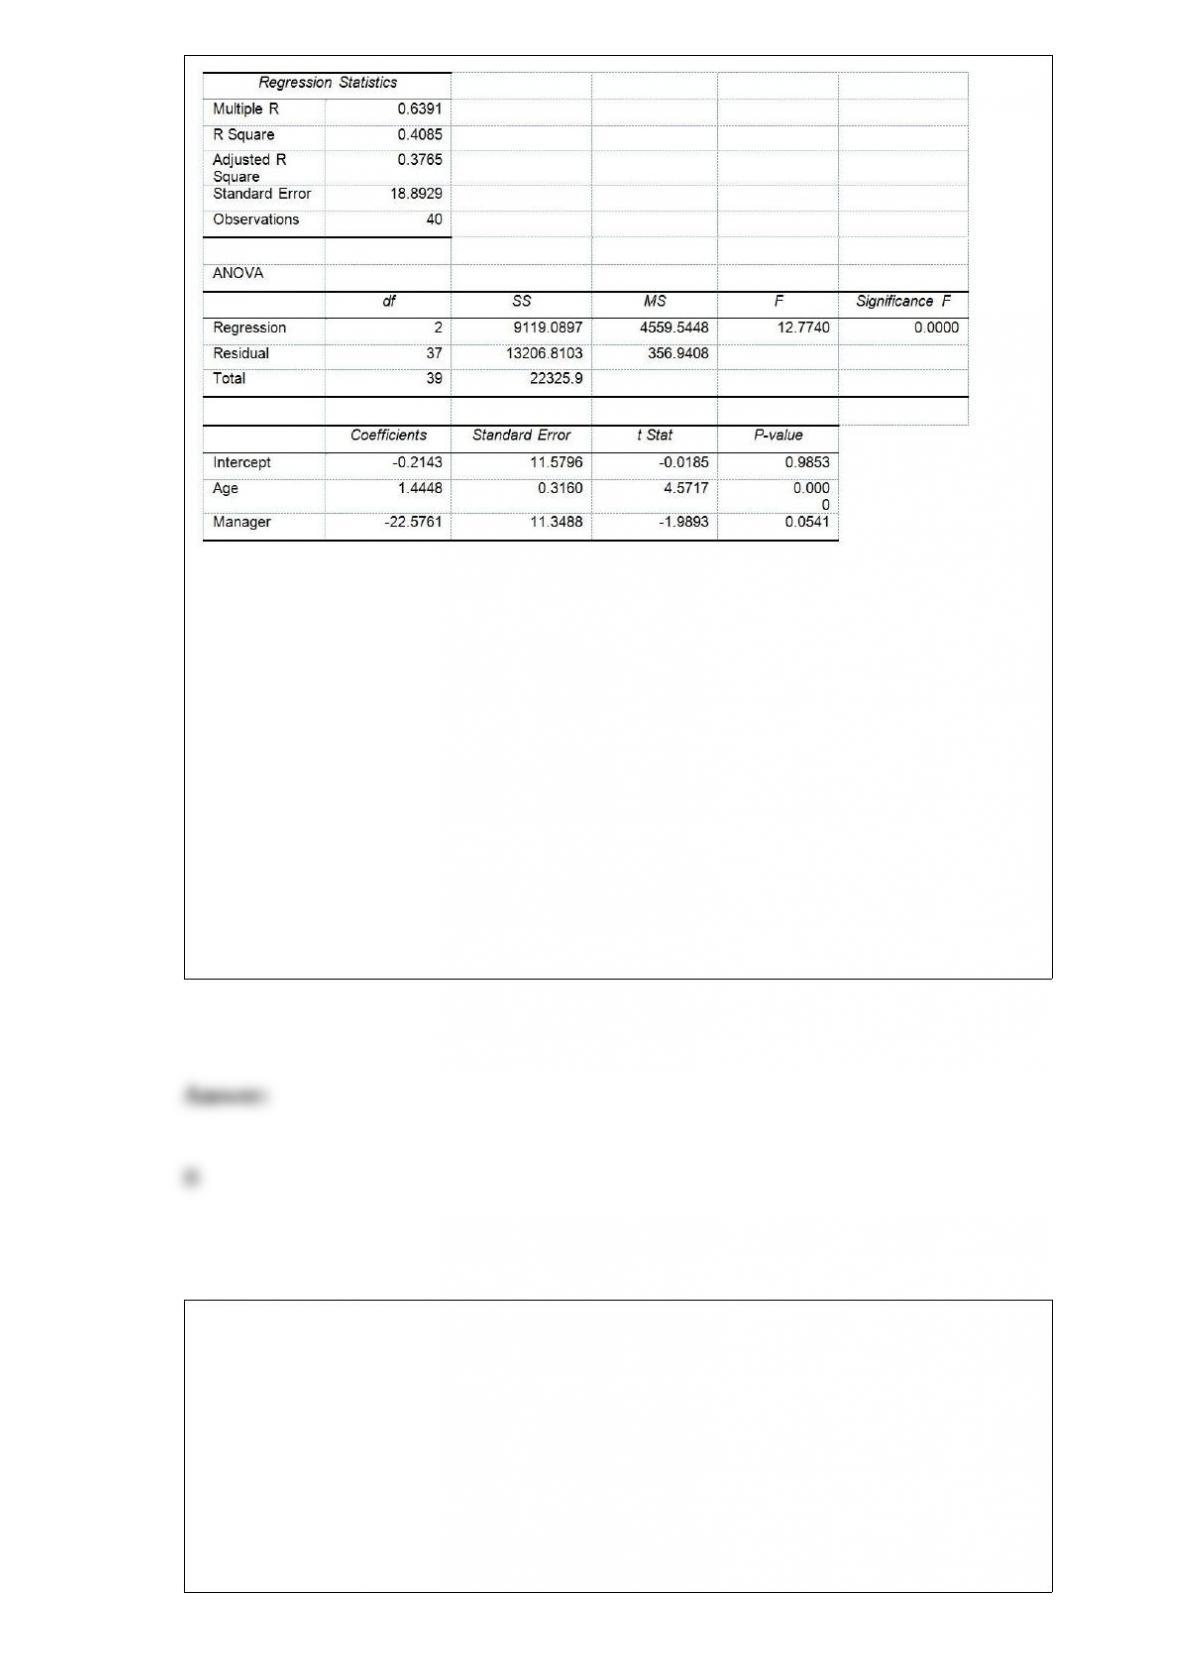
Model 2 is the regression analysis where the dependent variable is Unemploy and the
independent variables are Age and Manager. The results of the regression analysis are
given below:
Referring to Table 17-10, Model 1, which of the following is the correct alternative
hypothesis to test whether age has any effect on the number of weeks a worker is
unemployed due to a layoff while holding constant the effect of all the other
independent variables?
A) H1 : β0 ≠0
B) H1 : β1 ≠0
C) H1 : β2 ≠0
D) H1 : β3 ≠0
TABLE 3-3
The ordered array below represents the number of vitamin supplements sold by a health
food store in a sample of 16 days.
19, 19, 20, 20, 22, 23, 25, 26, 27, 30, 33, 34, 35, 36, 38, 41
Note: For this sample, the sum of the values is 448, and the sum of the squared
differences between each value and the mean is 812.

Referring to Table 3-3, is the number of vitamin supplements sold in this sample
lepokurtic or platykurtic?
Referring to Table 14-8, the predicted salary (in $1,000) for a
35-year-old person with 10 years of experience is ________.TABLE 14-8
A financial analyst wanted to examine the relationship between salary
(in $1,000) and 2 variables: age
(X1 = Age) and experience in the field (X2 = Exper). He took a sample
of 20 employees and obtained the following Microsoft Excel output:
Also, the sum of squares due to the regression for the model that
includes only Age is 5022.0654 while the sum of squares due to the
regression for the model that includes only Exper is 125.9848.
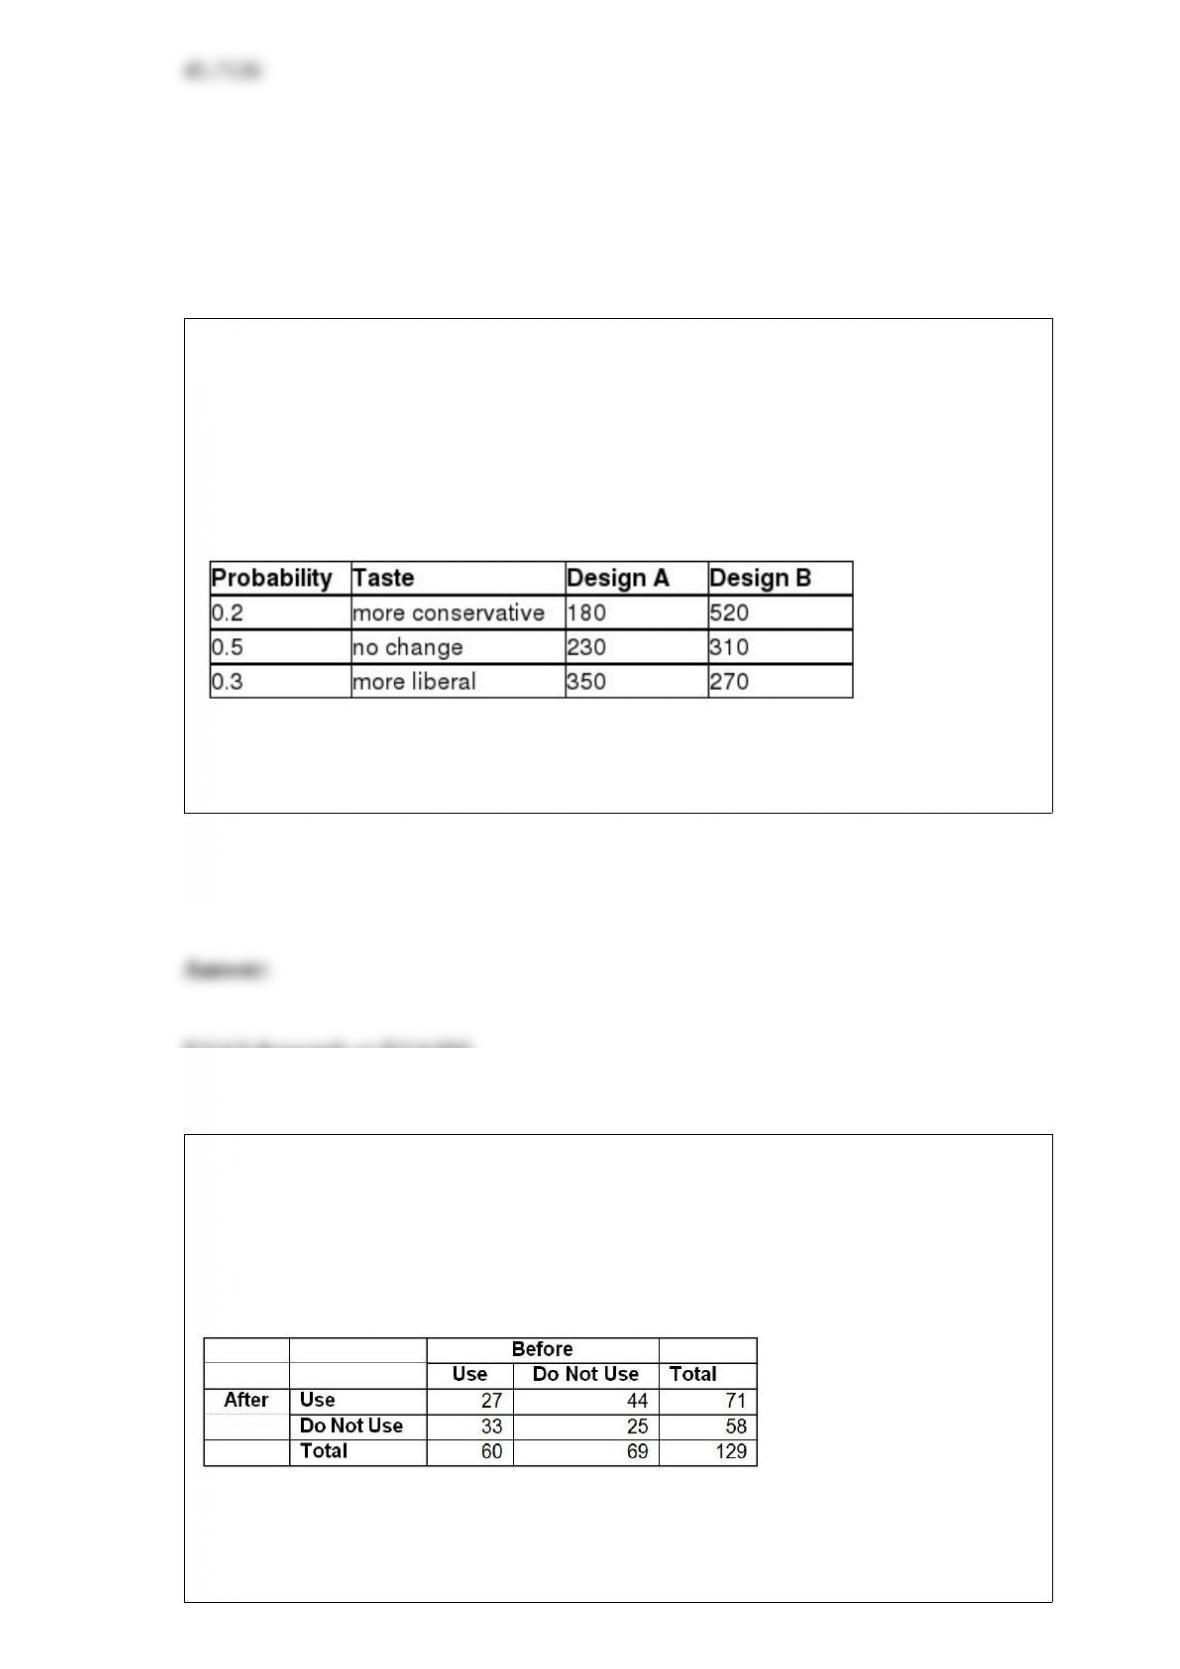
TABLE 5-8
Two different designs on a new line of winter jackets for the coming winter are
available for your manufacturing plants. Your profit (in thousands of dollars) will
depend on the taste of the consumers when winter arrives. The probability of the three
possible different tastes of the consumers and the corresponding profits are presented in
the following table.
Referring to Table 5-8, if you decide to choose Design A for 30% of the production
lines and Design B for the remaining production lines, what is the expected profit?
TABLE 12-18
The director of transportation of a large company is interested in the usage of the
company’s van pool program. She surveyed 129 of her employees on the usage of the
program before and after a campaign to convince her employees to use the service and
obtained the following:
She will use this information to perform a test using a level of significance of 0.05.
Referring to Table 12-18, the director now wants to know if the proportion of

employees who use the service before the campaign and the proportion of employees
who use the service after the campaign are the same. What is the value of the test
statistic using a 5% level of significance?
TABLE 5-9
A major hotel chain keeps a record of the number of mishandled bags per 1,000
customers. In a recent year, the hotel chain had 4.06 mishandled bags per 1,000
customers. Assume that the number of mishandled bags has a Poisson distribution.
Referring to Table 5-9, what is the probability that in the next 1,000 customers, the
hotel chain will have between two and four inclusive mishandled bags?
TABLE 12-15
Two new different models of compact SUVs have just arrived at the market. You are
interested in comparing the gas mileage performance of both models to see if they are
the same. A partial computer output for twelve compact SUVs of model 1 and thirteen
of model 2 is given below:
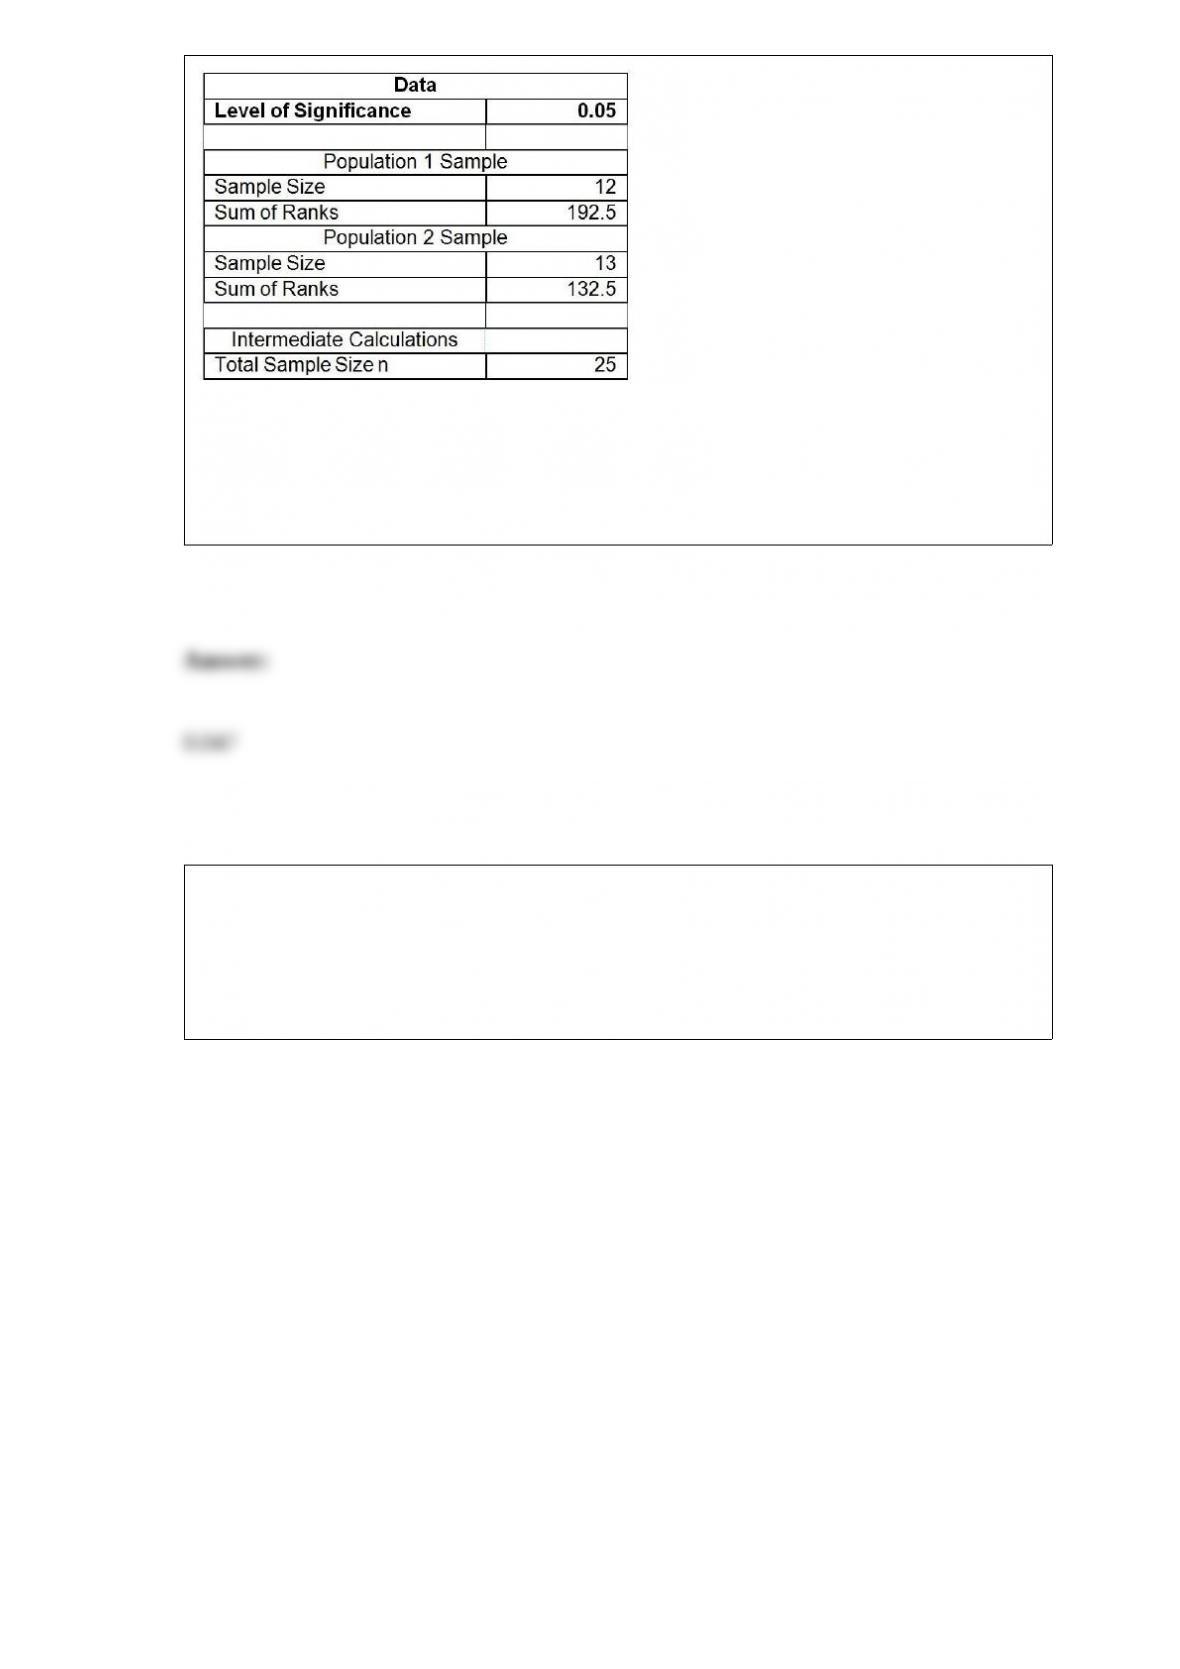
You are told that the gas mileage population distributions for both models are not
normally distributed.
Referring to Table 12-15, what is the p-value of the test statistic?
TABLE 18-7
A supplier of silicone sheets for producers of computer chips wants to evaluate her
manufacturing process. She takes sample sizes of 5 from each day’s output and counts
the number of blemishes on each silicone sheet. The results from 20 days of such
evaluations are presented below.
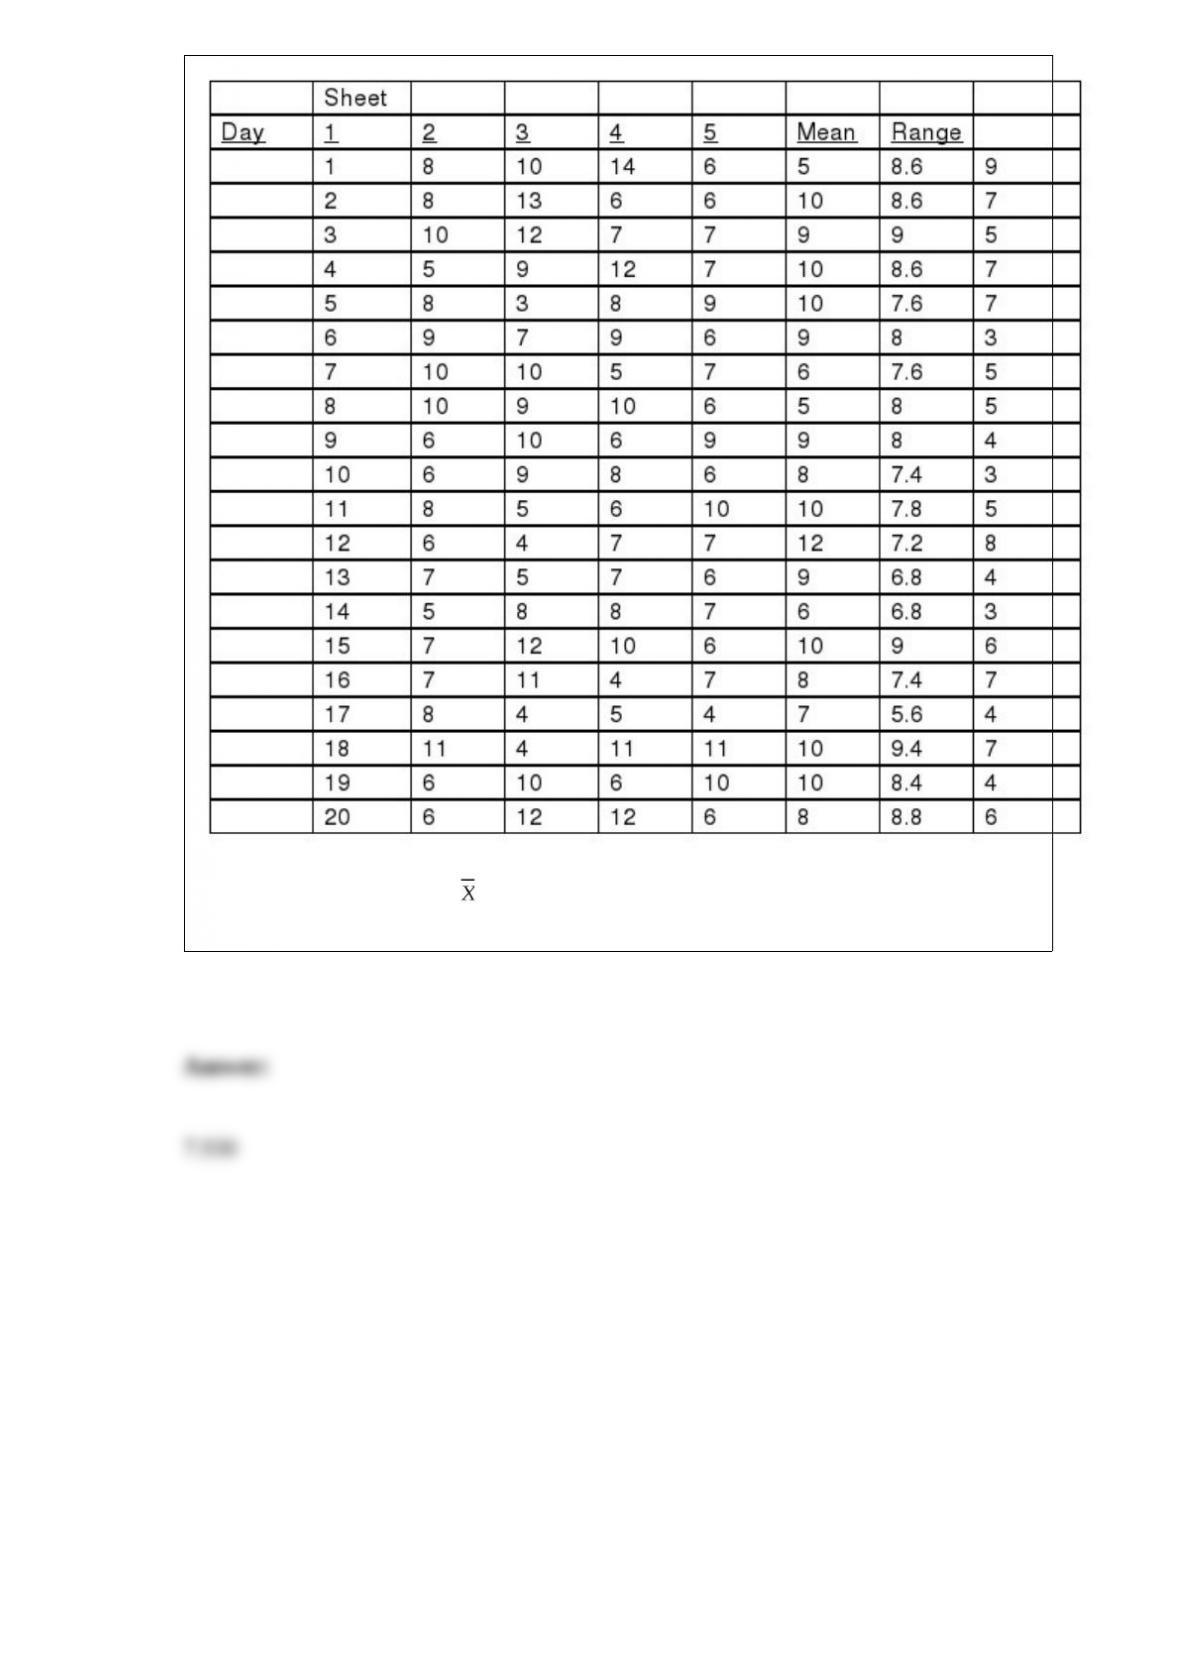
She also decides that the upper specification limit is 10 blemishes.
Referring to Table 18-7, an chart is to be used for the number of blemishes. The
center line of this chart is located at ________.