TABLE 17-11
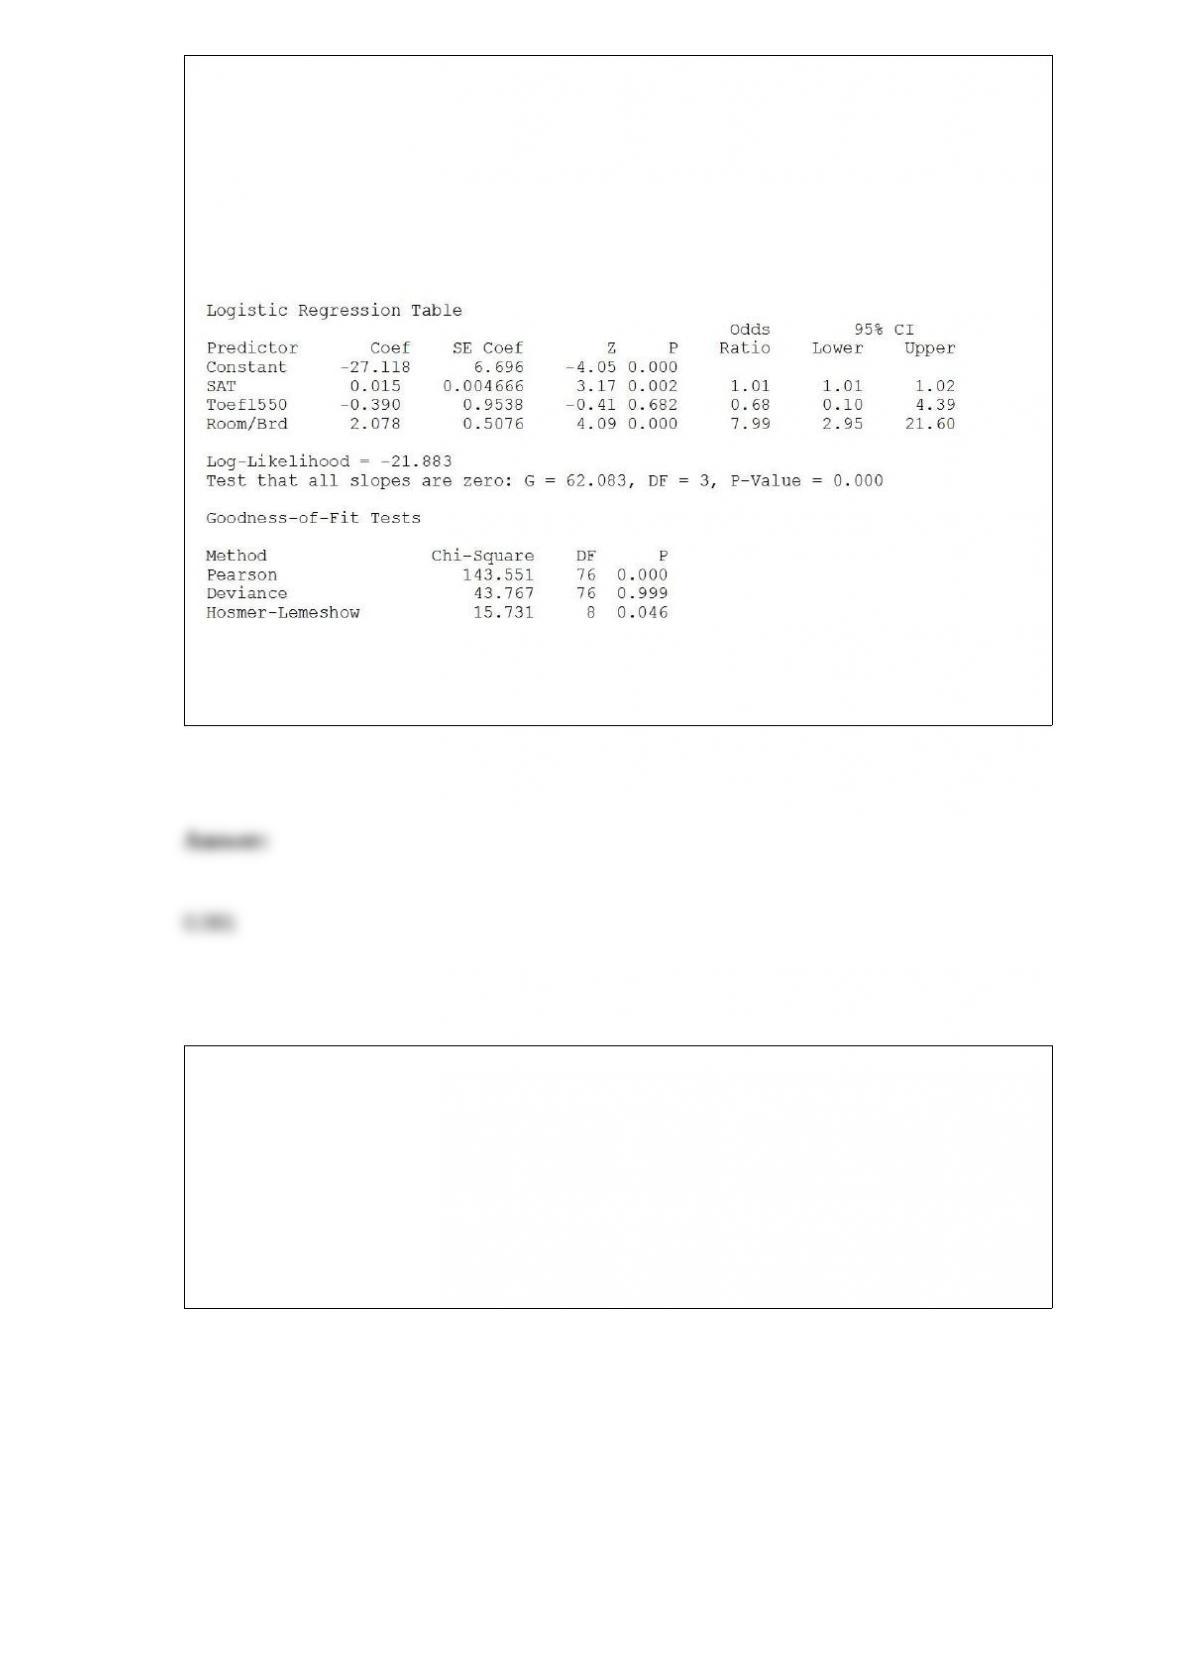
A logistic regression model was estimated in order to predict the probability that a
randomly chosen university or college would be a private university using information
on mean total Scholastic Aptitude Test score (SAT) at the university or college, the
room and board expense measured in thousands of dollars (Room/Brd), and whether the
TOEFL criterion is at least 550 (Toefl550 = 1 if yes, 0 otherwise.) The dependent
variable, Y, is school type (Type = 1 if private and 0 otherwise).
Referring to Table 17-11, what is the estimated probability that a school with a mean
SAT score of 1100, a TOEFL criterion that is not at least 550, and the room and board
expense of 7 thousand dollars will be a private school?
TABLE 13-13
In this era of tough economic conditions, voters increasingly ask the question: “Is the
educational achievement level of students dependent on the amount of money the state
in which they reside spends on education?” The partial computer output below is the
result of using spending per student ($) as the independent variable and composite score
which is the sum of the math, science and reading scores as the dependent variable on
35 states that participated in a study. The table includes only partial results.
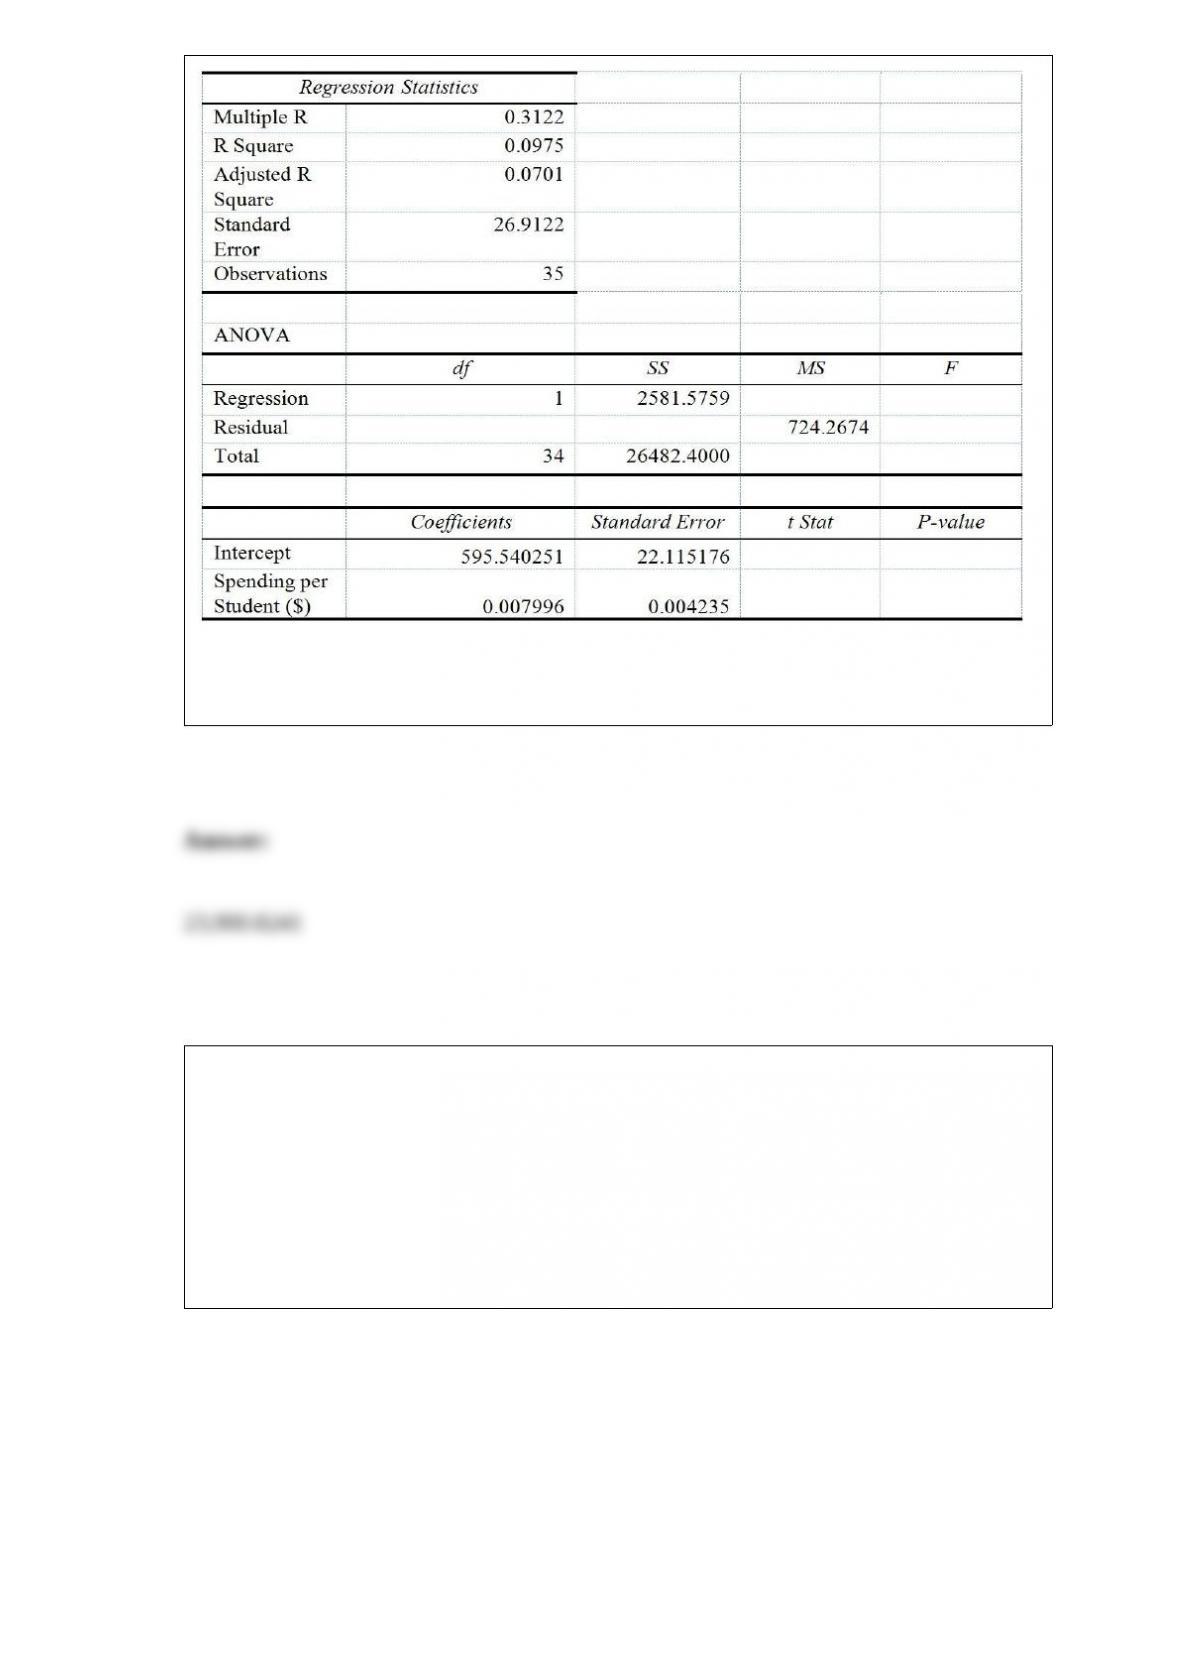
Referring to Table 13-13, the error sum of squares (SSE) of the above regression is
________.
TABLE 11-9
The marketing manager of a company producing a new cereal aimed for children wants
to examine the effect of the color and shape of the box’s logo on the approval rating of
the cereal. He combined 4 colors and 3 shapes to produce a total of 12 designs. Each
logo was presented to 2 different groups (a total of 24 groups) and the approval rating
for each was recorded and is shown below. The manager analyzed these data using the
α = 0.05 level of significance for all inferences.
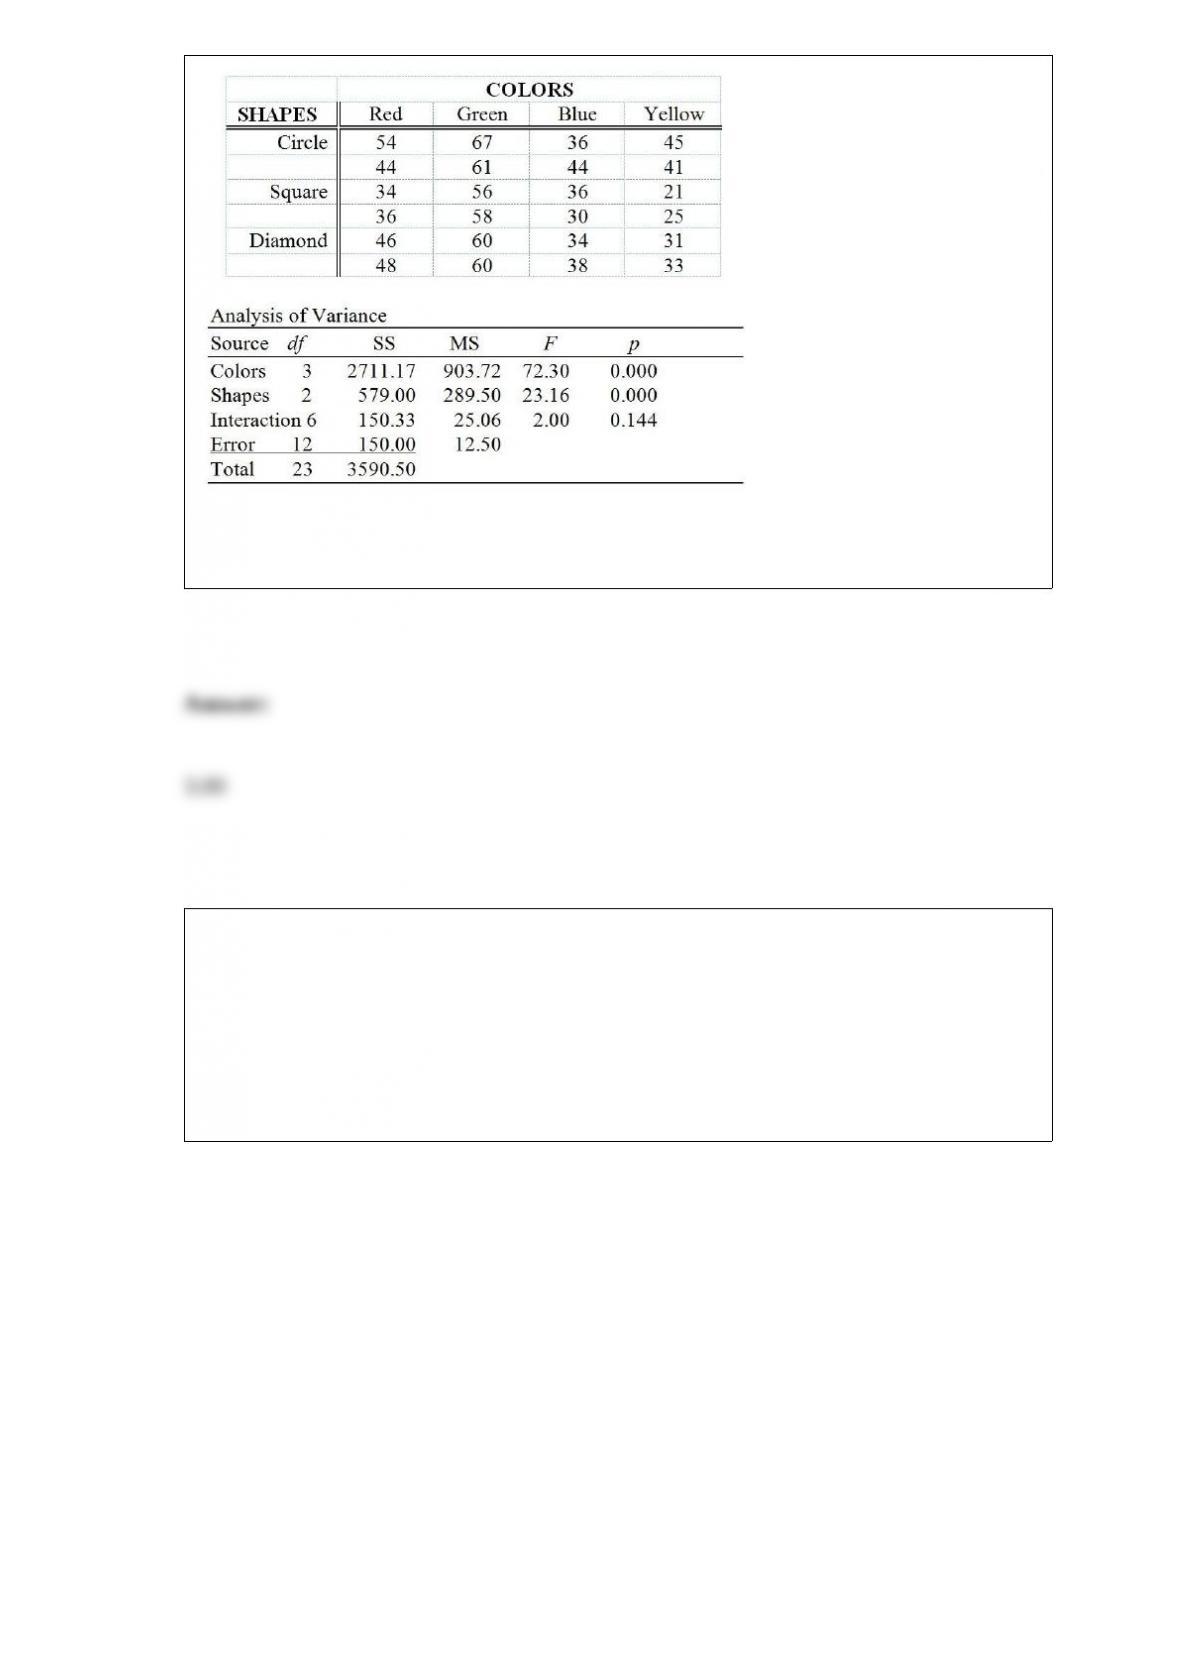
Referring to Table 11-9, the critical value in the test for a significant interaction is
________.
TABLE 13-4
The managers of a brokerage firm are interested in finding out if the number of new
clients a broker brings into the firm affects the sales generated by the broker. They
sample 12 brokers and determine the number of new clients they have enrolled in the
last year and their sales amounts in thousands of dollars. These data are presented in the
table that follows.
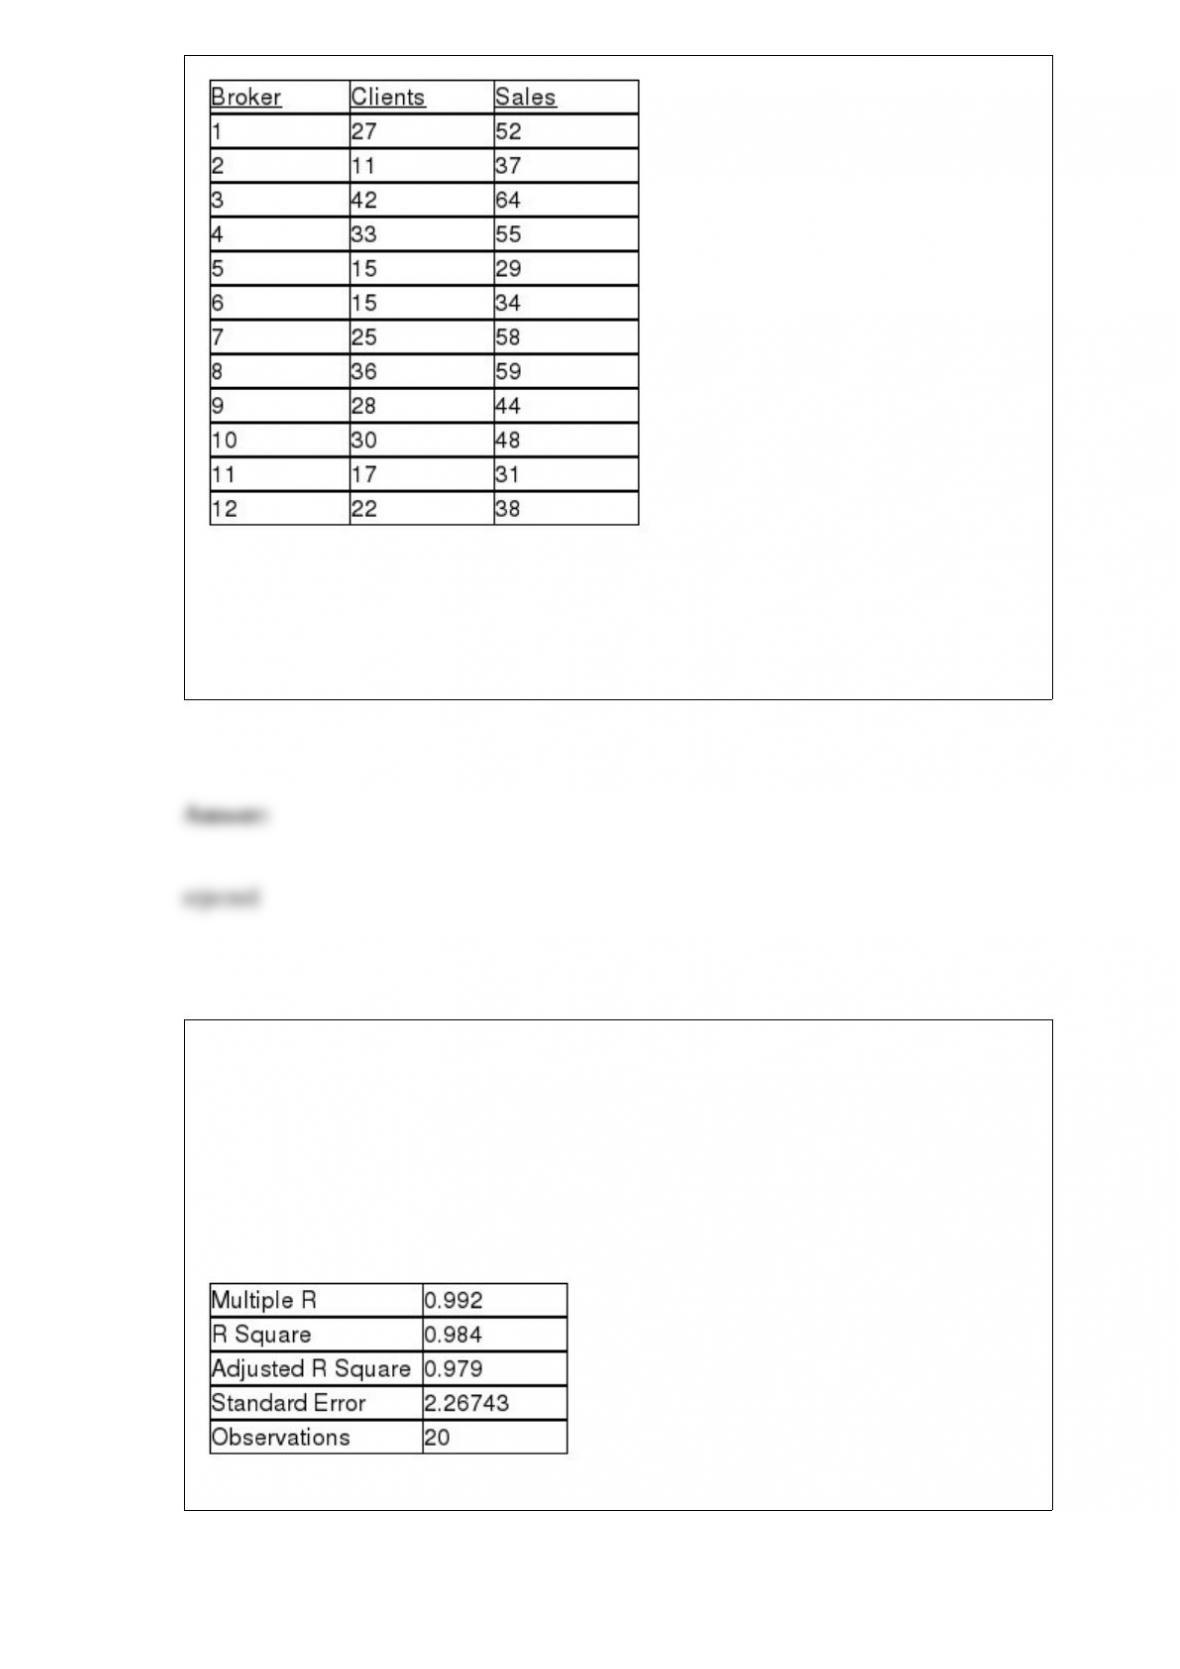
Referring to Table 13-4, the managers of the brokerage firm wanted to test the
hypothesis that the number of new clients brought in had a positive impact on the
amount of sales generated. At a level of significance of 0.01, the null hypothesis should
be ________ (‘rejected’ or ‘not rejected’).
TABLE 17-3
A financial analyst wanted to examine the relationship between salary (in $1,000) and 4
variables: age (X1 = Age), experience in the field (X2 = Exper), number of degrees (X3 =
Degrees), and number of previous jobs in the field (X4 = Prevjobs). He took a sample of
20 employees and obtained the following Microsoft Excel output:
SUMMARY OUTPUT
Regression Statistics
ANOVA
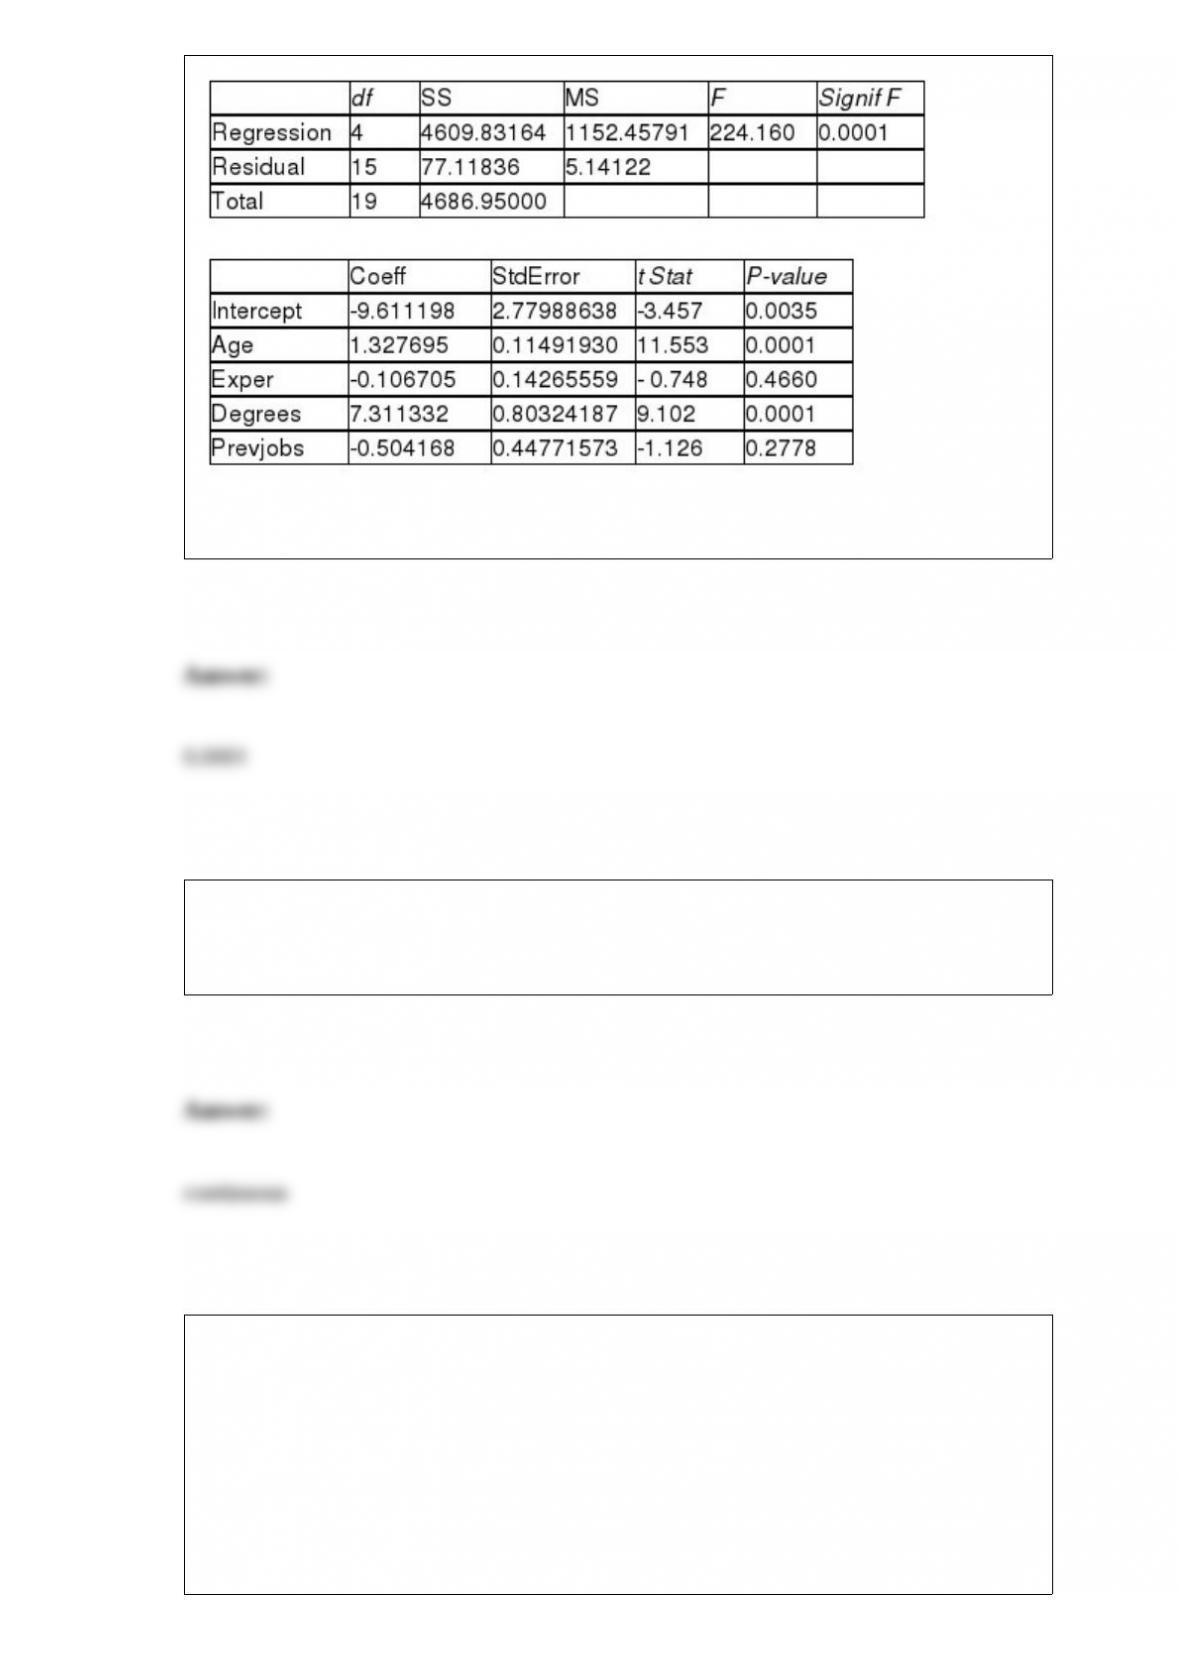
Referring to Table 17-3, the analyst wants to use a t test to test for the significance of
the coefficient of X3. The p-value of the test is ________.
An insurance company evaluates many numerical variables about a person before
deciding on an appropriate rate for automobile insurance. The distance a person drives
in a year is an example of a ________ variable.
Referring to Table 14-4, the value of the partial F test statistic is ________ for
H0 : Variable X2 does not significantly improve the model after variable X1 has been
included
H1 : Variable X2 significantly improves the model after variable X1 has been included
TABLE 14-4
A real estate builder wishes to determine how house size (House) is influenced by
family income (Income) and family size (Size). House size is measured in hundreds of
square feet and income is measured in thousands of dollars. The builder randomly
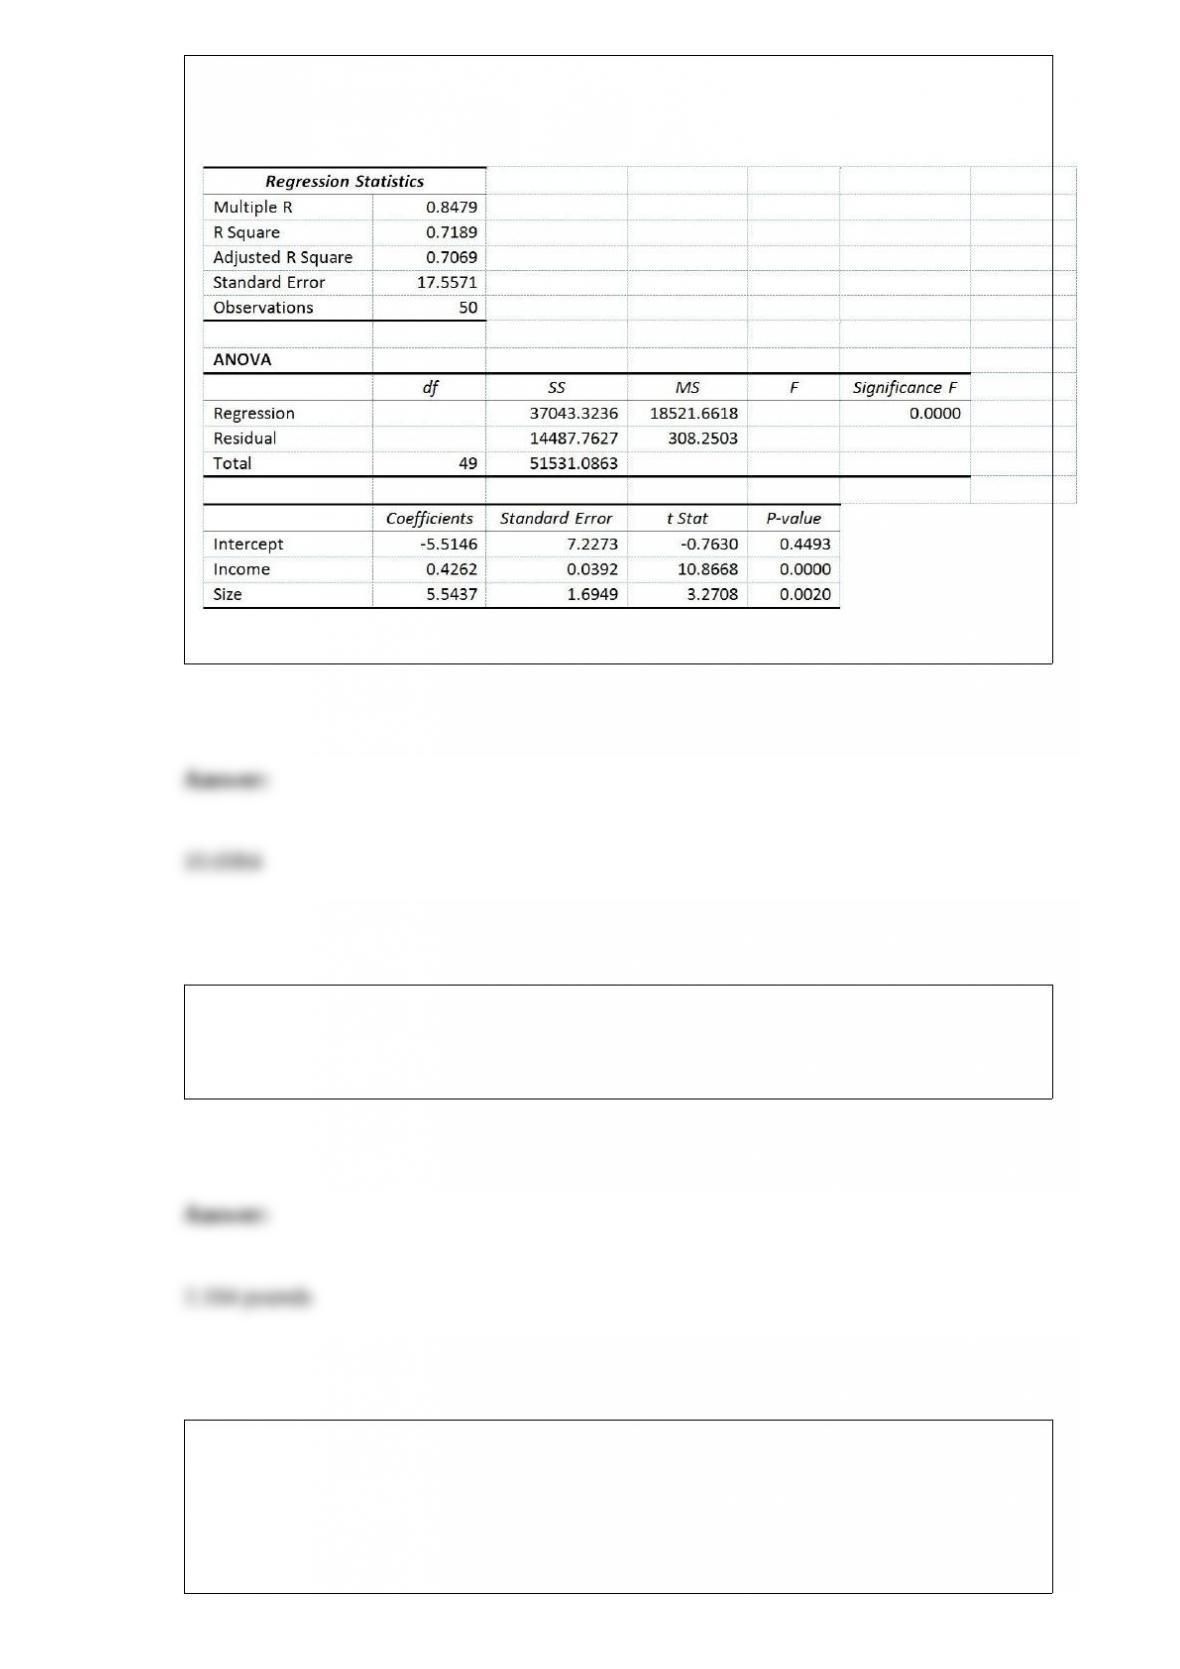
selected 50 families and ran the multiple regression. Partial Microsoft Excel output is
provided below:
Also SSR (X1∣ X2) = 36400.6326 and SSR (X2∣ X1) = 3297.7917
The owner of a fish market determined that the average weight for a catfish is 3.2
pounds with a standard deviation of 0.8 pound. Assuming the weights of catfish are
normally distributed, above what weight (in pounds) do 89.80% of the weights occur?
TABLE 9-9
The president of a university claimed that the entering class this year appeared to be
larger than the entering class from previous years but their mean SAT score is lower
than previous years. He took a sample of 20 of this year’s entering students and found
that their mean SAT score is 1,501 with a standard deviation of 53. The university’s
record indicates that the mean SAT score for entering students from previous years is
1,520. He wants to find out if his claim is supported by the evidence at a 5% level of
significance.
Referring to Table 9-9, the highest level of significance at which the null hypothesis
cannot be rejected is ________.
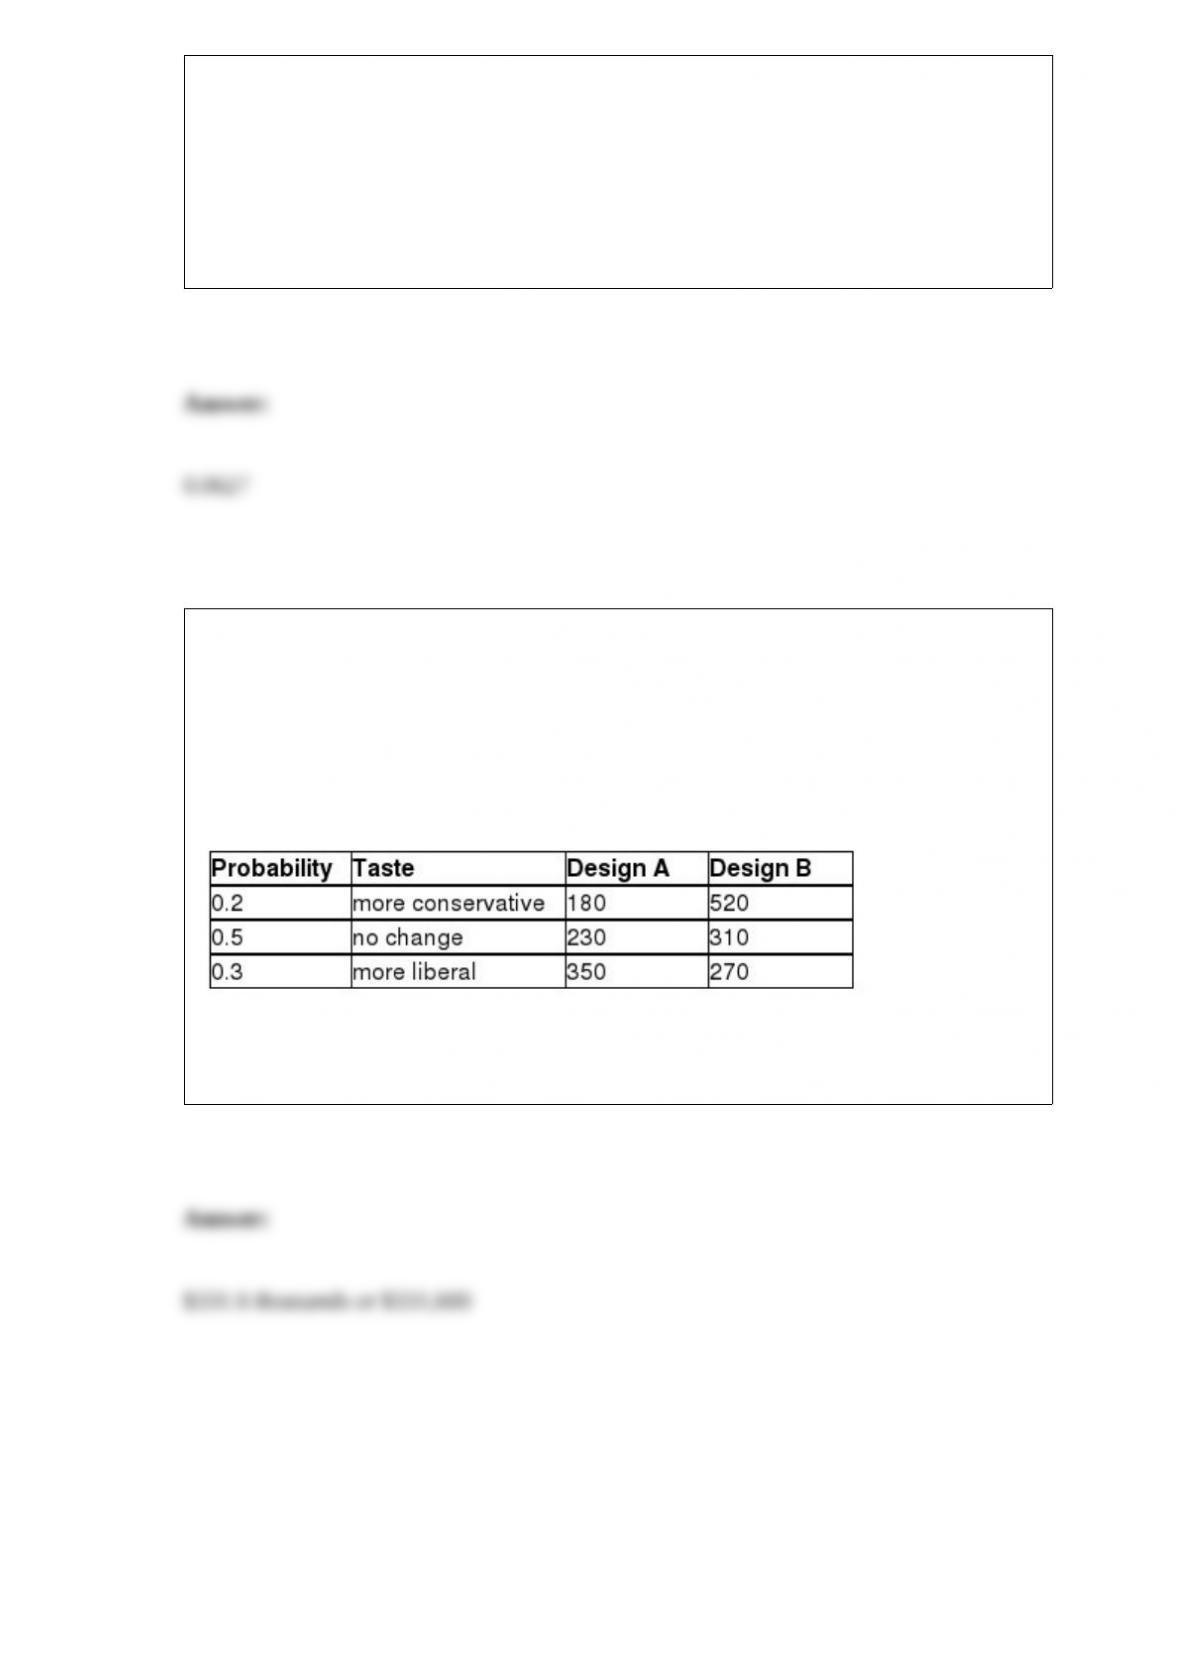
TABLE 5-8
Two different designs on a new line of winter jackets for the coming winter are
available for your manufacturing plants. Your profit (in thousands of dollars) will
depend on the taste of the consumers when winter arrives. The probability of the three
possible different tastes of the consumers and the corresponding profits are presented in
the following table.
Referring to Table 5-8, if you decide to choose Design A for 10% of the production
lines and Design B for the remaining production lines, what is the expected profit?