TABLE 6-7
A company has 125 personal computers. The probability that any one of them will
require repair on a given day is 0.15.
Referring to Table 6-7 and assuming that the number of computers that requires repair
on a given day follows a binomial distribution, compute the probability that there will
be less than 25 or more than 30 computers that require repair on a given day using a
normal approximation.
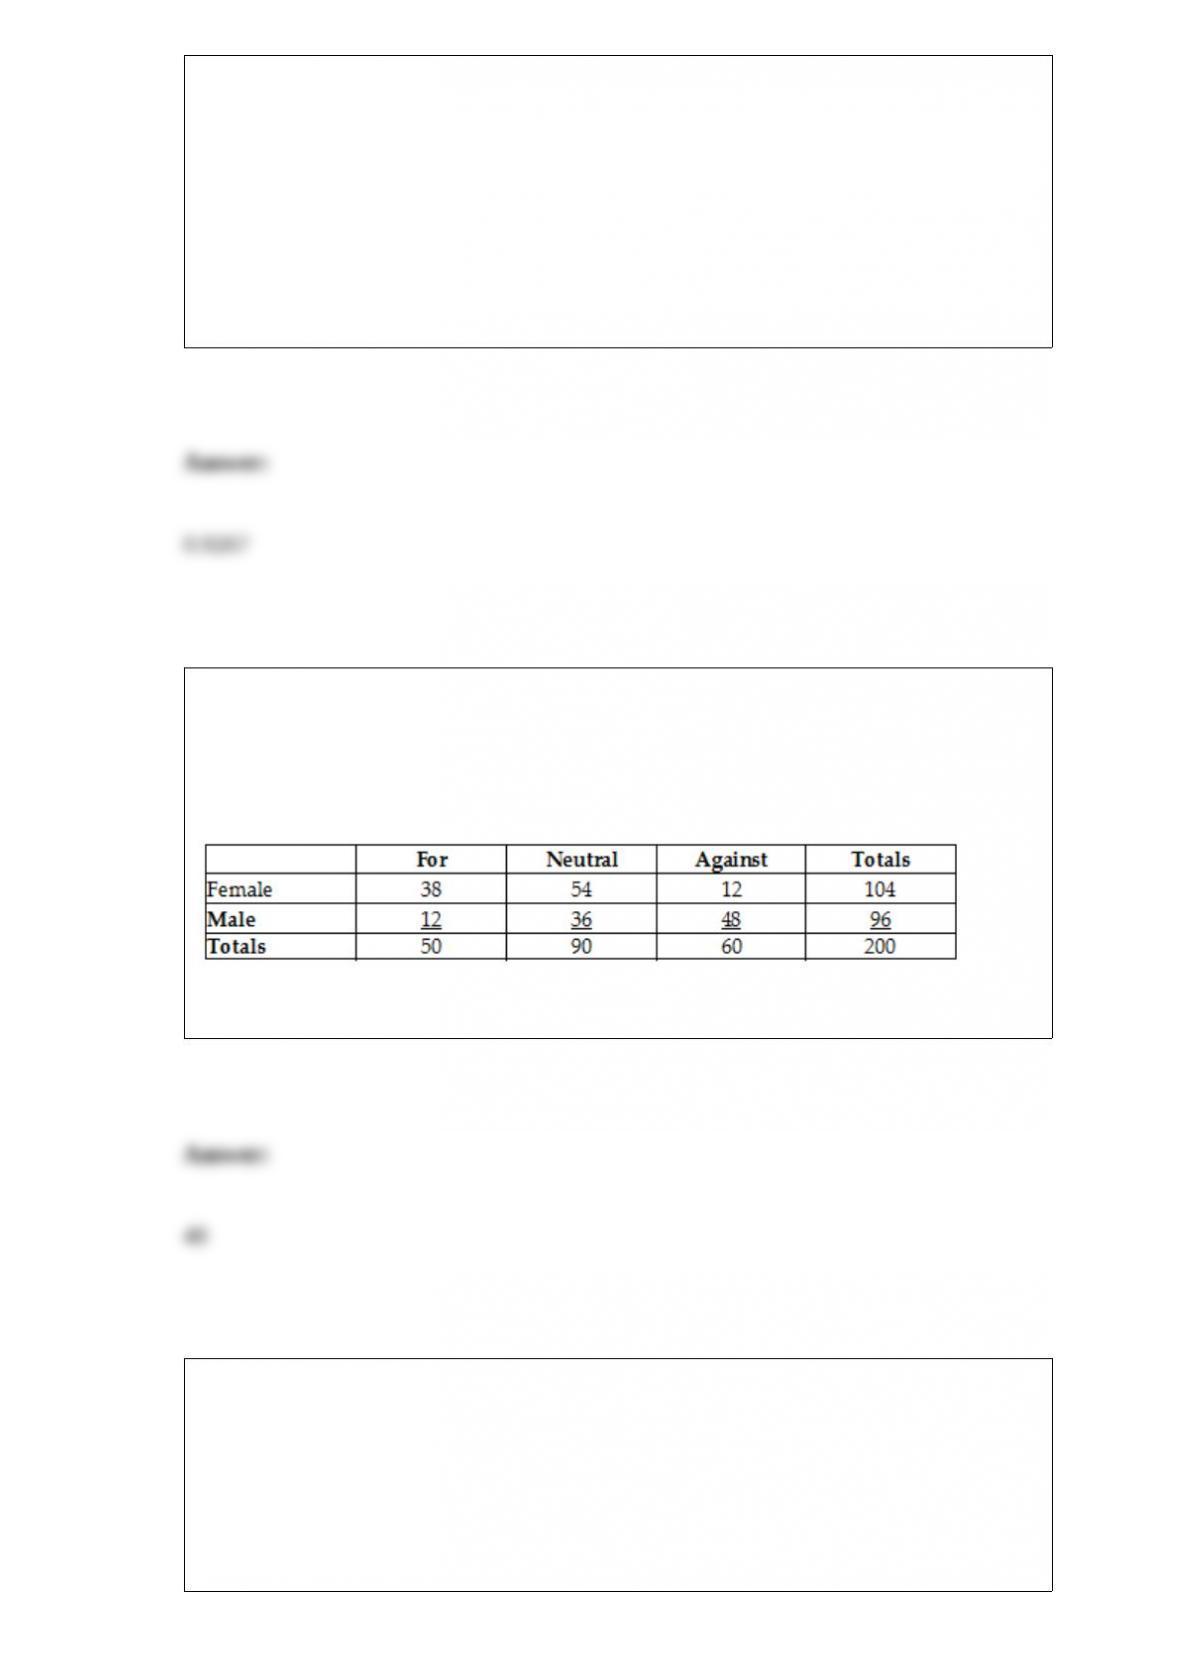
TABLE 2-12
The table below contains the opinions of a sample of 200 people broken down by
gender about the latest congressional plan to eliminate anti-trust exemptions for
professional baseball.
Referring to Table 2-12, ________ percent of the 200 were males.
TABLE 17-10
Given below are results from the regression analysis where the dependent variable is
the number of weeks a worker is unemployed due to a layoff (Unemploy) and the
independent variables are the age of the worker (Age), the number of years of education
received (Edu), the number of years at the previous job (Job Yr), a dummy variable for
marital status (Married: 1 = married, 0 = otherwise), a dummy variable for head of
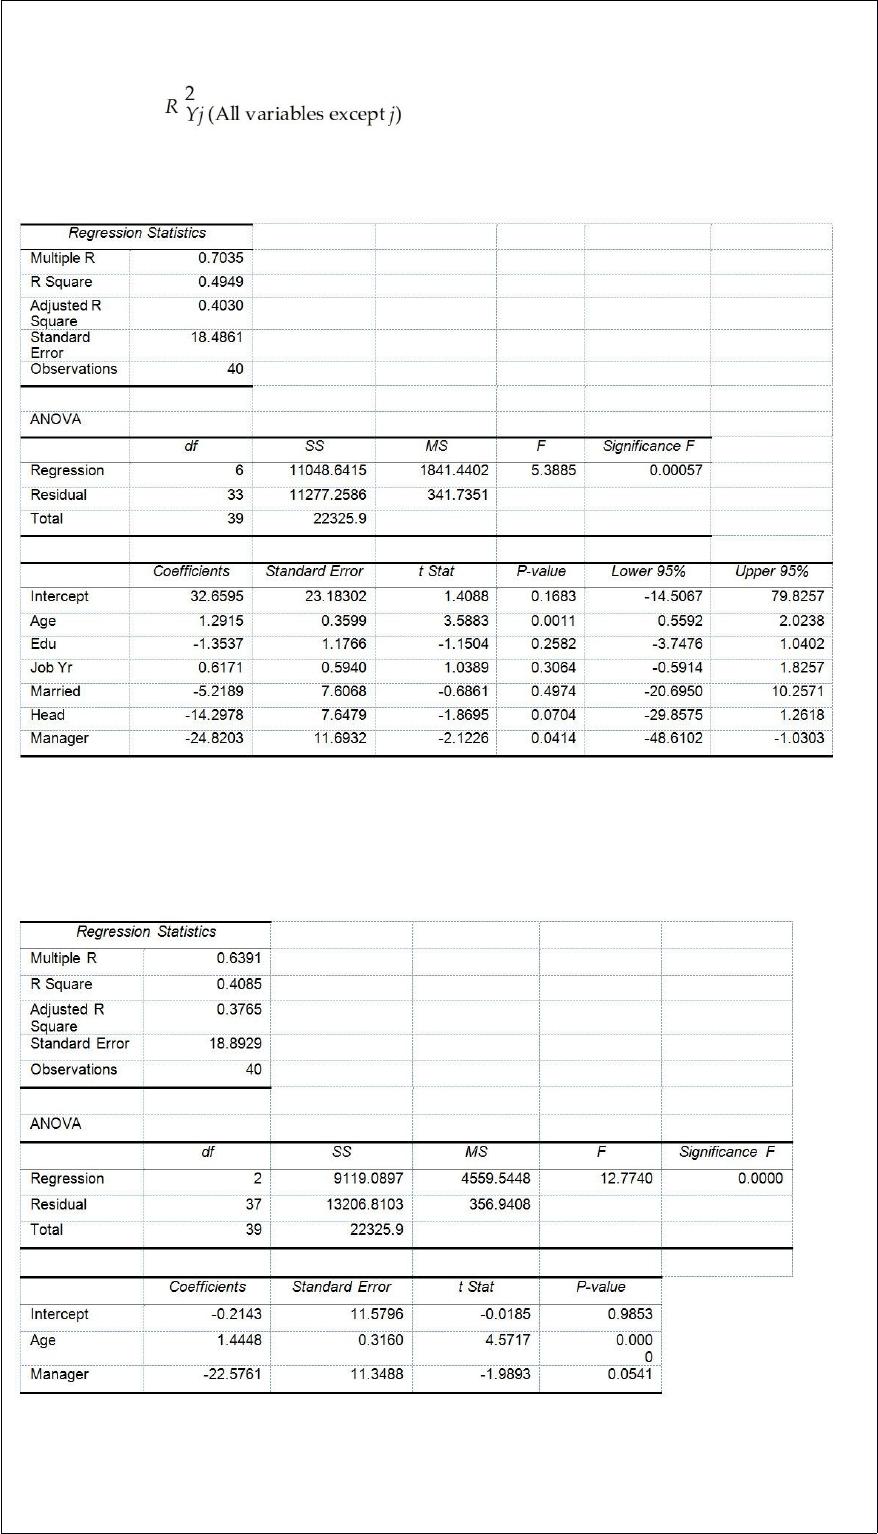
household (Head: 1 = yes, 0 = no) and a dummy variable for management position
(Manager: 1 = yes, 0 = no). We shall call this Model 1. The coefficient of partial
determination ( ) of each of the 6 predictors are, respectively,
0.2807, 0.0386, 0.0317, 0.0141, 0.0958, and 0.1201.
Model 2 is the regression analysis where the dependent variable is Unemploy and the
independent variables are Age and Manager. The results of the regression analysis are
given below:
Referring to Table 17-10, Model 1, ________ of the variation in the number of weeks a
worker is unemployed due to a layoff can be explained by whether the worker is in a
management position while controlling for the other independent variables.
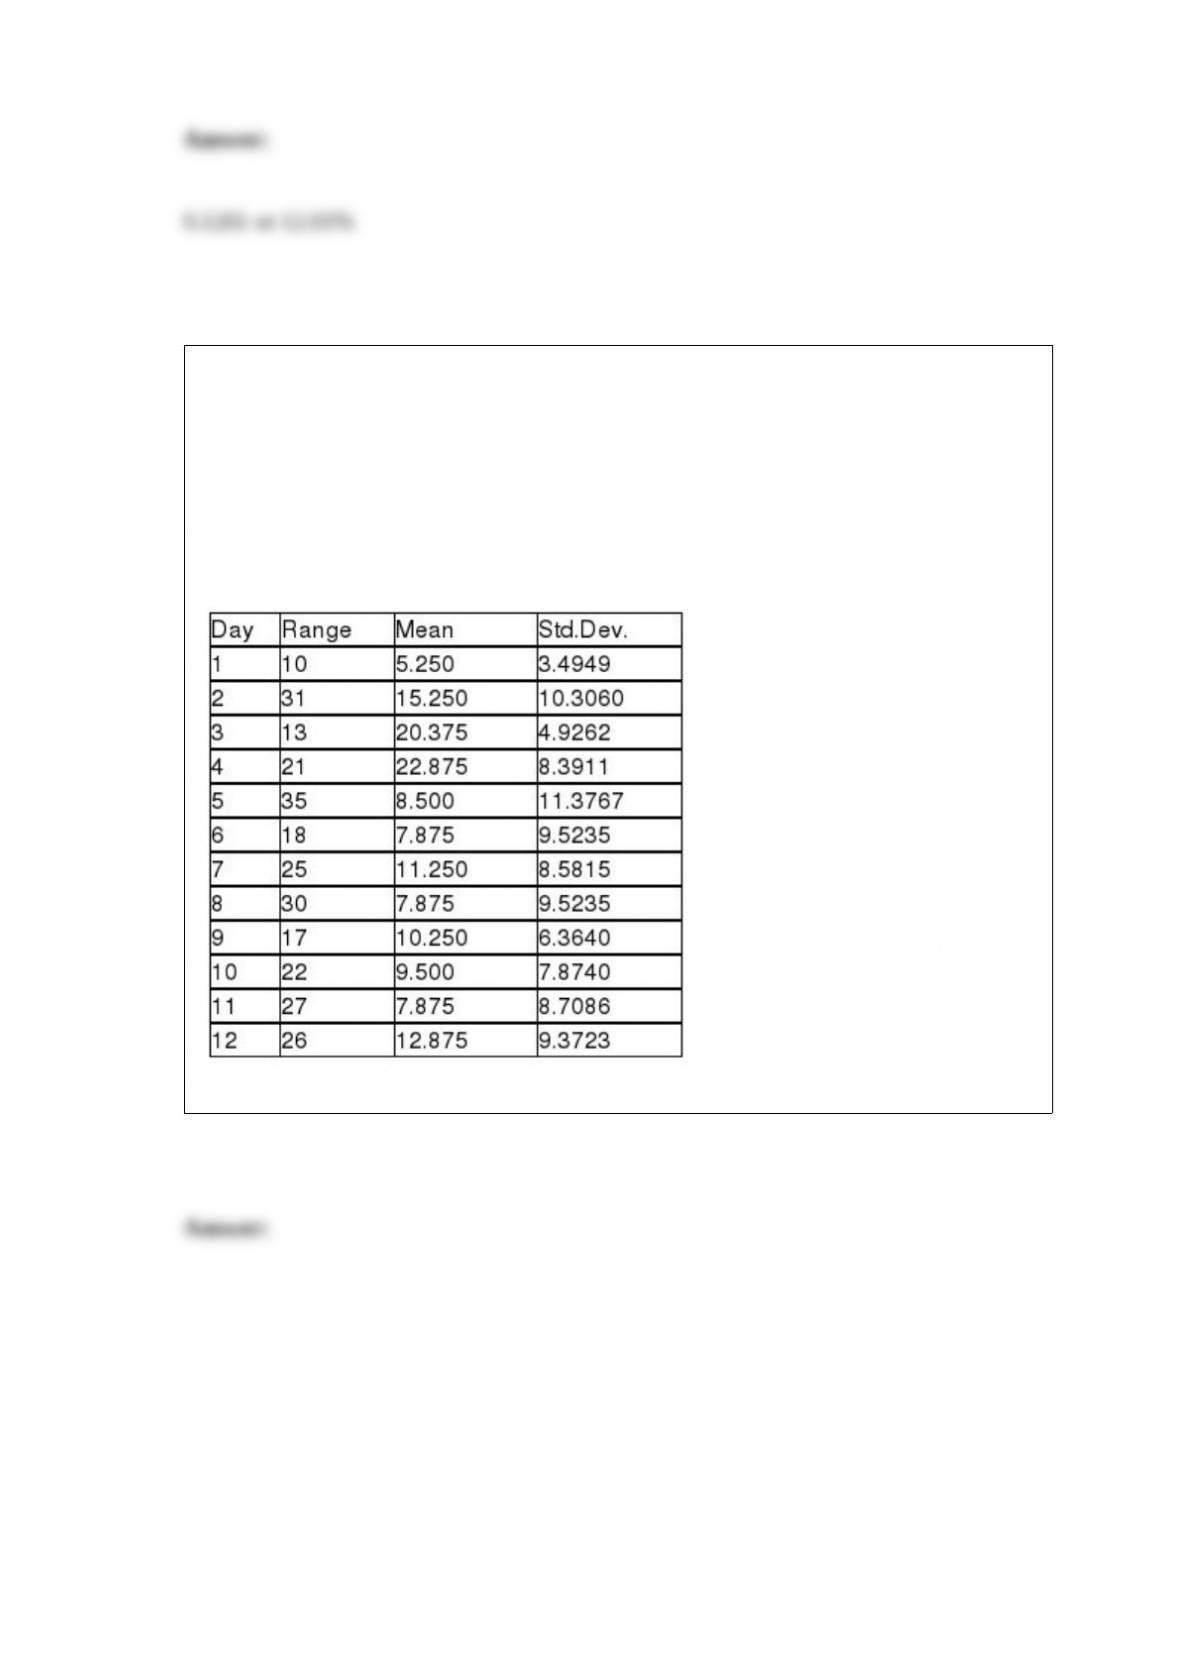
TABLE 18-8
Recently, a university switched to a new type of computer-based registration. The
registrar is concerned with the amount of time students are spending on the computer
registering under the new system. She decides to randomly select 8 students on each of
the 12 days of the registration and determine the time each spends on the computer
registering. The range, mean, and standard deviation of the times required to register are
in the table that follows.
Referring to Table 18-8, construct an R chart for the time required to register.
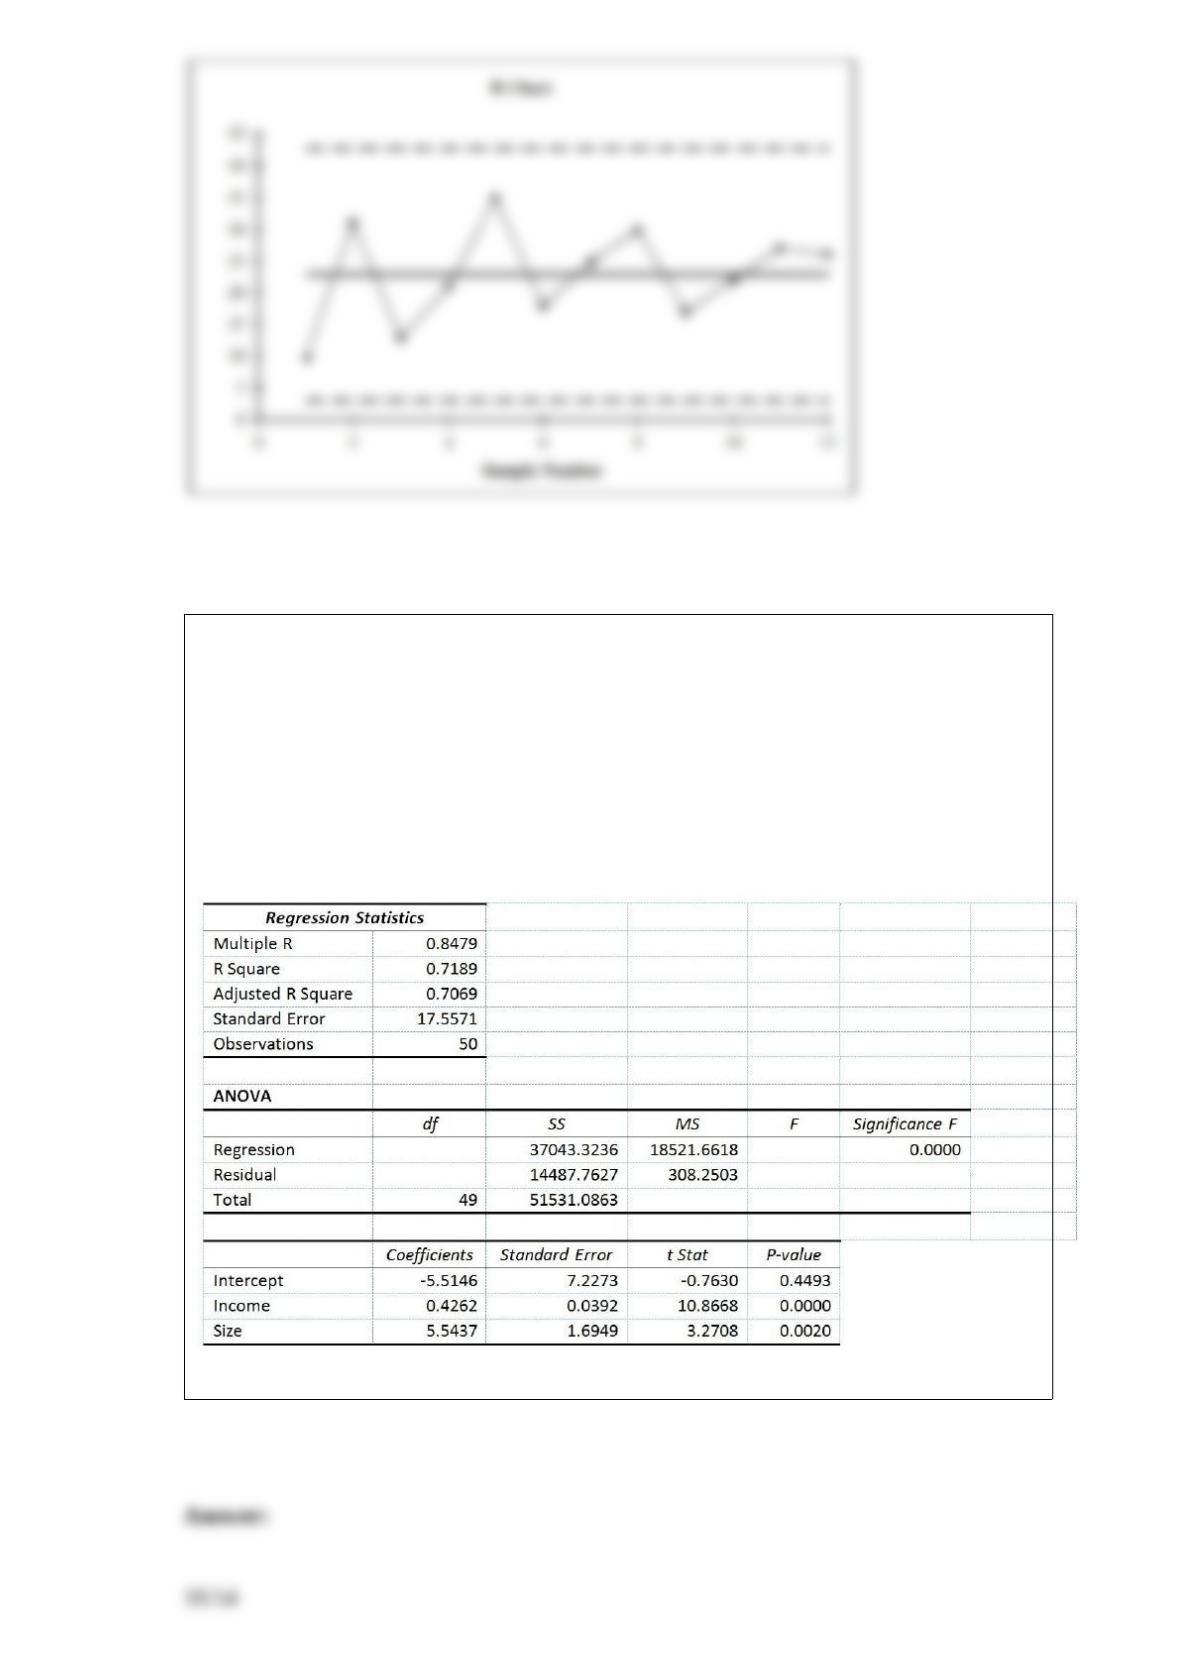
Referring to Table 14-4, ________% of the variation in the house size can be explained
by the variation in the family size while holding the family income constant. TABLE
14-4
A real estate builder wishes to determine how house size (House) is influenced by
family income (Income) and family size (Size). House size is measured in hundreds of
square feet and income is measured in thousands of dollars. The builder randomly
selected 50 families and ran the multiple regression. Partial Microsoft Excel output is
provided below:
Also SSR (X1∣ X2) = 36400.6326 and SSR (X2∣ X1) = 3297.7917
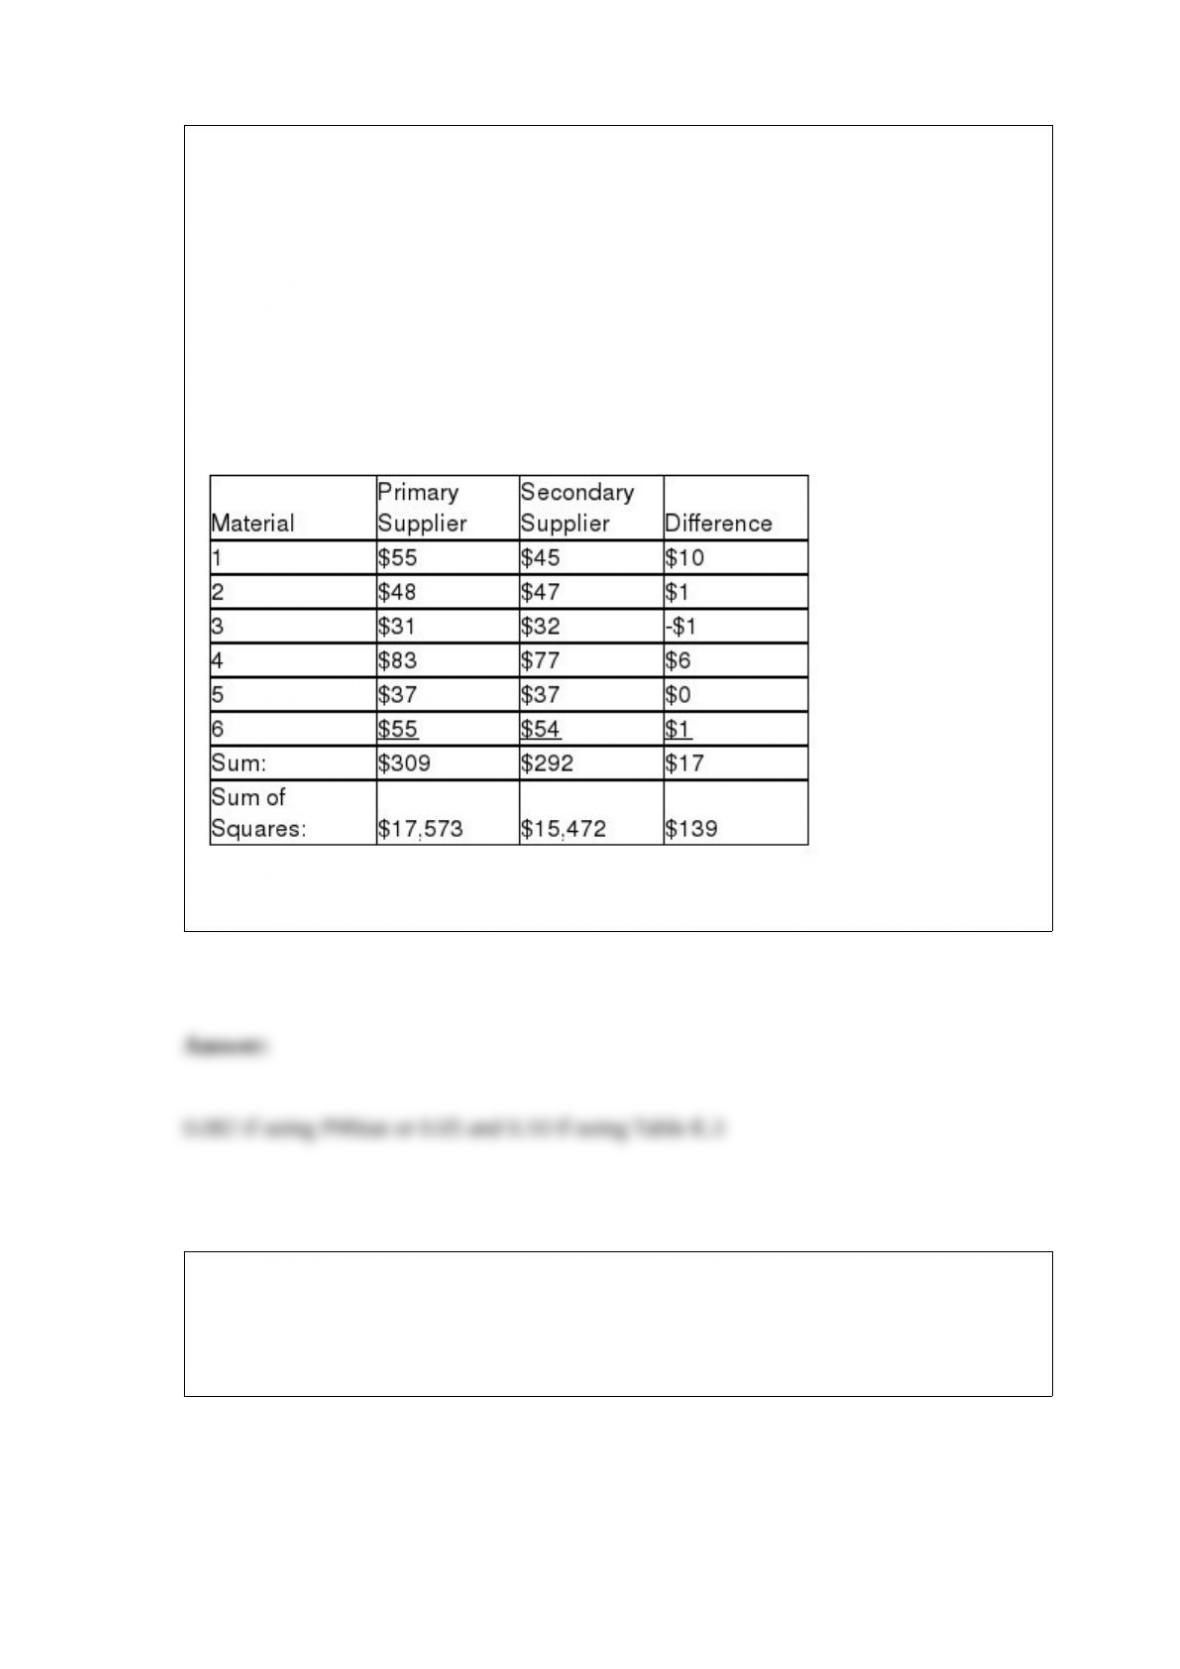
TABLE 10-7
A buyer for a manufacturing plant suspects that his primary supplier of raw materials is
overcharging. In order to determine if his suspicion is correct, he contacts a second
supplier and asks for the prices on various identical materials. He wants to compare
these prices with those of his primary supplier. The data collected is presented in the
table below, with some summary statistics presented (all of these might not be
necessary to answer the questions which follow). The buyer believes that the
differences are normally distributed and will use this sample to perform an appropriate
test at a level of significance of 0.01.
Referring to Table 10-7, the p-value of the test statistic is ________.
TABLE 2-8
The Stem-and-Leaf display represents the number of times in a year that a random
sample of 100 “lifetime” members of a health club actually visited the facility.
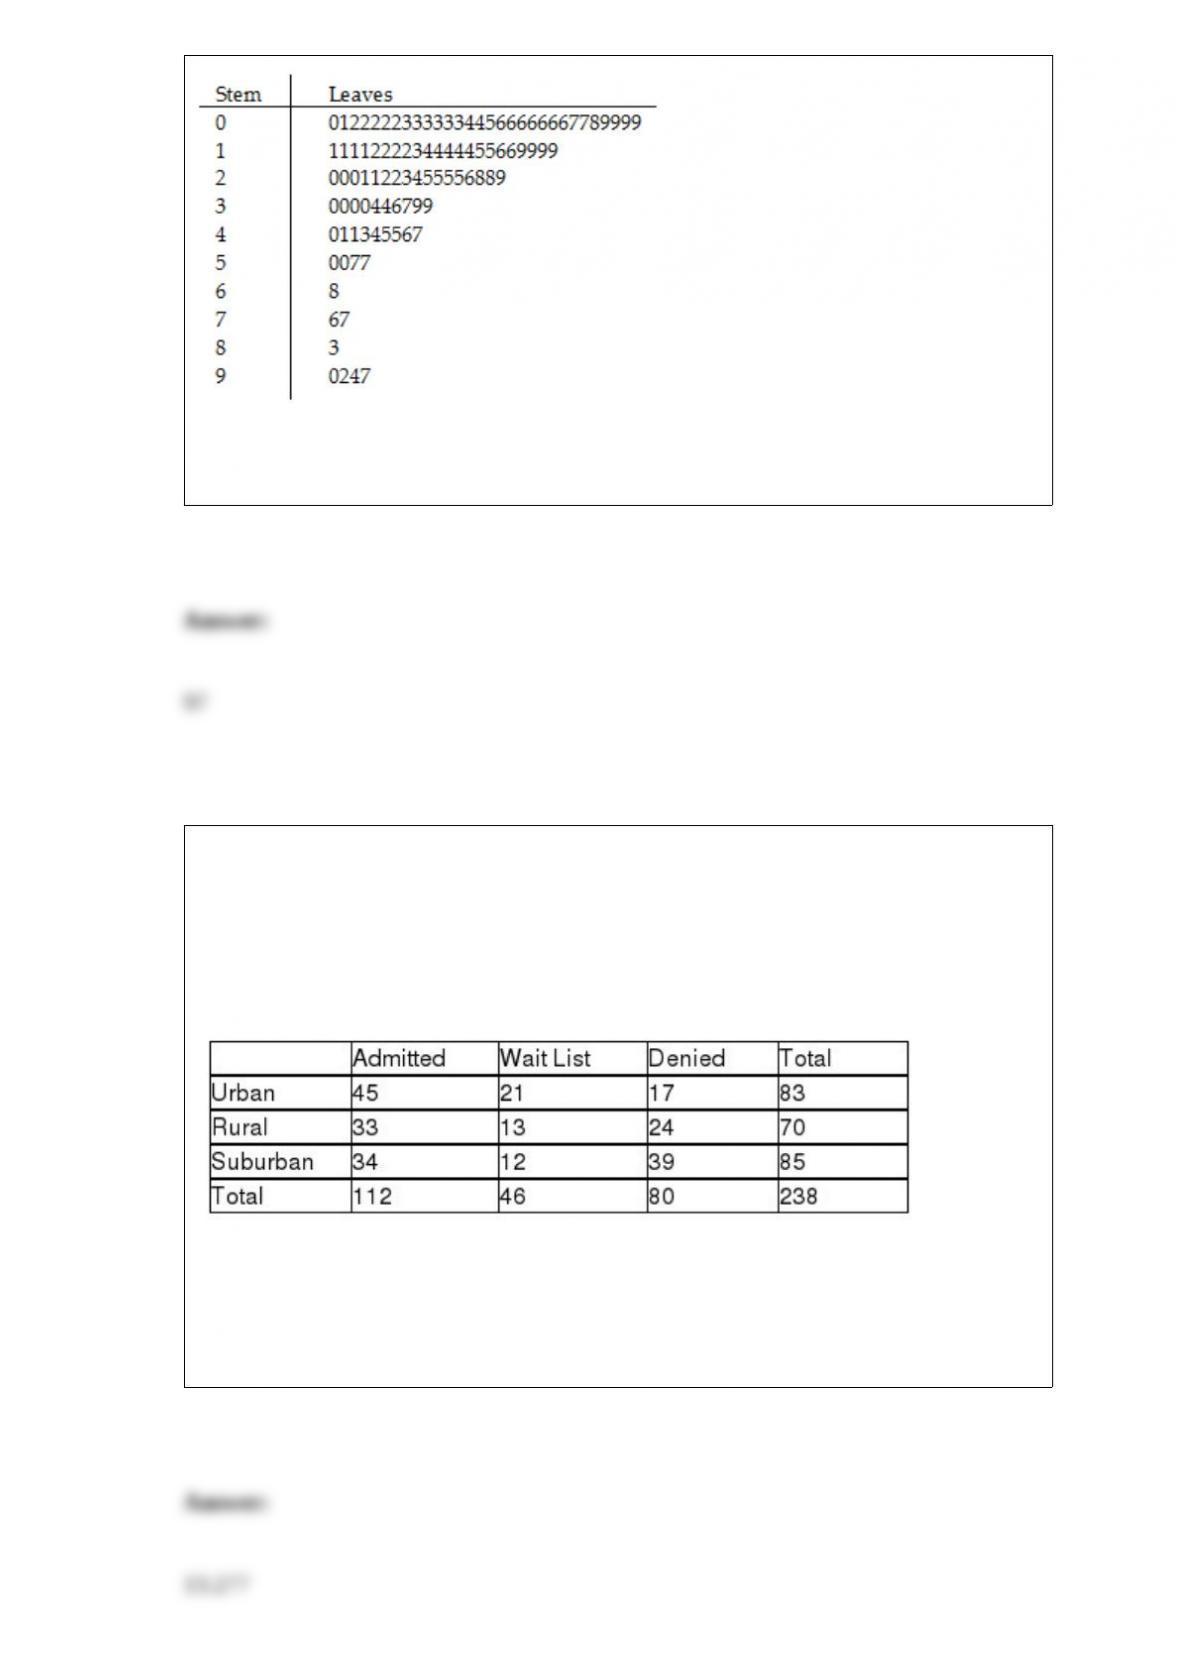
Referring to Table 2-8, the person who visited the health club more than anyone else in
the sample visited the facility ________ times.
TABLE 12-11
The director of admissions at a state college is interested in seeing if admissions status
(admitted, waiting list, denied admission) at his college is independent of the type of
community in which an applicant resides. He takes a sample of recent admissions
decisions and forms the following table:
He will use this table to do a chi-square test of independence with a level of
significance of 0.01.
Referring to Table 12-11, the critical value of the test is ________.
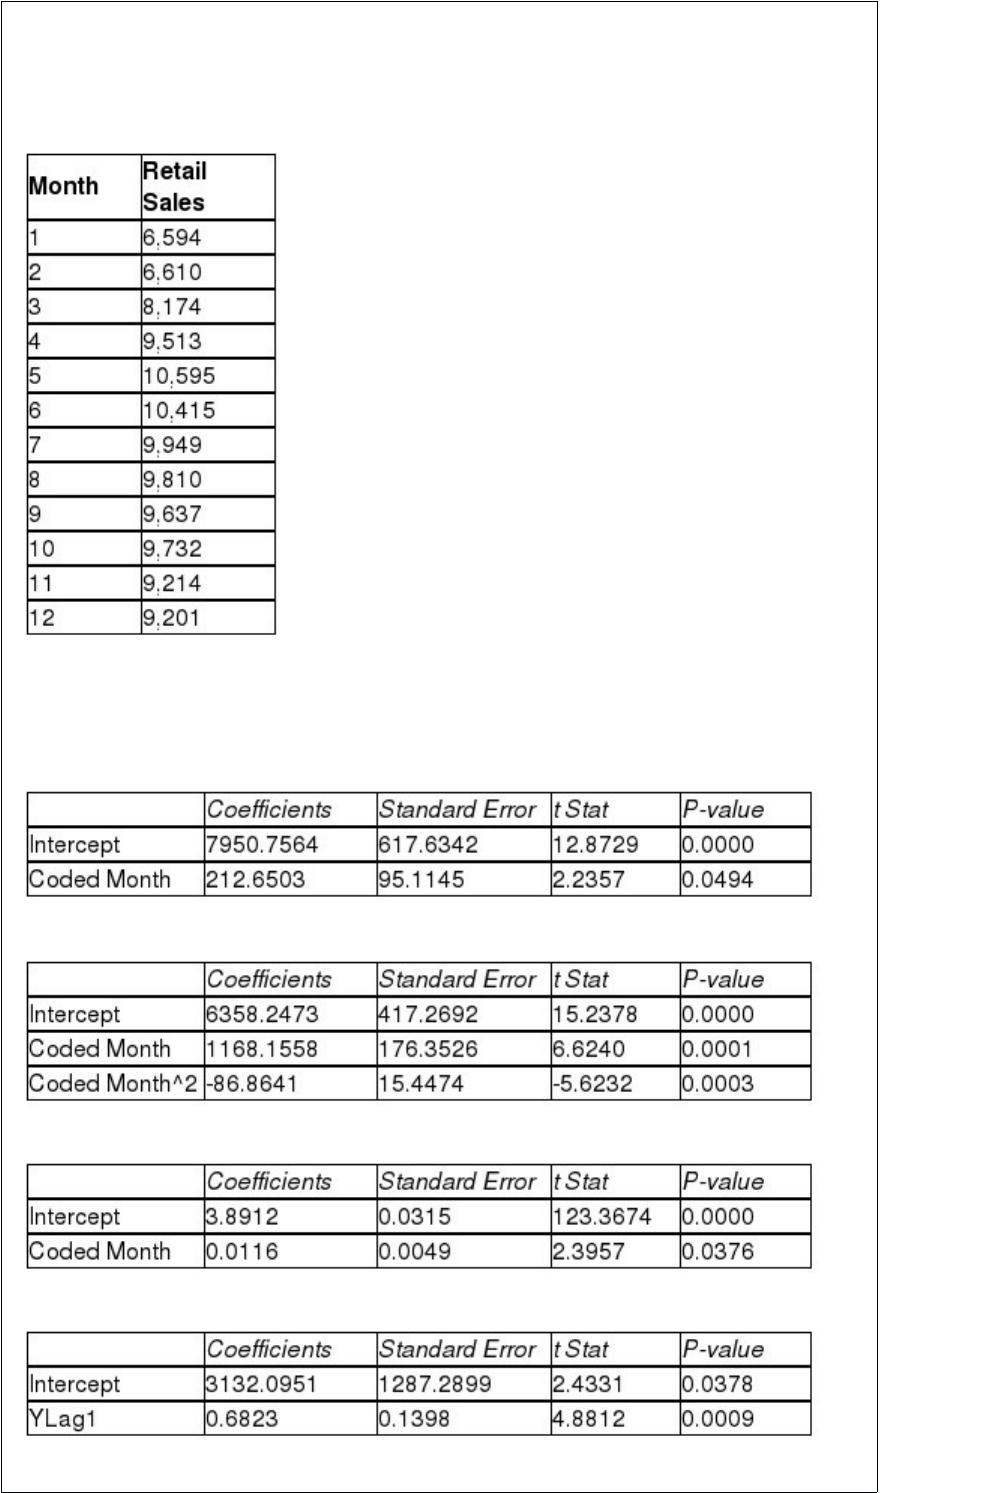
TABLE 16-13
Given below is the monthly time-series data for U.S. retail sales of building materials
over a specific year.
The results of the linear trend, quadratic trend, exponential trend, first-order
autoregressive, second-order autoregressive and third-order autoregressive model are
presented below in which the coded month for the 1st month is 0:
Linear trend model:
Quadratic trend model:
Exponential trend model:
First-order autoregressive:
Second-order autoregressive:
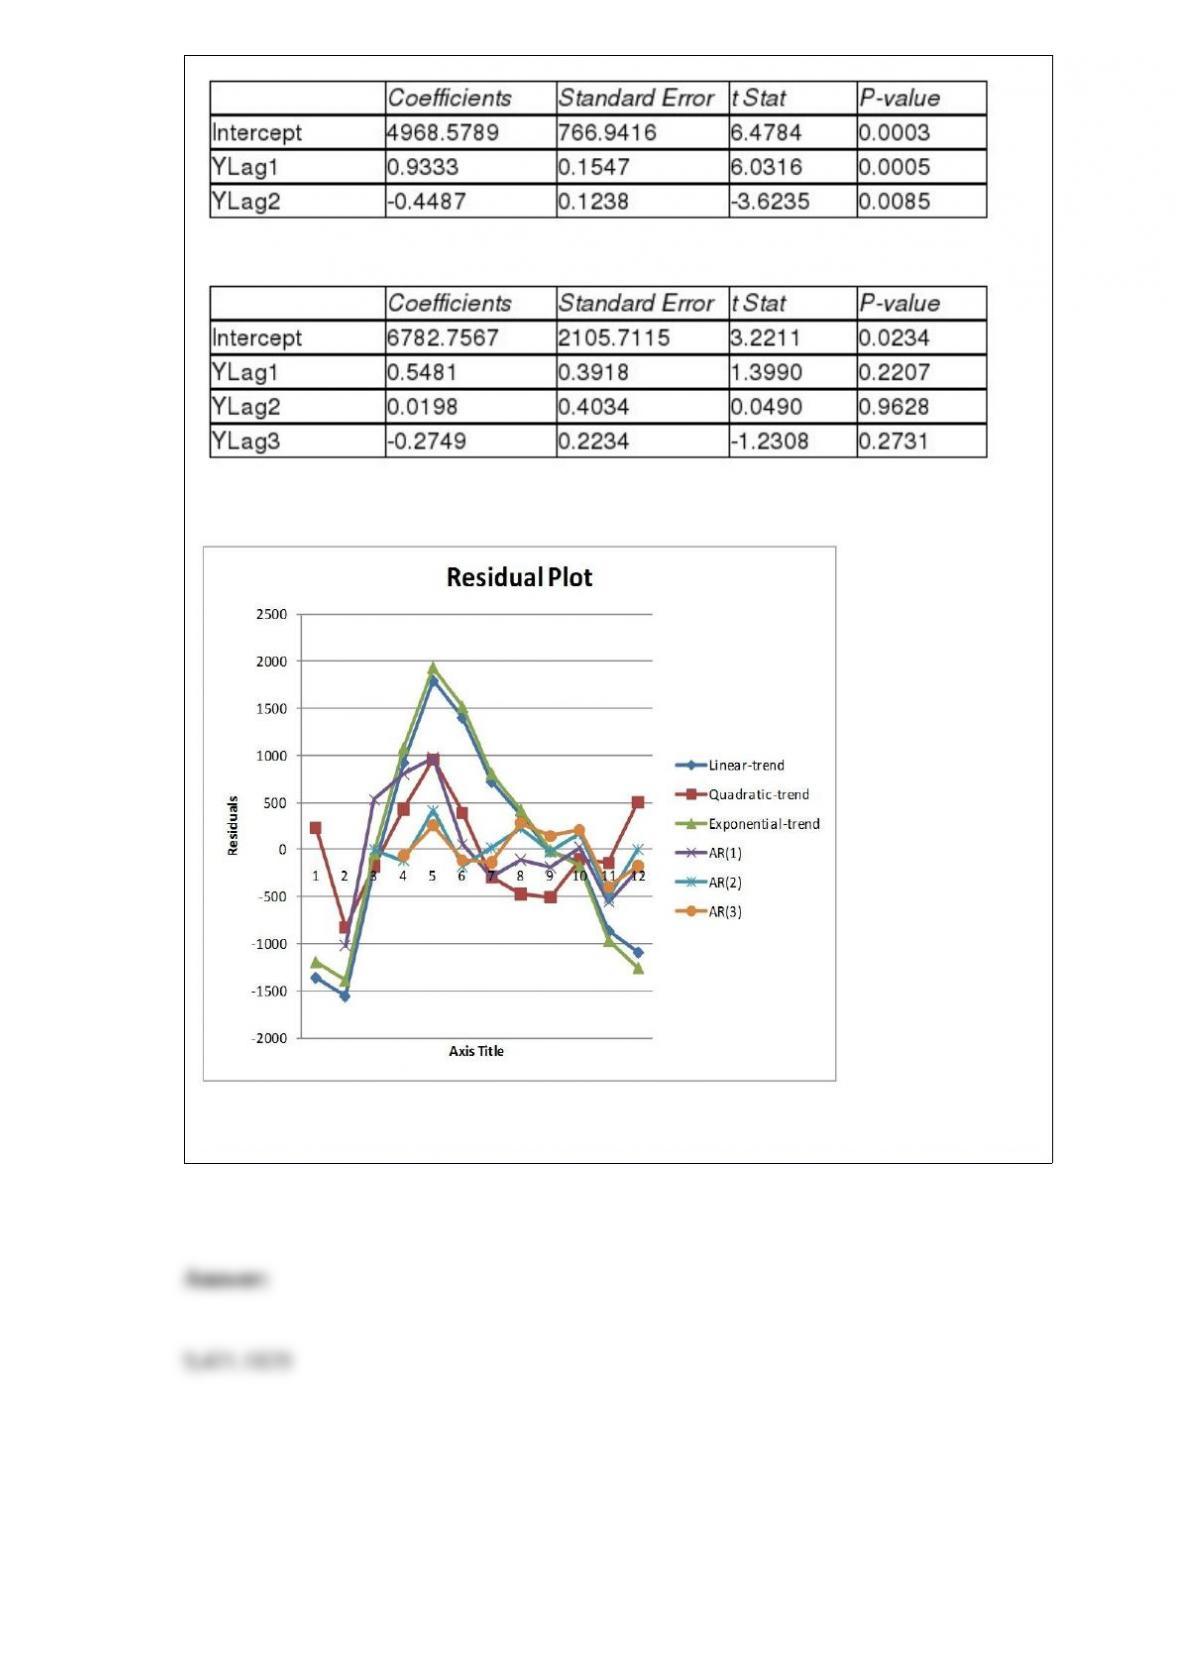
Third-order autoregressive:
Below is the residual plot of the various models:
Referring to Table 16-13, what is your forecast for the 13th month using the
second-order autoregressive model?