True or False: When an explanatory variable is dropped from a multiple regression
model, the adjusted r2 can increase.
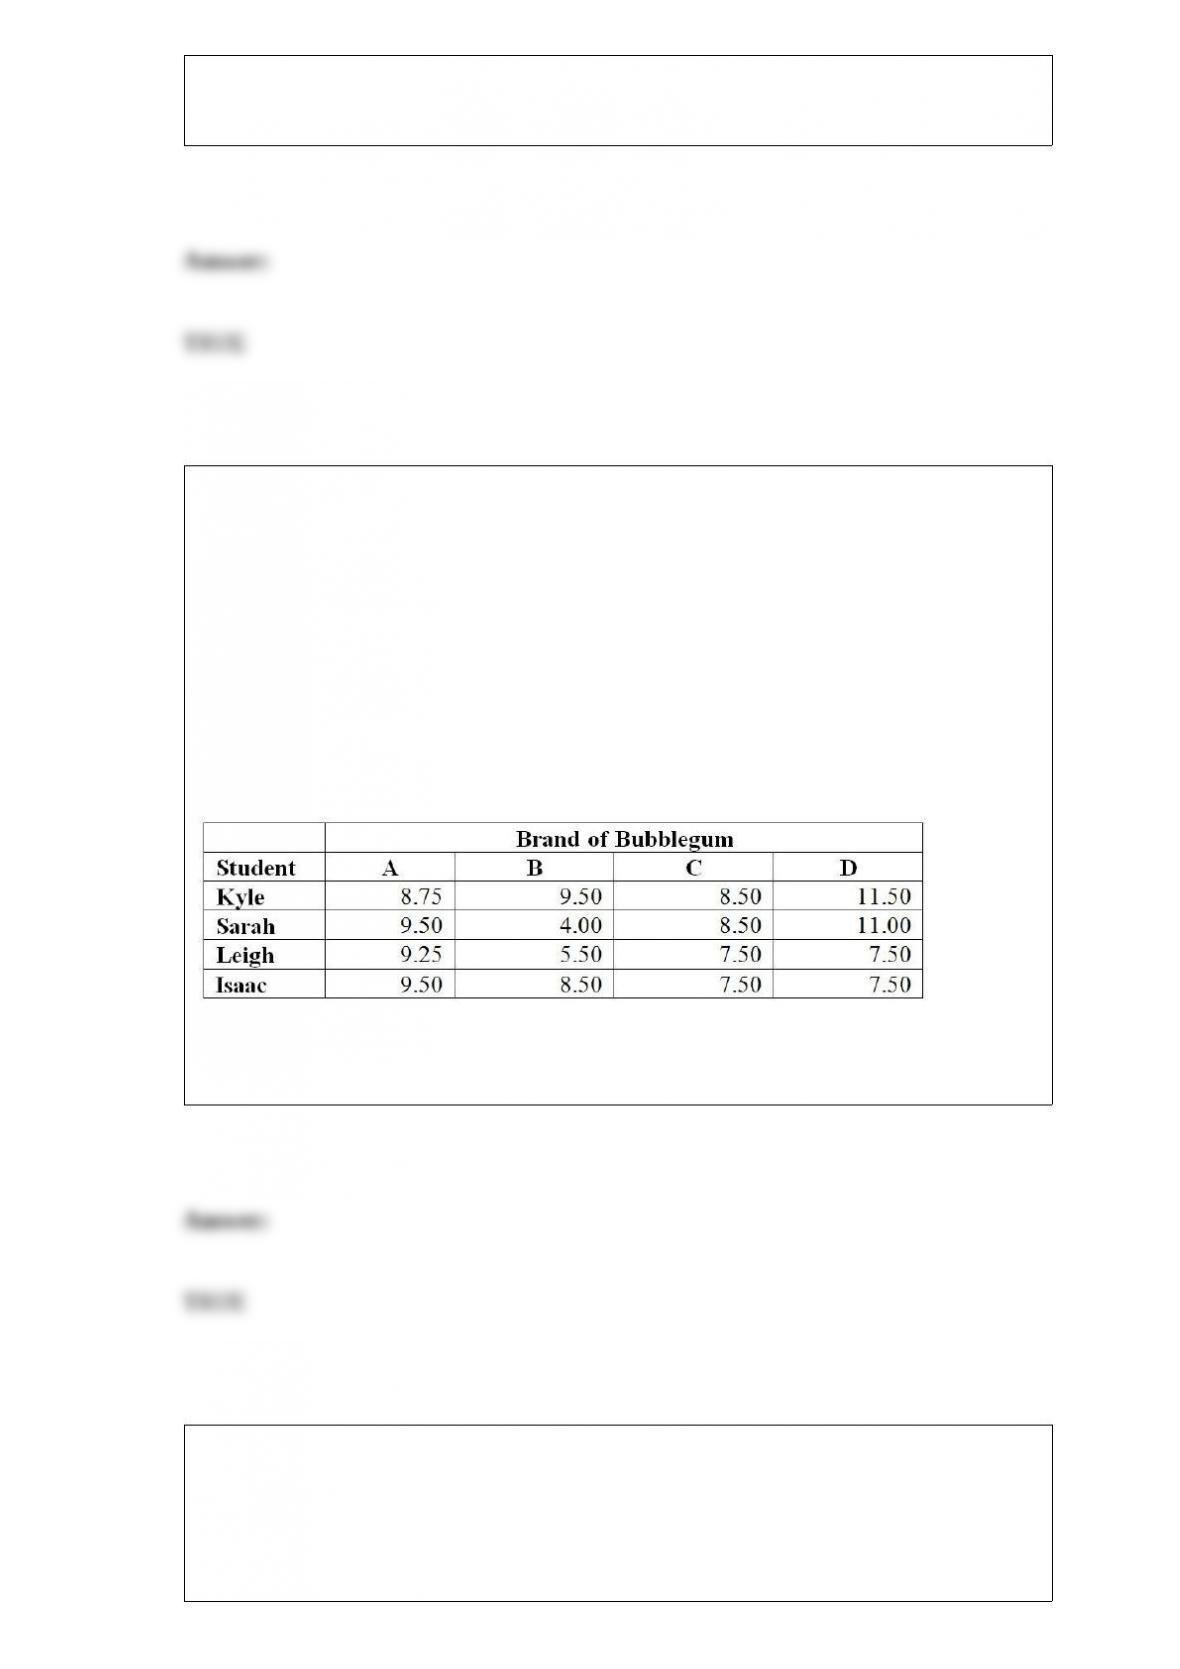
TABLE 11-11
A student team in a business statistics course designed an experiment to investigate
whether the brand of bubblegum used affected the size of bubbles they could blow. To
reduce the person-to-person variability, the students decided to use a randomized block
design using themselves as blocks.
Four brands of bubblegum were tested. A student chewed two pieces of a brand of gum
and then blew a bubble, attempting to make it as big as possible. Another student
measured the diameter of the bubble at its biggest point. The following table gives the
diameters of the bubbles (in inches) for the 16 observations.
True or False: Referring to Table 11-11, the randomized block F test is valid only if the
population of diameters is normally distributed for the 4 brands.
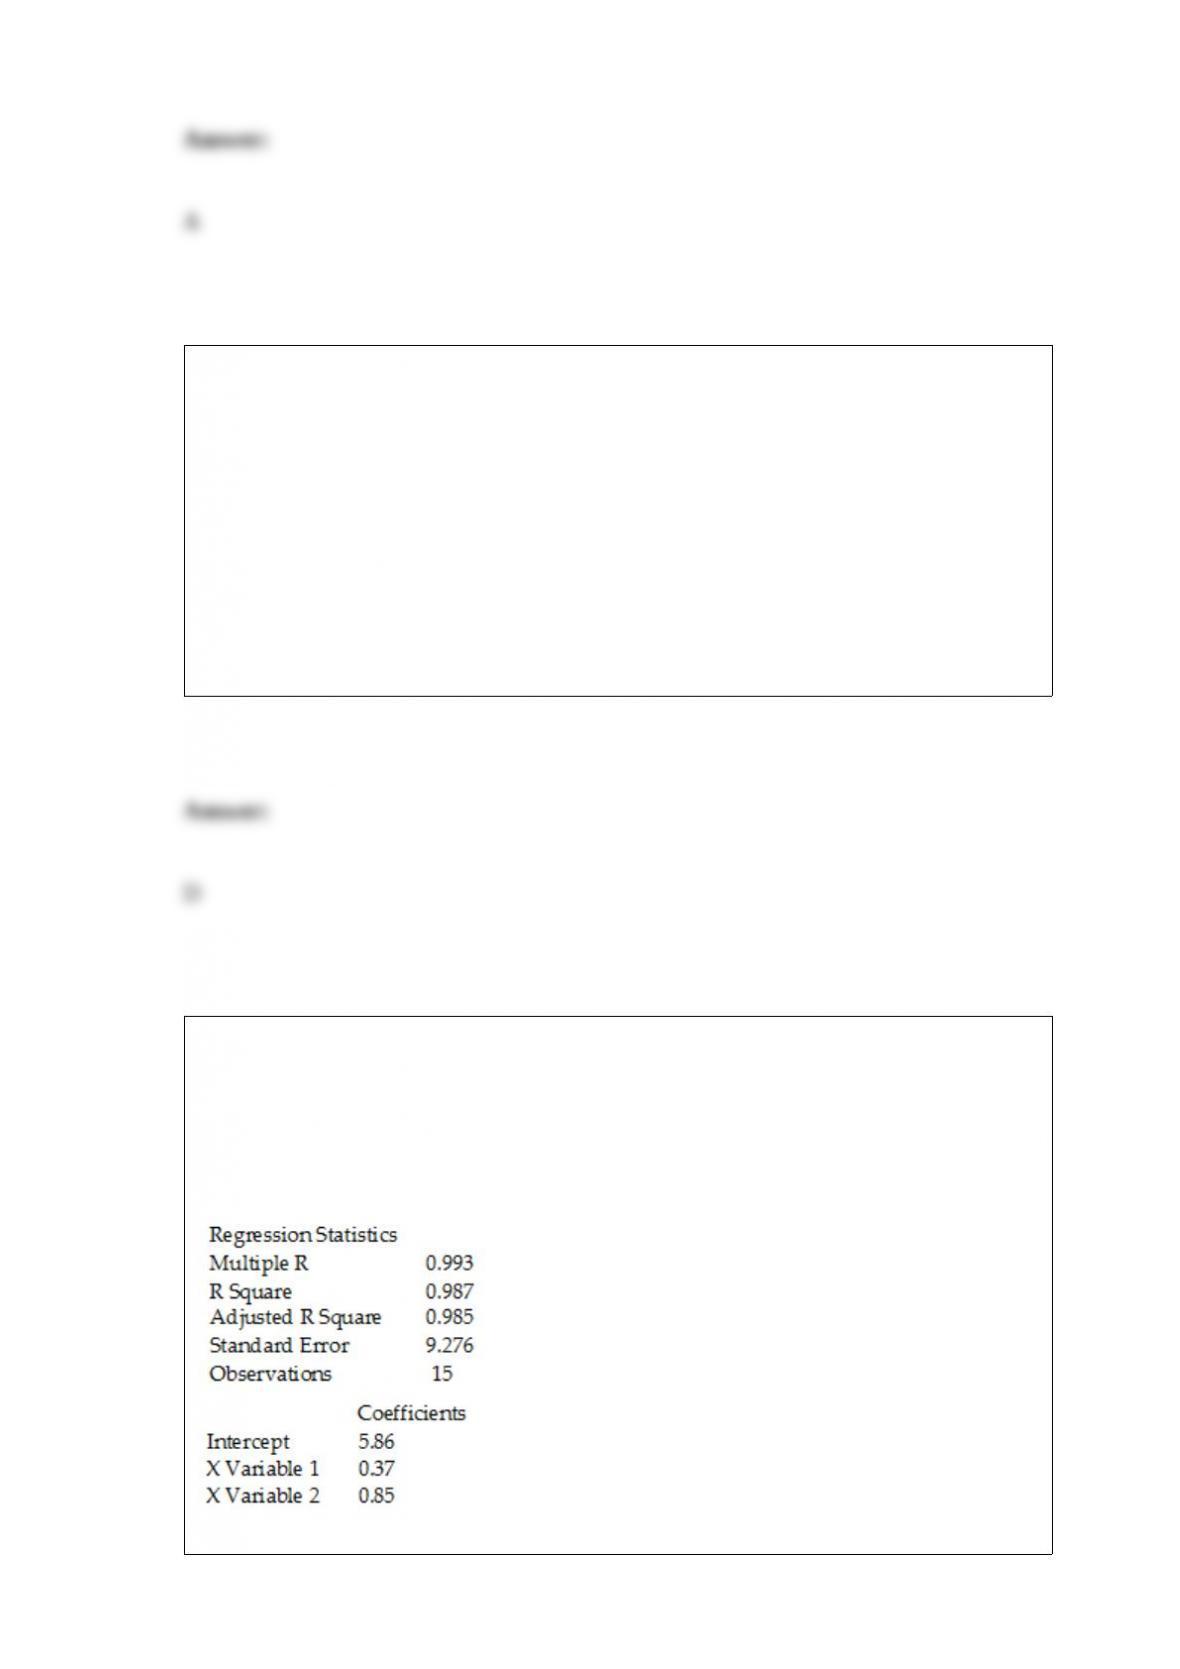
TABLE 14-17
Given below are results from the regression analysis where the
dependent variable is the number of weeks a worker is unemployed
due to a layo! (Unemploy) and the independent variables are the age

of the worker (Age) and a dummy variable for management position
(Manager: 1 = yes, 0 = no).
The results of the regression analysis are given below:
True or False: Referring to Table 14-17, there is suffcient evidence
that all of the explanatory variables are related to the number of
weeks a worker is unemployed due to a layo! at a 10% level of
signiticance.
True or False: TABLE 17-8
The superintendent of a school district wanted to predict the percentage of students
passing a sixth-grade proficiency test. She obtained the data on percentage of students
passing the proficiency test (% Passing), daily mean of the percentage of students
attending class (% Attendance), mean teacher salary in dollars (Salaries), and
instructional spending per pupil in dollars (Spending) of 47 schools in the state.
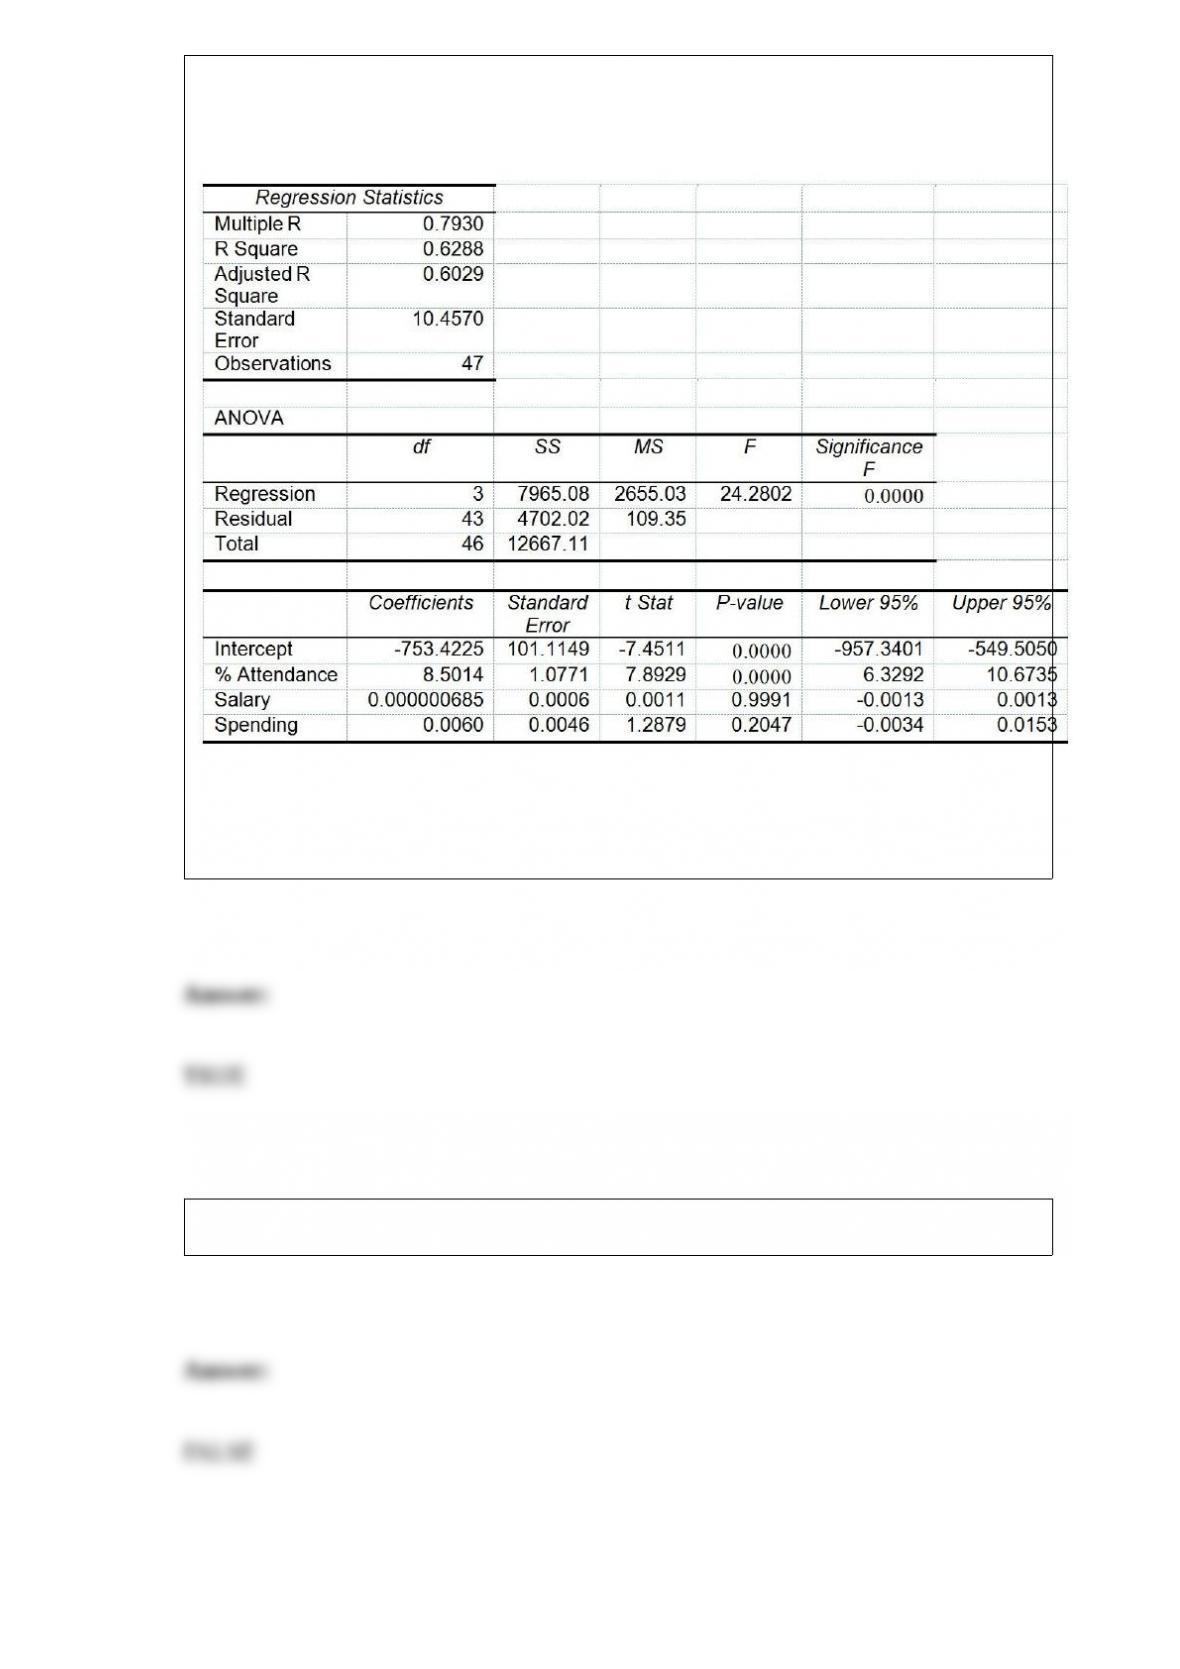
Following is the multiple regression output with Y = % Passing as the dependent
variable, X1 = % Attendance, X2 = Salaries and X3 = Spending:
Referring to Table 17-8, the null hypothesis should be rejected at a 5% level of
significance when testing whether the daily mean of the percentage of students
attending class has any effect on the percentage of students passing the proficiency test,
taking into account the effect of all the other independent variables.
True or False: A sample is always a good representation of the target population.
True or False: For a given level of significance, if the sample size is increased but the
summary statistics remain the same, the probability of committing a Type II error will
increase.
True or False: In estimating the population mean with the population standard deviation
unknown, if the sample size is 12, there will be 6 degrees of freedom.
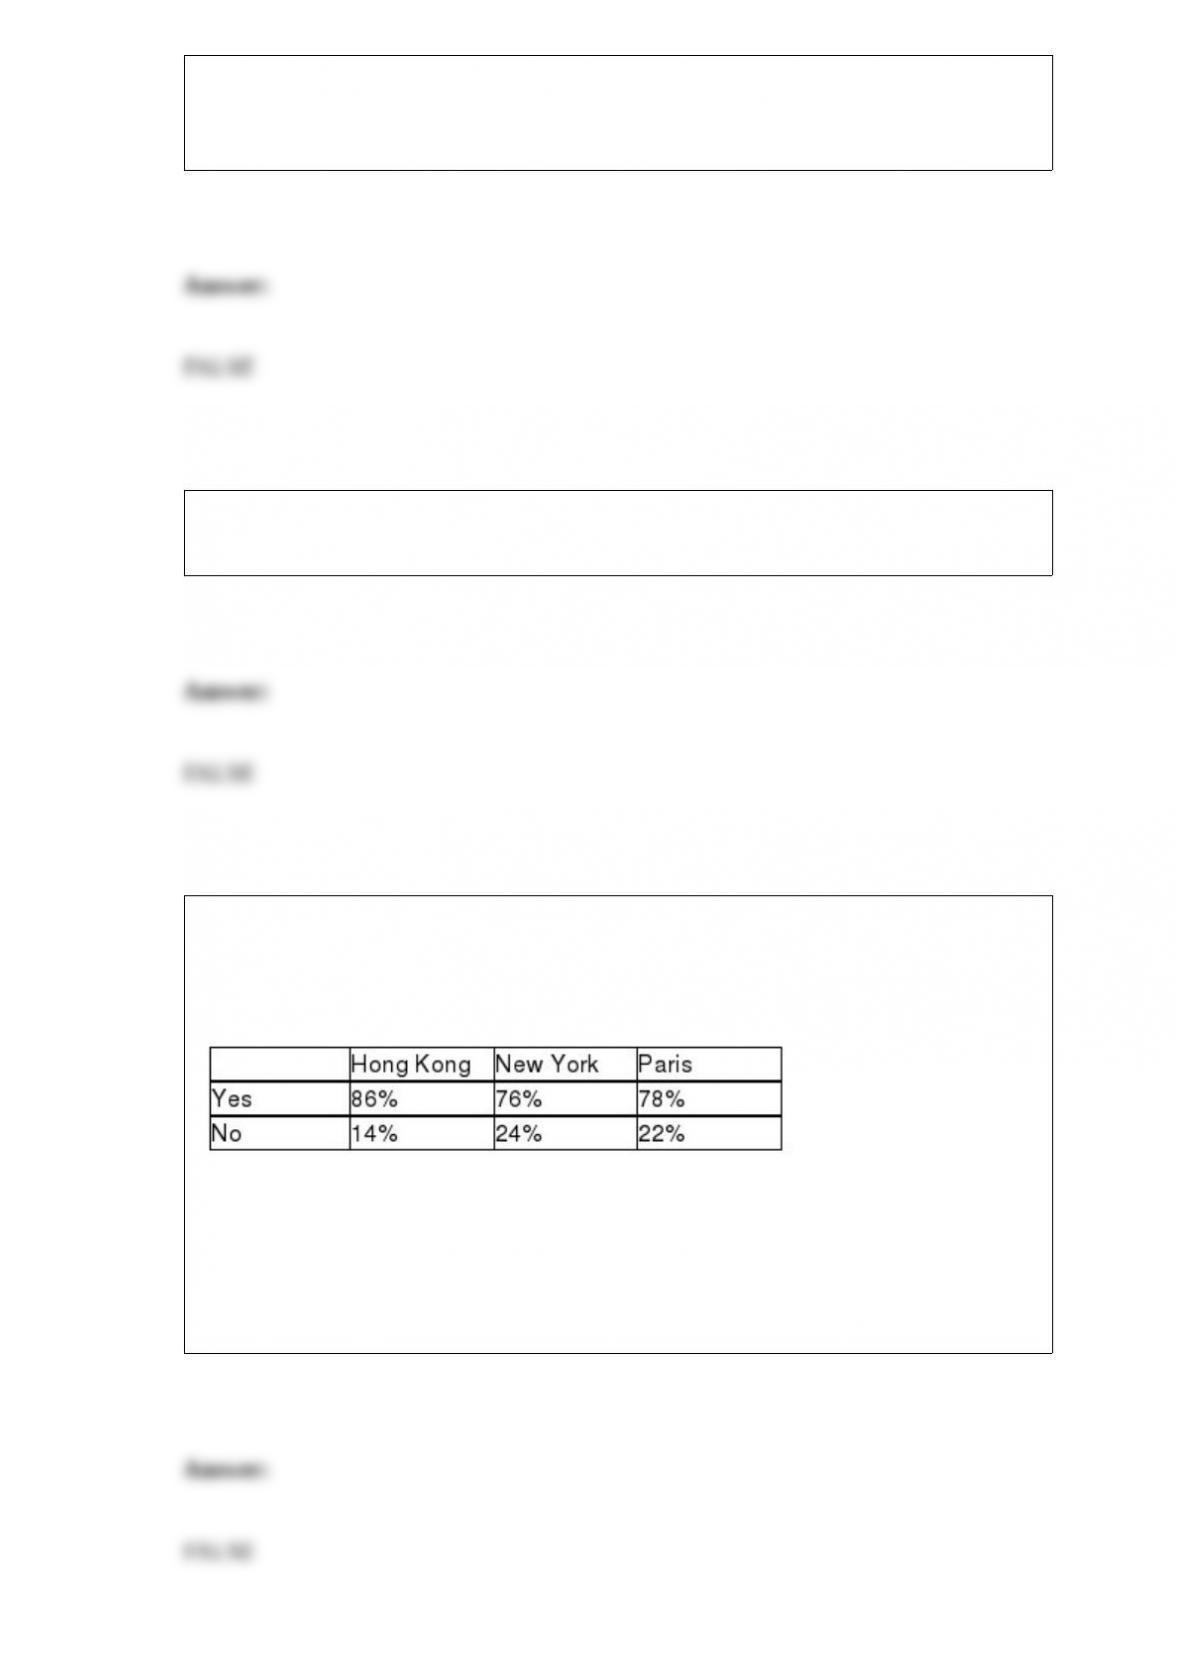
TABLE 12-7
Data on the percentage of 200 hotels in each of the three large cities across the world on
whether minibar charges are correctly posted at checkout are given below.
At the 0.05 level of significance, you want to know if there is evidence of a difference
in the proportion of hotels that correctly post minibar charges among the three cities.
True or False: Referring to Table 12-7, there is sufficient evidence to conclude that the
proportions between New York and Paris are different at a 0.05 level of significance.
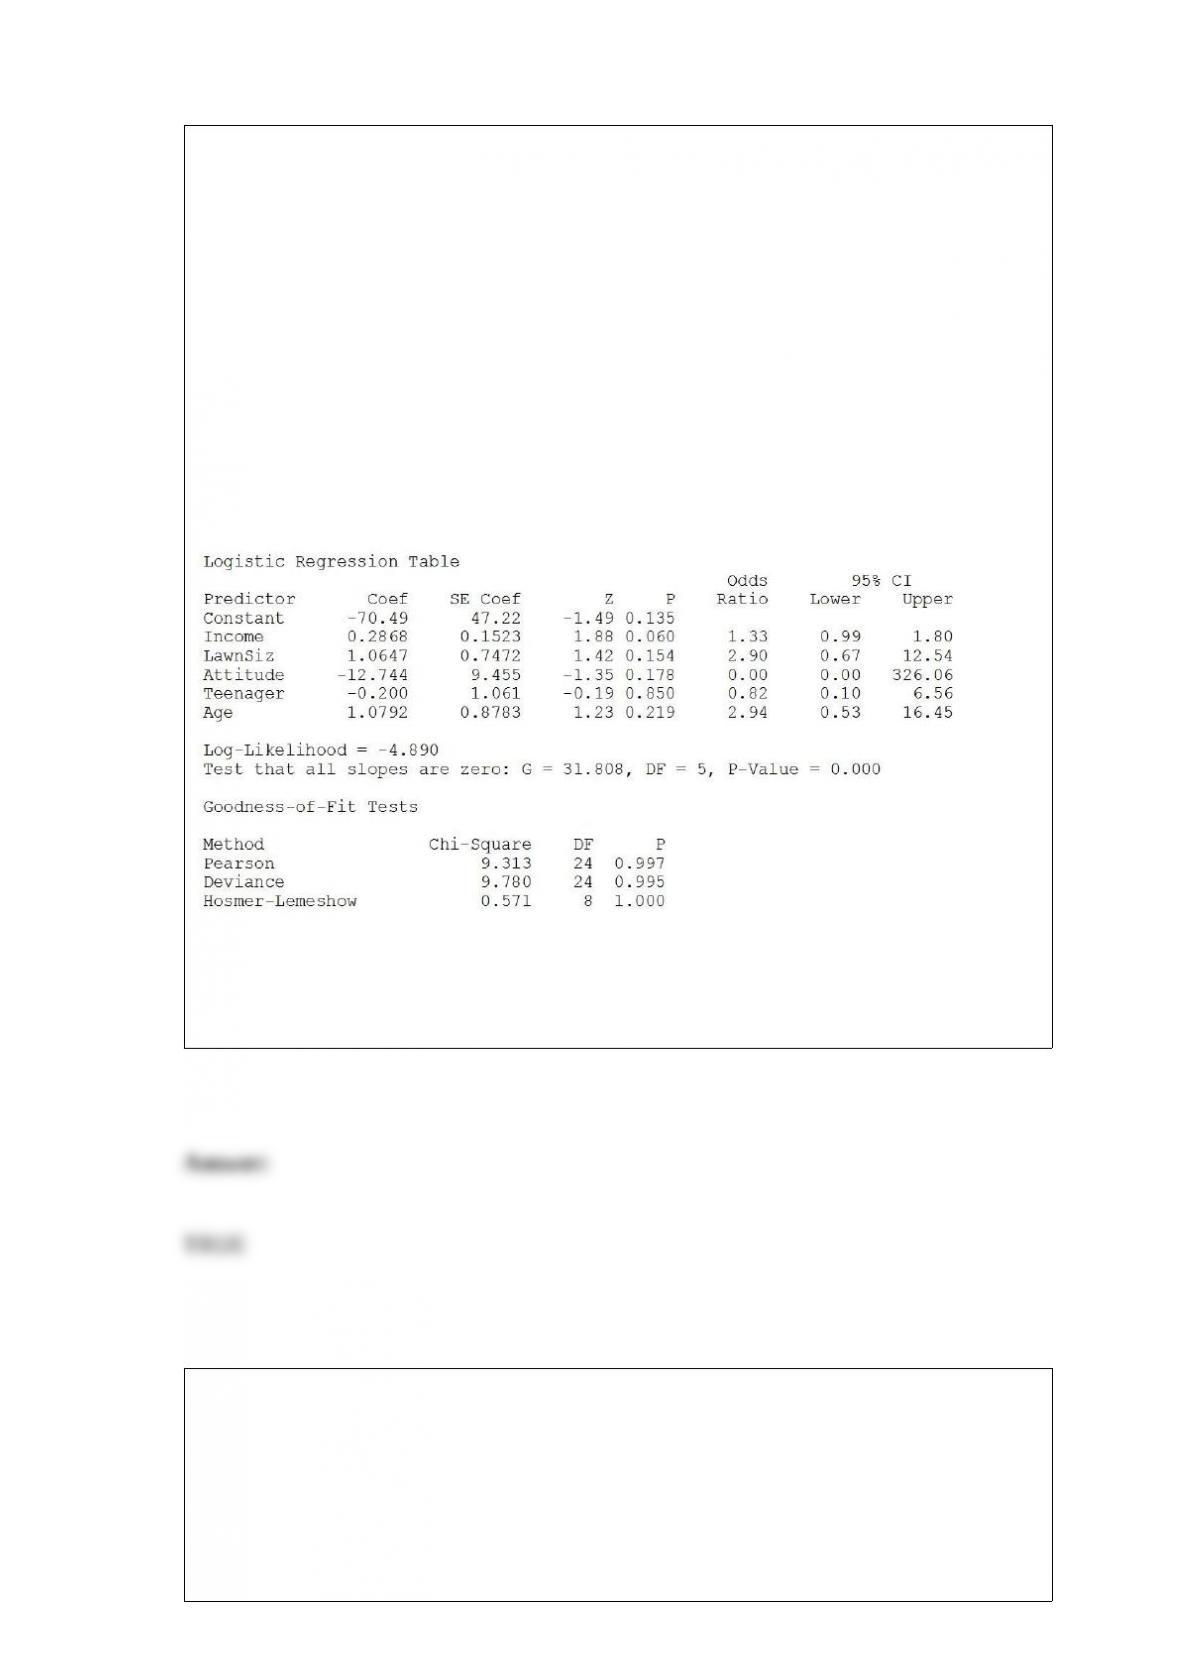
True or False: TABLE 17-12
The marketing manager for a nationally franchised lawn service company would like to
study the characteristics that differentiate home owners who do and do not have a lawn
service. A random sample of 30 home owners located in a suburban area near a large
city was selected; 15 did not have a lawn service (code 0) and 15 had a lawn service
(code 1). Additional information available concerning these 30 home owners includes
family income (Income, in thousands of dollars), lawn size (Lawn Size, in thousands of
square feet), attitude toward outdoor recreational activities (Attitude 0 = unfavorable, 1
= favorable), number of teenagers in the household (Teenager), and age of the head of
the household (Age).
The Minitab output is given below:
Referring to Table 17-12, there is not enough evidence to conclude that Attitude makes
a significant contribution to the model in the presence of the other independent
variables at a 0.05 level of significance.
TABLE 15-5
What are the factors that determine the acceleration time (in sec.) from 0 to 60 miles per
hour of a car? Data on the following variables for 171 different vehicle models were
collected:
Accel Time: Acceleration time in sec.
Cargo Vol: Cargo volume in cu. ft.
HP: Horsepower
MPG: Miles per gallon
SUV: 1 if the vehicle model is an SUV with Coupe as the base when SUV and Sedan
are both 0
Sedan: 1 if the vehicle model is a sedan with Coupe as the base when SUV and Sedan
are both 0
The coefficient of multiple determination ( ) for the regression model using each of
the 5 variables Xj as the dependent variable and all other X variables as independent
variables are, respectively, 0.7461, 0.5676, 0.6764, 0.8582, 0.6632.
True or False: Referring to Table 15-5, there is reason to suspect collinearity between
some pairs of predictors based on the values of the variance inflationary factor.
True or False: For a price index, it is preferable to select the base period in a period of
economic stability.
True or False: The V in the DCOVA framework stands for “visualize.”
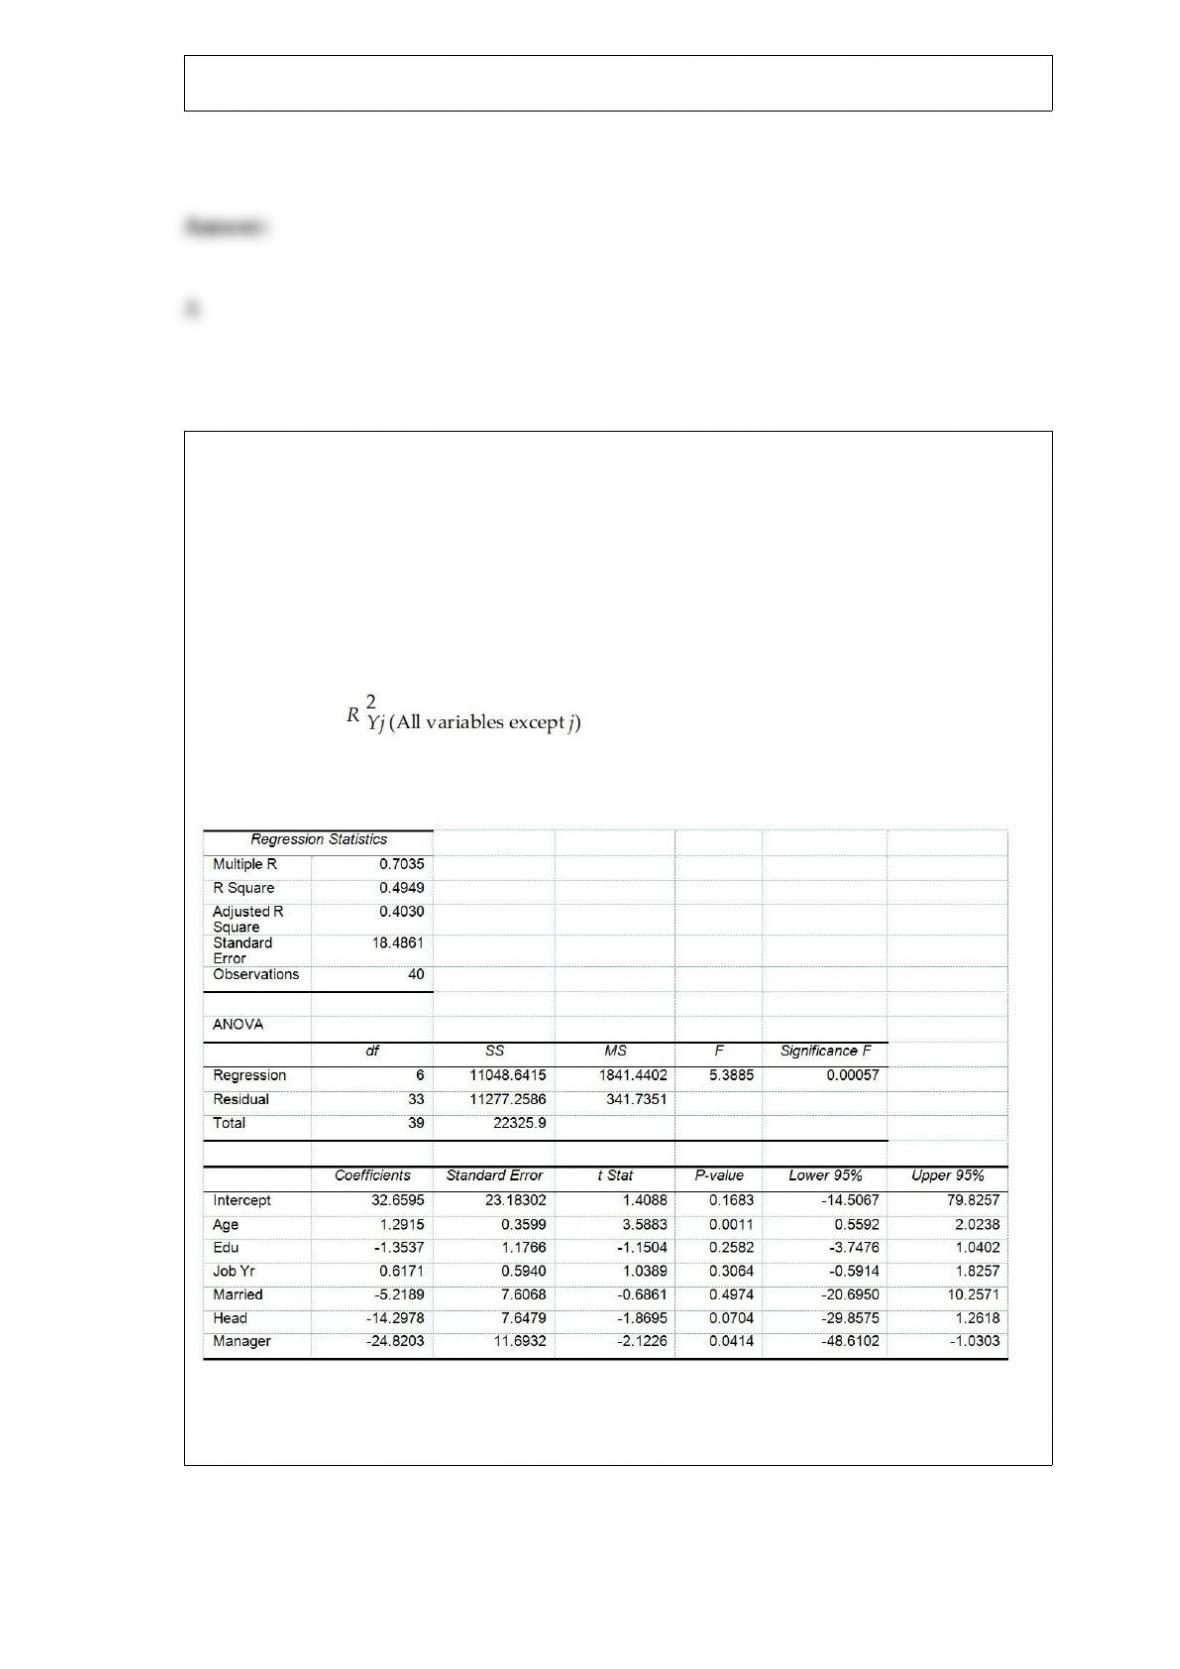
True or False: TABLE 17-10
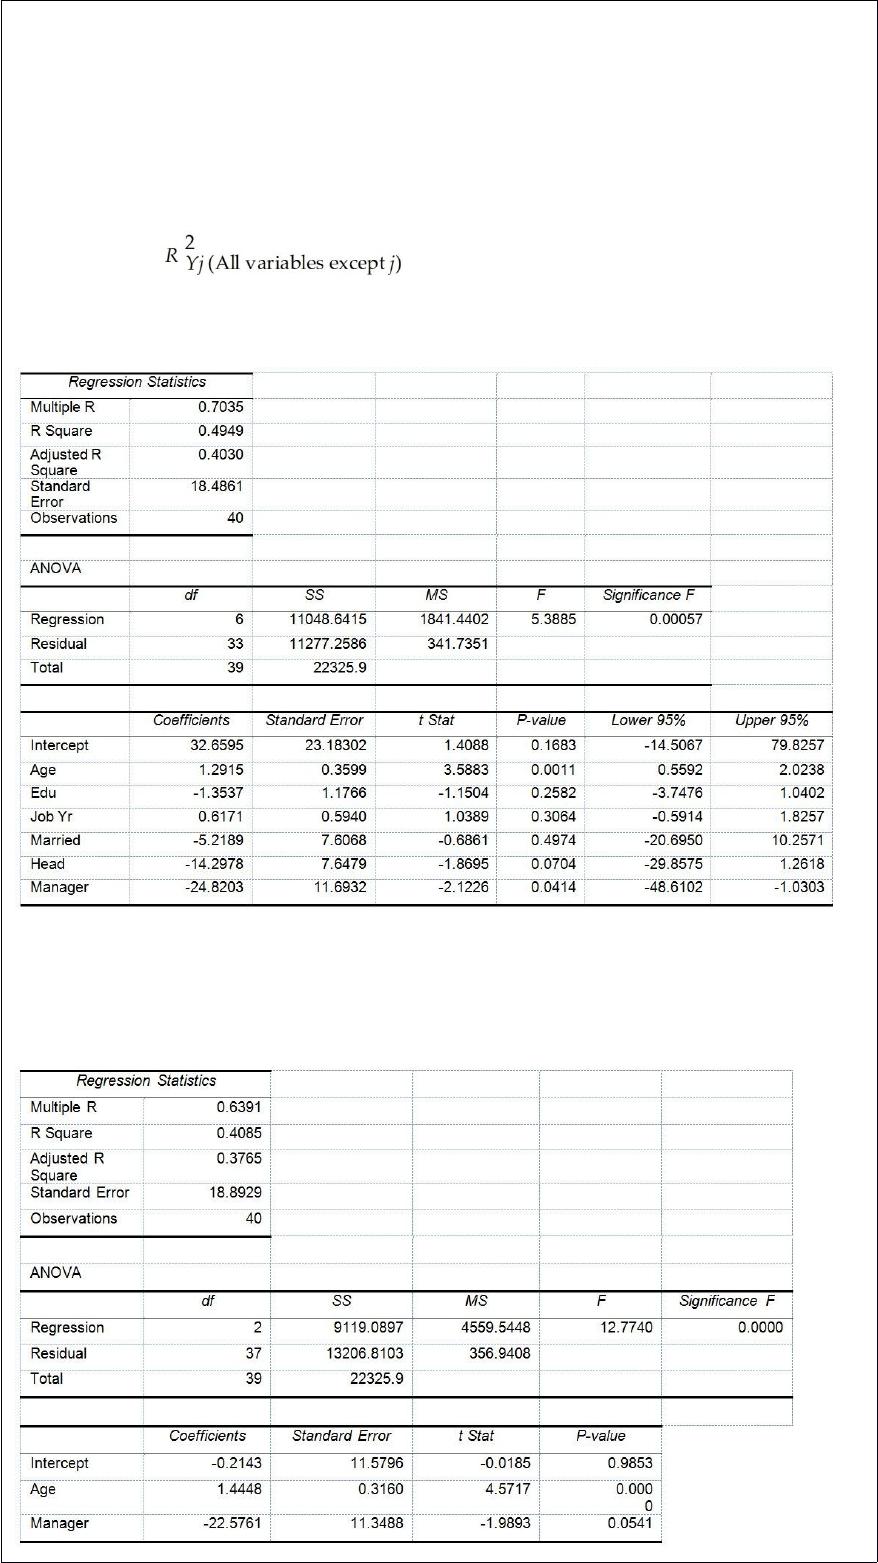
Given below are results from the regression analysis where the dependent variable is
the number of weeks a worker is unemployed due to a layoff (Unemploy) and the
independent variables are the age of the worker (Age), the number of years of education
received (Edu), the number of years at the previous job (Job Yr), a dummy variable for
marital status (Married: 1 = married, 0 = otherwise), a dummy variable for head of
household (Head: 1 = yes, 0 = no) and a dummy variable for management position
(Manager: 1 = yes, 0 = no). We shall call this Model 1. The coefficient of partial
determination ( ) of each of the 6 predictors are, respectively,
0.2807, 0.0386, 0.0317, 0.0141, 0.0958, and 0.1201.
Model 2 is the regression analysis where the dependent variable is Unemploy and the
independent variables are Age and Manager. The results of the regression analysis are
given below:
Referring to Table 17-10, Model 1, there is sufficient evidence that age has an effect on
the number of weeks a worker is unemployed due to a layoff while holding constant the
effect of all the other independent variables at a 10% level of significance.
True or False: Whether the university is private or public is an example of a nominal
scaled variable.
True or False: If P(A and B) = 1, then A and B must be collectively exhaustive.
TABLE 13-1
A large national bank charges local companies for using their services. A bank official
reported the results of a regression analysis designed to predict the bank’s charges (Y) –
measured in dollars per month – for services rendered to local companies. One
independent variable used to predict service charges to a company is the company’s
sales revenue (X) – measured in millions of dollars. Data for 21 companies who use the
bank’s services were used to fit the model:
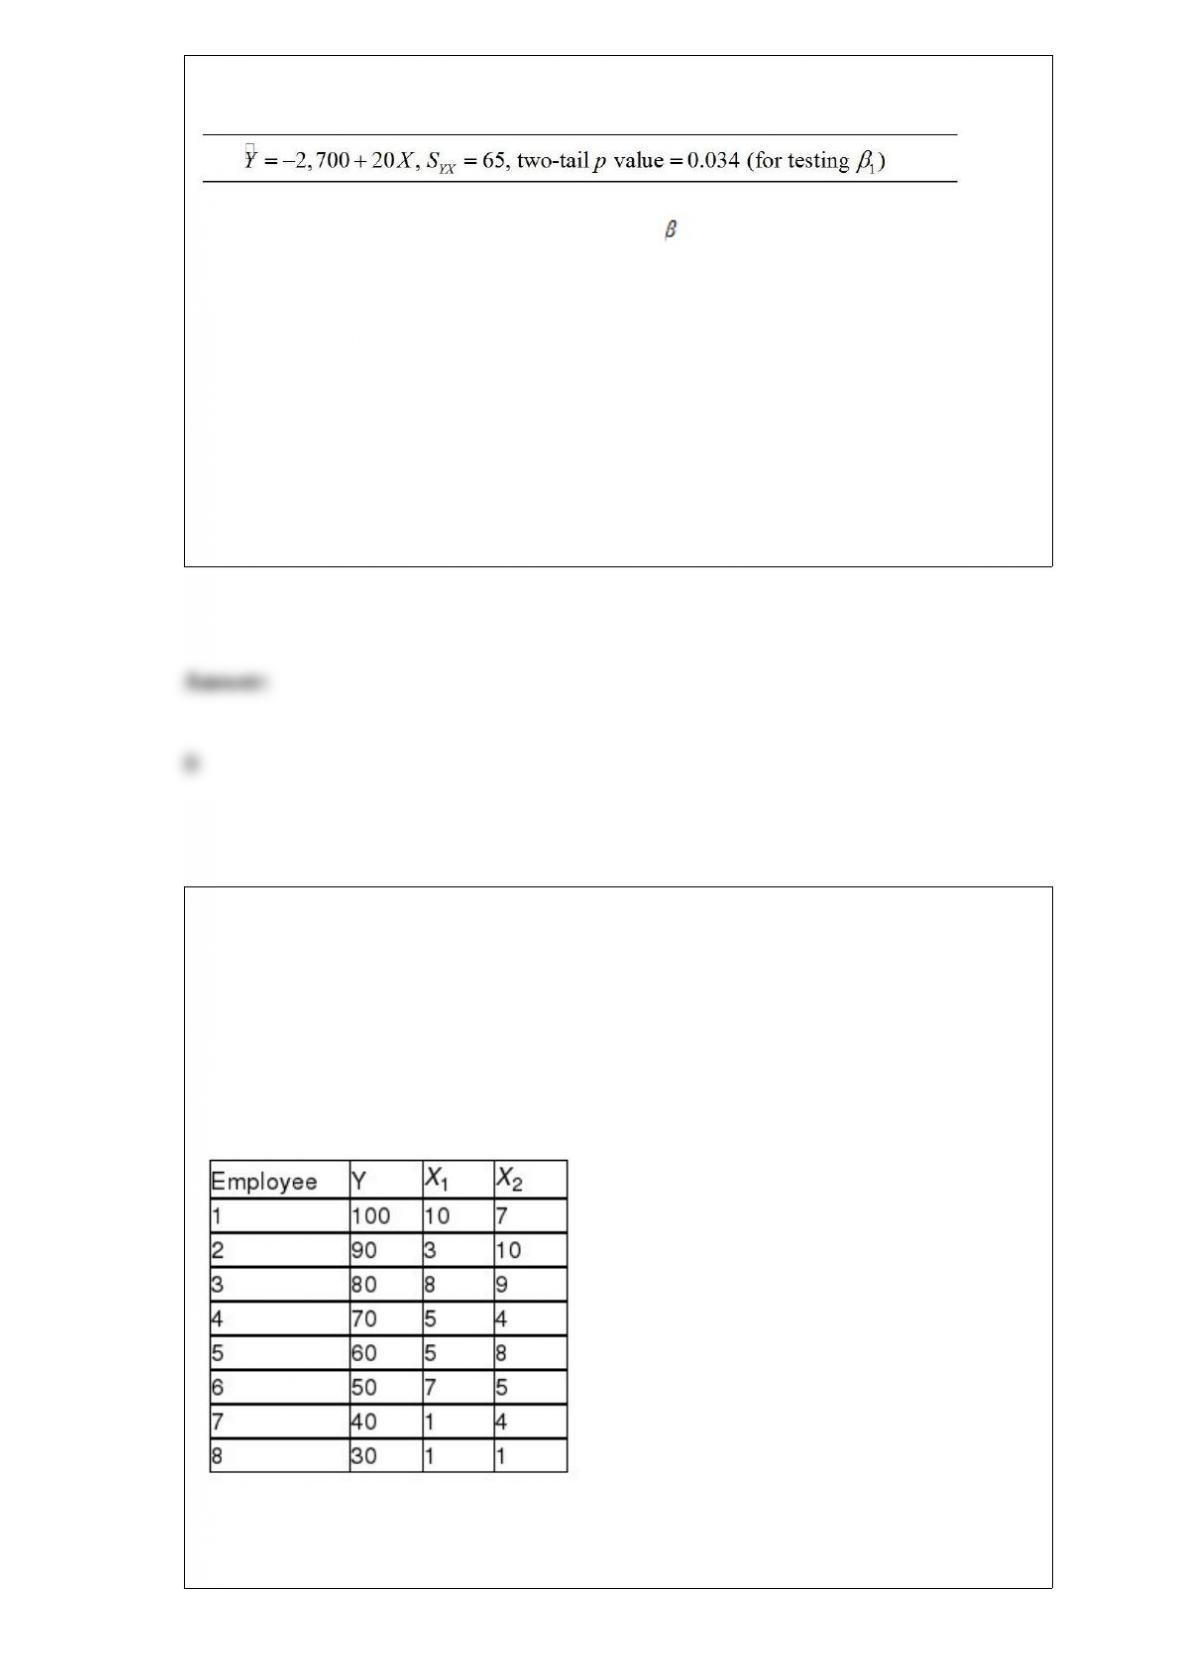
The results of the simple linear regression are provided below.
Referring to Table 13-1, interpret the estimate of 0, the Y-intercept of the line.
A) All companies will be charged at least $2,700 by the bank.
B) There is no practical interpretation since a sales revenue of $0 is a nonsensical value.
C) About 95% of the observed service charges fall within $2,700 of the least squares
line.
D) For every $1 million increase in sales revenue, we expect a service charge to
decrease $2,700.
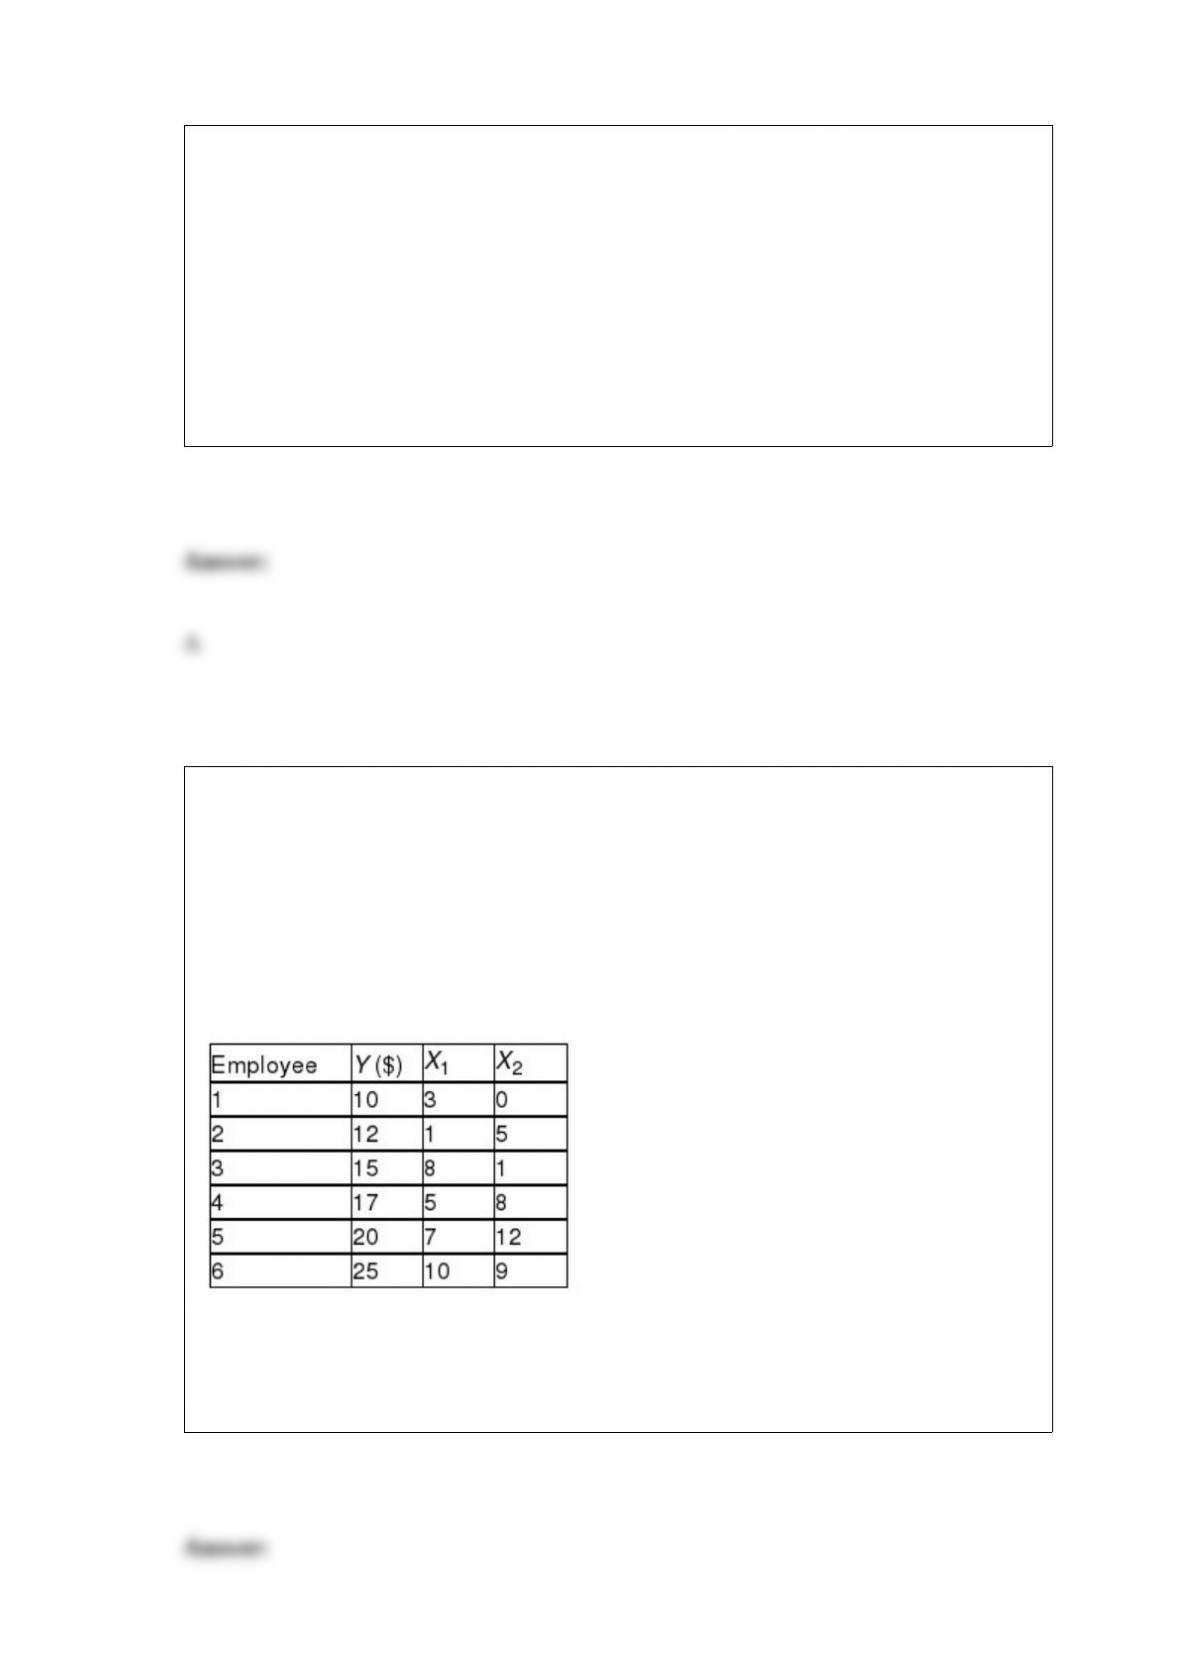
Referring to Table 14-1, if an employee who had been with the company 5 years scored
a 9 on the aptitude test, what would his estimated expected sales be?
TABLE 14-1
A manager of a product sales group believes the number of sales made by an employee
(Y) depends on how many years that employee has been with the company (X1) and
how he/she scored on a business aptitude test (X2). A random sample of 8 employees
provides the following:
A) 79.09
B) 60.88
C) 55.62
D) 17.98
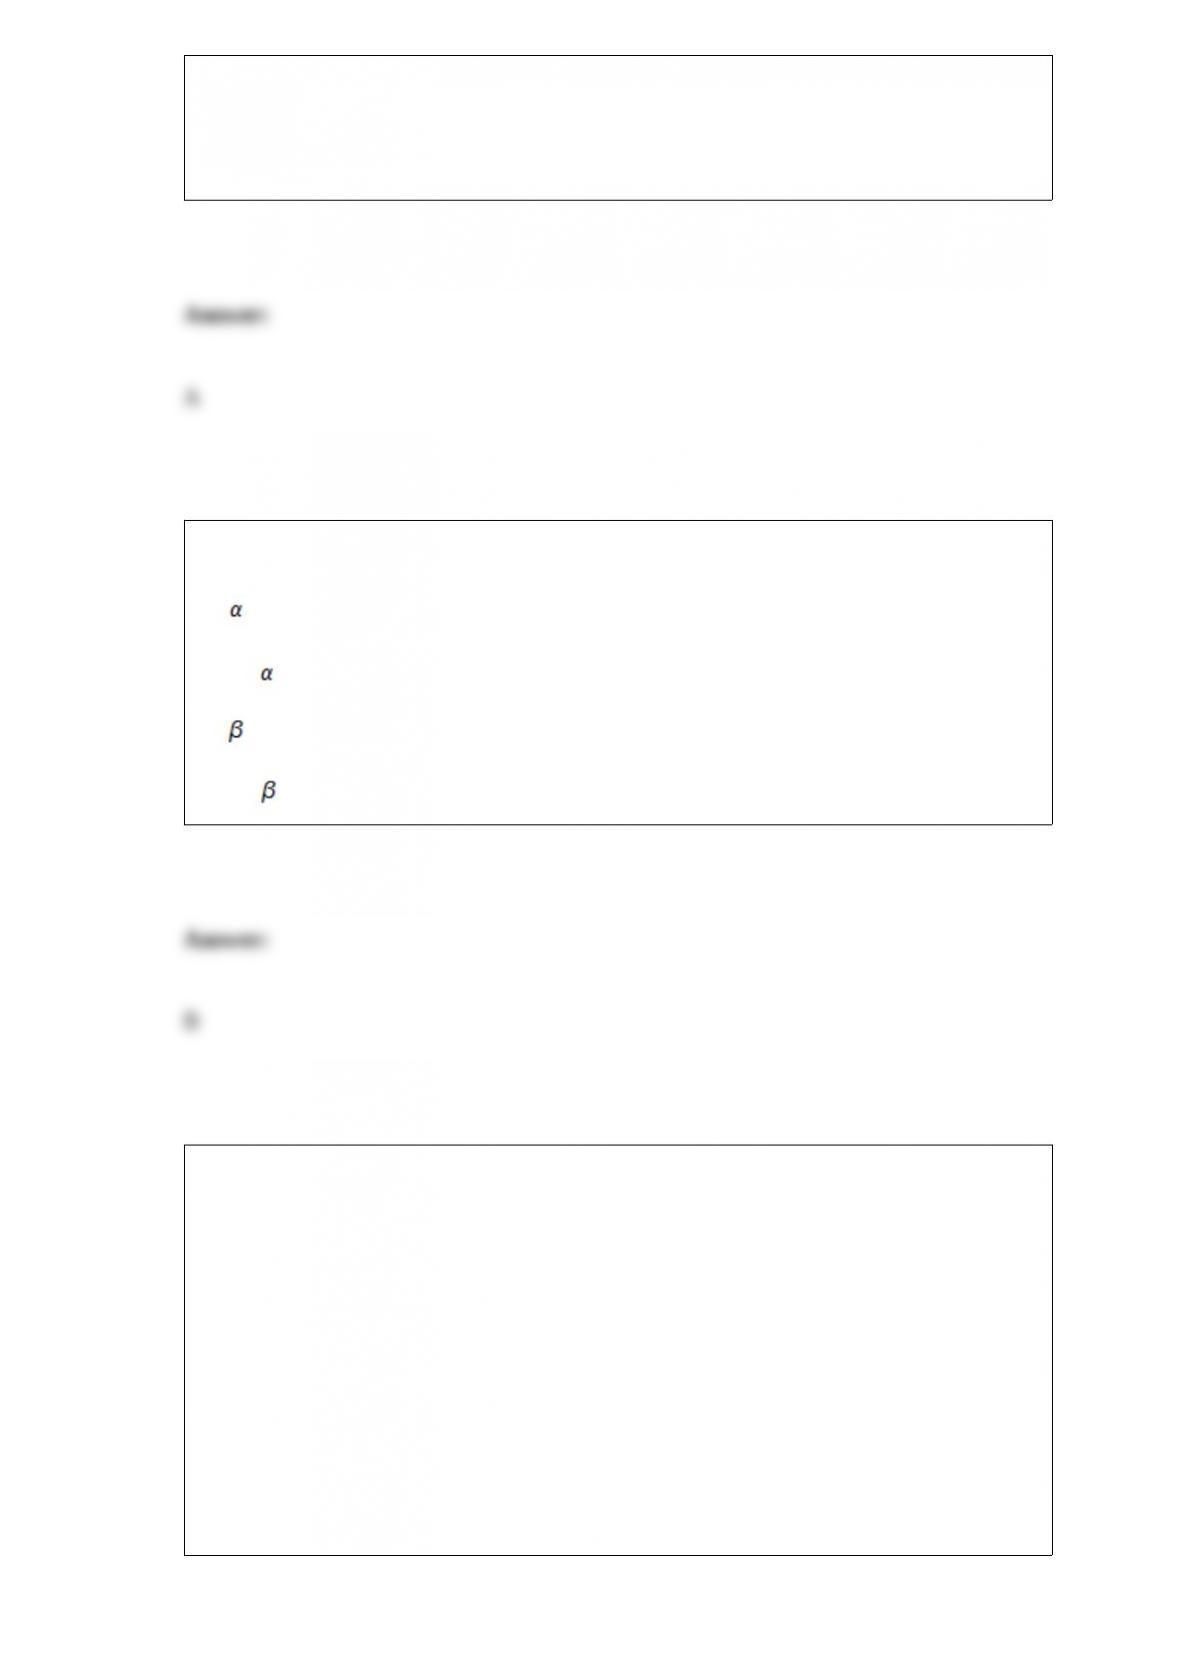
TABLE 17-10
Given below are results from the regression analysis where the dependent variable is
the number of weeks a worker is unemployed due to a layoff (Unemploy) and the
independent variables are the age of the worker (Age), the number of years of education
received (Edu), the number of years at the previous job (Job Yr), a dummy variable for
marital status (Married: 1 = married, 0 = otherwise), a dummy variable for head of
household (Head: 1 = yes, 0 = no) and a dummy variable for management position
(Manager: 1 = yes, 0 = no). We shall call this Model 1. The coefficient of partial
determination ( ) of each of the 6 predictors are, respectively,
0.2807, 0.0386, 0.0317, 0.0141, 0.0958, and 0.1201.
Model 2 is the regression analysis where the dependent variable is Unemploy and the
independent variables are Age and Manager. The results of the regression analysis are
given below:
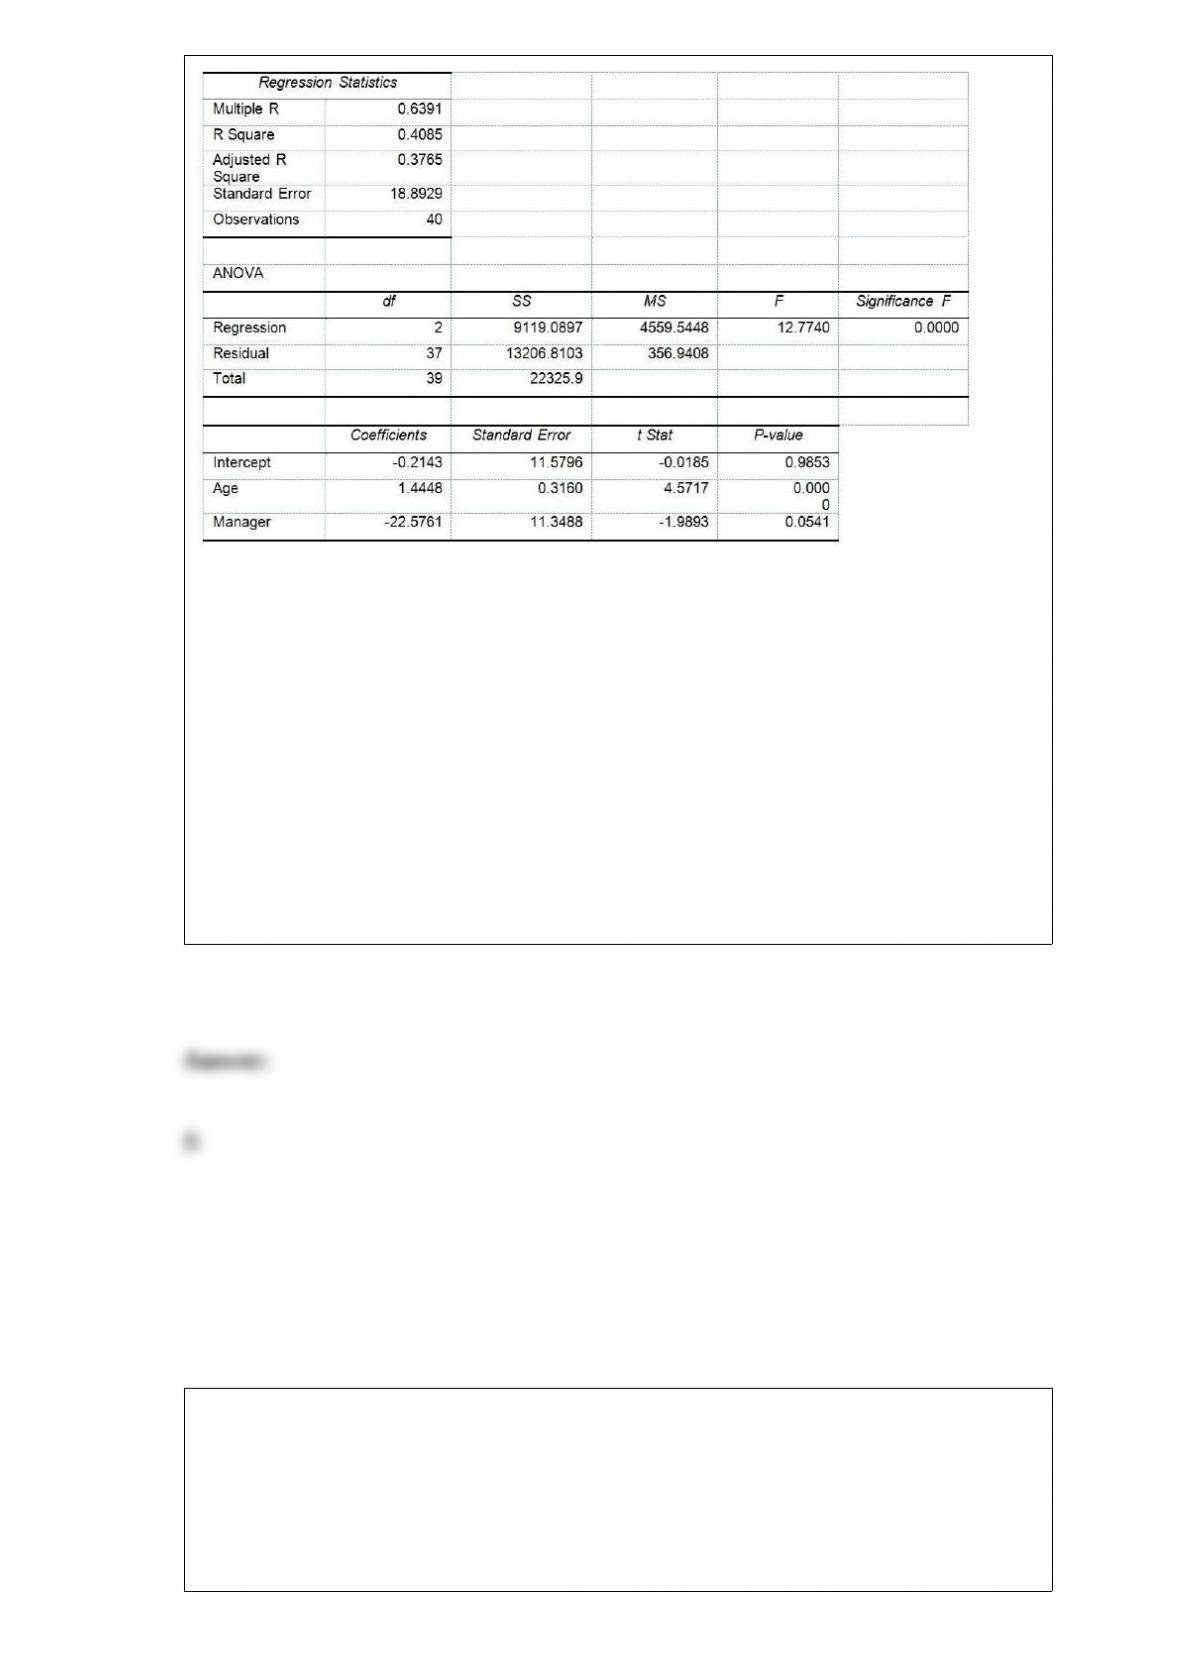
Referring to Table 17-10, Model 1, which of the following is a correct statement?
A) On average, a worker who is a year older is estimated to stay jobless longer by
approximately 32.66 weeks while holding constant the effects of all the remaining
independent variables.
B) On average, a worker who is a year older is estimated to stay jobless longer by
approximately 1.29 weeks while holding constant the effects of all the remaining
independent variables.
C) On average, a worker who is a year older is estimated to stay jobless shorter by
approximately 1.35 weeks while holding constant the effects of all the remaining
independent variables.
D) On average, a worker who is a year older is estimated to stay jobless longer by
approximately 0.62 weeks while holding constant the effects of all the remaining
independent variables.
A company has 125 personal computers. The probability that any one of them will
require repair on a given day is 0.025. To find the probability that exactly 20 of the
computers will require repair on a given day, one will use what type of probability
distribution?
A) Binomial distribution
B) Poisson distribution
C) Hypergeometric distribution
D) None of the above
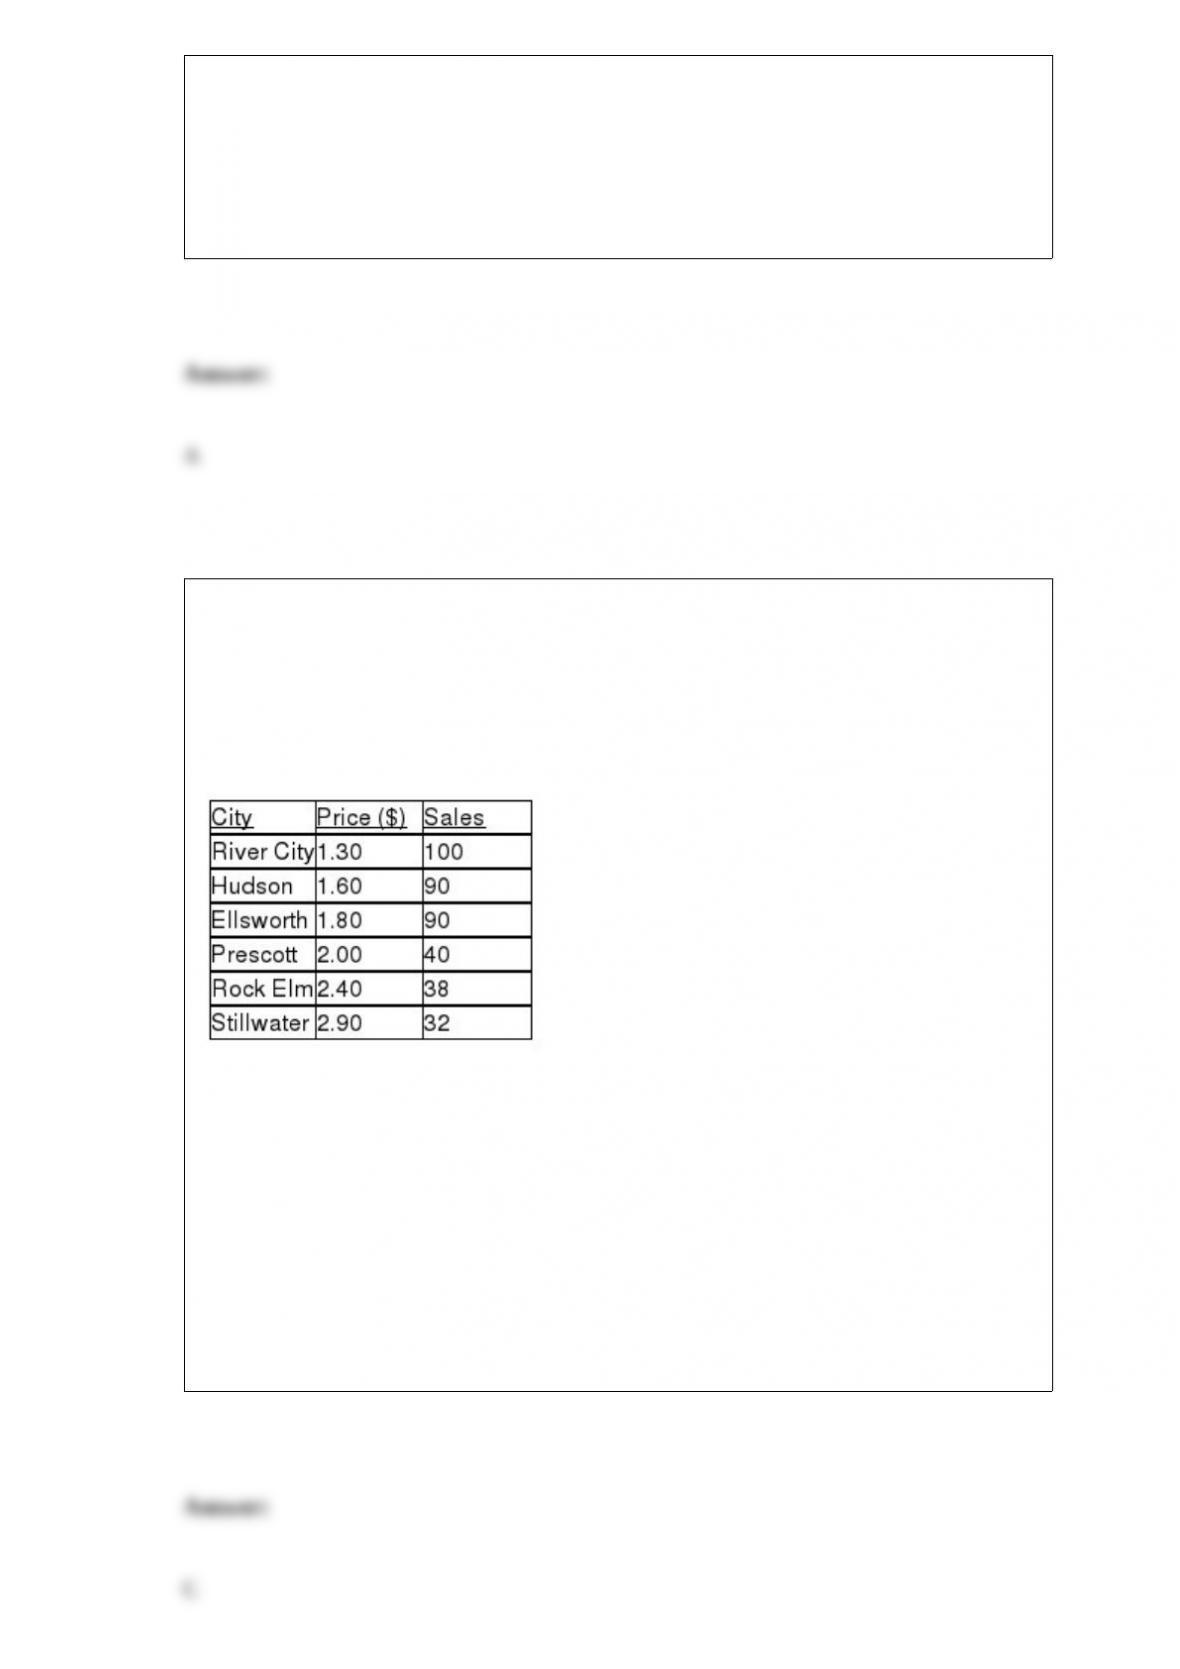
TABLE 13-2
A candy bar manufacturer is interested in trying to estimate how sales are influenced by
the price of their product. To do this, the company randomly chooses 6 small cities and
offers the candy bar at different prices. Using candy bar sales as the dependent variable,
the company will conduct a simple linear regression on the data below:
Referring to Table 13-2, what is the percentage of the total variation in candy bar sales
explained by the regression model?
A) 100%
B) 88.54%
C) 78.39%
D) 48.19%

According to a survey of American households, the probability that the residents own 2
cars if annual household income is over $50,000 is 80%. Of the households surveyed,
60% had incomes over $50,000 and 70% had 2 cars. The probability that the residents
of a household own 2 cars and have an income less than or equal to $50,000 a year is
A) 0.12.
B) 0.18.
C) 0.22.
D) 0.48.
TABLE 9-5
A bank tests the null hypothesis that the mean age of the bank’s mortgage holders is less
than or equal to 45 years, versus an alternative that the mean age is greater than 45
years. They take a sample and calculate a p-value of 0.0202.
Referring to Table 9-5, if the same sample was used to test the opposite one-tail test,
what would be that test’s p-value?
A) 0.0202
B) 0.0404
C) 0.9596
D) 0.9798
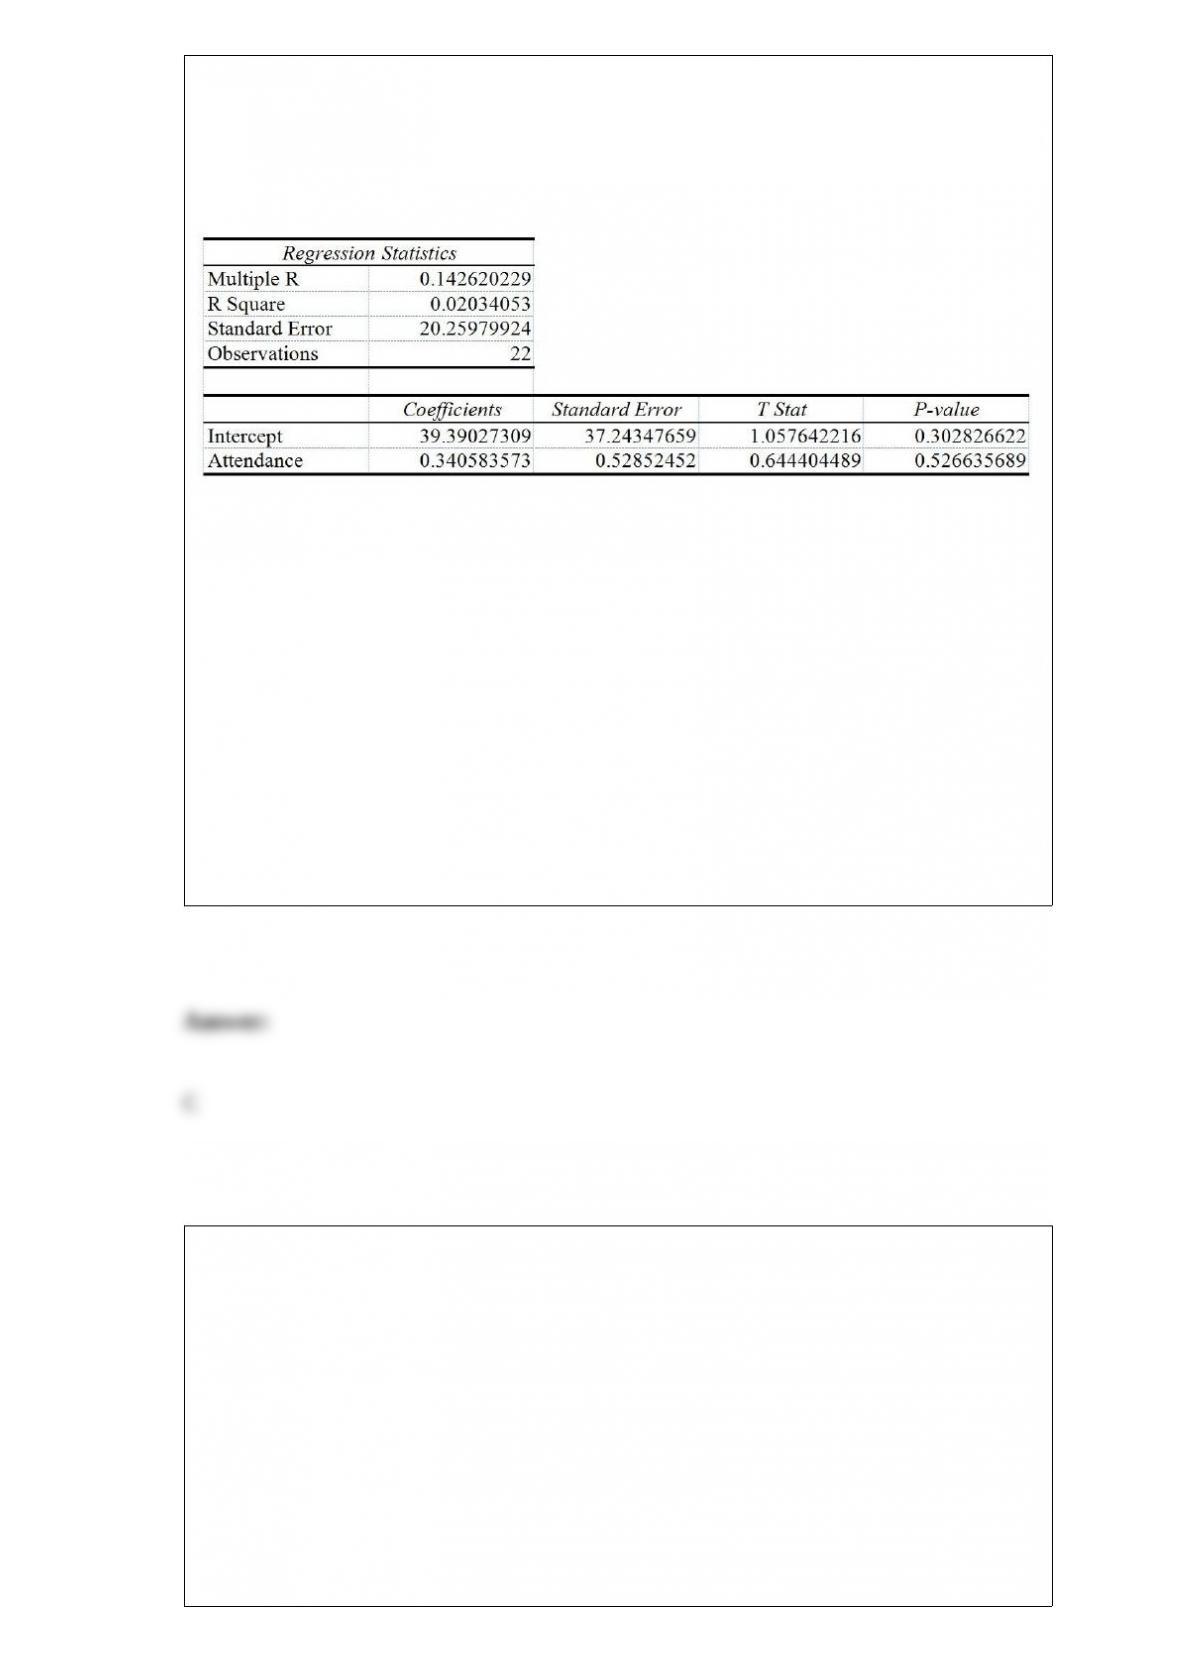
TABLE 13-6
The following Excel tables are obtained when “Score received on an exam (measured in
percentage points)” (Y) is regressed on “percentage attendance” (X) for 22 students in a
Statistics for Business and Economics course.
Referring to Table 13-6, which of the following statements is true?
A) 14.26% of the total variability in score received can be explained by percentage
attendance.
B) 14.2% of the total variability in percentage attendance can be explained by score
received.
C) 2% of the total variability in score received can be explained by percentage
attendance.
D) 2% of the total variability in percentage attendance can be explained by score
received.
What type of probability distribution will the consulting firm most likely employ to
analyze the insurance claims in the following problem?
An insurance company has called a consulting firm to determine if the company has an
unusually high number of false insurance claims. It is known that the industry
proportion for false claims is 3%. The consulting firm has decided to randomly and
independently sample 100 of the company’s insurance claims. They believe the number
of these 100 that are false will yield the information the company desires.
A) Binomial distribution
B) Poisson distribution
C) Hypergeometric distribution
D) None of the above
The symbol for the confidence coefficient of a statistical test is
A) .
B) 1 – .
C) .
D) 1 – .
The probability that house sales will increase in the next 6 months is estimated to be
0.25. The probability that the interest rates on housing loans will go up in the same
period is estimated to be 0.74. The probability that house sales or interest rates will go
up during the next 6 months is estimated to be 0.89. The probability that both house
sales and interest rates will increase during the next 6 months is
A) 0.10.
B) 0.185.
C) 0.705.
D) 0.90.
Suppose students arrive at an advising office at a rate of 30 per hour. Which of the
following distributions would you use to determine the probability that the next two
students will arrive 30 minutes apart?
A) Normal distribution
B) Poisson distribution
C) Uniform distribution
D) Exponential distribution
TABLE 16-11
The manager of a health club has recorded mean attendance in newly introduced step
classes over the last 15 months: 32.1, 39.5, 40.3, 46.0, 65.2, 73.1, 83.7, 106.8, 118.0,
133.1, 163.3, 182.8, 205.6, 249.1, and 263.5. She then used Microsoft Excel to obtain
the following partial output for both a first- and second-order autoregressive model.
SUMMARY OUTPUT – 2nd Order Model
SUMMARY OUTPUT – 1st Order Model
Referring to Table 16-11, using the first-order model, the forecast of mean attendance
for month 16 is ________.
The Journal of Business Venturing reported on the activities of entrepreneurs during the
organization creation process. As part of a designed study, a total of 71 entrepreneurs
were interviewed and divided into 3 groups: those that were successful in founding a
new firm (n1 = 34), those still actively trying to establish a firm (n2 = 21), and those
who tried to start a new firm but eventually gave up (n3 = 16). The total number of
activities undertaken (e.g., developed a business plan, sought funding, looked for
facilities) by each group over a specified time period during organization creation was
measured. The objective is to compare the mean number of activities of the 3 groups of
entrepreneurs. Because of concerns over necessary assumption of the parametric
analysis, it was decided to use a nonparametric analysis. Identify the nonparametric
method that would be used to analyze the data.
A) Wilcoxon Rank Sum Test
B) McNemar Test
C) Kruskal-Wallis Rank Test
D) One-way ANOVA F test
In the construction of confidence intervals, if all other quantities are unchanged, an
increase in the sample size will lead to a ________ interval.
A) narrower
B) wider
C) less significant
D) biased
Referring to Table 14-2, for these data, what is the estimated coefficient for
performance rating, b1?
TABLE 14-2
A professor of industrial relations believes that an individual’s wage rate at a factory (Y)
depends on his performance rating (X1) and the number of economics courses the
employee successfully completed in college (X2). The professor randomly selects 6
workers and collects the following information:
A) 0.616
B) 1.054
C) 6.932
D) 9.103

Referring to Table 14-14, the 1tted model for predicting mileages for
4-cylinder cars is ________.
TABLE 14-14
An automotive engineer would like to be able to predict automobile
mileages. She believes that the two most important characteristics
that a!ect mileage are horsepower and the number of cylinders (4 or
6) of a car. She believes that the appropriate model is
Y = 40 – 0.05X1 + 20X2 – 0.1X1X2
where X1 = horsepower
X2 = 1 if 4 cylinders, 0 if 6 cylinders
Y = mileage
A) 40 – 0.05X1
B) 40 – 0.10X1
C) 60 – 0.10X1
D) 60 – 0.15X1
True or False: The Analysis of Means (ANOM) is more appropriate if you want to
identify the group(s) that has(have) a higher or lower mean than the overall mean while
the One-Way Analysis of Variance (One-way ANOVA) is more appropriate when you
just want to see if the means of all the different groups are the same.
Which of the following yields a stratified sample?
A) All students in a class are divided into groups of 15. One student is randomly chosen
from the 1st group, the remaining observations are every 15th student thereafter.
B) The best 15 students, according to the opinion of the instructor, in a class are
selected.
C) All students in a class are grouped according to their gender. A random sample of 8
is selected from the males and a separate random sample of 7 is drawn from the
females.
D) The first 15 students in a class are selected without replacement.
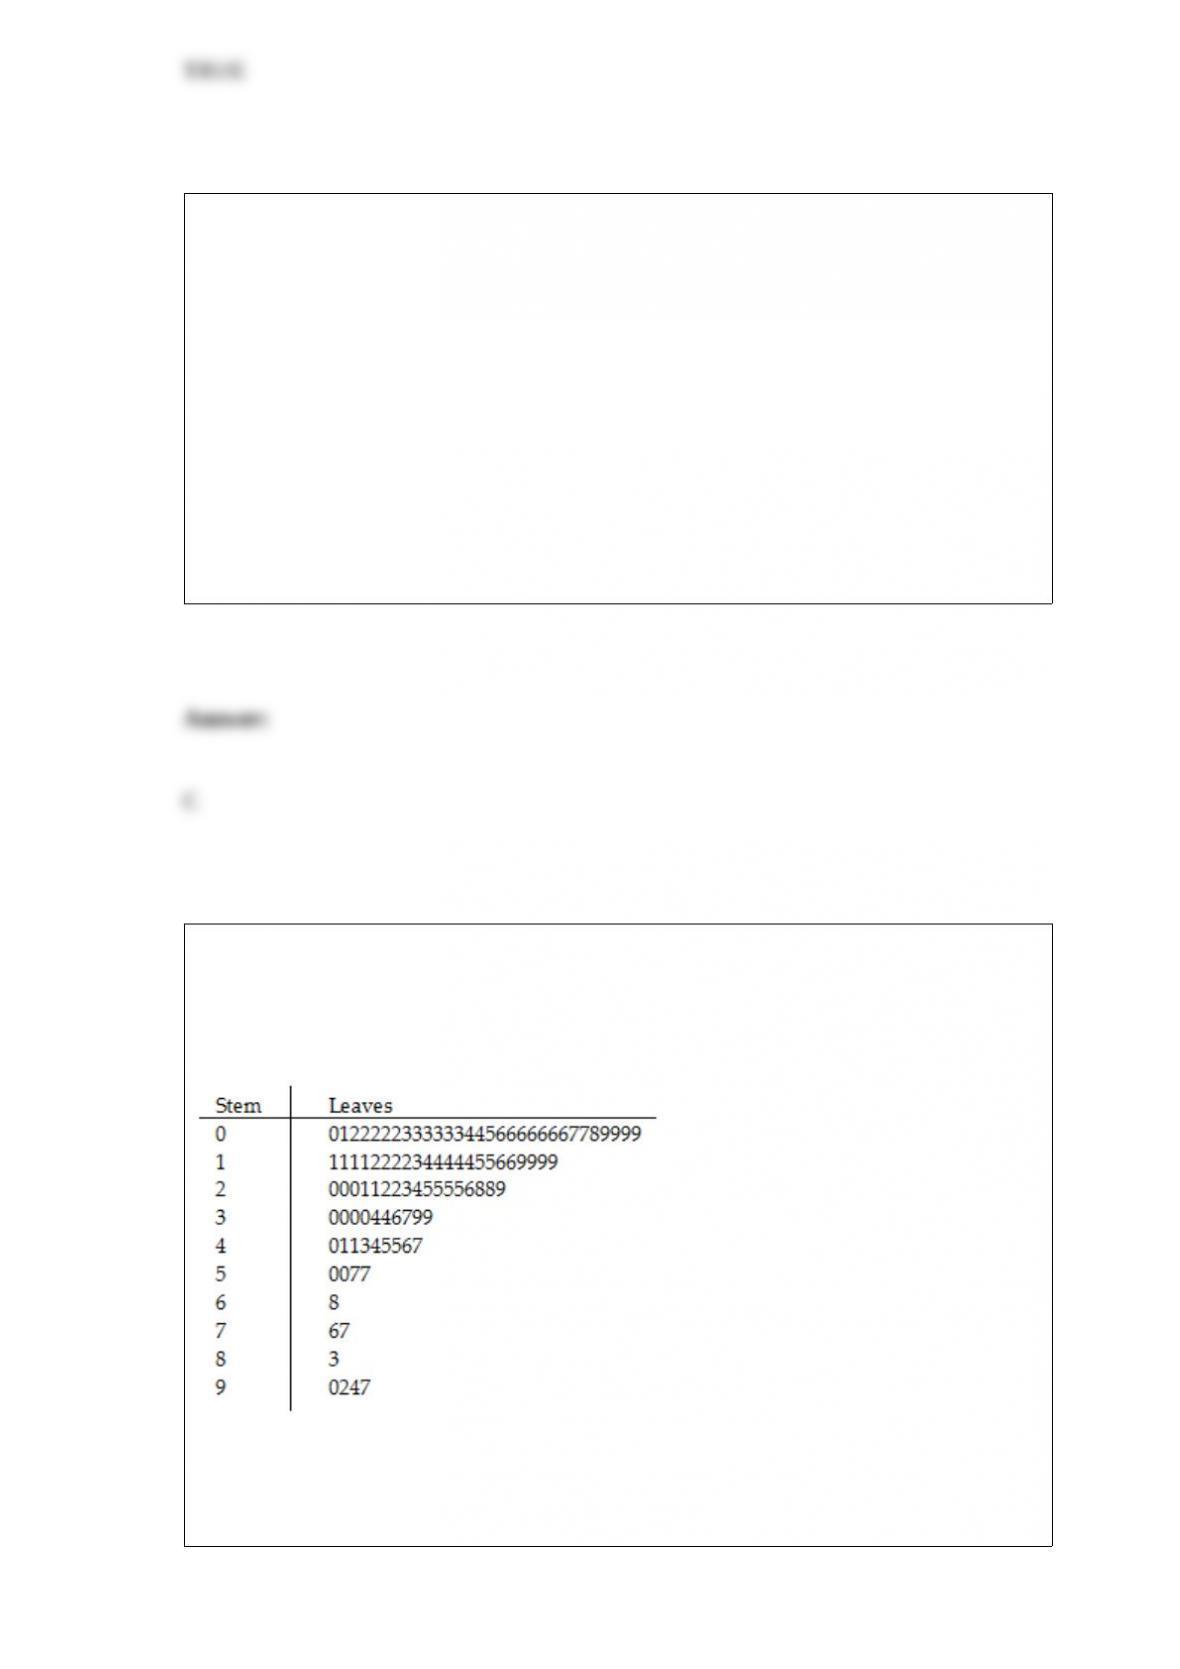
TABLE 2-8
The Stem-and-Leaf display represents the number of times in a year that a random
sample of 100 “lifetime” members of a health club actually visited the facility.
Referring to Table 2-8, if a frequency distribution with equal sized classes was made
from this data, and the first class was “0 but less than 10,” the class midpoint of the
third class would be ________.
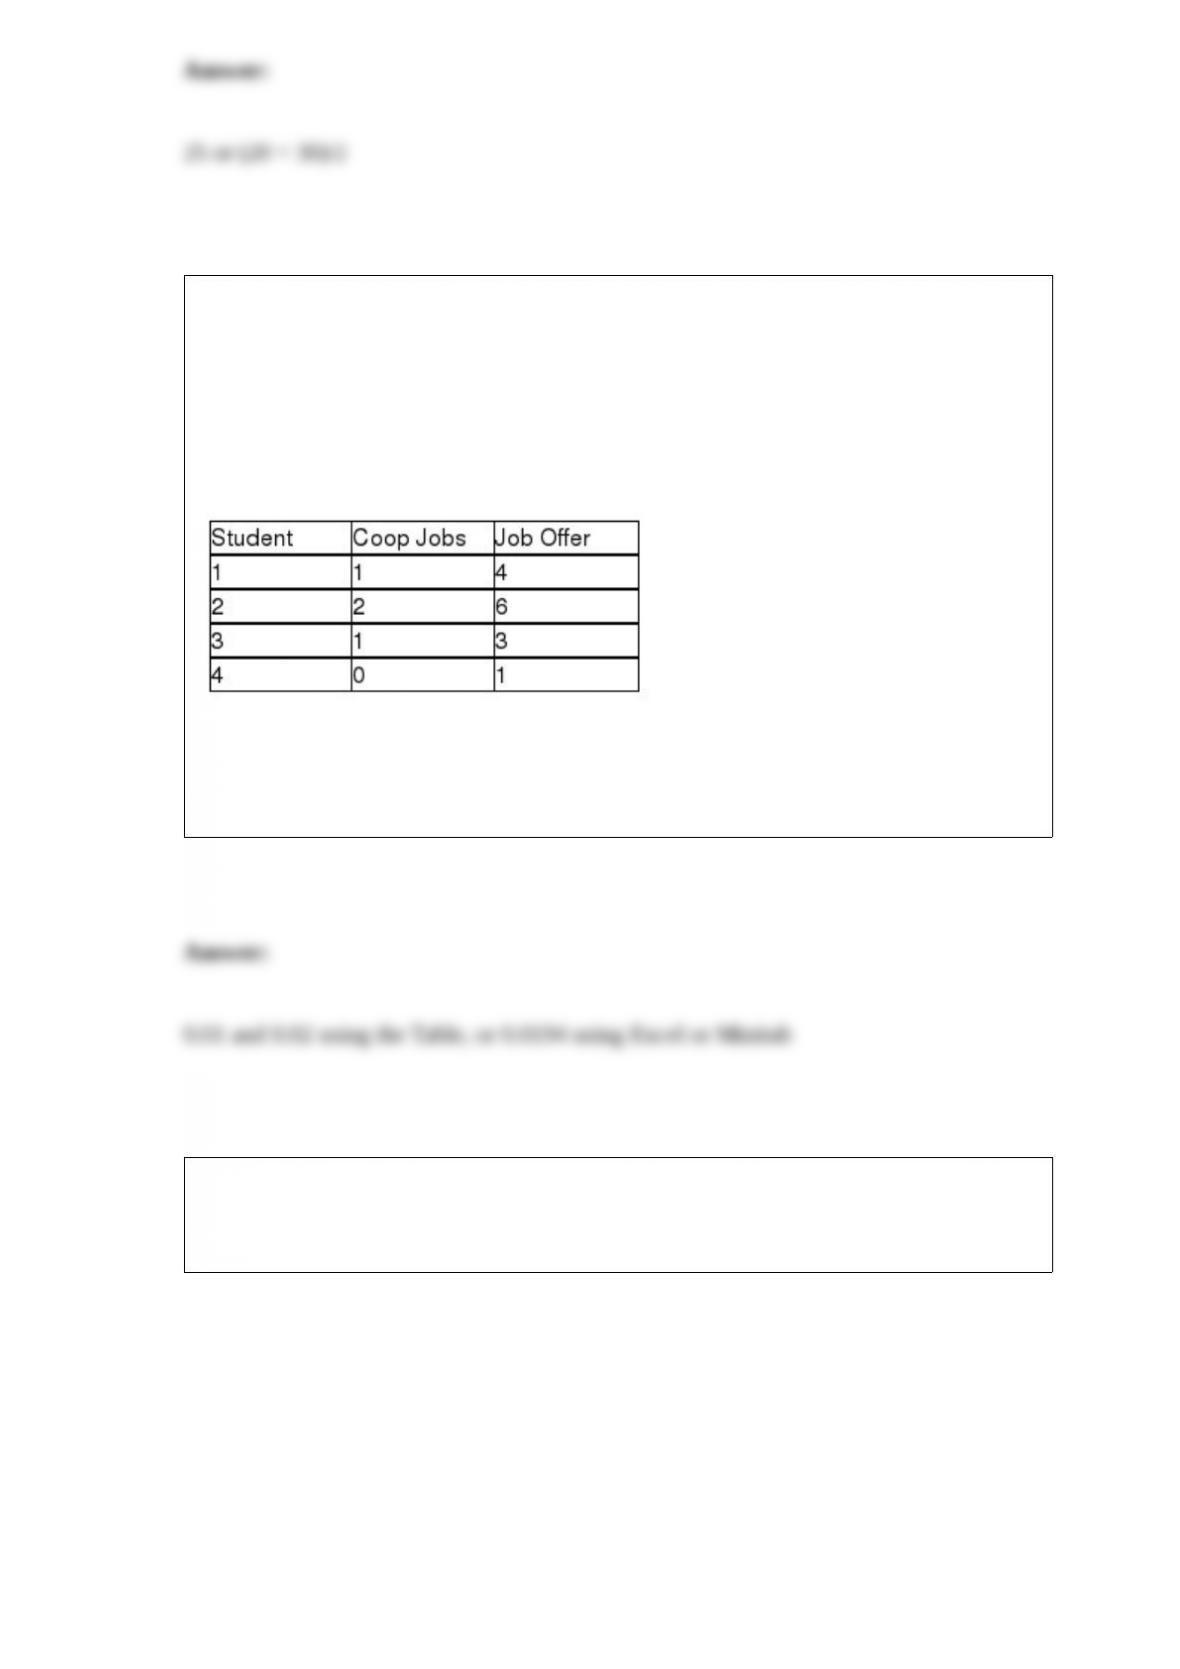
TABLE 13-3
The director of cooperative education at a state college wants to examine the effect of
cooperative education job experience on marketability in the work place. She takes a
random sample of 4 students. For these 4, she finds out how many times each had a
cooperative education job and how many job offers they received upon graduation.
These data are presented in the table below.
Referring to Table 13-3, the director of cooperative education wanted to test the
hypothesis that the population slope was equal to 0. The p-value of the test is between
________ and ________.
TABLE 16-4
The number of cases of merlot wine sold by a Paso Robles winery in an 8-year period
follows.
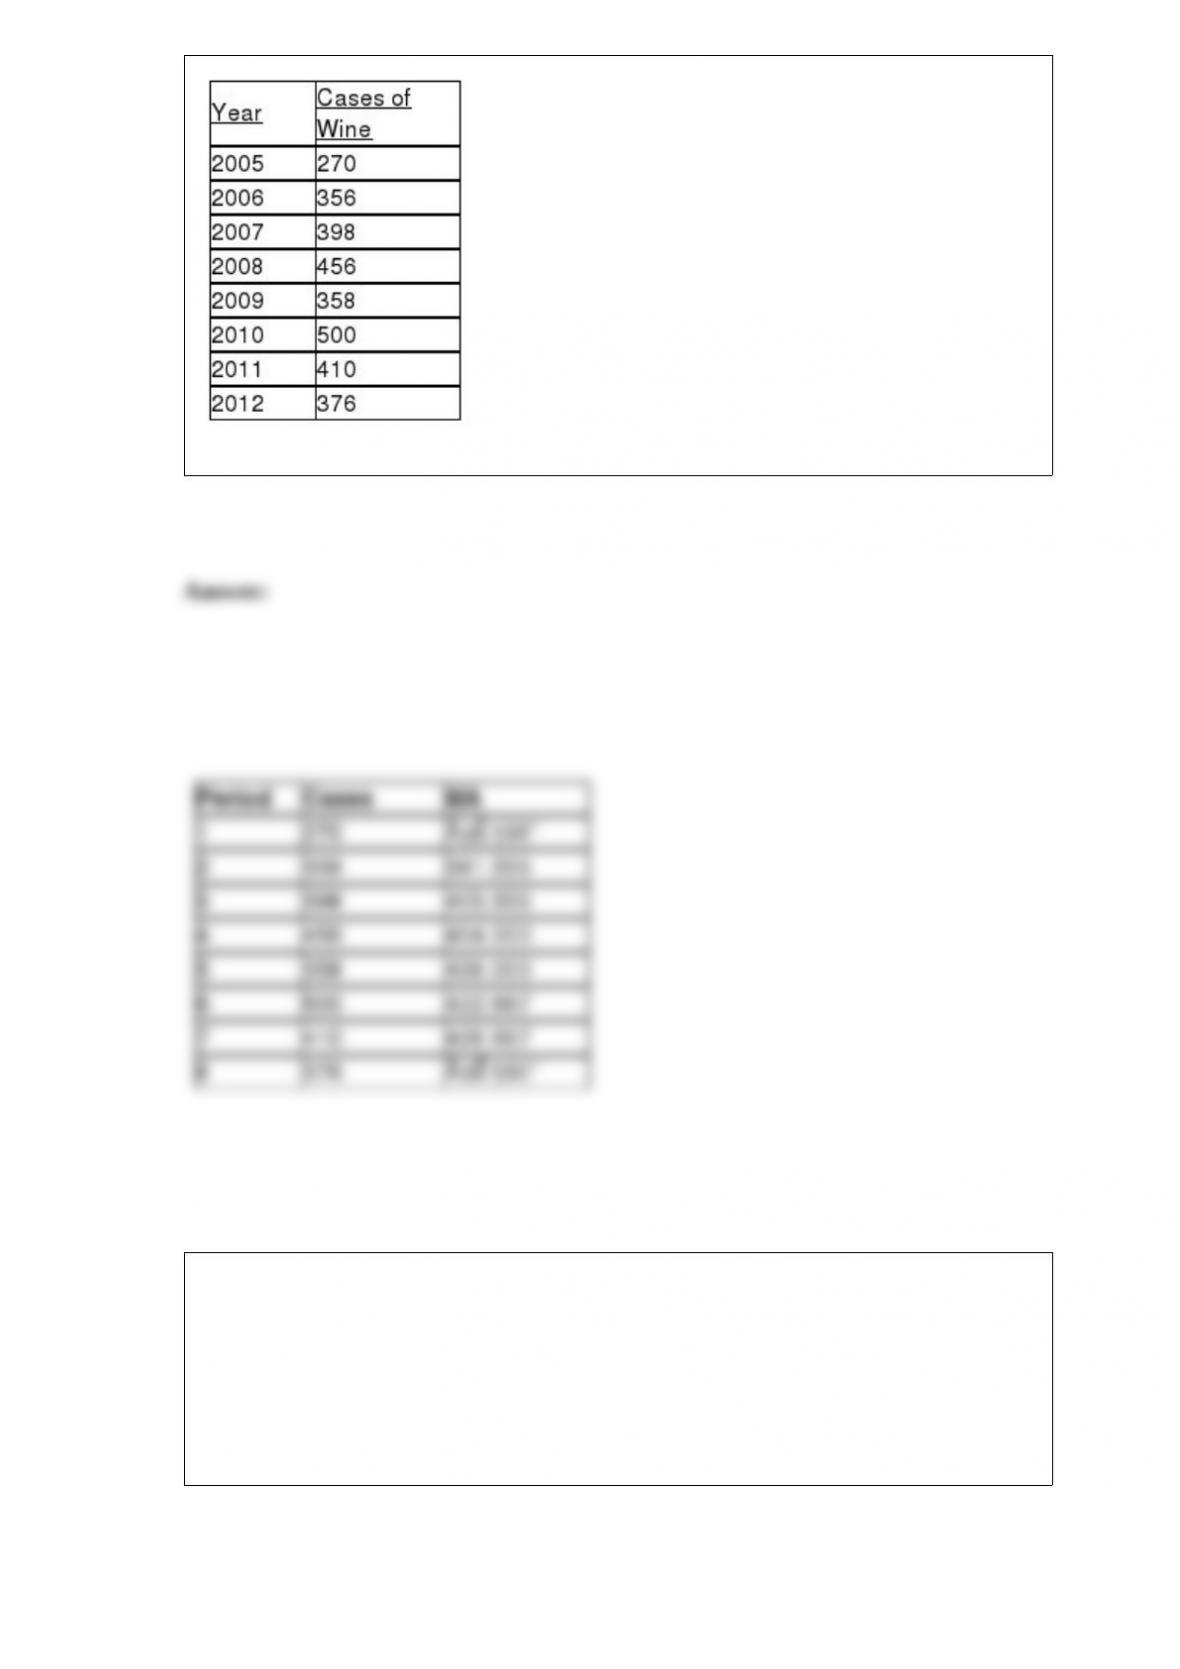
Referring to Table 16-4, construct a centered 3-year moving average for the wine sales.
TABLE 3-5
The rate of return of a Fortune 500 company over the past 15 years are: 3.17%, 4.43%,
5.93%, 5.43%, 7.29%, 8.21%, 6.23%, 5.23%, 4.34%, 6.68%, 7.14%, -5.56%, -5.23%,
-5.73%, -10.34%.
Referring to Table 3-5, construct a boxplot for the rate of return.
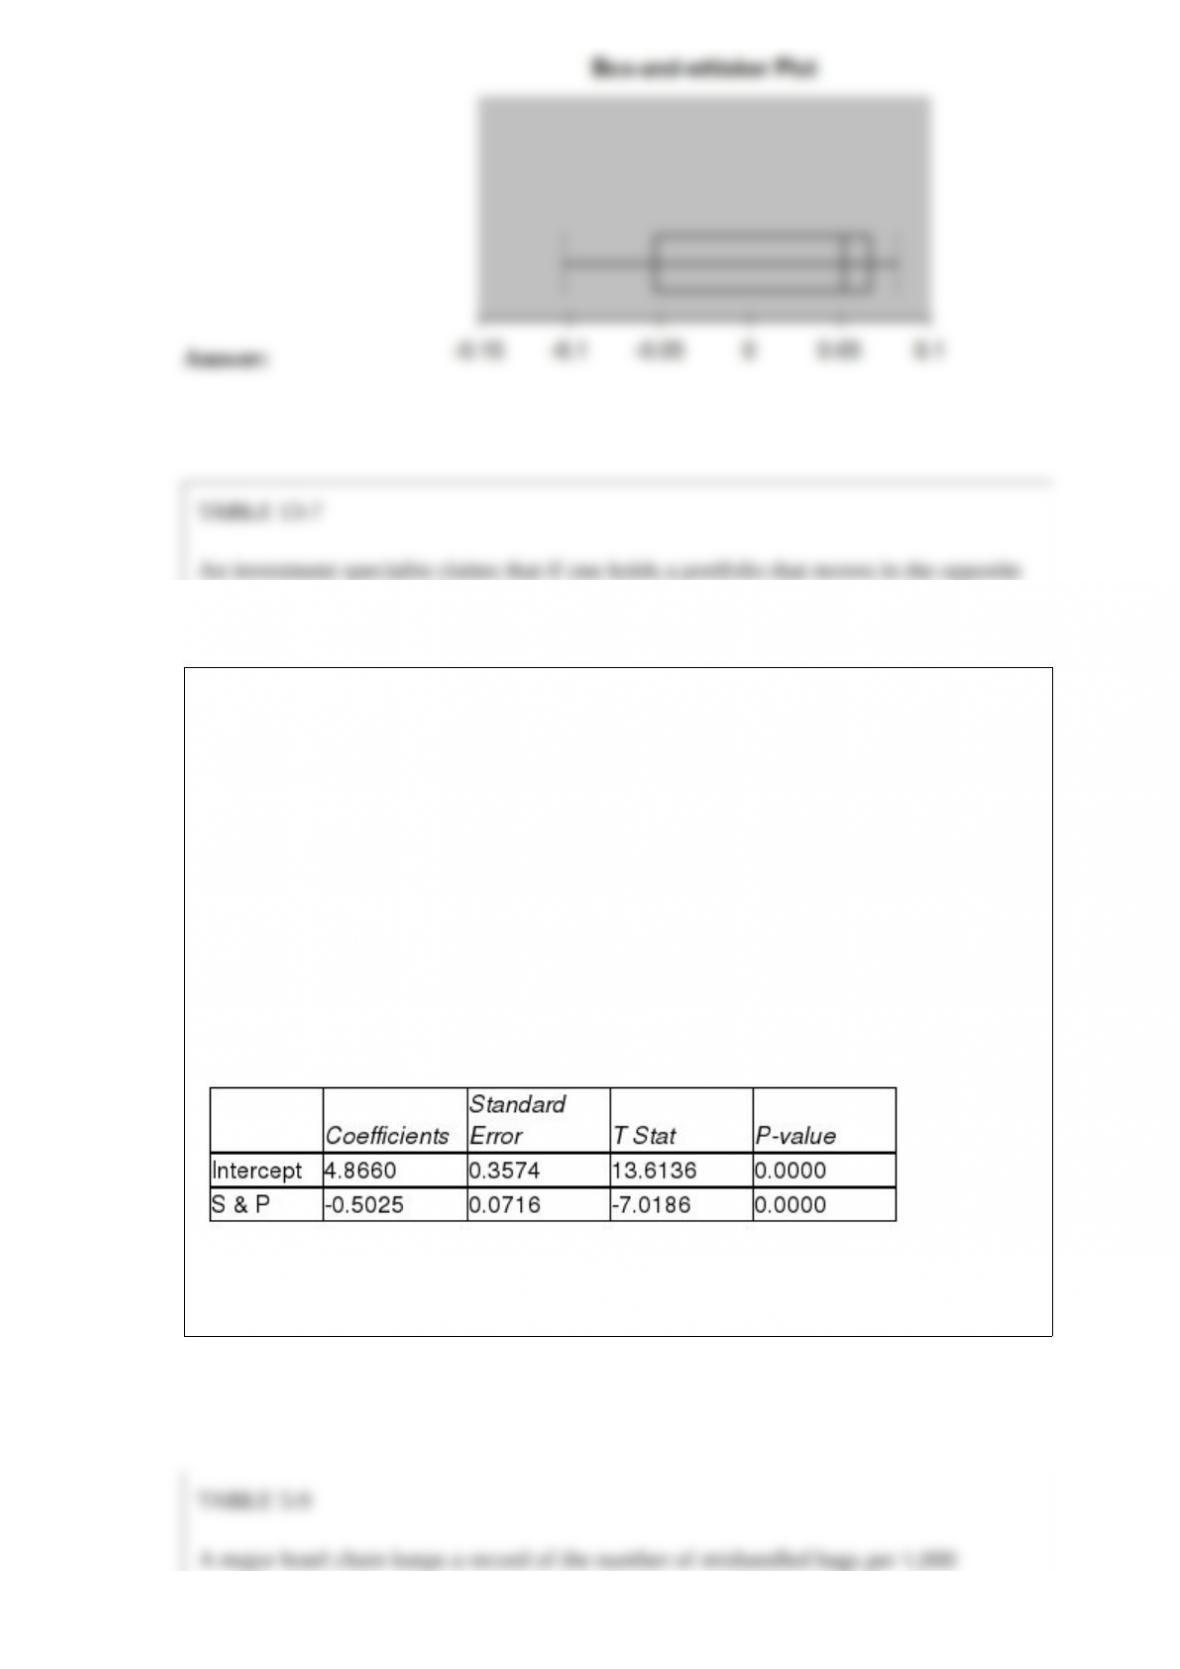
TABLE 13-7
An investment specialist claims that if one holds a portfolio that moves in the opposite
direction to the market index like the S&P 500, then it is possible to reduce the
variability of the portfolio’s return. In other words, one can create a portfolio with
positive returns but less exposure to risk.
A sample of 26 years of S&P 500 index and a portfolio consisting of stocks of private
prisons, which are believed to be negatively related to the S&P 500 index, is collected.
A regression analysis was performed by regressing the returns of the prison stocks
portfolio (Y) on the returns of S&P 500 index (X) to prove that the prison stocks
portfolio is negatively related to the S&P 500 index at a 5% level of significance. The
results are given in the following EXCEL output.
Referring to Table 13-7, to test whether the prison stocks portfolio is negatively related
to the S&P 500 index, the p-value of the associated test statistic is ________.
TABLE 5-9
A major hotel chain keeps a record of the number of mishandled bags per 1,000
customers. In a recent year, the hotel chain had 4.06 mishandled bags per 1,000
customers. Assume that the number of mishandled bags has a Poisson distribution.
Referring to Table 5-9, what is the probability that in the next 1,000 customers, the
hotel chain will have no more than two and at least eight mishandled bags?
TABLE 18-7
A supplier of silicone sheets for producers of computer chips wants to evaluate her
manufacturing process. She takes sample sizes of 5 from each day’s output and counts
the number of blemishes on each silicone sheet. The results from 20 days of such
evaluations are presented below.
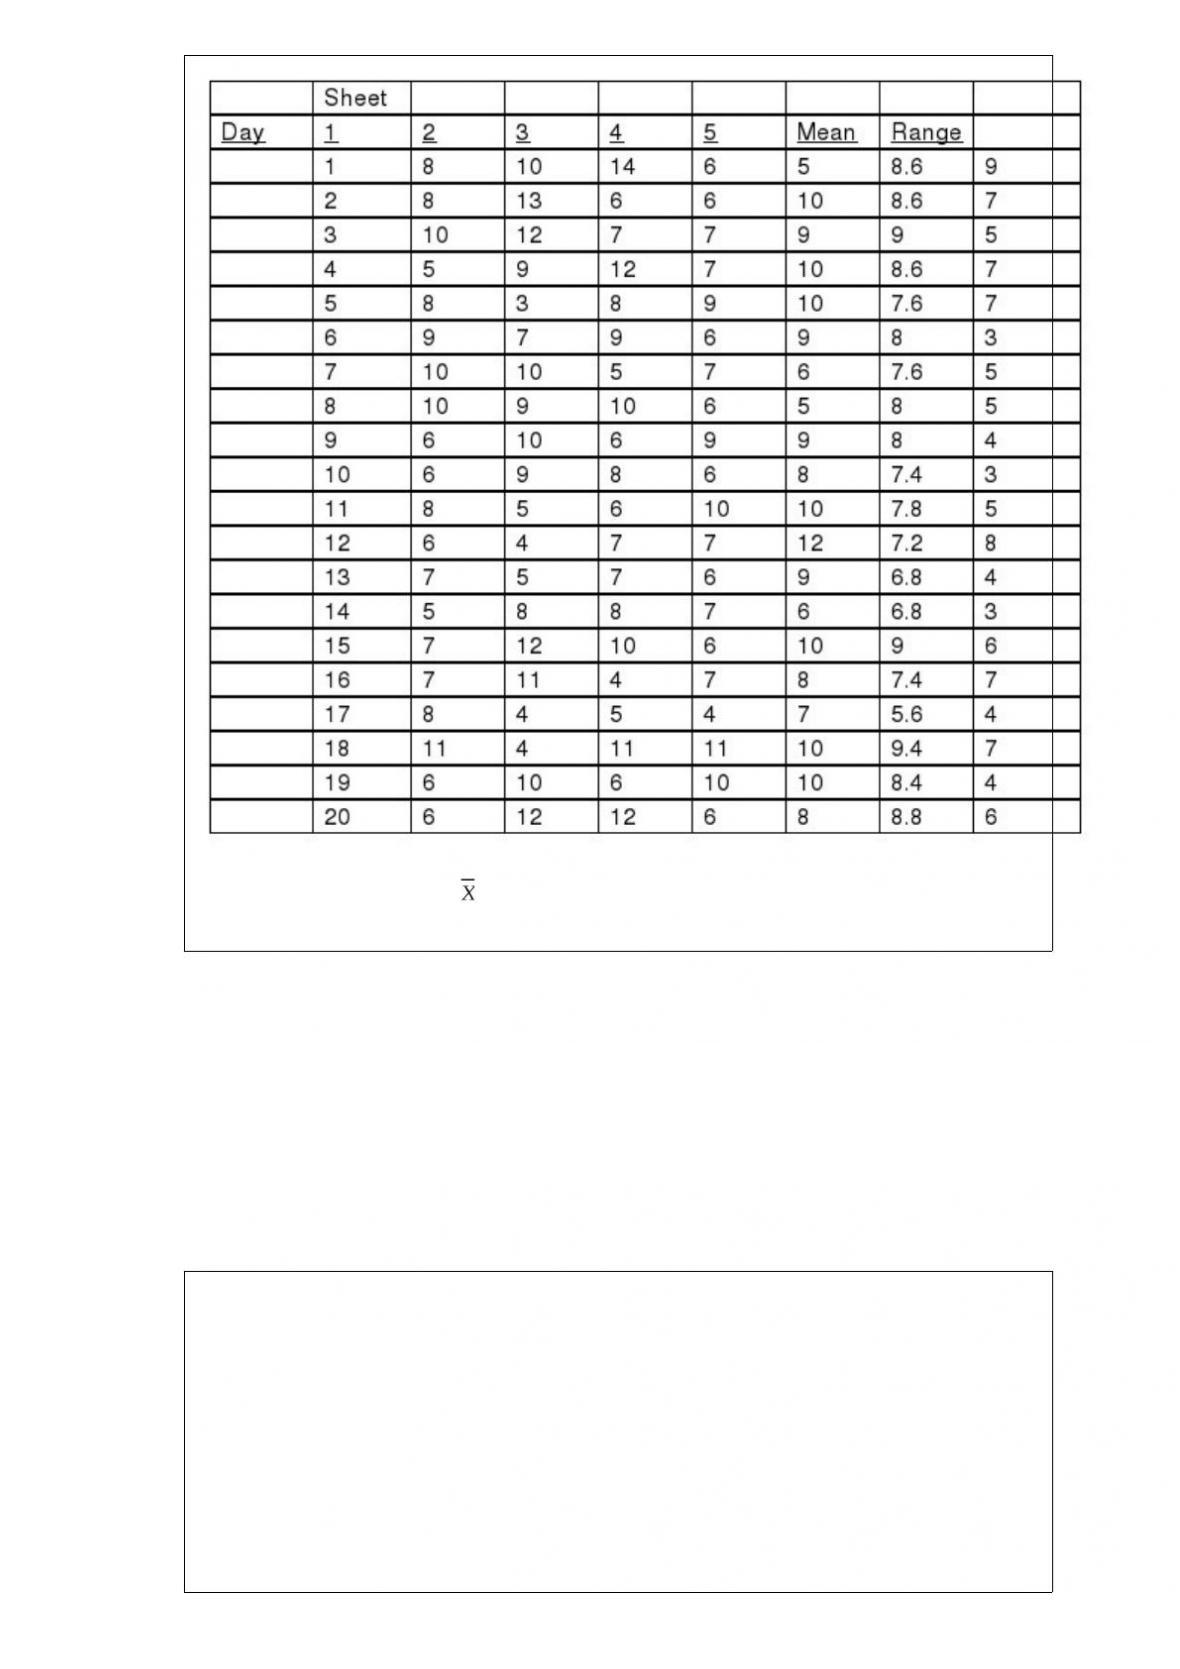
She also decides that the upper specification limit is 10 blemishes.
Referring to Table 18-7, an chart is to be used for the number of blemishes. The lower
control limit for this data set is ________, while the upper control limit is ________.
TABLE 4-10
Are whites more likely to claim bias? It was found that 60% of the workers were white,
30% were black and 10% are other races. Given that a worker was white, the
probability that the worker had claimed bias was 30%. Given that a worker was black,
the probability that the worker had claimed bias was 40%. Given that a worker was
other race, the probability that the worker had claimed bias was 0%.
Referring to Table 4-10, if a randomly selected worker had not claimed bias, what is the
probability that the worker is white?