The oranges grown in corporate farms in an agricultural state were damaged by some
unknown fungi a few years ago. Suppose the manager of a large farm wanted to study
the impact of the fungi on the orange crops on a daily basis over a 6-week period. On
each day a random sample of orange trees was selected from within a random sample of
acres. The daily average number of damaged oranges per tree and the proportion of
trees having damaged oranges were calculated. In this study, the presentation and
characterization of the two main measures calculated each day (i.e., average number of
damaged oranges per tree and proportion of trees having damaged oranges) are called
________.
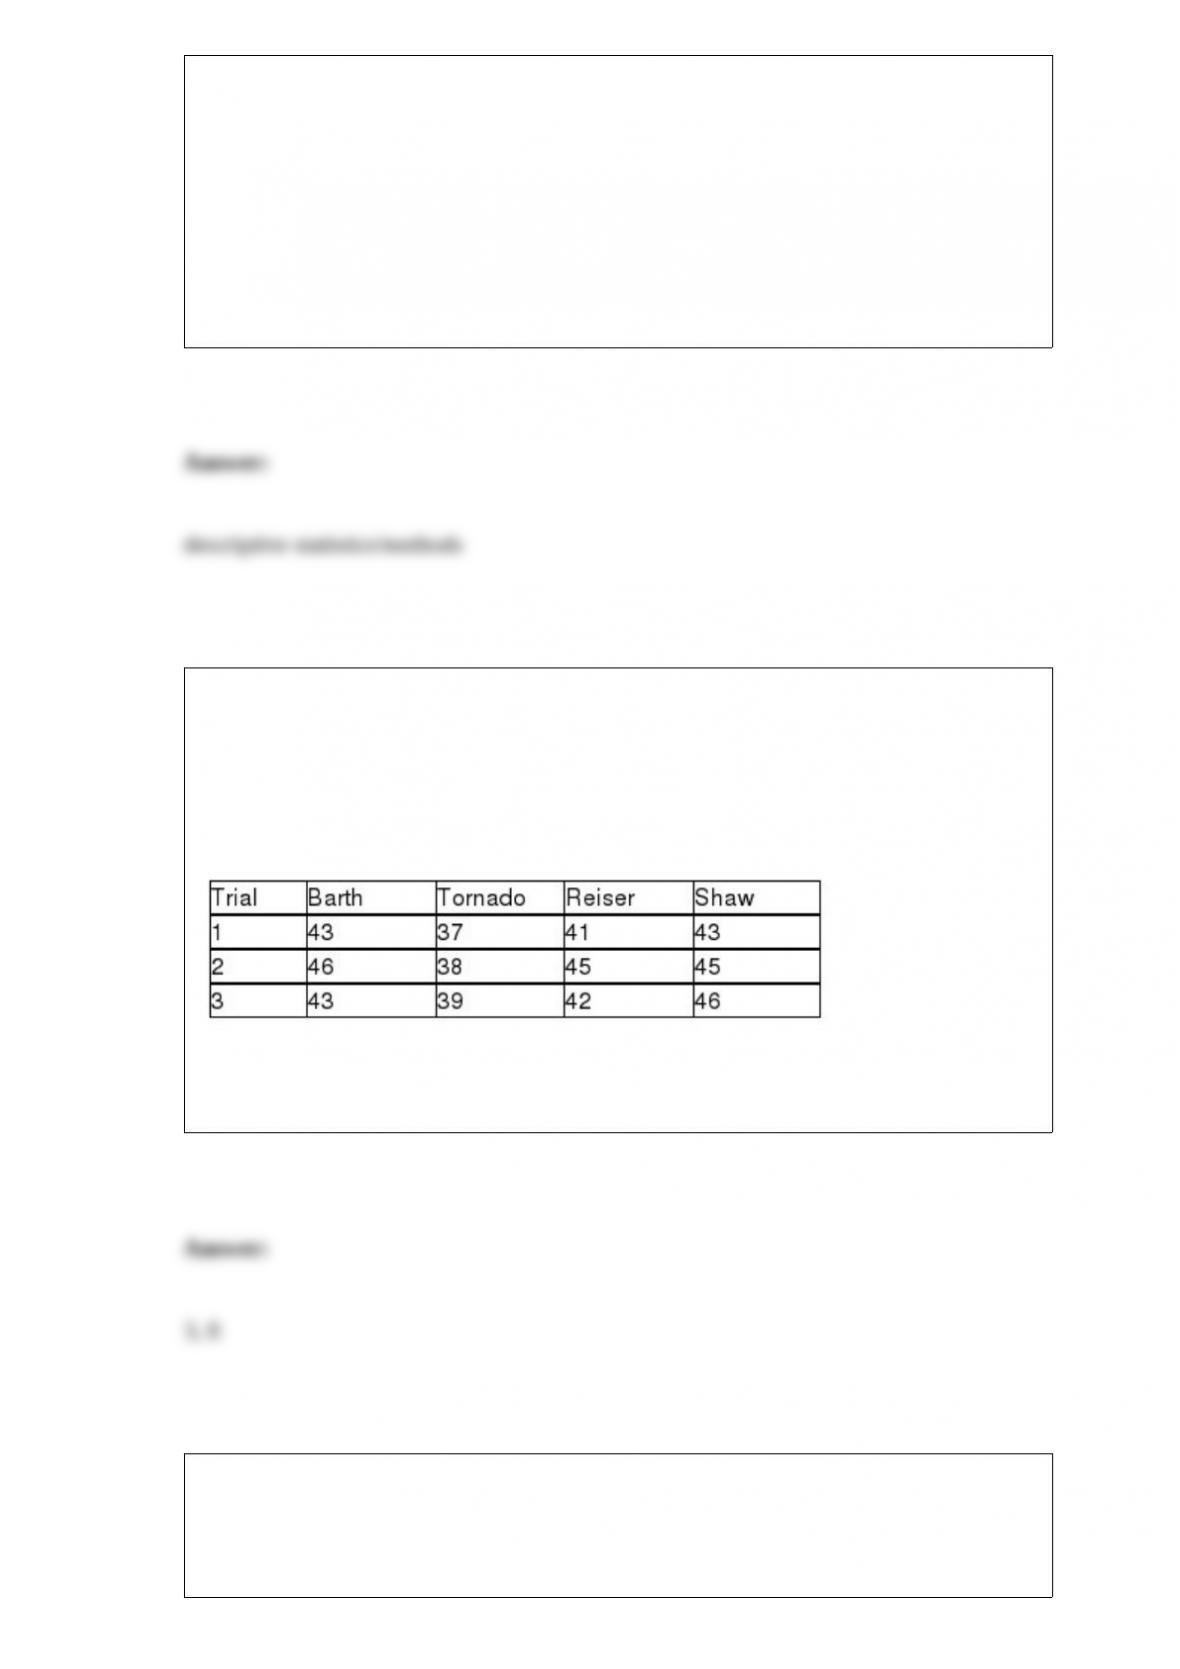
TABLE 11-3
As part of an evaluation program, a sporting goods retailer wanted to compare the
downhill coasting speeds of 4 brands of bicycles. She took 3 of each brand and
determined their maximum downhill speeds. The results are presented in miles per hour
in the table below.
Referring to Table 11-3, what are the numerator and denominator degrees of freedom
for Levene’s test for homogeneity of variances respectively?
TABLE 2-14
The table below contains the number of people who own a portable Blu-ray player in a
sample of 600 broken down by gender.
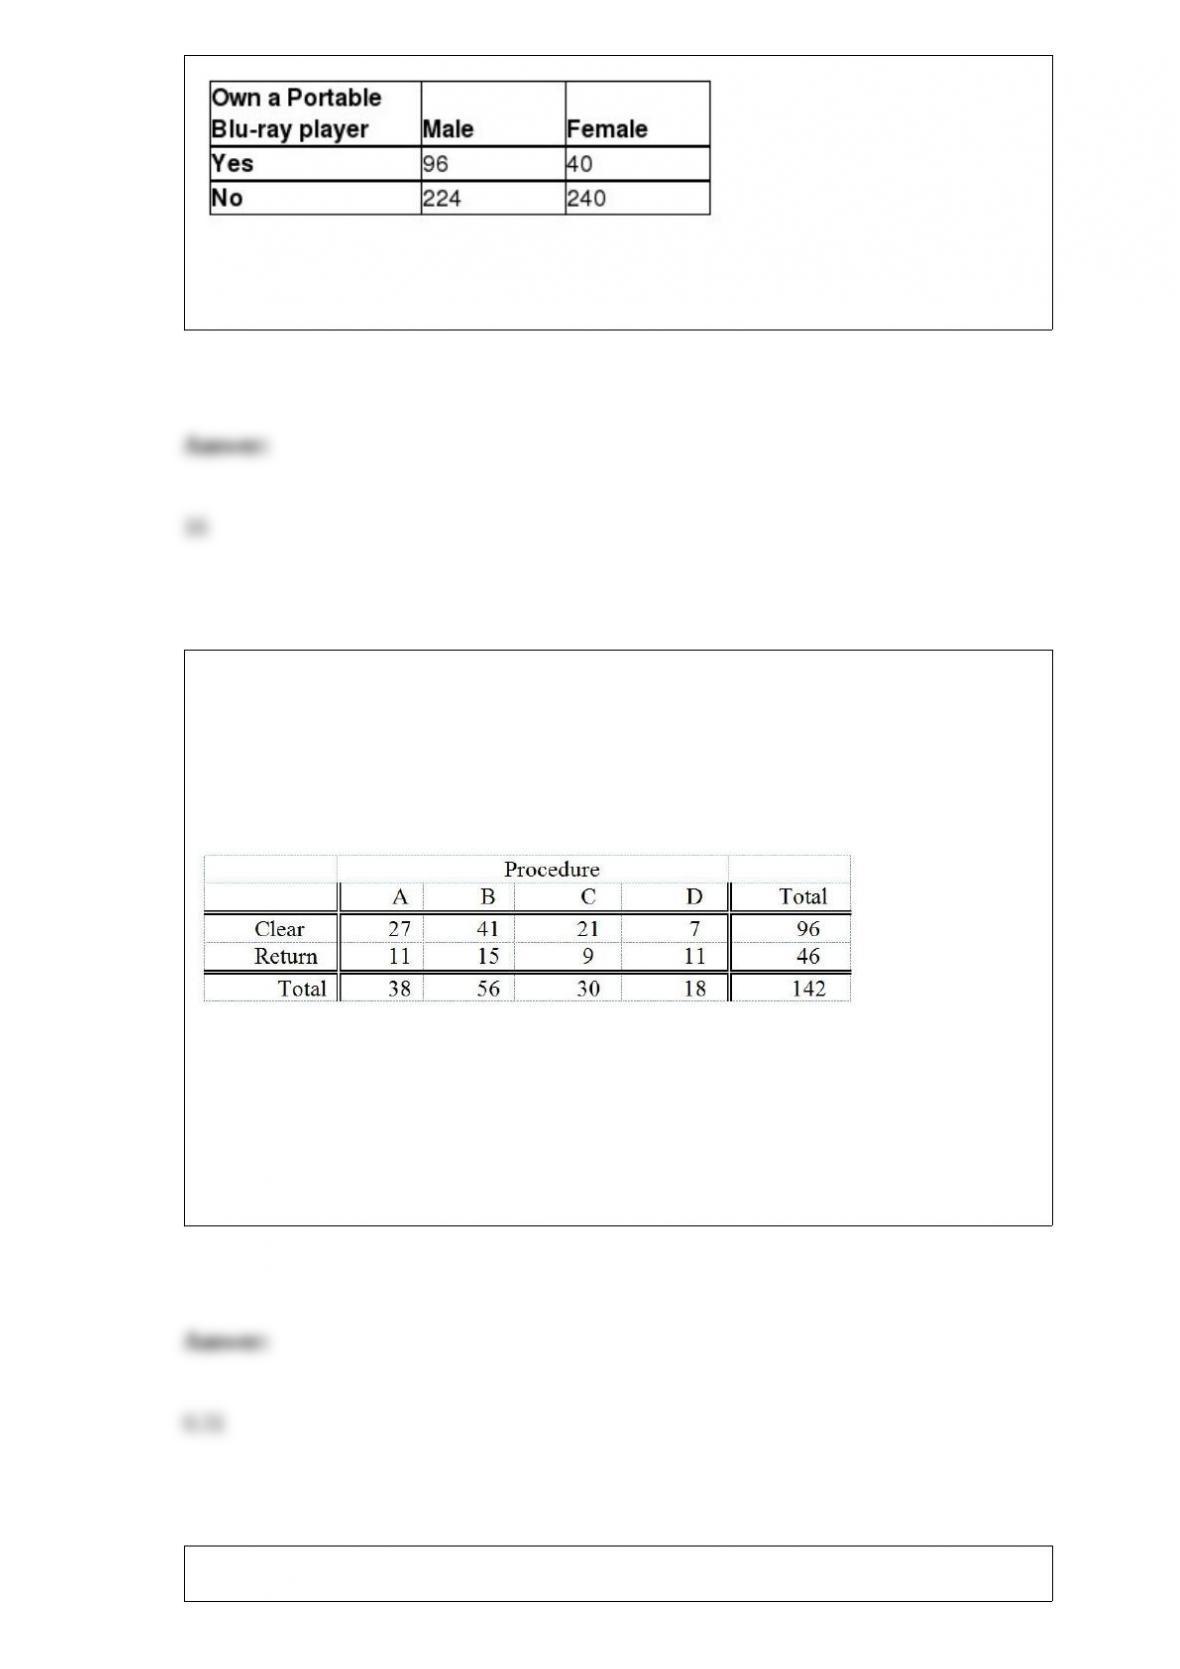
Referring to Table 2-14, ________ percent of the 600 were males who owned a portable
Blu-ray player.
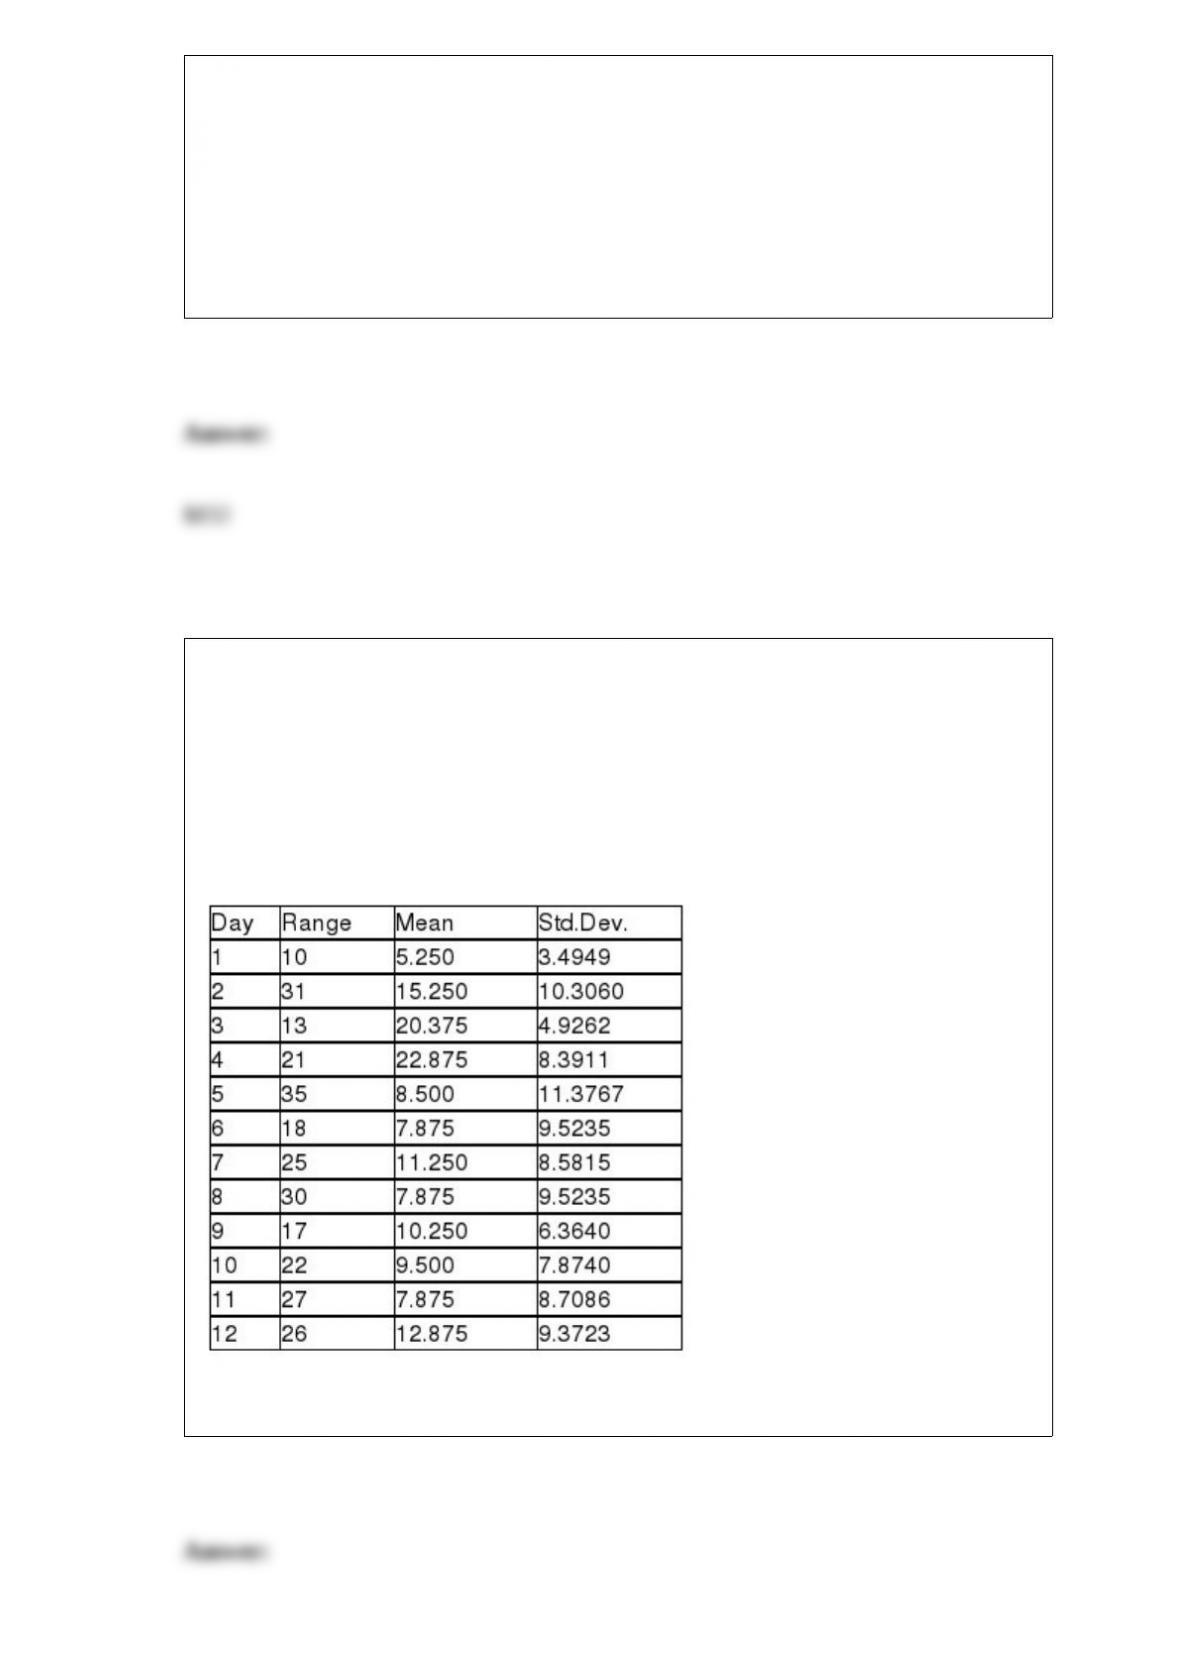
TABLE 12-5
Four surgical procedures currently are used to install pacemakers. If the patient does not
need to return for follow-up surgery, the operation is called a “clear” operation. A heart
center wants to compare the proportion of clear operations for the 4 procedures, and
collects the following numbers of patients from their own records:
They will use this information to test for a difference among the proportion of clear
operations using a chi-square test with a level of significance of 0.05.
Referring to Table 12-5, what is the value of the critical range for the Marascuilo
procedure to test for the difference in proportions between procedure A and procedure C
using a 0.05 level of significance?
TABLE 3-7
In a recent academic year, many public universities in the United States raised tuition
and fees due to a decrease in state subsidies. The change in the cost of tuition, a shared
dormitory room, and the most popular meal plan from the previous academic year for a
sample of 10 public universities were as follows: $1,589, $593, $1,223, $869, $423,
$1,720, $708, $1,425, $922 and $308.
Referring to Table 3-7, what is the interquartile range of the change in the cost?
TABLE 18-8
Recently, a university switched to a new type of computer-based registration. The
registrar is concerned with the amount of time students are spending on the computer
registering under the new system. She decides to randomly select 8 students on each of
the 12 days of the registration and determine the time each spends on the computer
registering. The range, mean, and standard deviation of the times required to register are
in the table that follows.
Referring to Table 18-8, an R chart is to be constructed for the time required to register.
The lower control limit for this data set is ________.
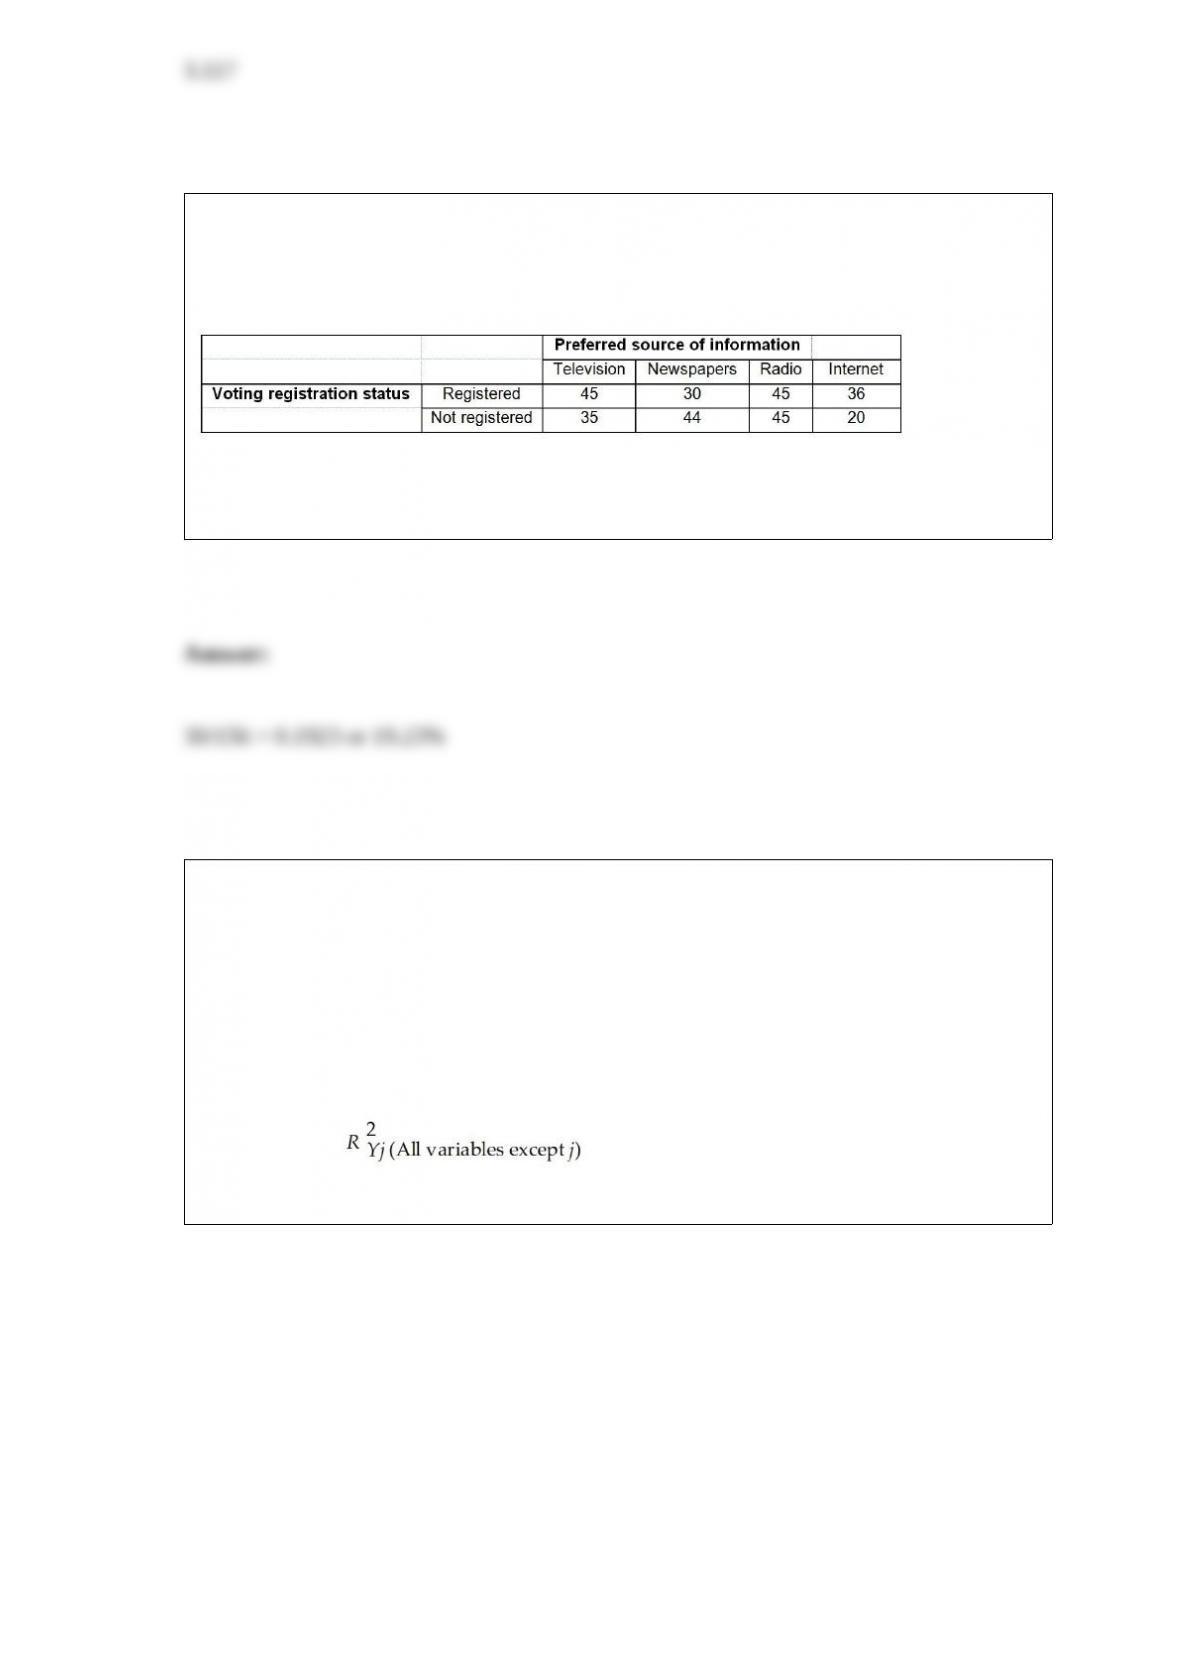
TABLE 4-11
A sample of 300 adults is selected. The contingency table below shows their registration
status and their preferred source of information on current events.
Referring to Table 4-11, if a randomly selected adult is a registered voter, what is the
probability that he/she prefers to get his/her current information from the newspapers?
TABLE 17-10
Given below are results from the regression analysis where the dependent variable is
the number of weeks a worker is unemployed due to a layoff (Unemploy) and the
independent variables are the age of the worker (Age), the number of years of education
received (Edu), the number of years at the previous job (Job Yr), a dummy variable for
marital status (Married: 1 = married, 0 = otherwise), a dummy variable for head of
household (Head: 1 = yes, 0 = no) and a dummy variable for management position
(Manager: 1 = yes, 0 = no). We shall call this Model 1. The coefficient of partial
determination ( ) of each of the 6 predictors are, respectively,
0.2807, 0.0386, 0.0317, 0.0141, 0.0958, and 0.1201.
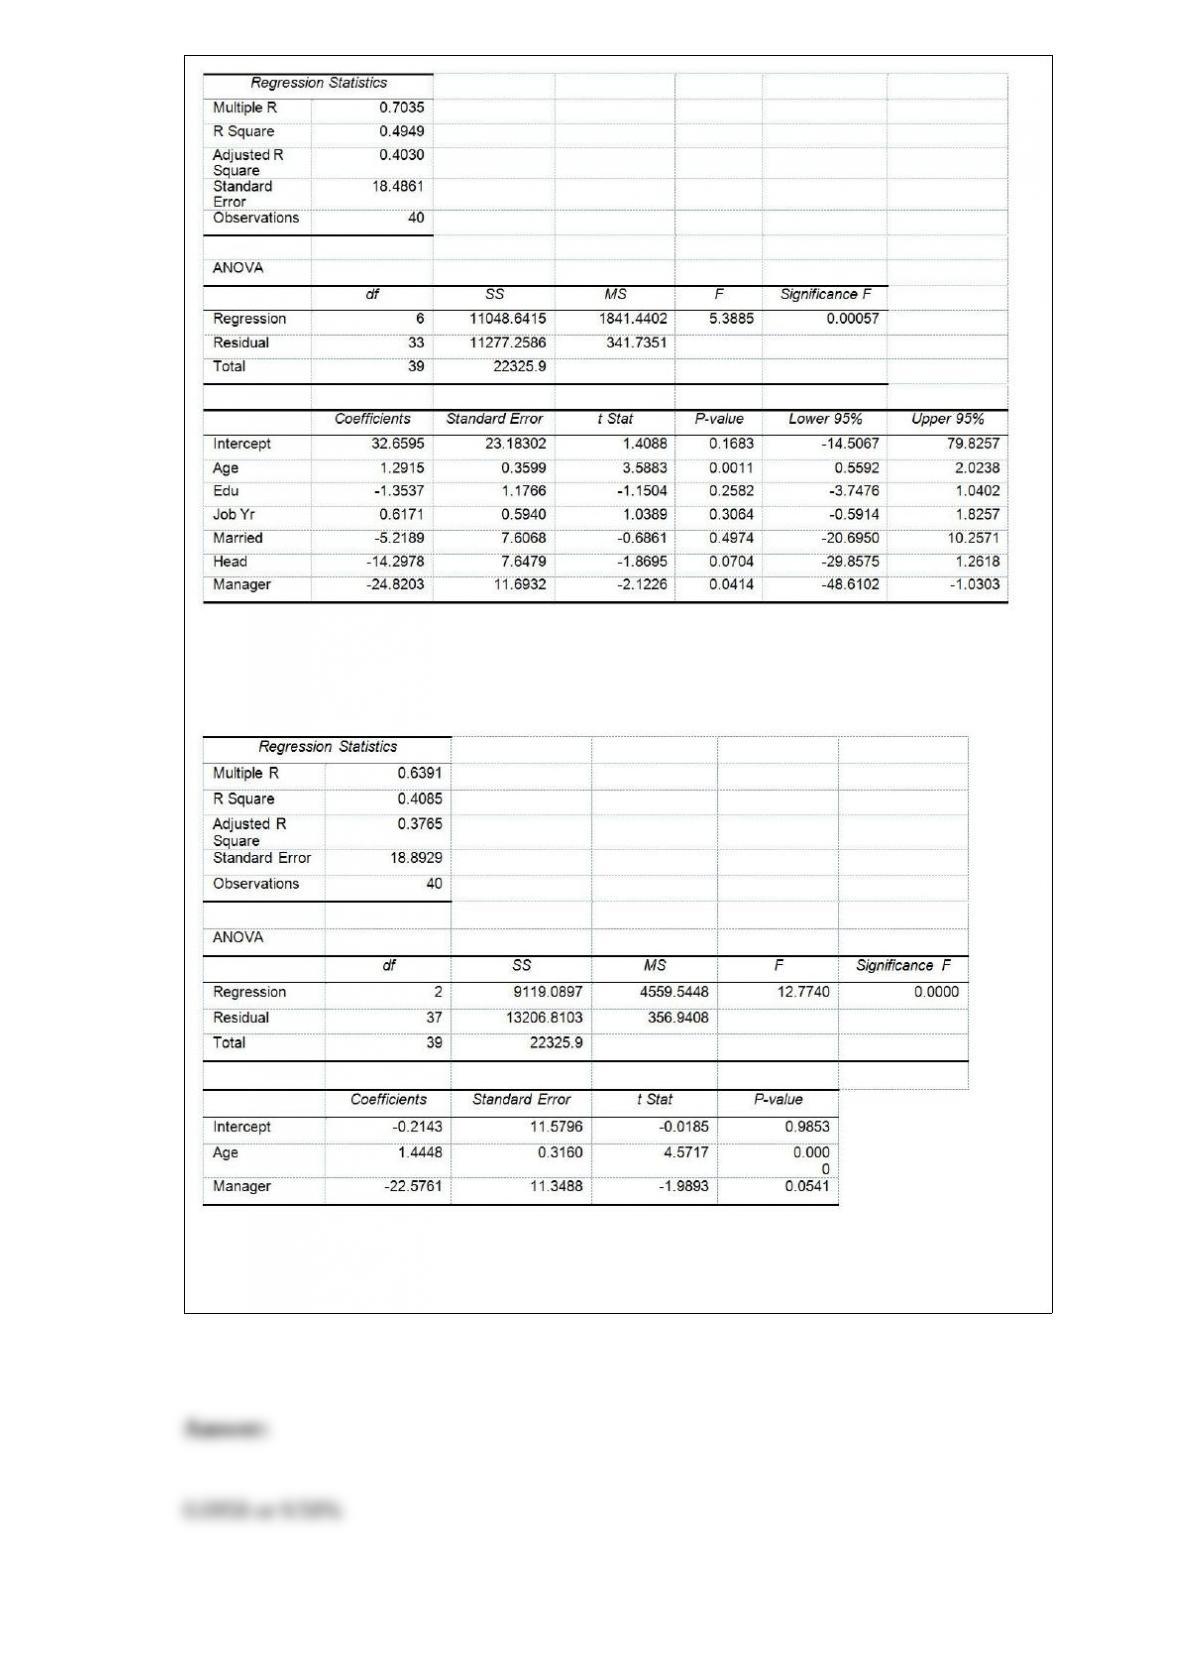
Model 2 is the regression analysis where the dependent variable is Unemploy and the
independent variables are Age and Manager. The results of the regression analysis are
given below:
Referring to Table 17-10, Model 1, ________ of the variation in the number of weeks a
worker is unemployed due to a layoff can be explained by whether the worker is head
of household while controlling for the other independent variables.
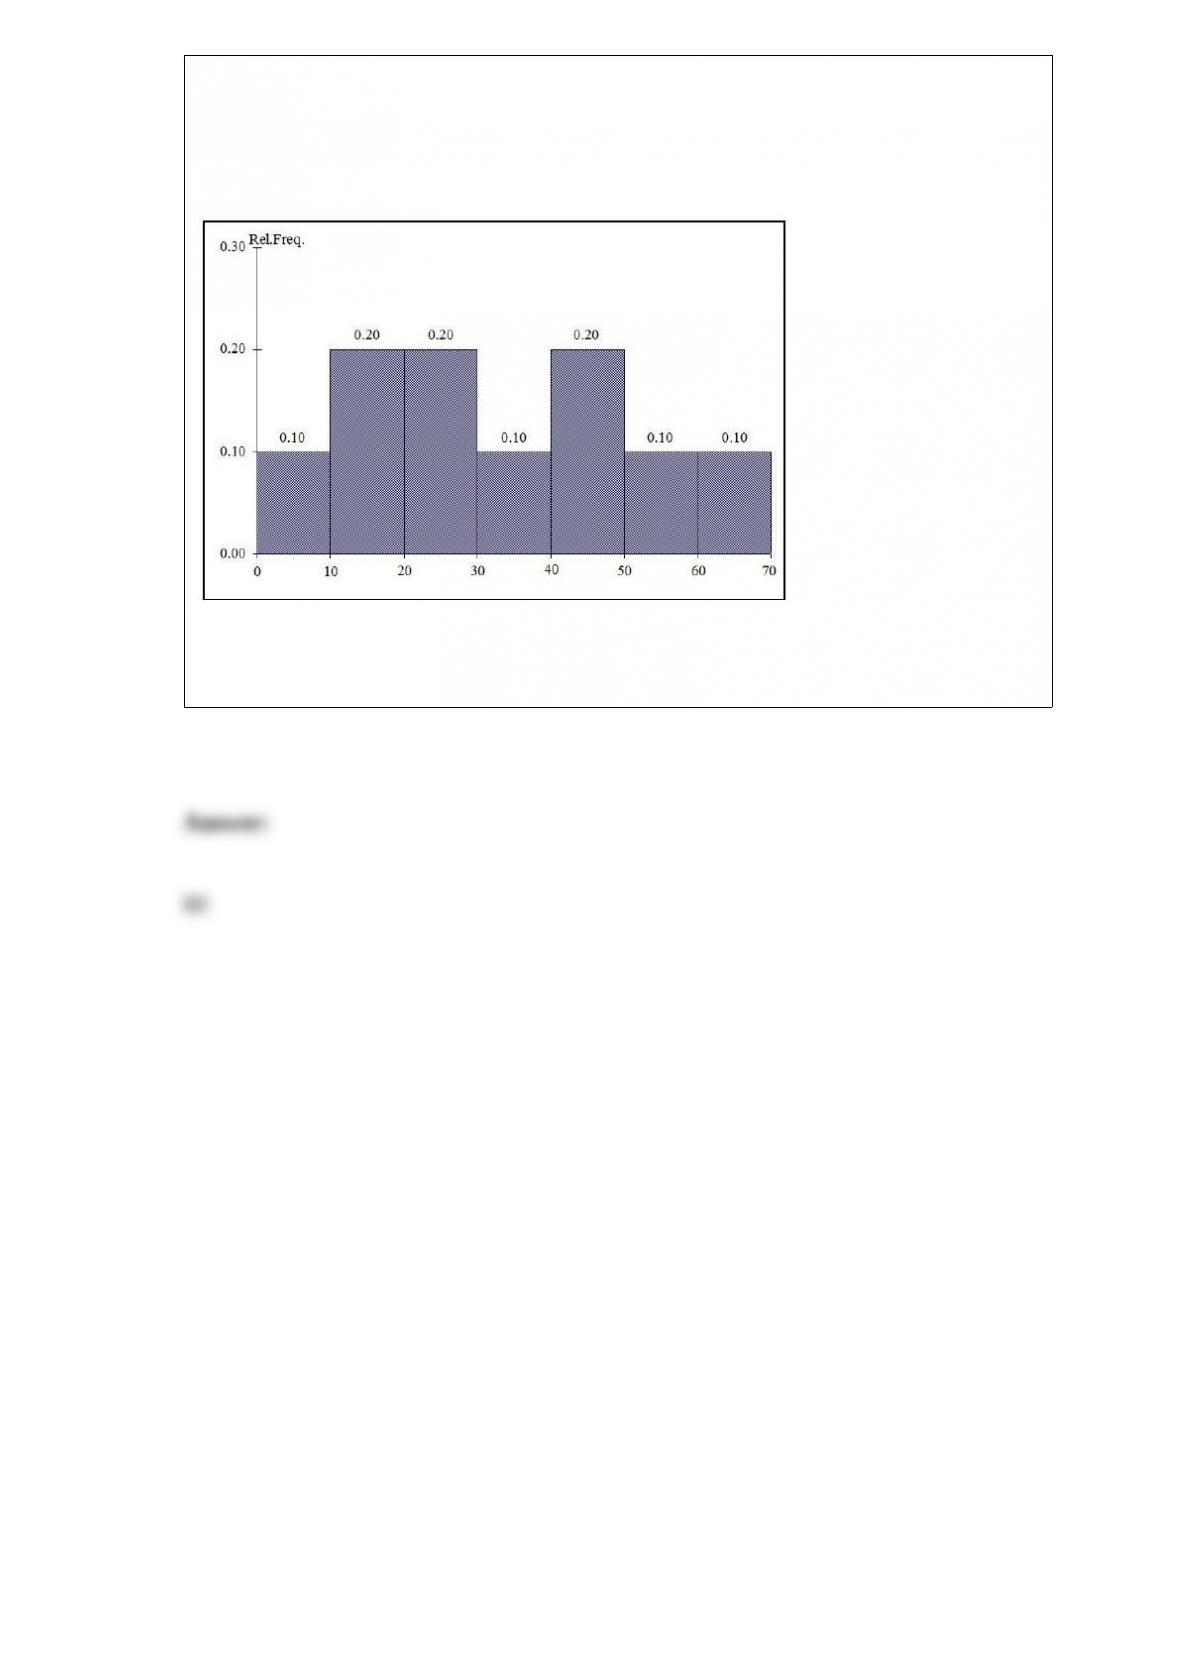
TABLE 2-10
The histogram below represents scores achieved by 200 job applicants on a personality
profile.
Referring to the histogram from Table 2-10, the number of job applicants who scored
between 30 and below 60 is ________.