There are only 4 empty rooms available in a student dormitory for eleven new
freshmen. All the rooms are considered as homogenous so that it does not matter who is
being assigned to which room. How many different ways can those 4 empty rooms be
filled, one student per room?
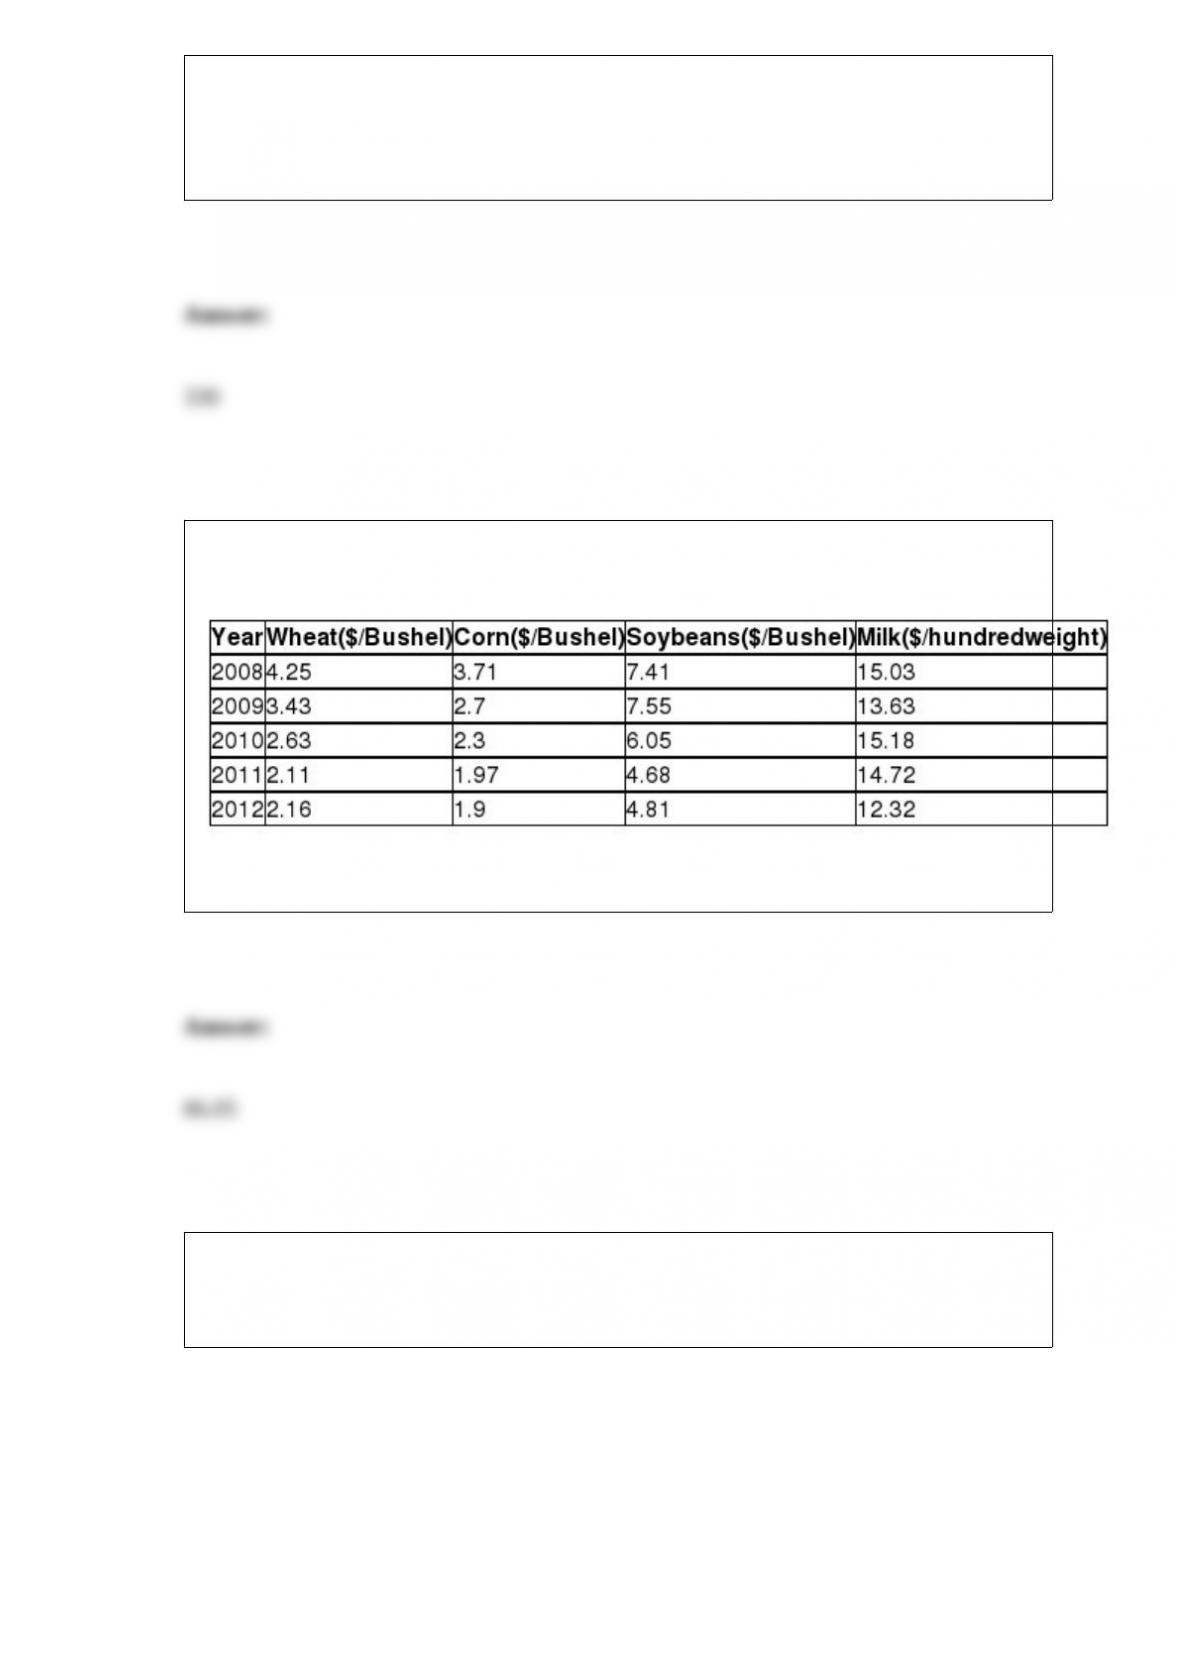
TABLE 16-16
Given below are the prices of a basket of four food items from 2008 to 2012.
Referring to Table 16-16, what is the unweighted aggregate price index for the basket of
four food items in 2010 using 2008 as the base year?
TABLE 16-13
Given below is the monthly time-series data for U.S. retail sales of building materials
over a specific year.
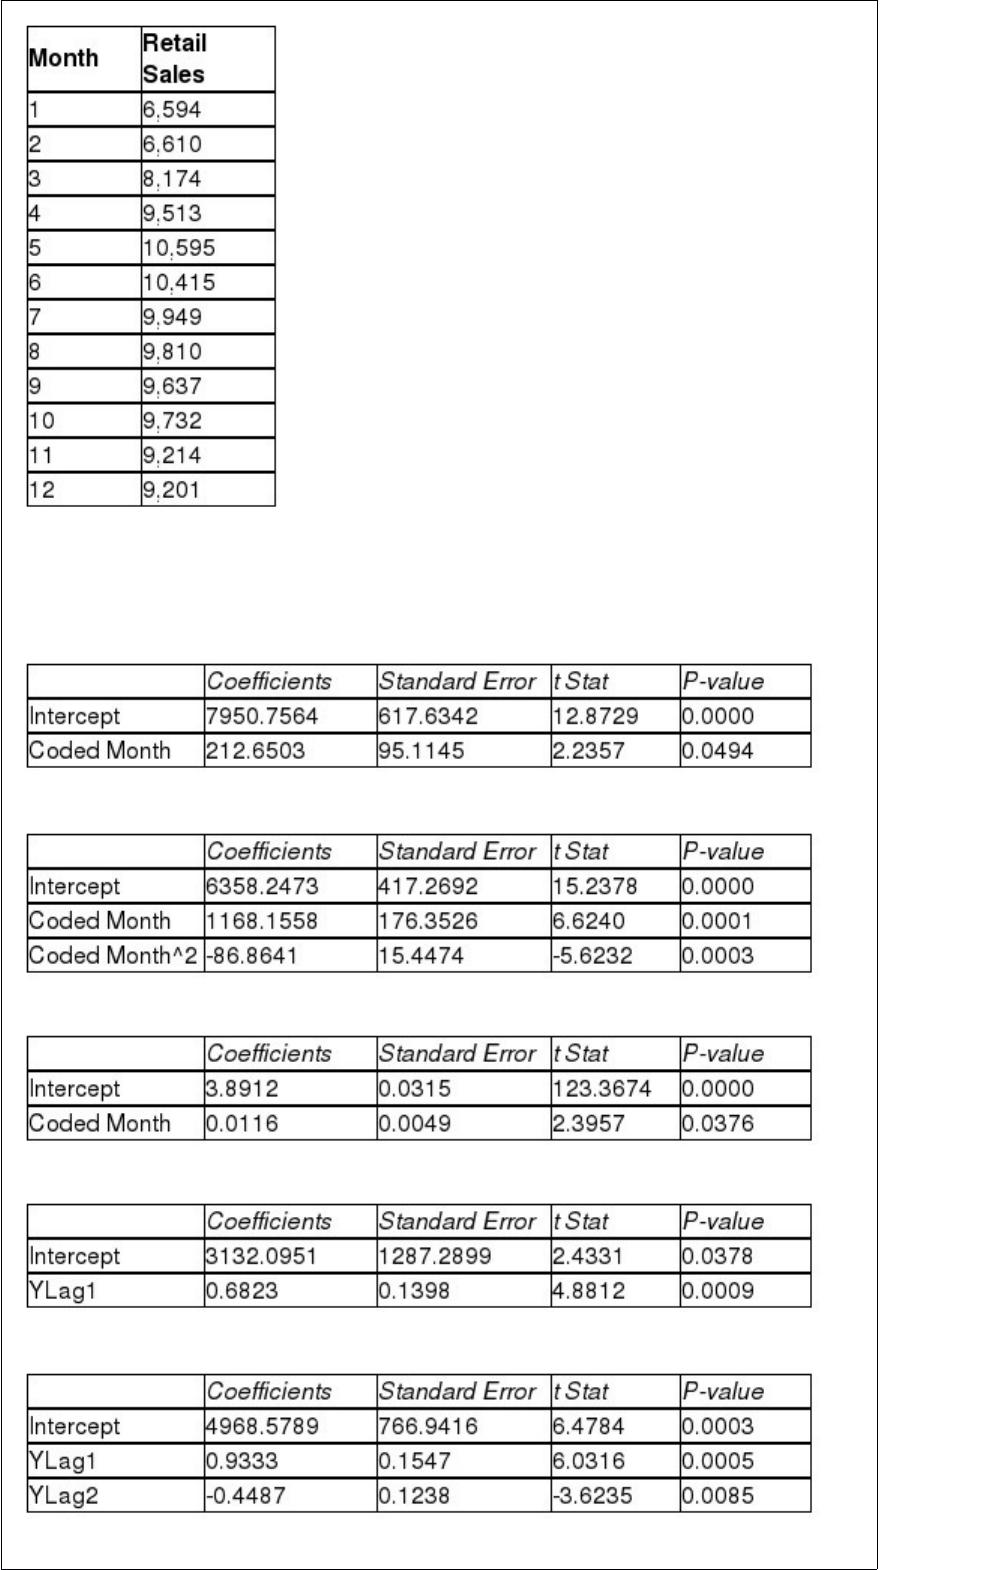
The results of the linear trend, quadratic trend, exponential trend, first-order
autoregressive, second-order autoregressive and third-order autoregressive model are
presented below in which the coded month for the 1st month is 0:
Linear trend model:
Quadratic trend model:
Exponential trend model:
First-order autoregressive:
Second-order autoregressive:
Third-order autoregressive:
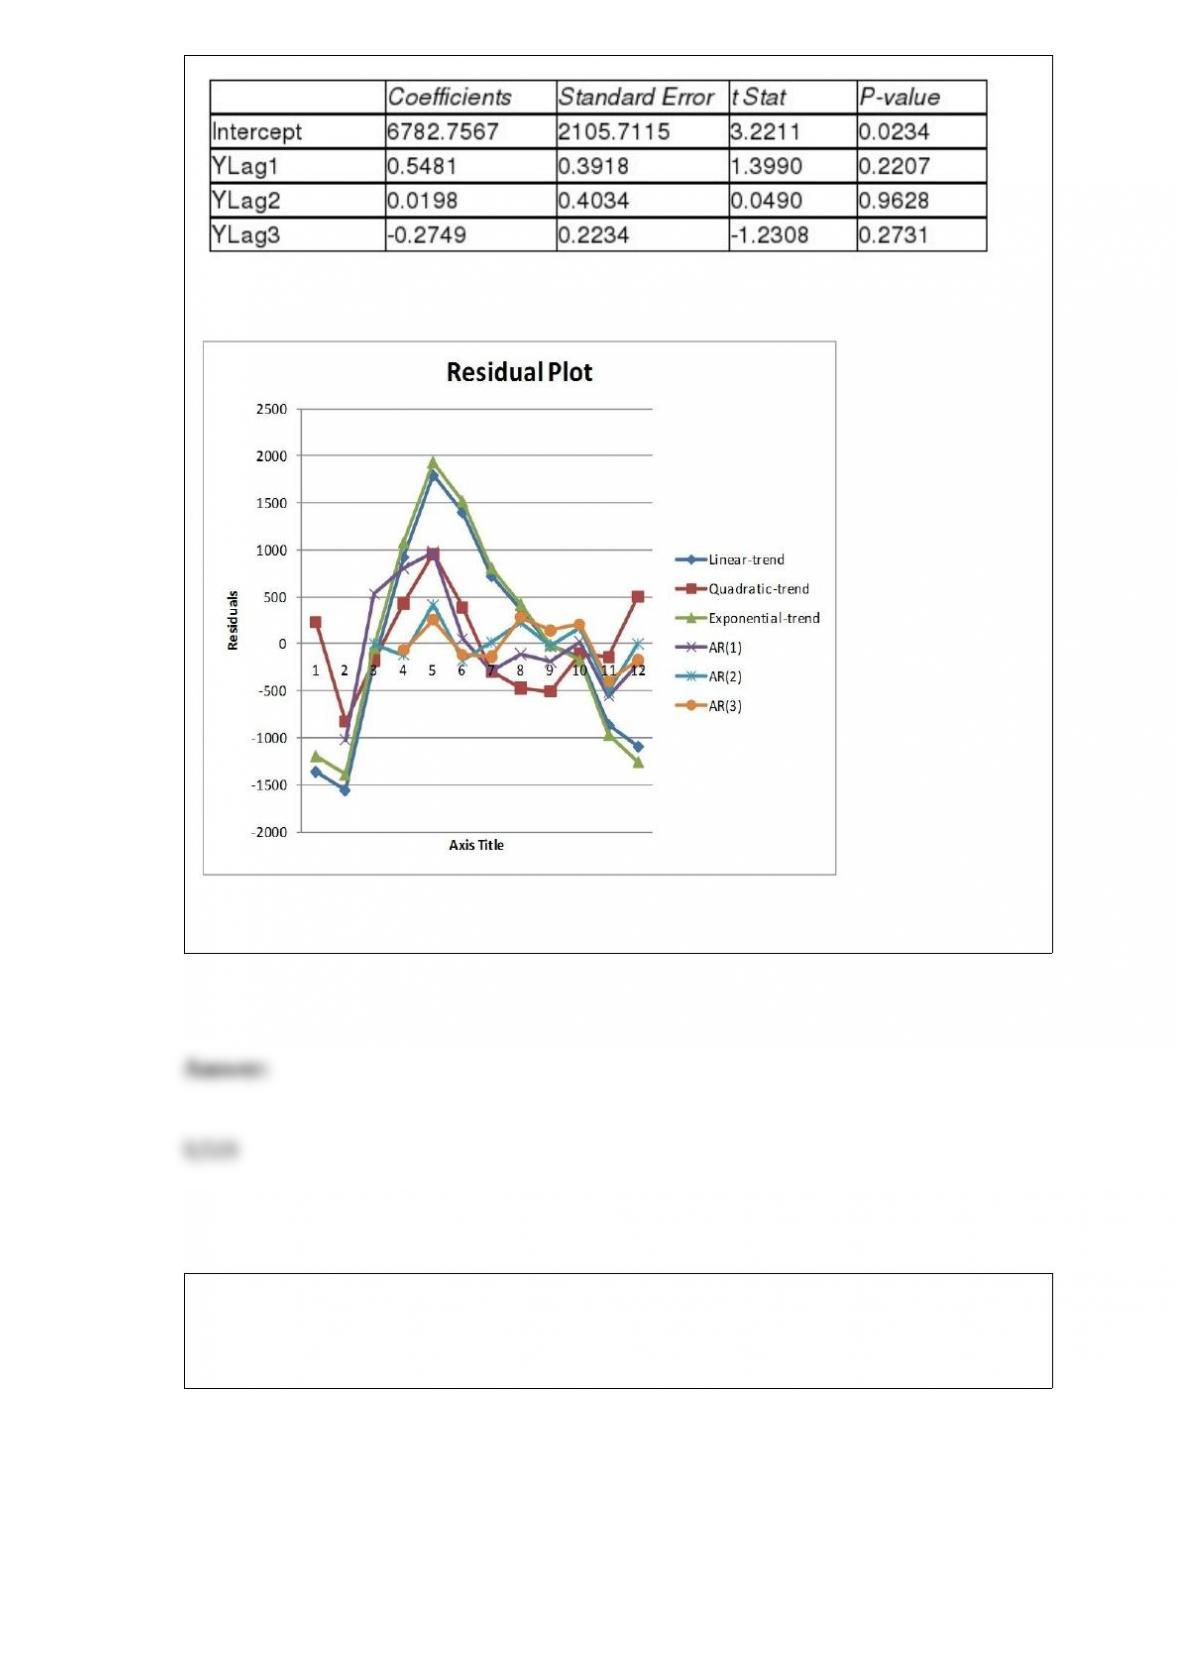
Below is the residual plot of the various models:
Referring to Table 16-13, if a five-month moving average is used to smooth this series,
what would be the last calculated value?
TABLE 16-13
Given below is the monthly time-series data for U.S. retail sales of building materials
over a specific year.

The results of the linear trend, quadratic trend, exponential trend, first-order
autoregressive, second-order autoregressive and third-order autoregressive model are
presented below in which the coded month for the 1st month is 0:
Linear trend model:
Quadratic trend model:
Exponential trend model:
First-order autoregressive:
Second-order autoregressive:
Third-order autoregressive:

Below is the residual plot of the various models:
Referring to Table 16-13, what is the exponentially smoothed value for the second
month using a smoothing coefficient of W = 0.5?
TABLE 11-10
An agronomist wants to compare the crop yield of 3 varieties of chickpea seeds. She
plants all 3 varieties of the seeds on each of 5 different patches of fields. She then
measures the crop yield in bushels per acre. Treating this as a randomized block design,
the results are presented in the table that follows.
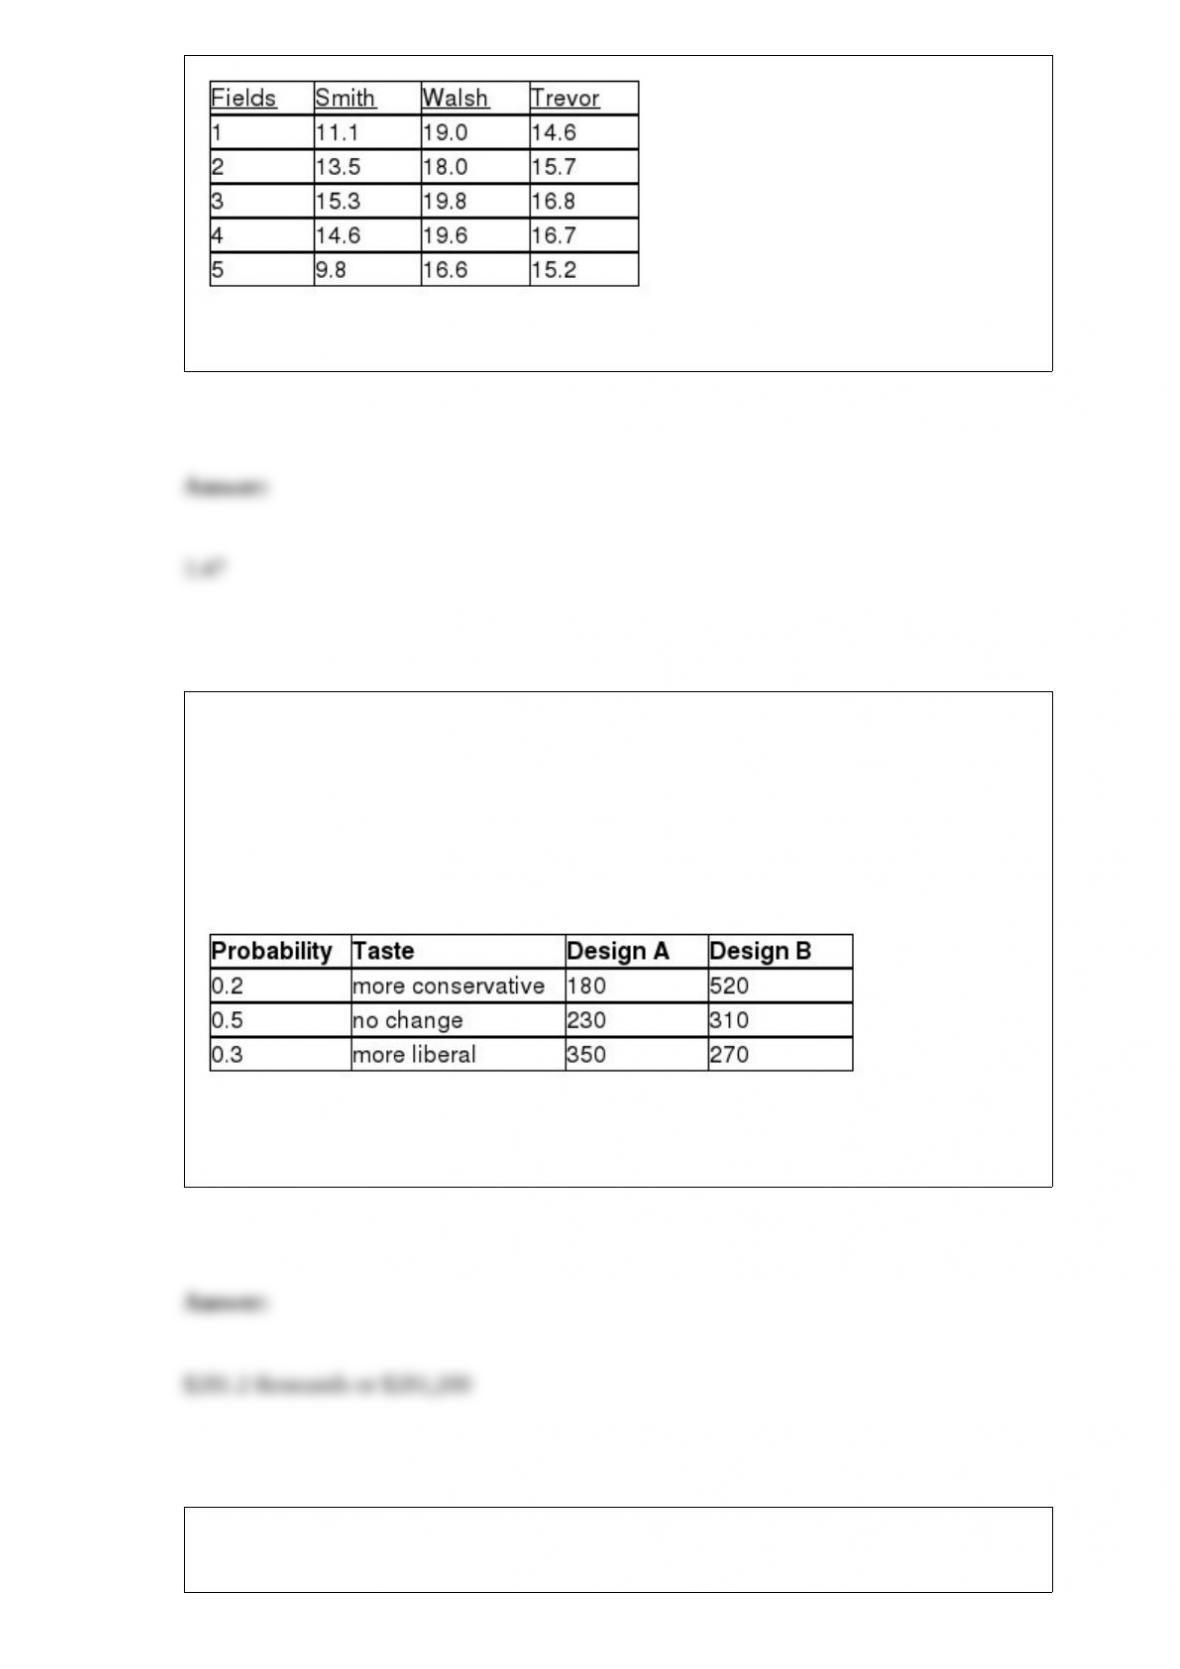
Referring to Table 11-10, what is the estimated relative efficiency?
TABLE 5-8
Two different designs on a new line of winter jackets for the coming winter are
available for your manufacturing plants. Your profit (in thousands of dollars) will
depend on the taste of the consumers when winter arrives. The probability of the three
possible different tastes of the consumers and the corresponding profits are presented in
the following table.
Referring to Table 5-8, if you decide to choose Design A for 70% of the production
lines and Design B for the remaining production lines, what is the expected profit?
TABLE 18-9
The manufacturer of canned food constructed control charts and analyzed several
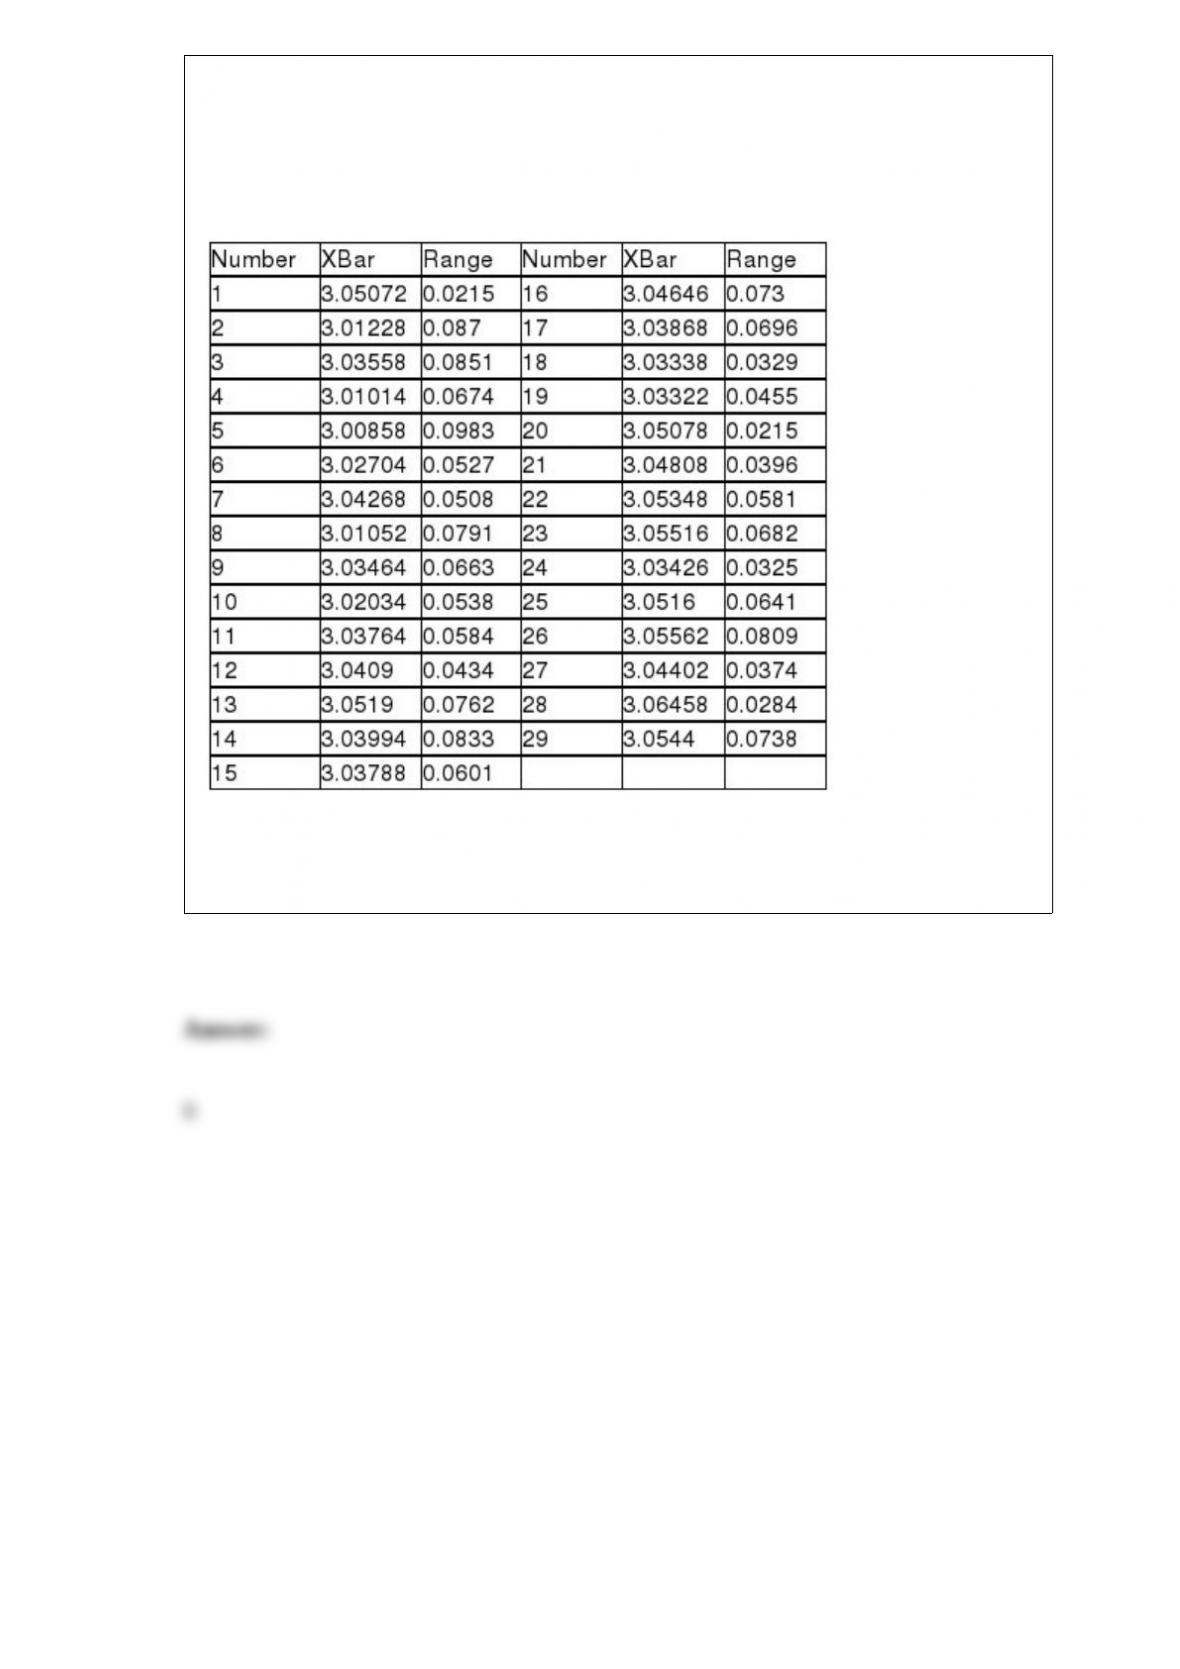
quality characteristics. One characteristic of interest is the weight of the filled cans. The
lower specification limit for weight is 2.95 pounds. The table below provides the range
and mean of the weights of five cans tested every fifteen minutes during a day’s
production.
Referring to Table 18-9, an R chart is to be constructed for the weight. One way to
create the lower control limit involves multiplying the mean of the sample ranges by
D3. For this data set, the value of D3 is ________.