TABLE 9-10
A manufacturer produces light bulbs that have a mean life of at least 500 hours when
the production process is working properly. Based on past experience, the population
standard deviation is 50 hours and the light bulb life is normally distributed. The
operations manager stops the production process if there is evidence that the population
mean light bulb life is below 500 hours.
Referring to Table 9-10, if you select a sample of 100 light bulbs and are willing to have
a level of significance of 0.01, the probability of the operations manager incorrectly
stopping the process if the population mean bulb life is 510 hours is ________.
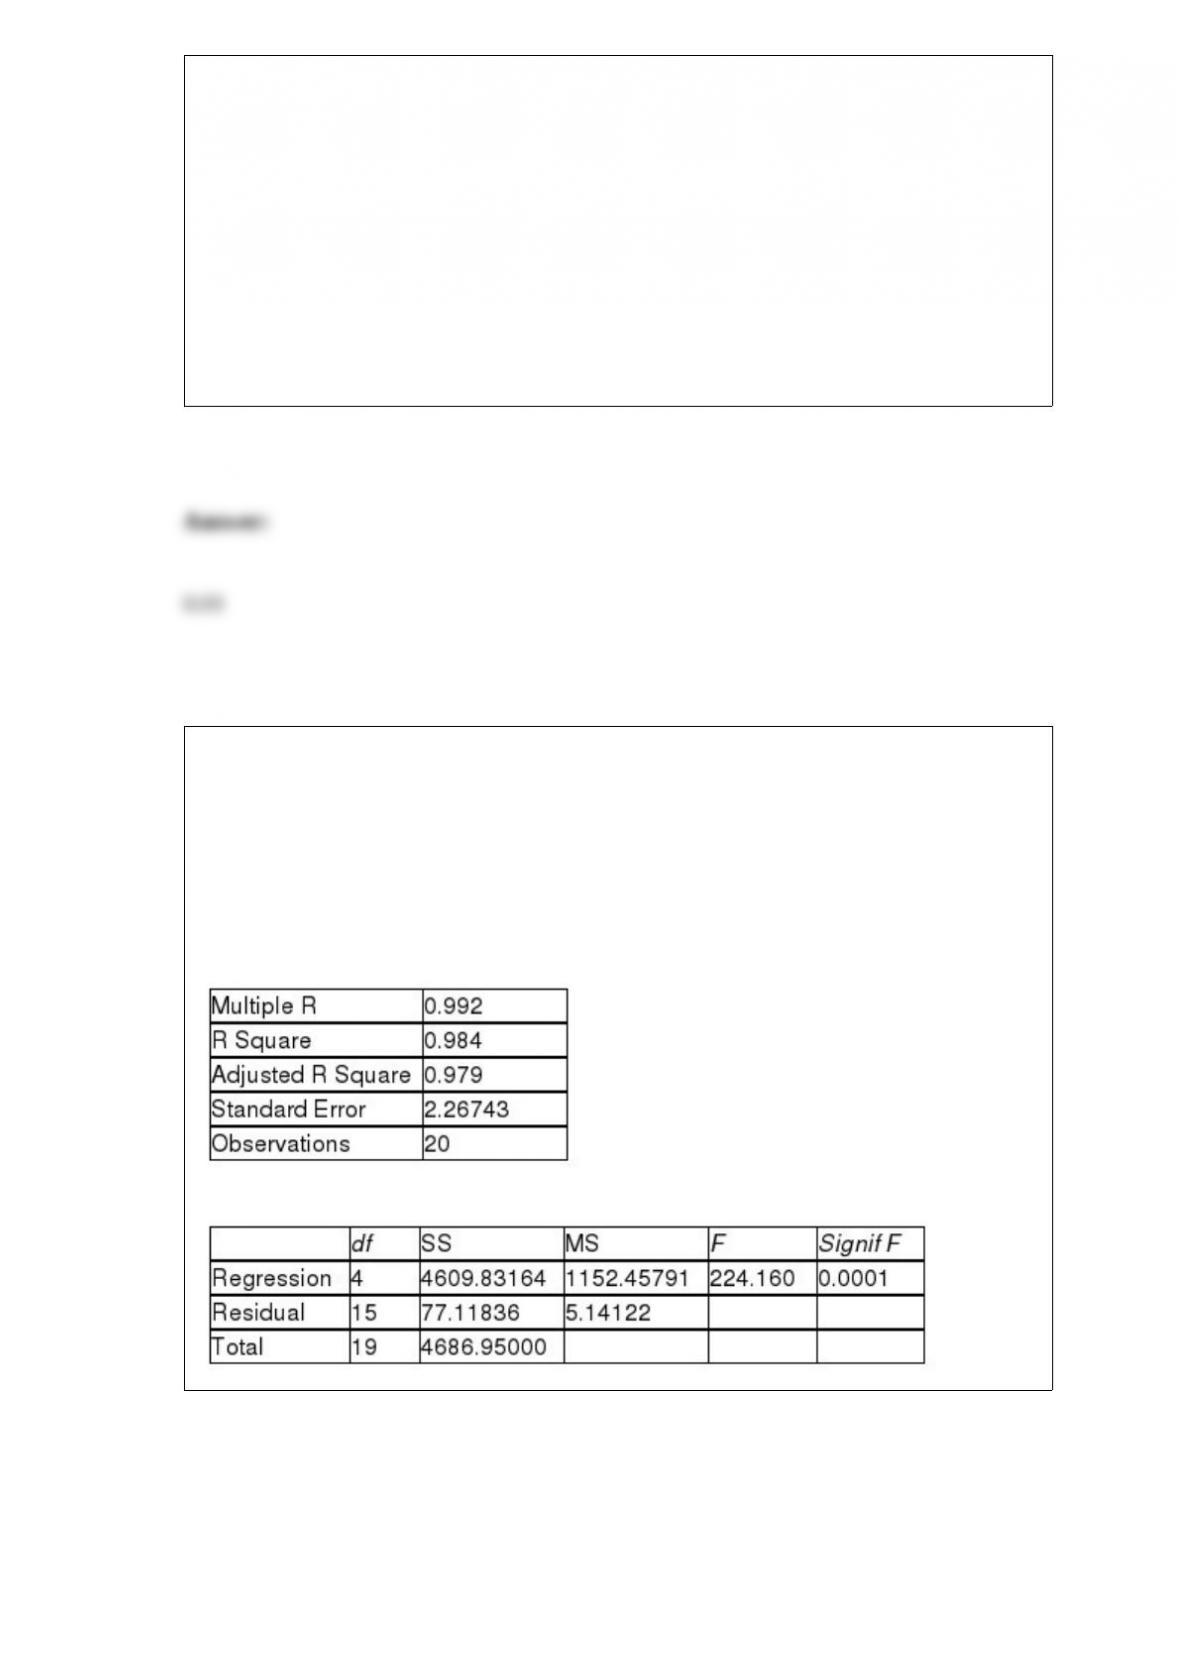
TABLE 17-3
A financial analyst wanted to examine the relationship between salary (in $1,000) and 4
variables: age (X1 = Age), experience in the field (X2 = Exper), number of degrees (X3 =
Degrees), and number of previous jobs in the field (X4 = Prevjobs). He took a sample of
20 employees and obtained the following Microsoft Excel output:
SUMMARY OUTPUT
Regression Statistics
ANOVA
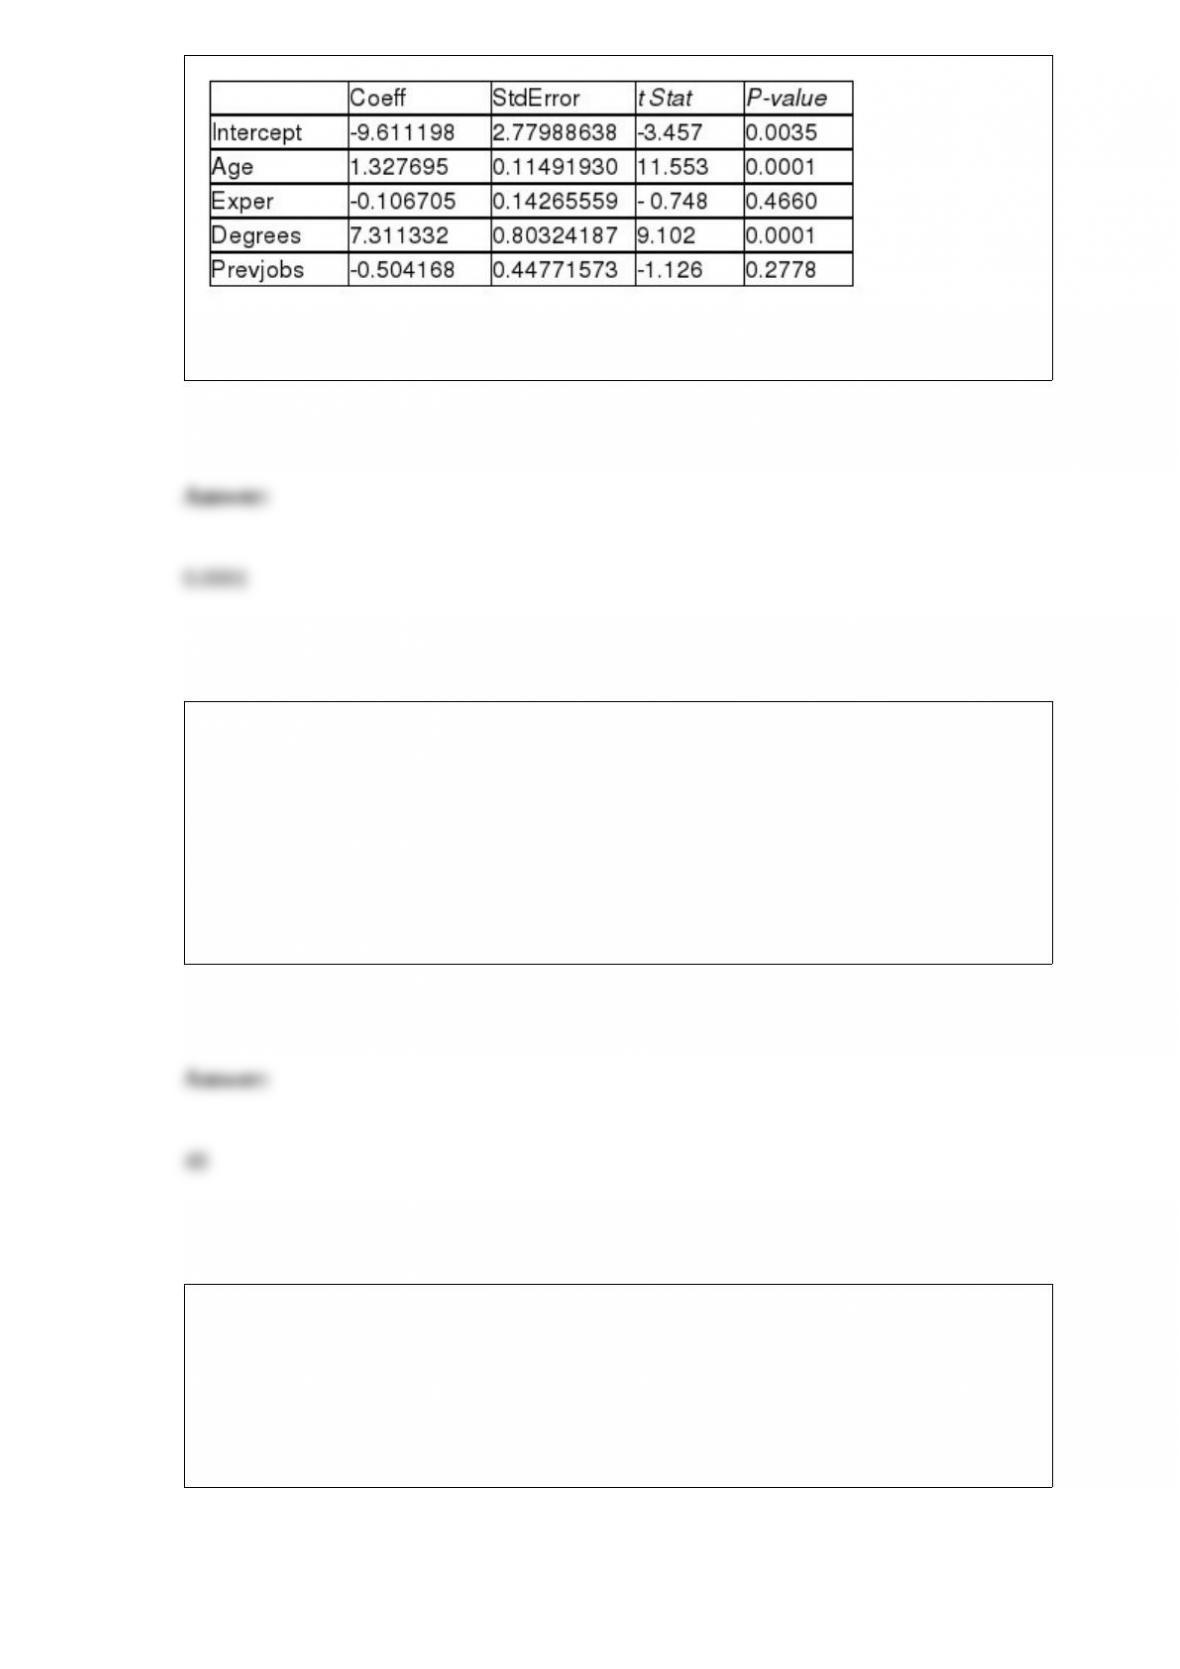
Referring to Table 17-3, the analyst wants to use a t test to test for the significance of
the coefficient of X3. The p-value of the test is ________.
TABLE 10-4
Two samples each of size 25 are taken from independent populations assumed to be
normally distributed with equal variances. The first sample has a mean of 35.5 and
standard deviation of 3.0 while the second sample has a mean of 33.0 and standard
deviation of 4.0.
Referring to Table 10-4, there are ________ degrees of freedom for this test.
TABLE 6-3
Suppose the time interval between two consecutive defective light bulbs from a
production line has a uniform distribution over an interval from 0 to 90 minutes.
Referring to Table 6-3, what is the variance of the time interval?
A study at a college in the west coast reveals that, historically, 45% of the students are
minority students. If random sample sizes of 75 are selected, the standard error of the
proportion of students in the samples who are minority students is ________.
Referring to Table 14-18, what is the p-value of the test statistic when
testing whether the model is a good-tting model?
TABLE 14-18
A logistic regression model was estimated in order to predict the
probability that a randomly chosen university or college would be a
private university using information on mean total Scholastic Aptitude
Test score (SAT) at the university or college and whether the TOEFL
criterion is at least 90 (Toe90 = 1 if yes, 0 otherwise). The
dependent variable, Y, is school type (Type = 1 if private and 0
otherwise).
The PHStat output is given below:
TABLE 5-9
A major hotel chain keeps a record of the number of mishandled bags per 1,000
customers. In a recent year, the hotel chain had 4.06 mishandled bags per 1,000
customers. Assume that the number of mishandled bags has a Poisson distribution.
Referring to Table 5-9, what is the probability that in the next 1,000 customers, the
chain will have at least one mishandled bag?
TABLE 6-2
John has two jobs. For daytime work at a jewelry store he is paid $15,000 per month,
plus a commission. His monthly commission is normally distributed with a mean of
$10,000 and a standard deviation of $2,000. At night he works occasionally as a waiter,
for which his monthly income is normally distributed with a mean of $1,000 and a
standard deviation of $300. John’s income levels from these two sources are
independent of each other.
Referring to Table 6-2, the probability is 0.25 that John’s income as a waiter is no more
than how much in a given month?
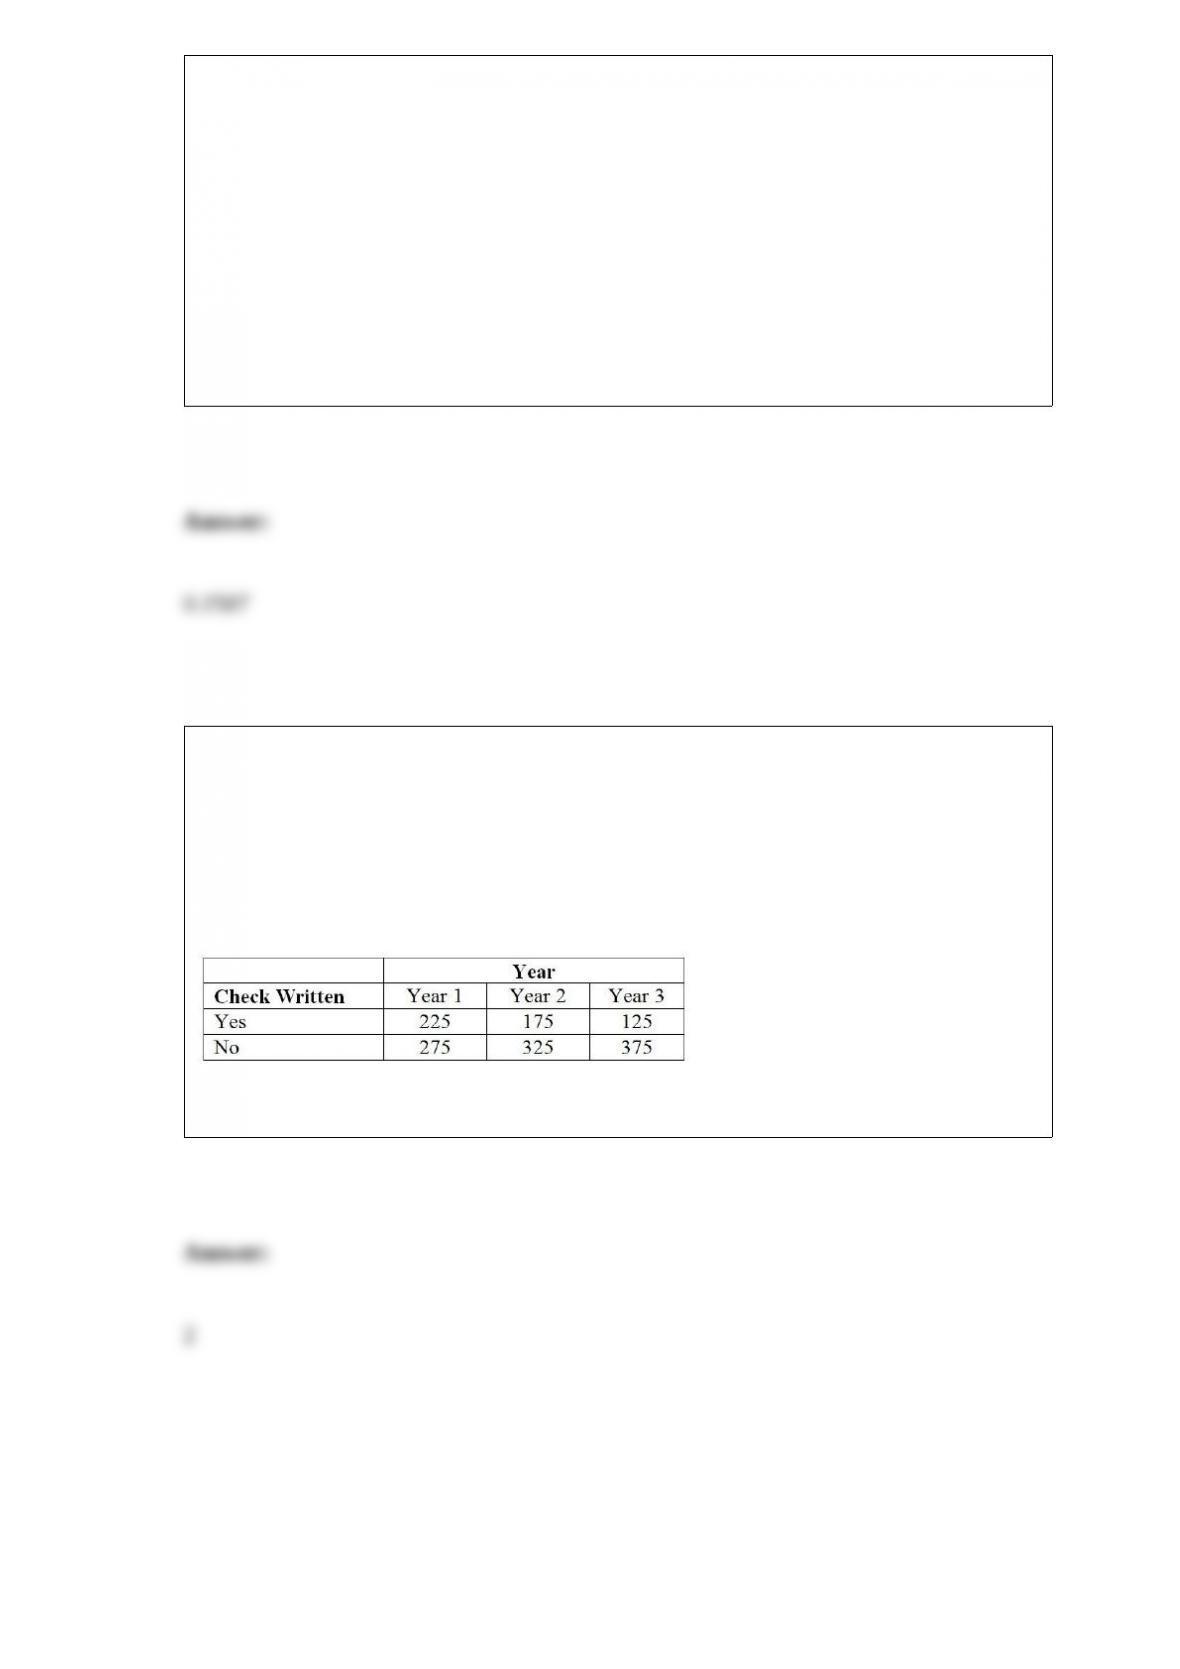
TABLE 6-2
John has two jobs. For daytime work at a jewelry store he is paid $15,000 per month,
plus a commission. His monthly commission is normally distributed with a mean of
$10,000 and a standard deviation of $2,000. At night he works occasionally as a waiter,
for which his monthly income is normally distributed with a mean of $1,000 and a
standard deviation of $300. John’s income levels from these two sources are
independent of each other.
Referring to Table 6-2, for a given month, what is the probability that John’s
commission from the jewelry store is no more than $8,000?
TABLE 12-6
According to an article in Marketing News, fewer checks are being written at the
grocery store checkout than in the past. To determine whether there is a difference in
the proportion of shoppers who pay by check among three consecutive years at a 0.05
level of significance, the results of a survey of 500 shoppers in three consecutive years
are obtained and presented below.
Referring to Table 12-6, what are the degrees of freedom of the test statistic?