
Suppose Z has a standard normal distribution with a mean of 0 and standard deviation
of 1. The probability that Z is more than -0.98 is ________.
Referring to Table 14-12, if one is already o campus but decides to
park 3 more blocks from the quad, the estimated mean parking meter
rate will decrease by ________.
TABLE 14-12
As a project for his business statistics class, a student examined the
factors that determined parking meter rates throughout the campus
area. Data were collected for the price ($) per hour of parking, blocks
to the quadrangle, and whether the parking is on or o campus. The
population regression model hypothesized is Yi = α + β1X1i + β2X2i
+ ε
where
Y is the meter price per hour.
X1 is the number of blocks to the quad.
X2 is a dummy variable that takes the value 1 if the meter is located
on campus and 0 otherwise.
The following Excel results are obtained.
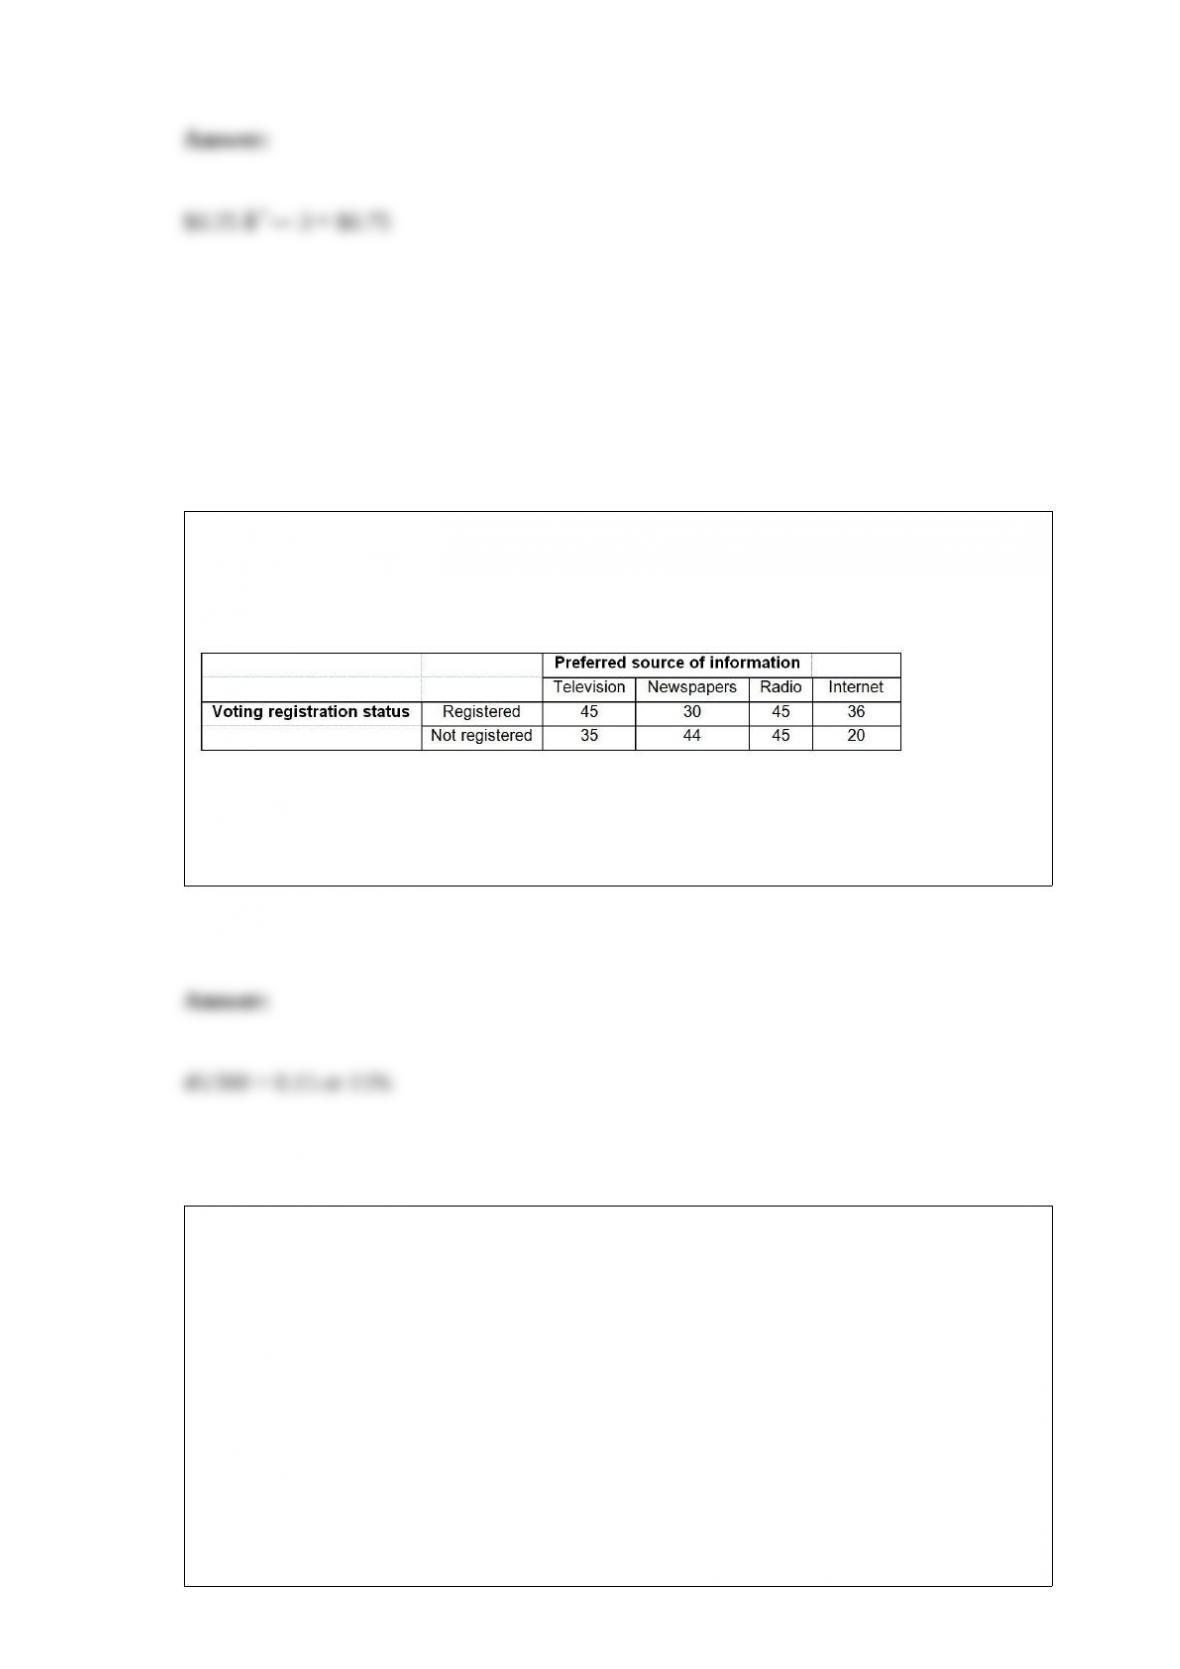
TABLE 4-11
A sample of 300 adults is selected. The contingency table below shows their registration
status and their preferred source of information on current events.
Referring to Table 4-11, if an adult is selected at random, what is the probability that
he/she is a registered voter who prefers to get his/her current information from the
television?
TABLE 17-9
What are the factors that determine the acceleration time (in sec.) from 0 to 60 miles per
hour of a car? Data on the following variables for 171 different vehicle models were
collected:
Accel Time: Acceleration time in sec.
Cargo Vol: Cargo volume in cu. ft.
HP: Horsepower
MPG: Miles per gallon
SUV: 1 if the vehicle model is an SUV with Coupe as the base when SUV and Sedan
are both 0
Sedan: 1 if the vehicle model is a sedan with Coupe as the base when SUV and Sedan
are both 0
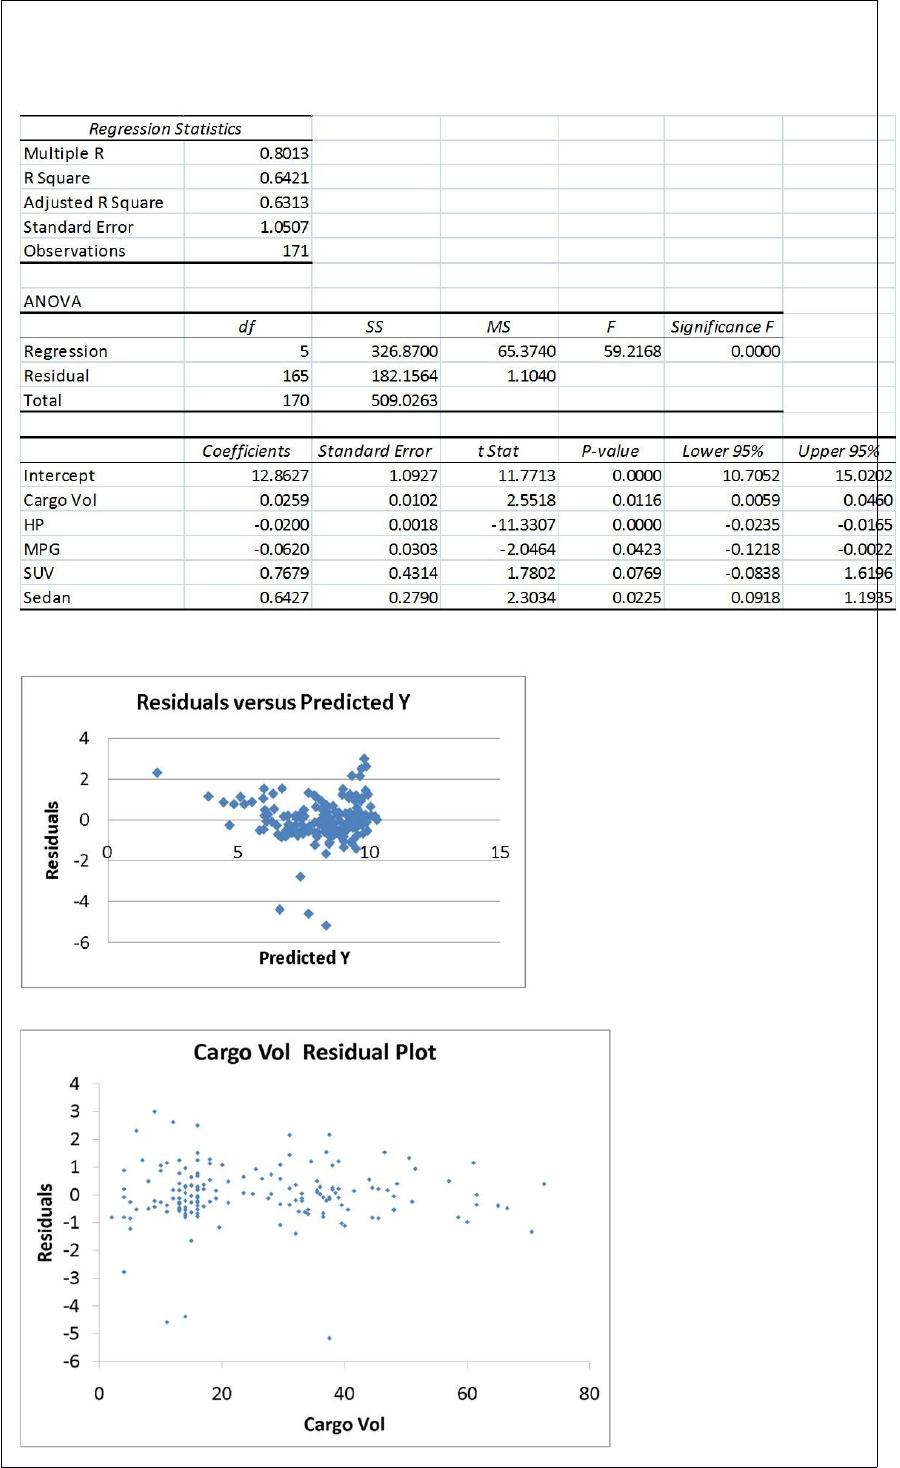
The regression results using acceleration time as the dependent variable and the
remaining variables as the independent variables are presented below.
The various residual plots are as shown below.
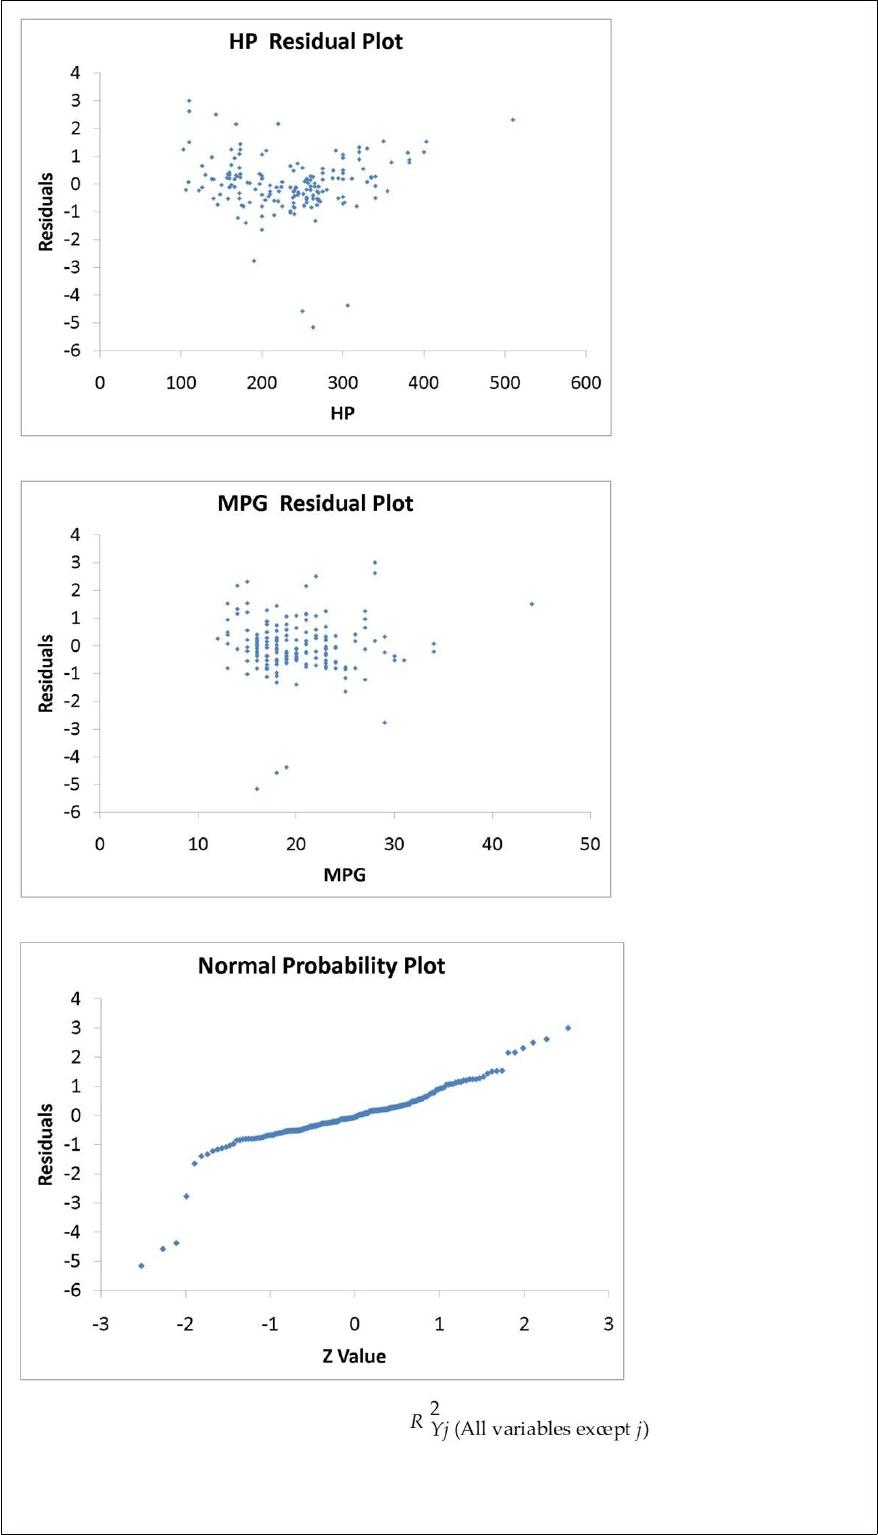
The coefficient of partial determination ( ) of each of the 5
predictors are, respectively, 0.0380, 0.4376, 0.0248, 0.0188, and 0.0312.
The coefficient of multiple determination for the regression model using each of the 5
variables Xj as the dependent variable and all other X variables as independent variables
( ) are, respectively, 0.7461, 0.5676, 0.6764, 0.8582, 0.6632.
Referring to Table 17-9, ________ of the variation in Accel Time can be explained by
Cargo Vol while controlling for the other independent variables.
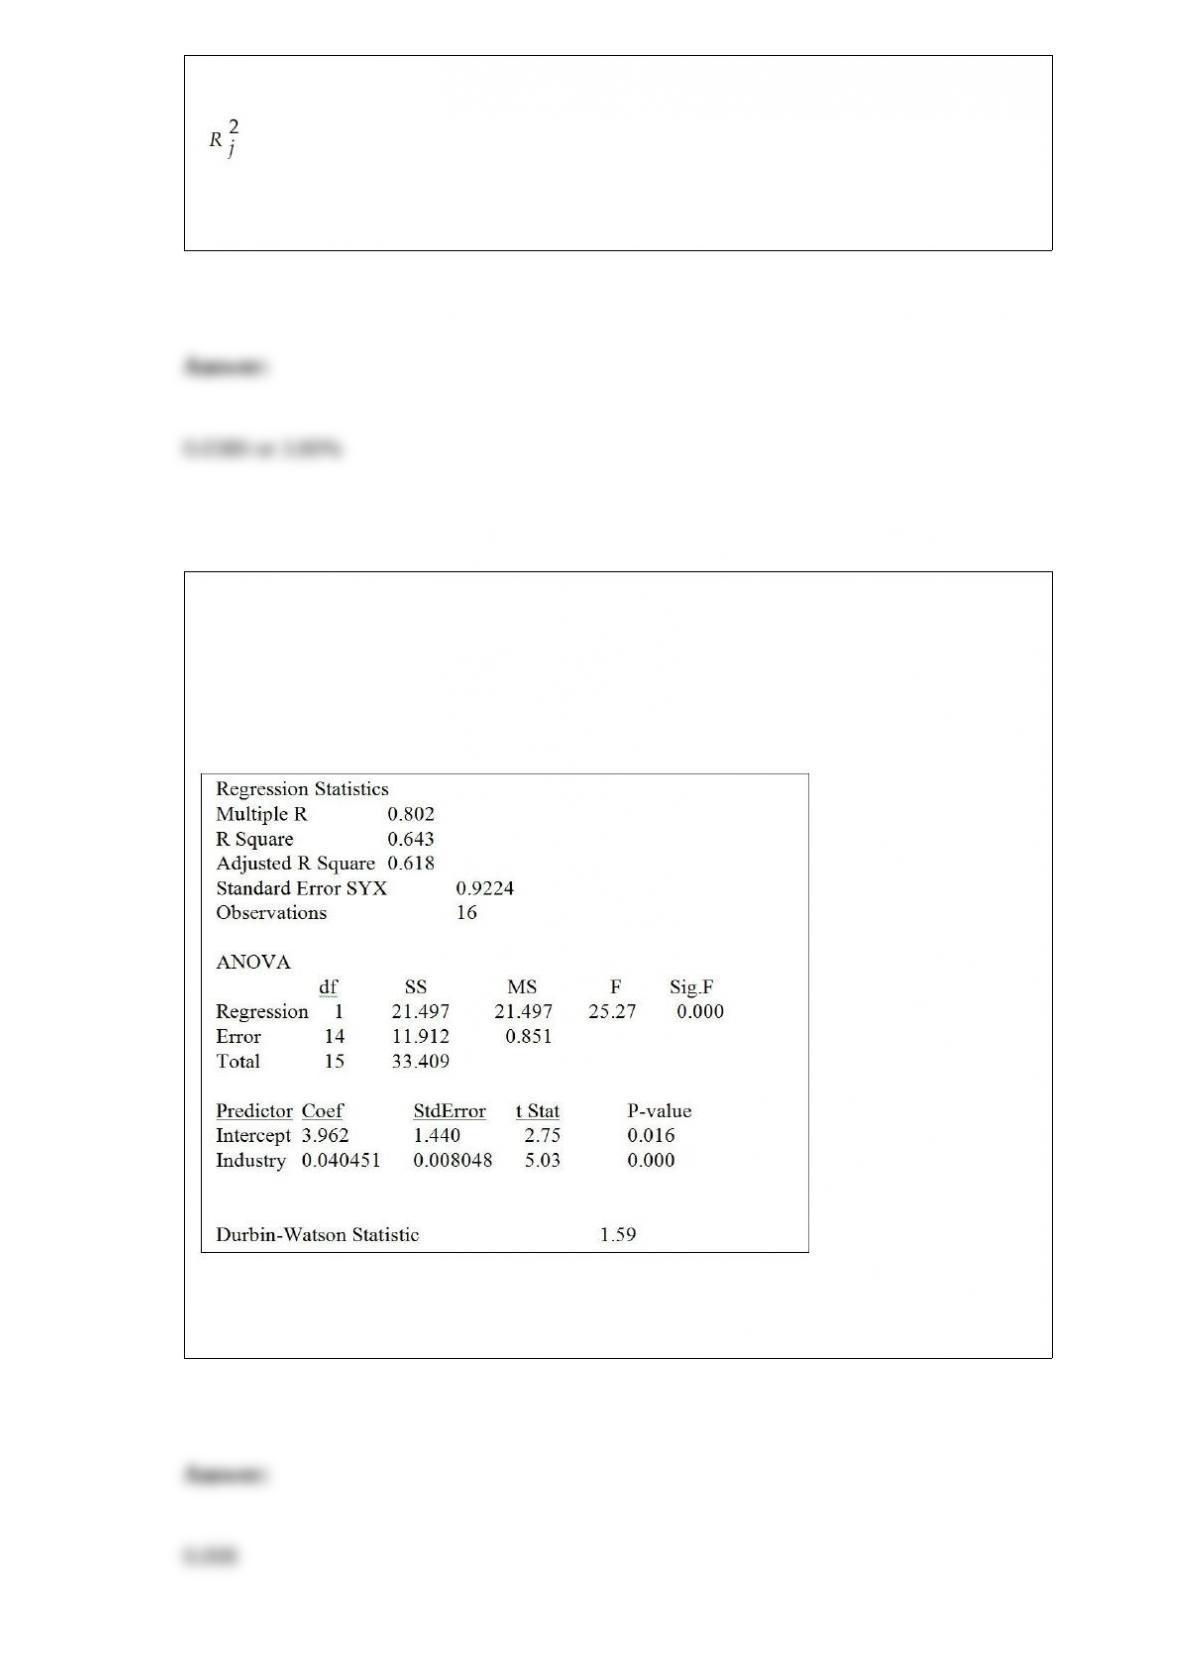
TABLE 13-5
The managing partner of an advertising agency believes that his company’s sales are
related to the industry sales. He uses Microsoft Excel to analyze the last 4 years of
quarterly data (i.e., n = 16) with the following results:
Referring to Table 13-5, the standard error of the estimated slope coefficient is
________.