True or False: TABLE 17-8
The superintendent of a school district wanted to predict the percentage of students
passing a sixth-grade proficiency test. She obtained the data on percentage of students
passing the proficiency test (% Passing), daily mean of the percentage of students
attending class (% Attendance), mean teacher salary in dollars (Salaries), and
instructional spending per pupil in dollars (Spending) of 47 schools in the state.
Following is the multiple regression output with Y = % Passing as the dependent
variable, X1 = % Attendance, X2 = Salaries and X3 = Spending:
Referring to Table 17-8, you can conclude that instructional spending per pupil
individually has no impact on the mean percentage of students passing the proficiency
test, taking into account the effect of all the other independent variables, at a 10% level
of significance based solely on the 95% confidence interval estimate for β3.
True or False: One of the reasons that a correction for continuity adjustment is needed
when approximating the binomial distribution with a normal distribution is because the
normal distribution is used for a discrete random variable while the binomial
distribution is used for a continuous random variable.
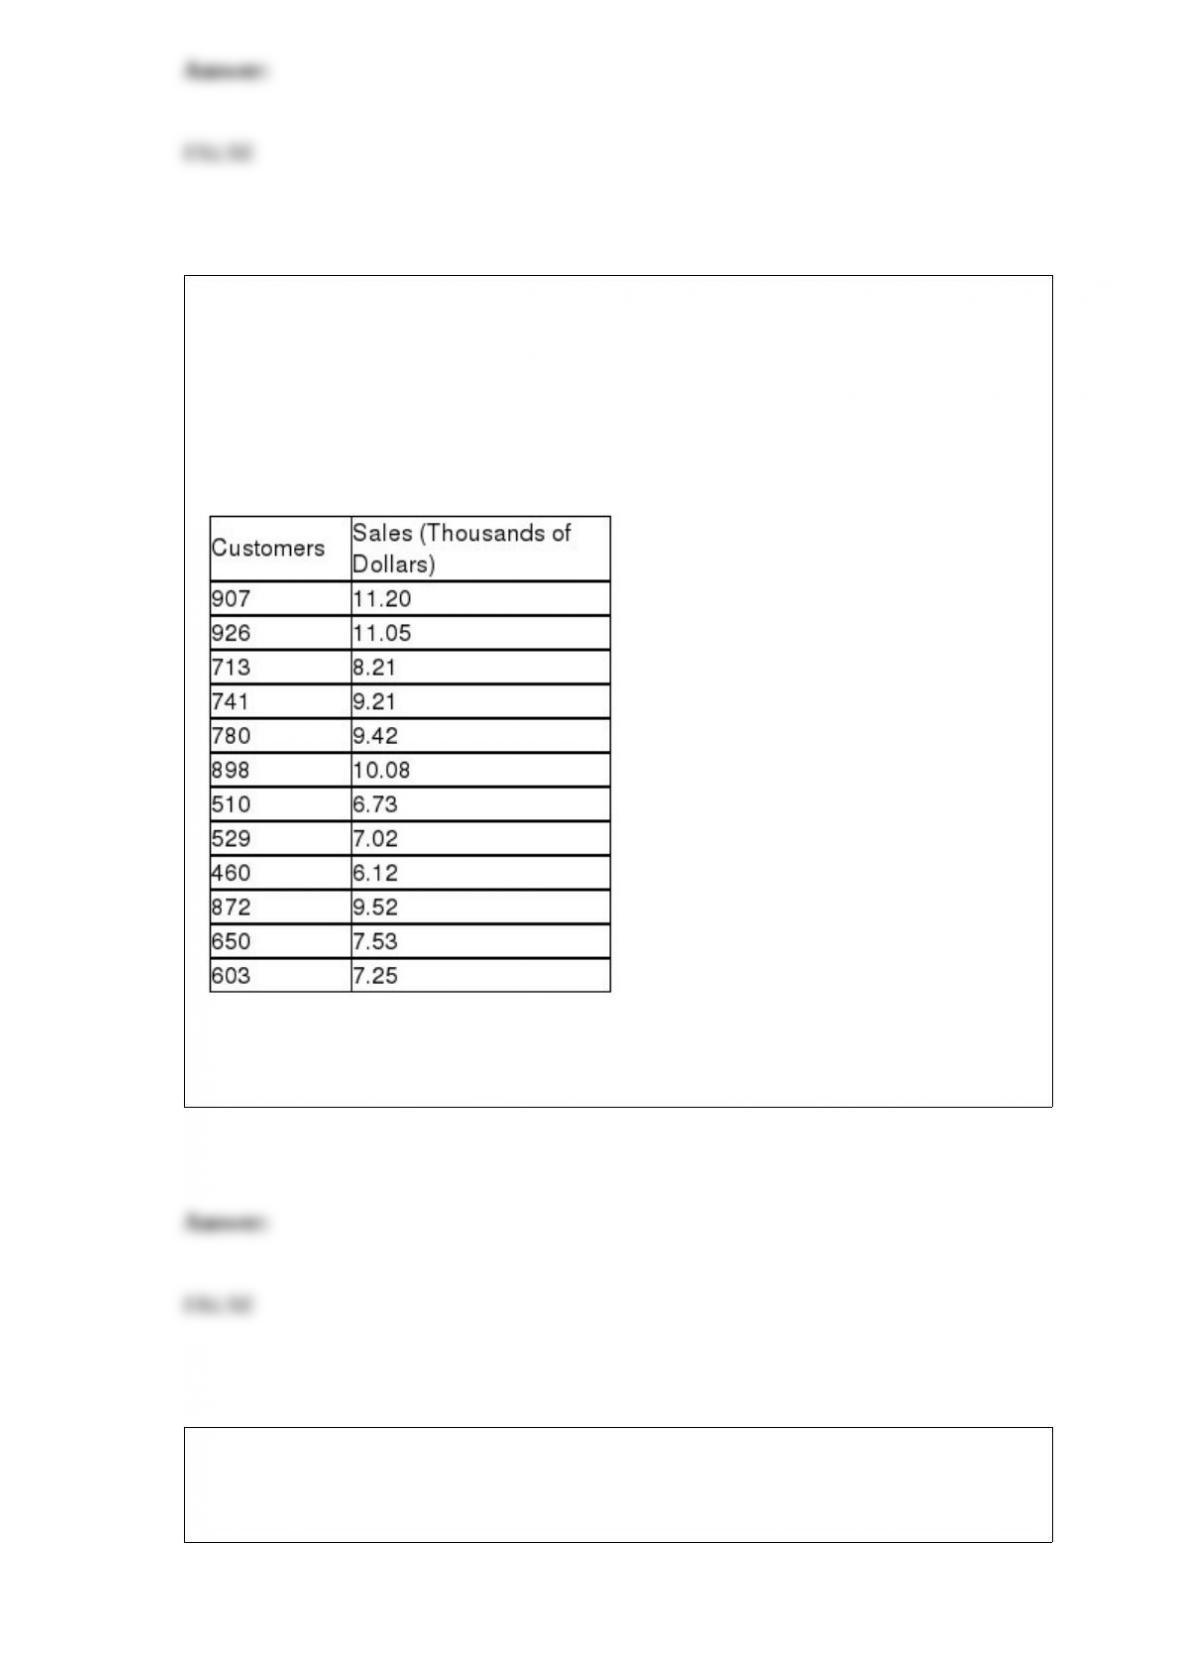
TABLE 13-10
The management of a chain electronic store would like to develop a model for
predicting the weekly sales (in thousands of dollars) for individual stores based on the
number of customers who made purchases. A random sample of 12 stores yields the
following results:
True or False: Referring to Table 13-10, the mean weekly sales will increase by an
estimated $0.01 for each additional purchasing customer.
True or False: Referring to Table 14-16, the 0 to 60 miles per hour acceleration time of
a sedan is predicted to be 0.7264 seconds higher than that of a non-sedan with the same
engine size.
True or False: Data were collected on the amount of detergent used in gallons in a
month by 25 drive-through car wash operations in Phoenix. You can use a time-series
plot to present this information.
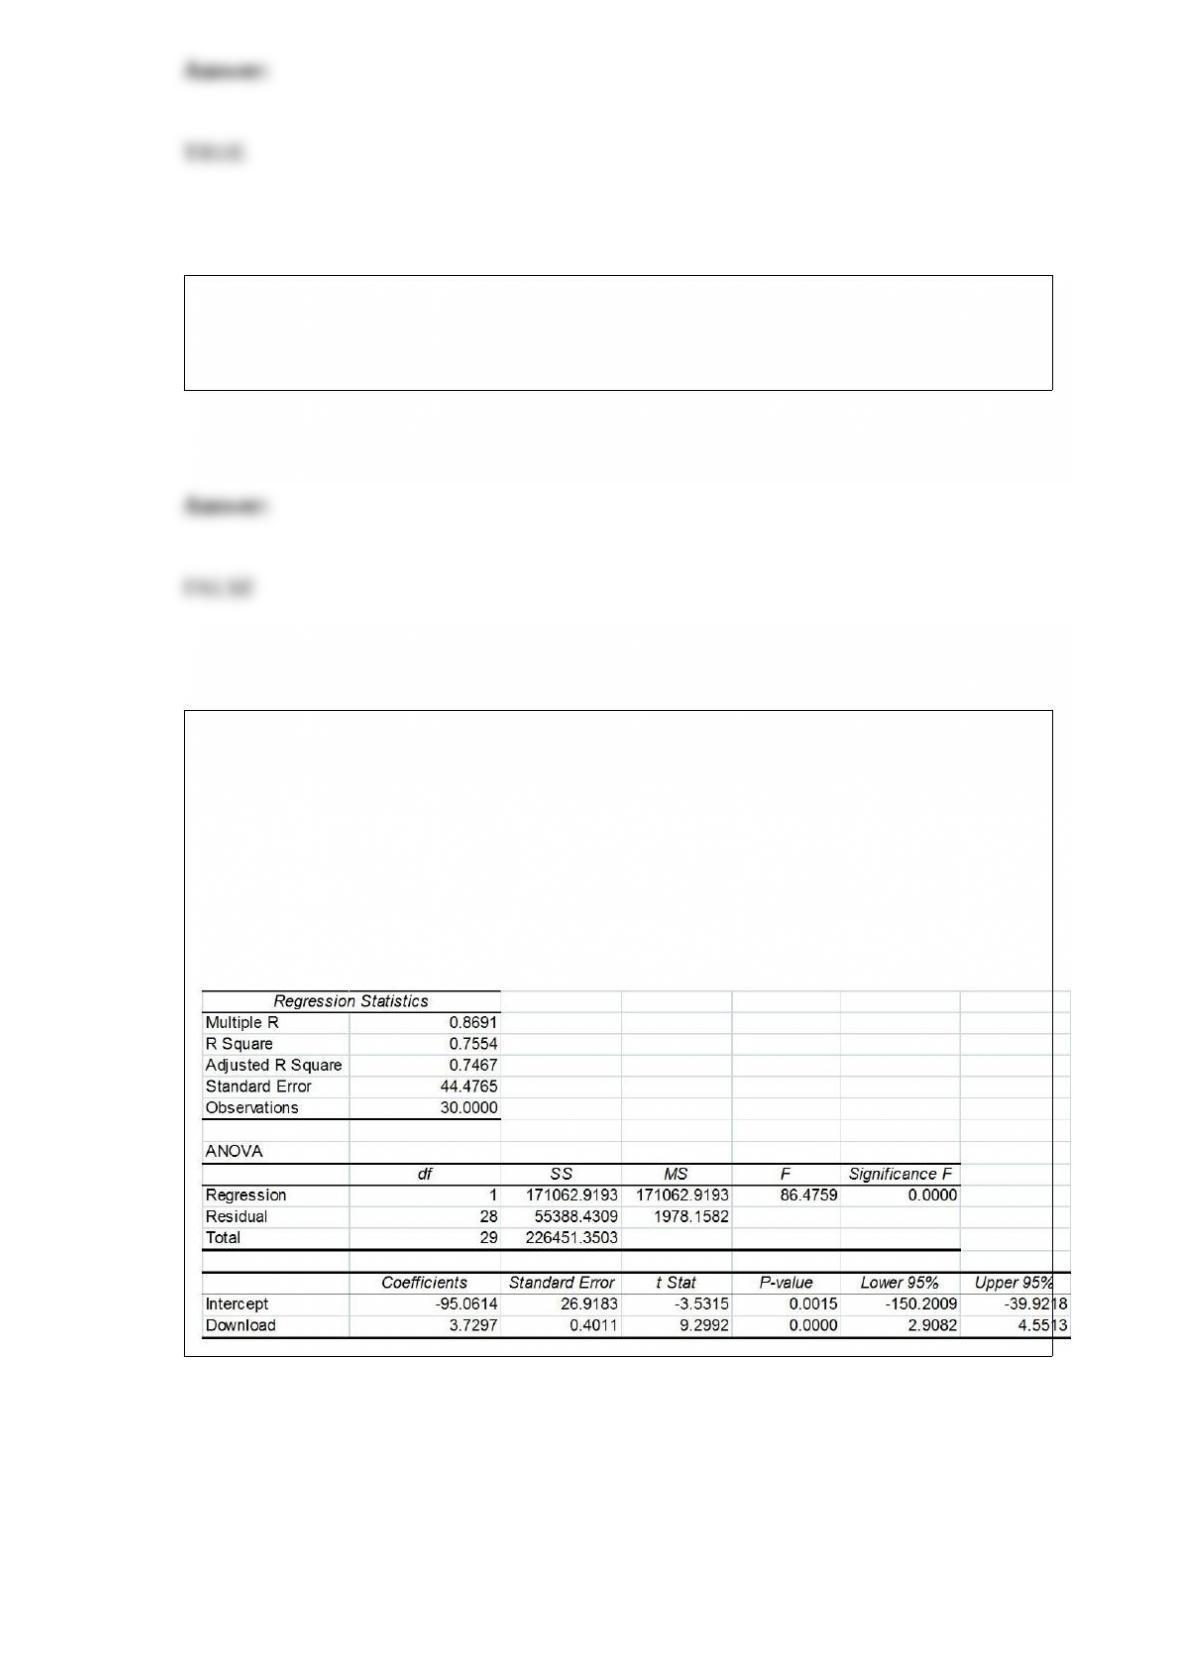
TABLE 13-11
A computer software developer would like to use the number of downloads (in
thousands) for the trial version of his new shareware to predict the amount of revenue
(in thousands of dollars) he can make on the full version of the new shareware.
Following is the output from a simple linear regression along with the residual plot and
normal probability plot obtained from a data set of 30 different sharewares that he has
developed:
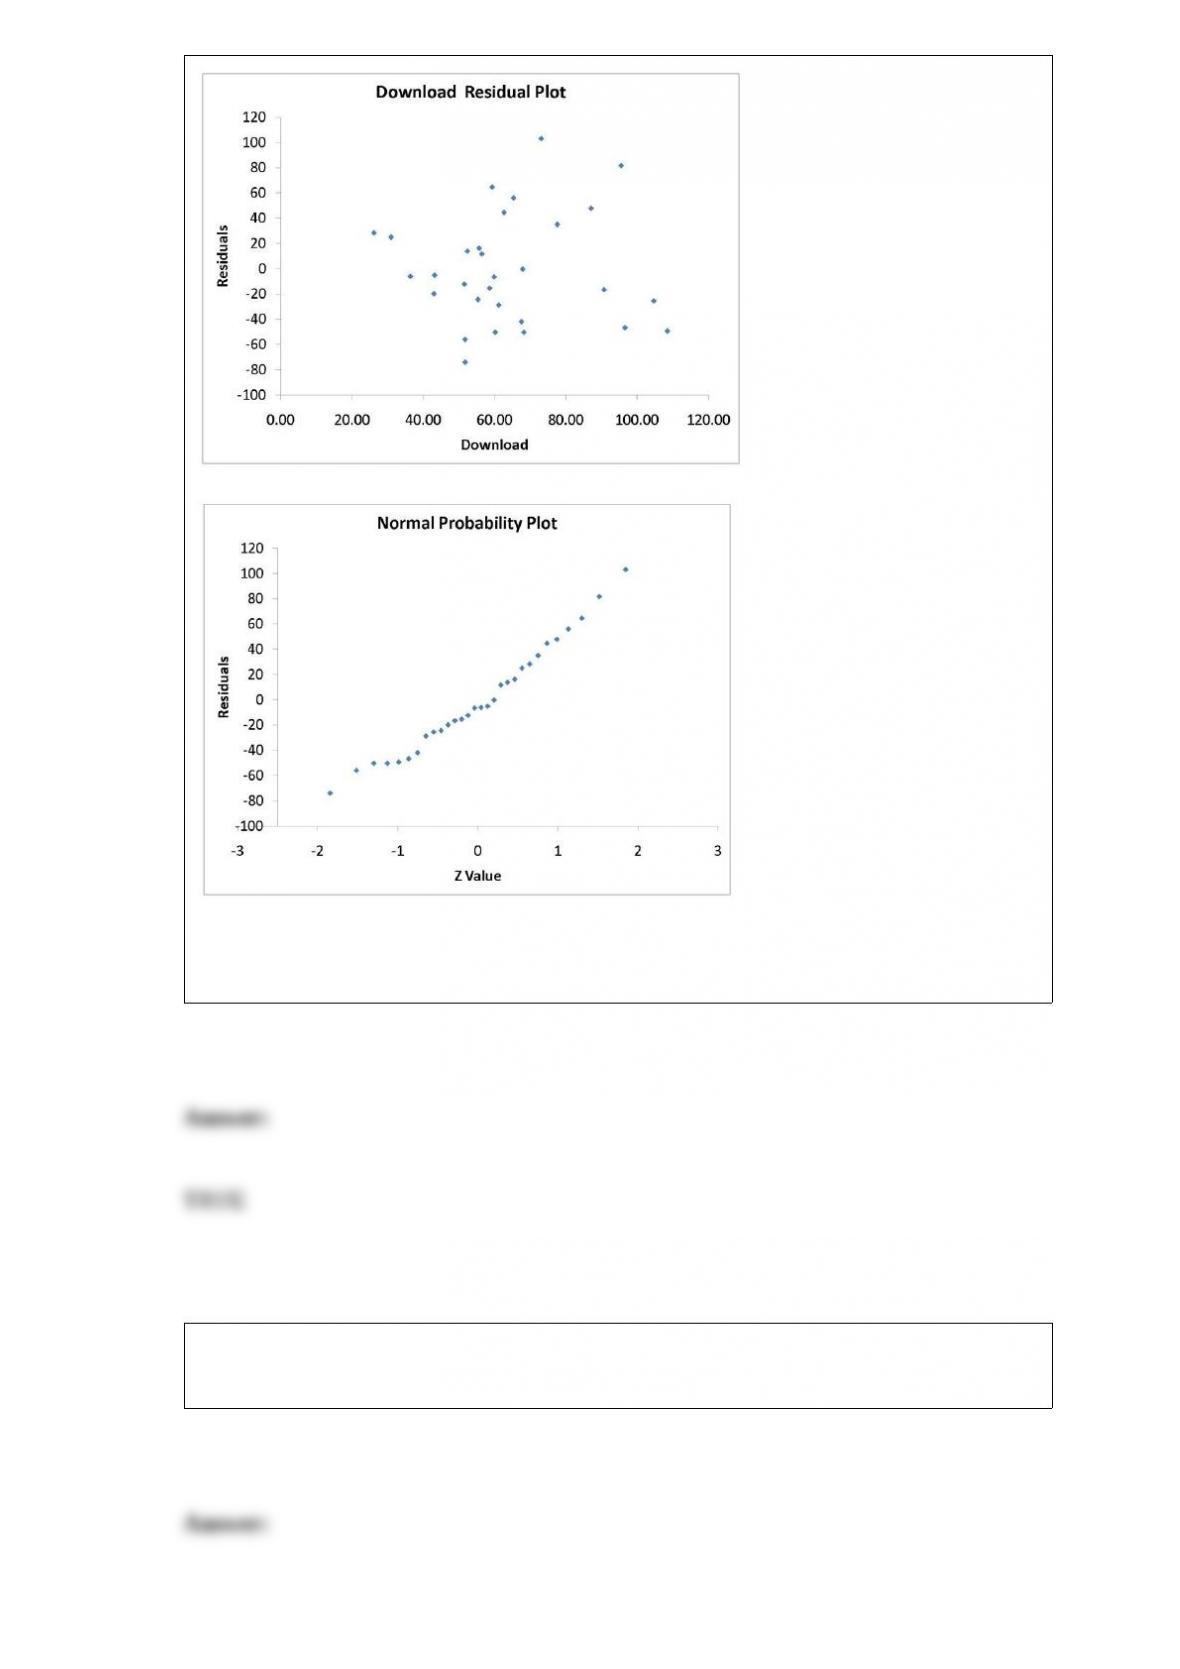
True or False: Referring to Table 13-11, the Durbin-Watson statistic is inappropriate for
this data set.
True or False: Holding the level of confidence fixed, increasing the sample size will
lead to a wider confidence interval.

Selection of raffle tickets from a large bowl is an example of
A) simple probability.
B) sampling without replacement.
C) subjective probability.
D) None of the above.
The owner of a fish market determined that the average weight for a catfish is 3.2
pounds with a standard deviation of 0.8 pound. A citation catfish should be one of the
top 2% in weight. Assuming the weights of catfish are normally distributed, at what
weight (in pounds) should the citation designation be established?
A) 1.56 pounds
B) 4.84 pounds
C) 5.20 pounds
D) 7.36 pounds
How many tissues should the Kimberly Clark Corporation package of Kleenex contain?
Researchers determined that 60 tissues is the mean number of tissues used during a

cold. Suppose a random sample of 100 Kleenex users yielded the following data on the
number of tissues used during a cold: = 52,
S = 22. Using the sample information provided, calculate the value of the test statistic.
A) t = (52 – 60) / 22
B) t = (52 – 60) / (22 / 100)
C) t = (52 – 60) / (22 / 1002)
D) t = (52 – 60) / (22 / 10)
TABLE 17-9
What are the factors that determine the acceleration time (in sec.) from 0 to 60 miles per
hour of a car? Data on the following variables for 171 different vehicle models were
collected:
Accel Time: Acceleration time in sec.
Cargo Vol: Cargo volume in cu. ft.
HP: Horsepower
MPG: Miles per gallon
SUV: 1 if the vehicle model is an SUV with Coupe as the base when SUV and Sedan
are both 0
Sedan: 1 if the vehicle model is a sedan with Coupe as the base when SUV and Sedan
are both 0
The regression results using acceleration time as the dependent variable and the
remaining variables as the independent variables are presented below.
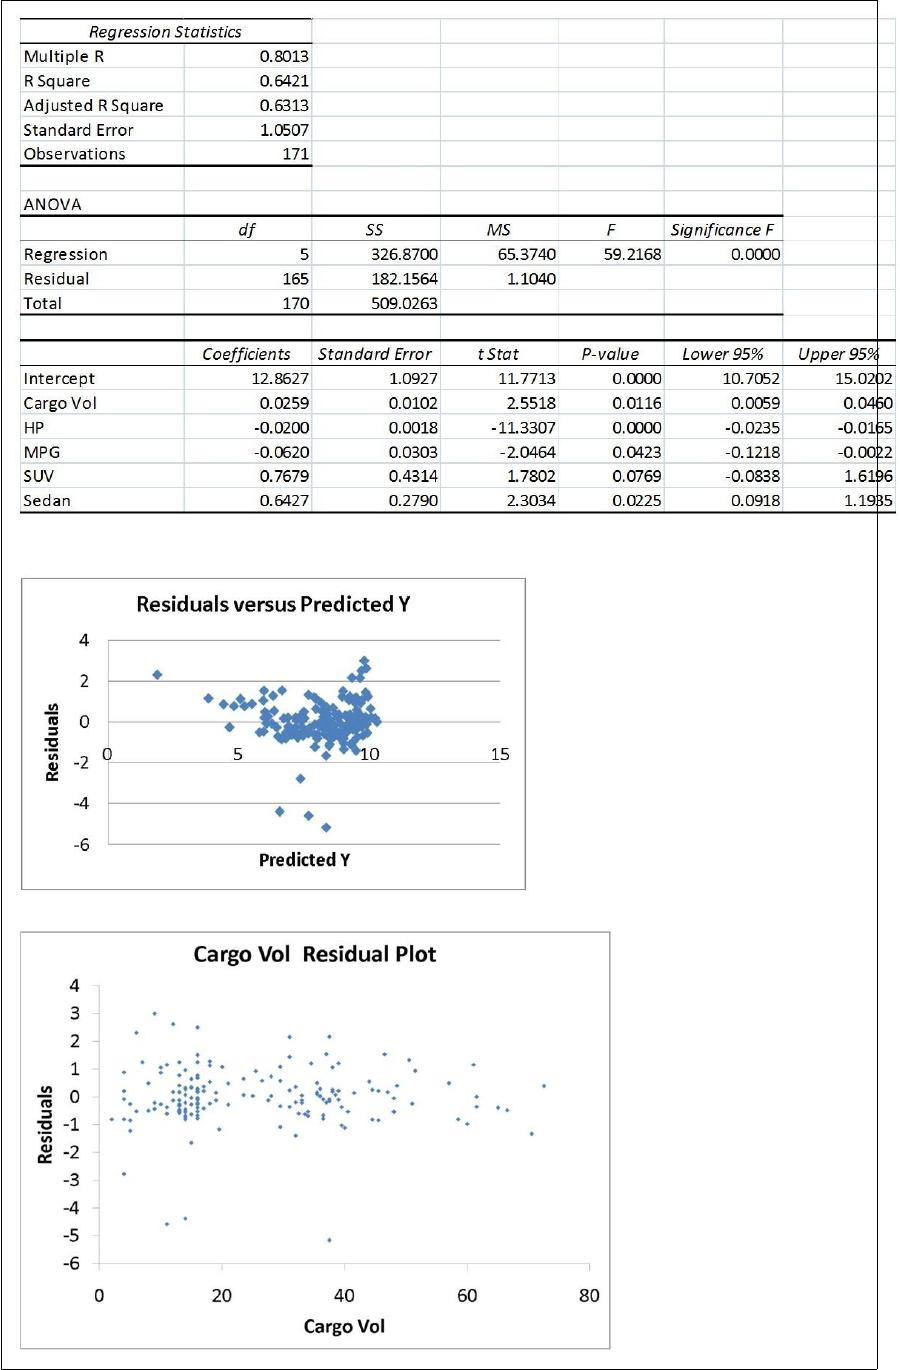
The various residual plots are as shown below.
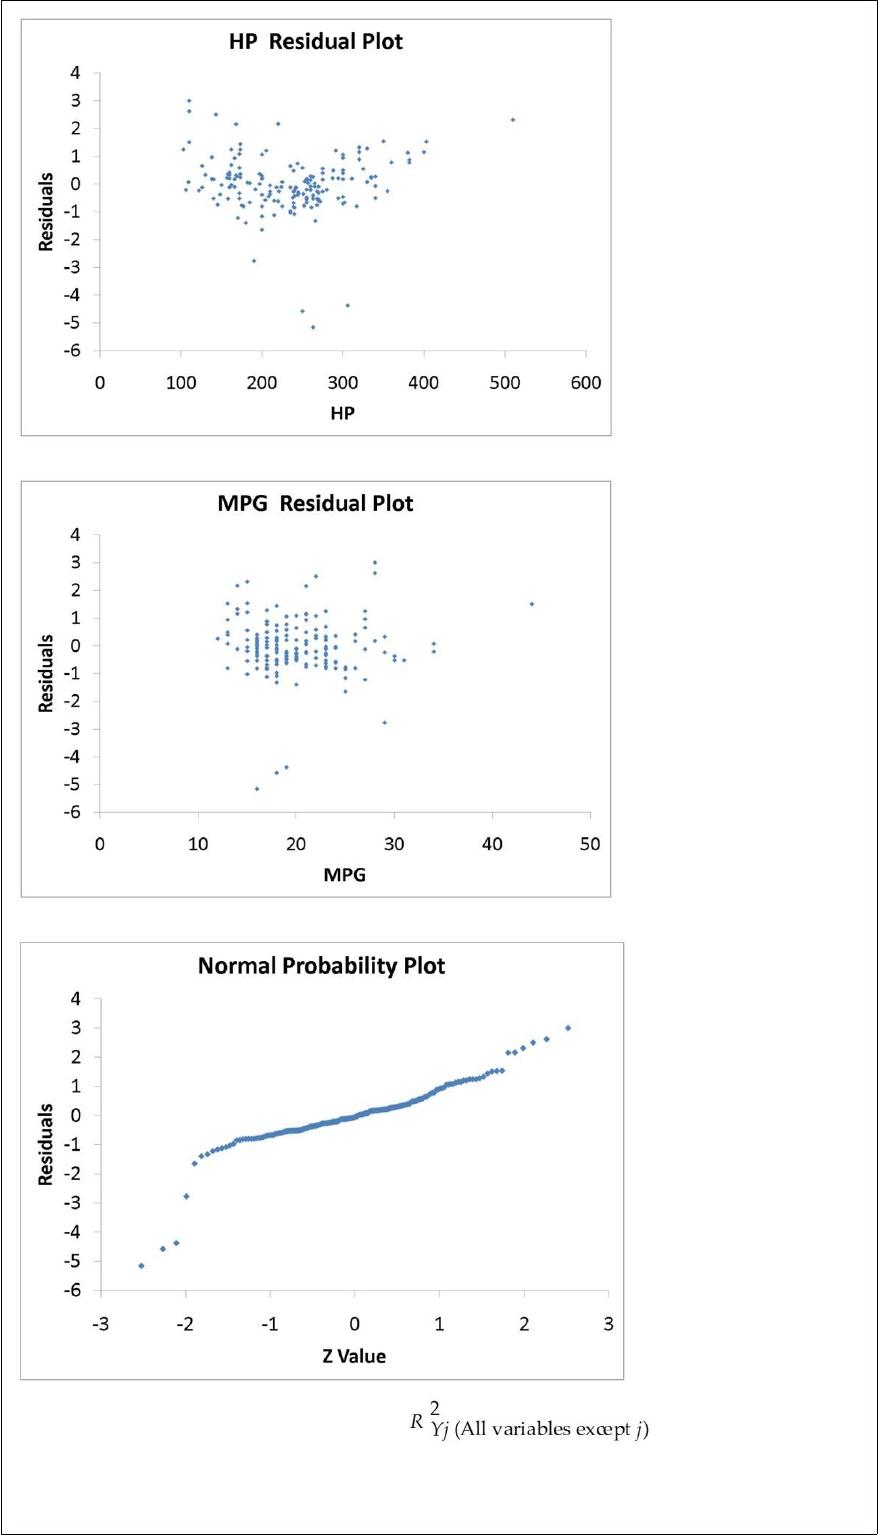
The coefficient of partial determination ( ) of each of the 5
predictors are, respectively, 0.0380, 0.4376, 0.0248, 0.0188, and 0.0312.
The coefficient of multiple determination for the regression model using each of the 5

variables Xj as the dependent variable and all other X variables as independent variables
( ) are, respectively, 0.7461, 0.5676, 0.6764, 0.8582, 0.6632.
Referring to Table 17-9, what is the correct interpretation for the estimated coefficient
for HP?
A) As the horsepower increases by one unit, the mean 0 to 60 miles per hour
acceleration time will decrease by an estimated 0.0200 seconds without taking into
consideration all the other independent variables included in the model.
B) As the 0 to 60 miles per hour acceleration time increases by one second, the mean
horsepower will decrease by an estimated 0.0200 unit without taking into consideration
all the other independent variables included in the model.
C) As the horsepower increases by one unit, the mean 0 to 60 miles per hour
acceleration time will decrease by an estimated 0.0200 seconds taking into
consideration all the other independent variables included in the model.
D) As the 0 to 60 miles per hour acceleration time increases by one second, the mean
horsepower will decrease by an estimated 0.0200 unit taking into consideration all the
other independent variables included in the model.
Developing operational definitions for each critical-to-quality characteristic involves
which part of the DMAIC process?
A) Define
B) Measure
C) Analyze
D) Improve
E) Control
TABLE 9-1
Microsoft Excel was used on a set of data involving the number of defective items
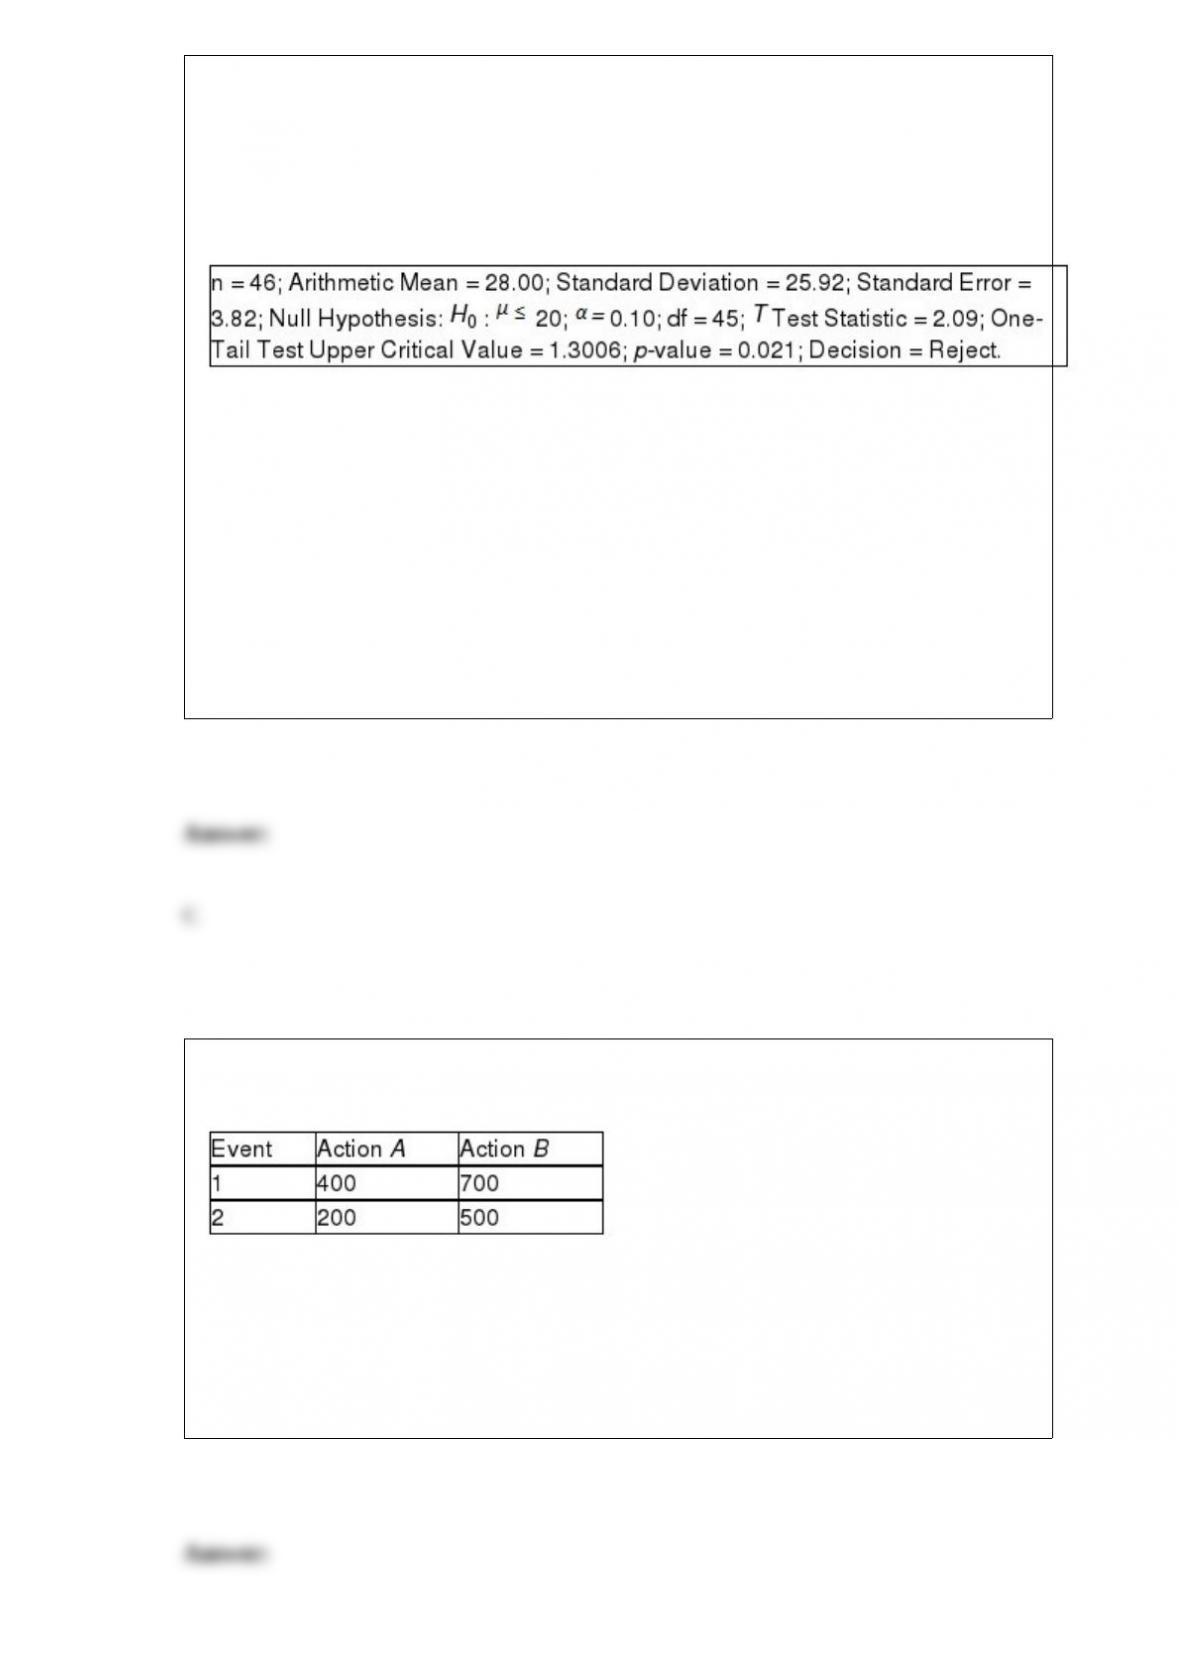
found in a random sample of 46 cases of light bulbs produced during a morning shift at
a plant. A manager wants to know if the mean number of defective bulbs per case is
greater than 20 during the morning shift. She will make her decision using a test with a
level of significance of 0.10. The following information was extracted from the
Microsoft Excel output for the sample of 46 cases:
Referring to Table 9-1, what critical value should the manager use to determine the
rejection region?
A) 1.6794
B) 1.3011
C) 1.3006
D) 0.6800
TABLE 19-2
The following payoff matrix is given in dollars.
Suppose the probability of Event 1 is 0.5 and Event 2 is 0.5.
Referring to Table 19-2, the EVPI is
A) 0.
B) 300.
C) 400.
D) 600.

In testing for the differences between the means of 2 independent populations where the
variances in each population are unknown but assumed equal, the degrees of freedom
are
A) n – 1.
B) n1 + n2 – 1.
C) n1 + n2 – 2.
D) n – 2.
Suppose you want to test H0 : 30 versus H1 : < 30. Which of the following
possible sample results based on a sample size of 36 gives the strongest evidence to
reject H0 in favor of H1?
A) = 28, S = 6
B) = 27, S = 4
C) = 32, S = 2
D) = 26, S = 9

Once the control limits are set for a control chart, one attempts to
A) discern patterns that might exist in values over time.
B) determine whether any points fall outside the control limits.
C) Both of the above.
D) None of the above.
According to the empirical rule, if the data form a “bell-shaped” normal distribution,
________ percent of the observations will be contained within 3 standard deviations
around the arithmetic mean.
A) 68.26
B) 75.00
C) 95.0
D) 99.7
From an inventory of 48 new cars being shipped to local dealerships, corporate reports
indicate that 12 have defective radios installed. Which of the following distributions
would you use to determine the probability that out of the 8 new cars it just received
that, when each is tested, no more than 2 of the cars have defective radios?
A) Hypergeometric distribution
B) Poisson distribution
C) Uniform distribution
D) Binomial distribution

At Eastern University, 60% of the students are from suburban areas, 30% are from rural
areas, and 10% are from urban areas. Of the students from the suburban areas, 60% are
nonbusiness majors. Of the students from the rural areas, 70% are nonbusiness majors.
Of the students from the urban areas, 90% are nonbusiness majors. The probability that
a randomly selected student is a business major is
A) 0.66.
B) 0.54.
C) 0.44.
D) 0.34.
Blossom’s Flowers purchases roses for sale for Valentine’s Day. The roses are purchased
for $10 a dozen and are sold for $20 a dozen. Any roses not sold on Valentine’s Day can
be sold for $5 per dozen. The owner will purchase 1 of 3 amounts of roses for
Valentine’s Day: 100, 200, or 400 dozen roses. The number of states of nature for the
payoff table is
A) 2.
B) 3.
C) 4.
D) It cannot be determined.

A major Blu-ray rental chain is considering opening a new store in an area that
currently does not have any such stores. The chain will open if there is evidence that
more than 5,000 of the 20,000 households in the area are equipped with Blu-ray
players. It conducts a telephone poll of 300 randomly selected households in the area
and finds that 96 have Blu-ray players. The decision on the hypothesis test using a 5%
level of significance is
A) to reject H0 in favor of H1.
B) to accept H0 in favor of H1.
C) to fail to reject H0 in favor of H1.
D) We cannot tell what the decision should be from the information given.
What type of probability distribution will most likely be used to analyze the number of
cars with defective radios in the following problem?
From an inventory of 48 new cars being shipped to local dealerships, corporate reports
indicate that 12 have defective radios installed. The sales manager of one dealership
wants to predict the probability out of the 8 new cars it just received that, when each is
tested, no more than 2 of the cars have defective radios.
A) Binomial distribution
B) Poisson distribution
C) Hypergeometric distribution
D) None of the above
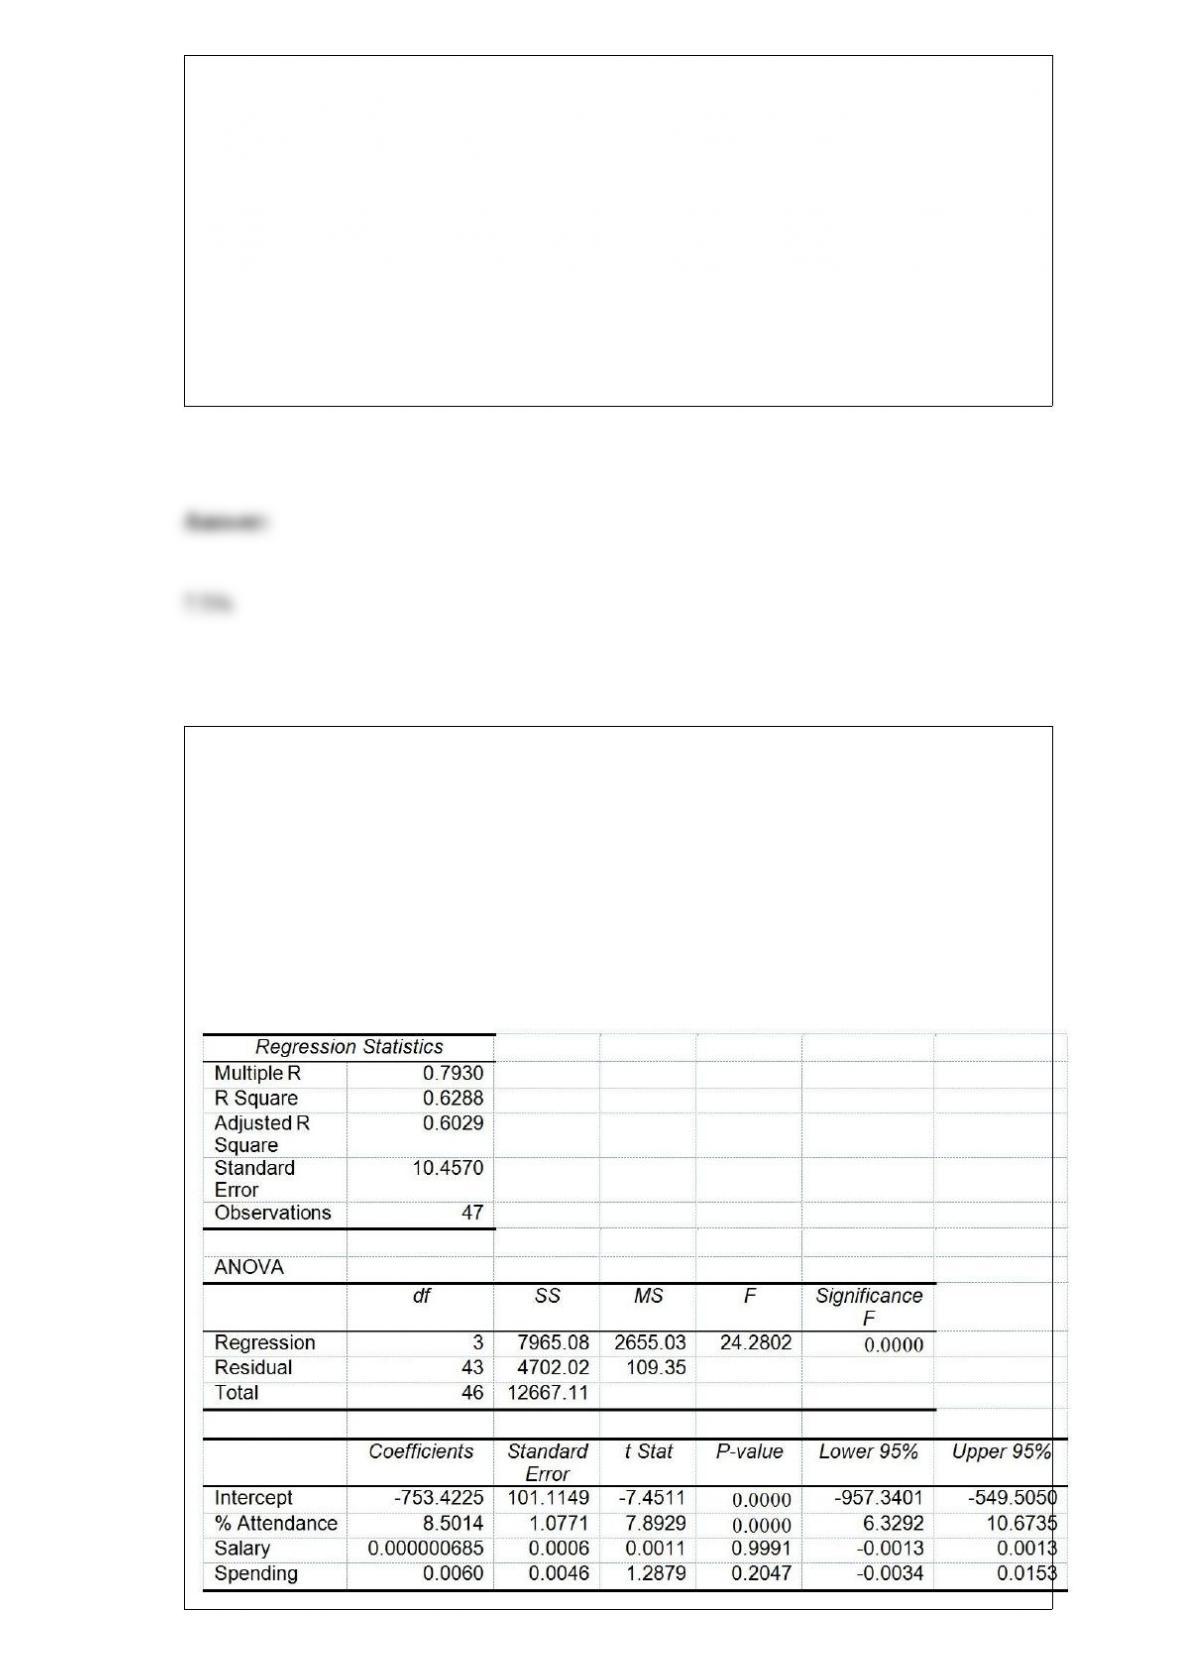
TABLE 6-6
According to Investment Digest, the arithmetic mean of the annual return for common
stocks over an 85-year period was 9.5%, but the value of the variance was not
mentioned. Also 25% of the annual returns were below 8%, while 65% of the annual
returns were between 8% and 11.5%. The article claimed that the distribution of annual
return for common stocks was bell-shaped and approximately symmetric. Assume that
this distribution is normal with the mean given above. Answer the following questions
without the help of a calculator, statistical software or statistical table.
Referring to Table 6-6, 10% of the annual returns will be less than what amount?
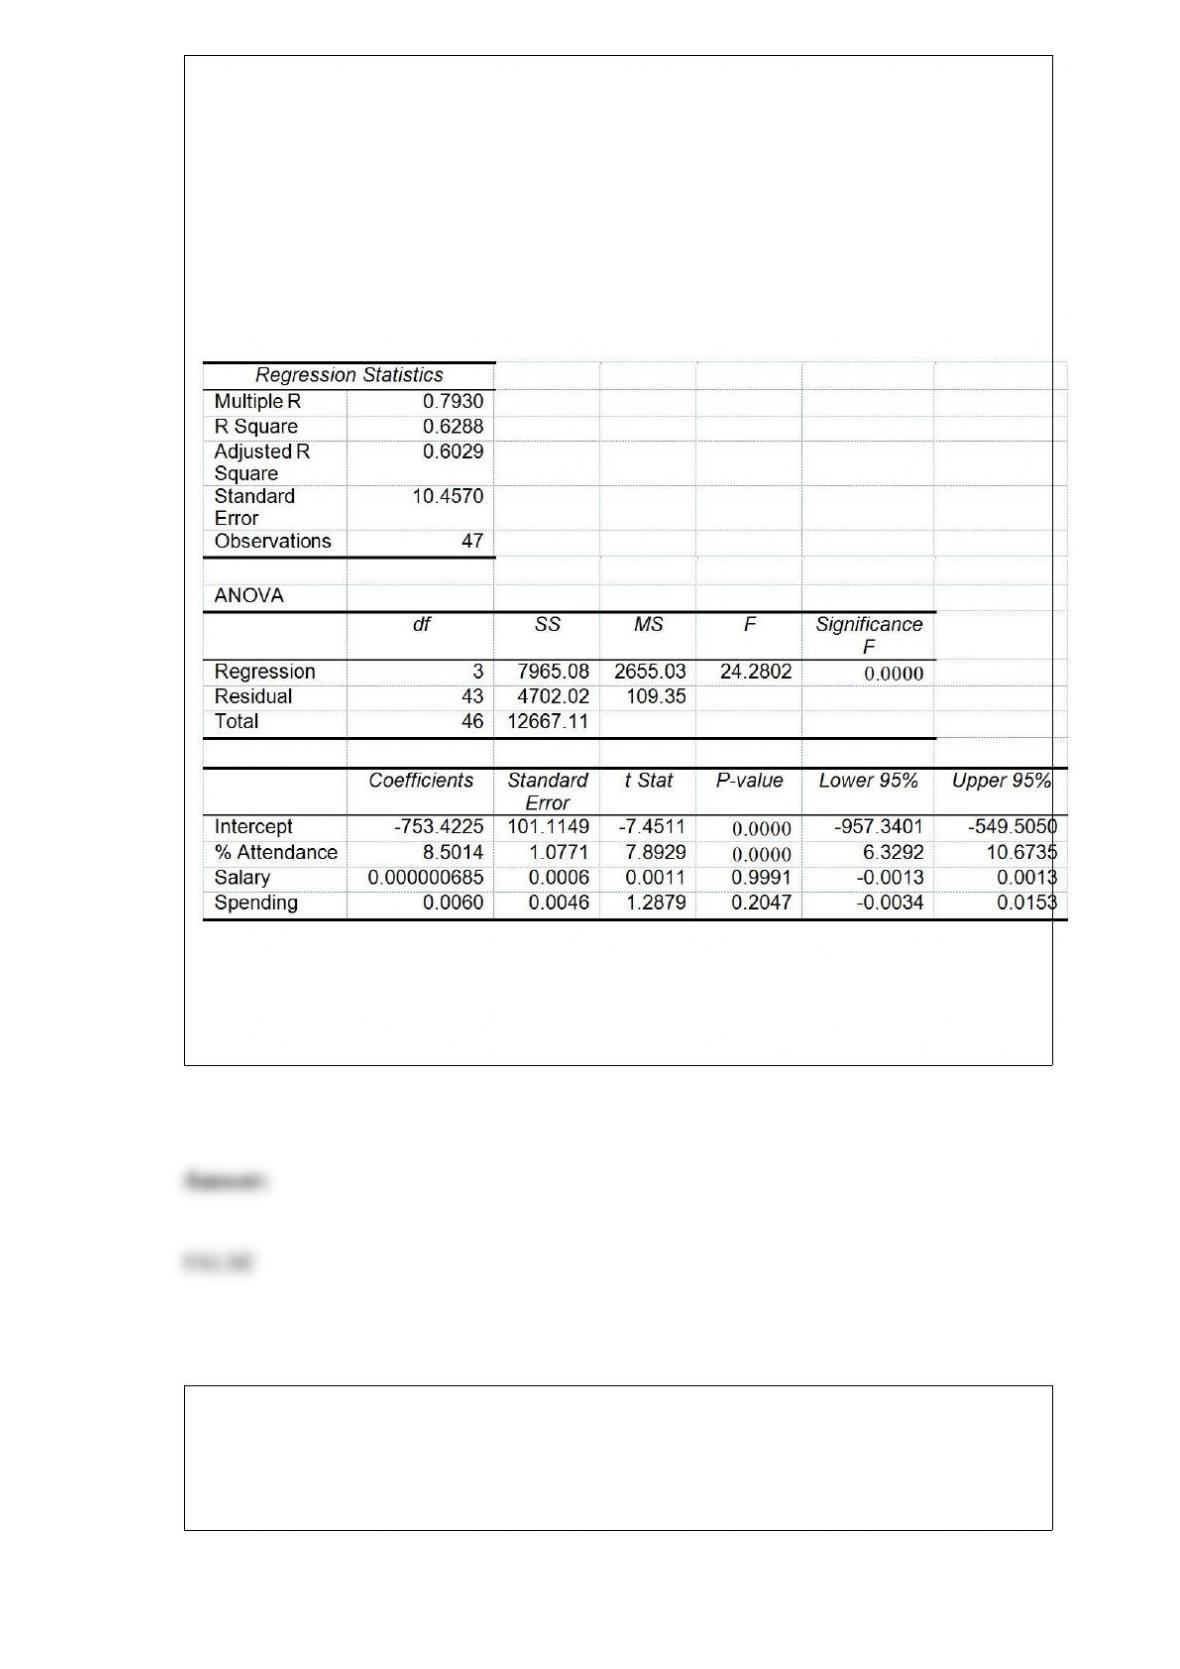
TABLE 17-8
The superintendent of a school district wanted to predict the percentage of students
passing a sixth-grade proficiency test. She obtained the data on percentage of students
passing the proficiency test (% Passing), daily mean of the percentage of students
attending class (% Attendance), mean teacher salary in dollars (Salaries), and
instructional spending per pupil in dollars (Spending) of 47 schools in the state.
Following is the multiple regression output with Y = % Passing as the dependent
variable, X1 = % Attendance, X2 = Salaries and X3 = Spending:

Referring to Table 17-8, what is the value of the test statistic when testing whether the
daily mean of the percentage of students attending class has any effect on the
percentage of students passing the proficiency test, taking into account the effect of all
the other independent variables?
The county clerk wants to estimate the proportion of voters who will need special
election facilities. Suppose a sample of 400 voters was taken. If 150 need special
election facilities, calculate a 90% confidence interval for the population proportion.
TABLE 5-2
A certain type of new business succeeds 60% of the time. Suppose that 3 such
businesses open (where they do not compete with each other, so it is reasonable to
believe that their relative successes would be independent).
Referring to Table 5-2, the probability that all 3 businesses fail is ________.
TABLE 17-5
You worked as an intern at We Always Win Car Insurance Company last summer. You
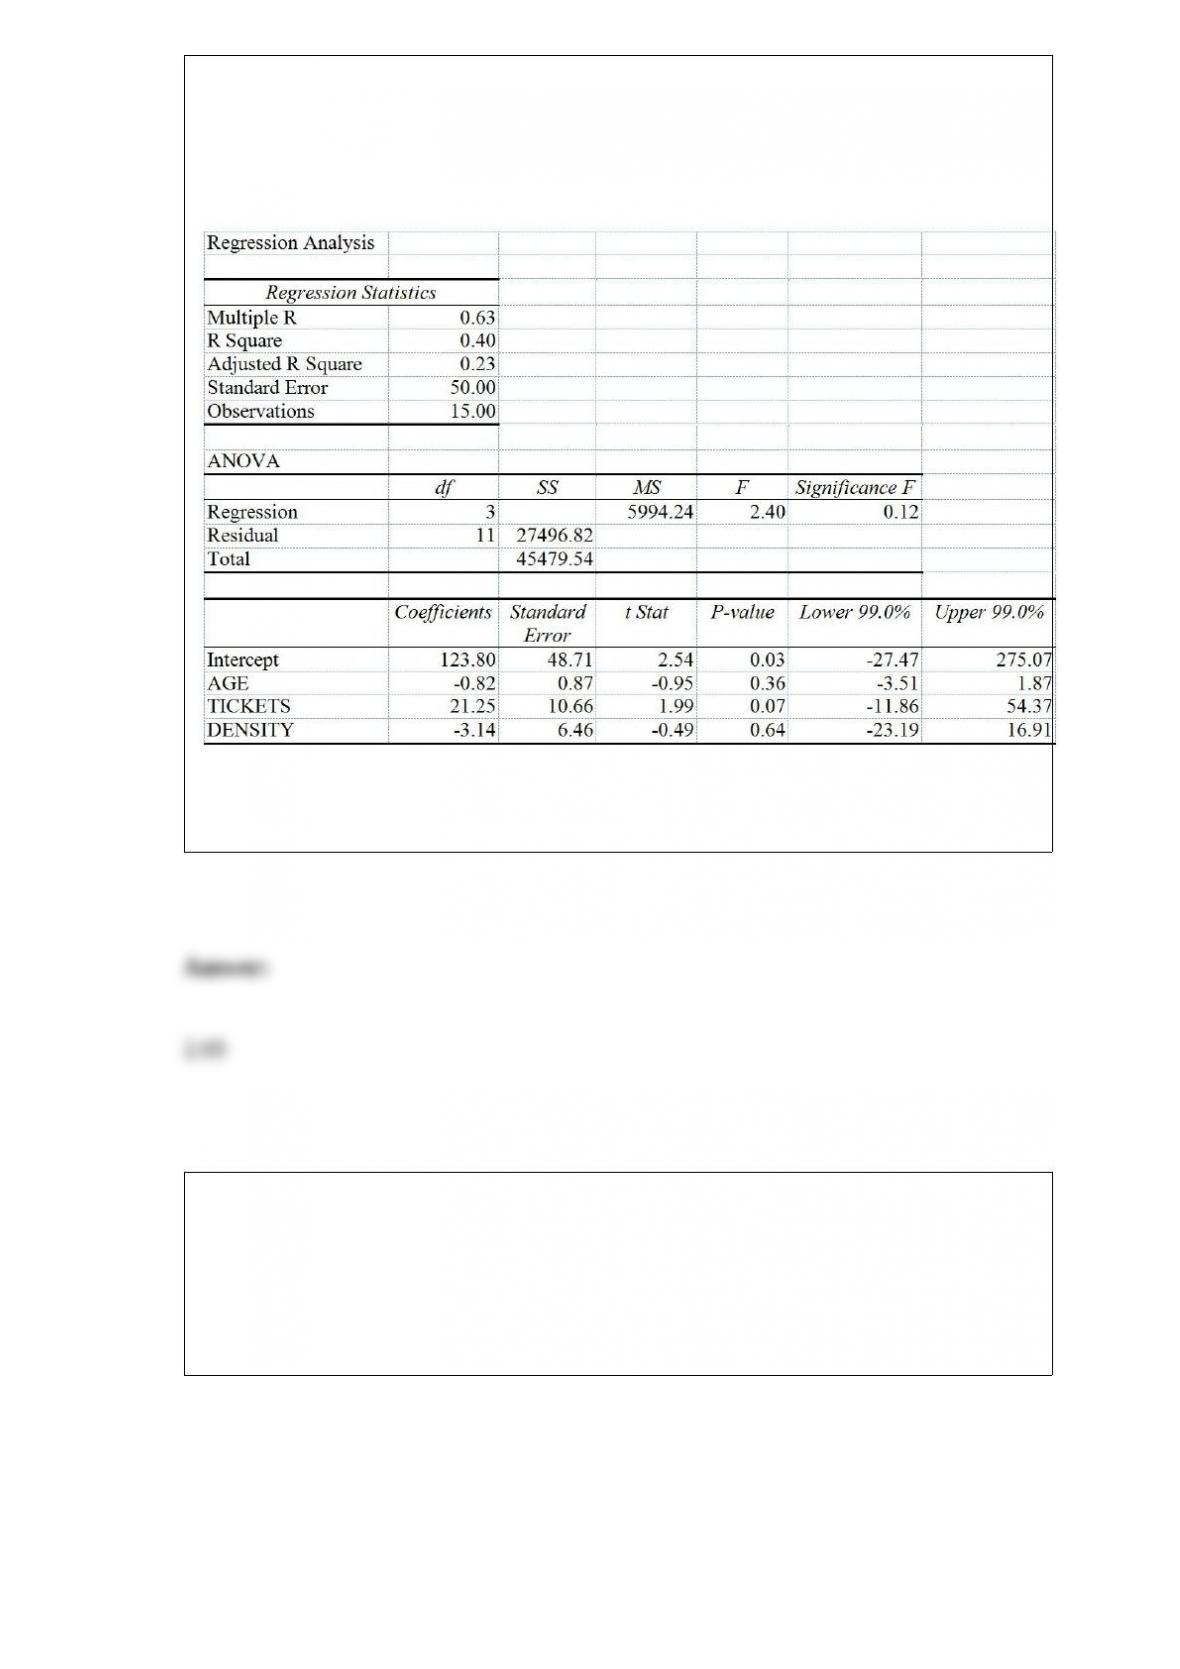
notice that individual car insurance premiums depend very much on the age of the
individual, the number of traffic tickets received by the individual, and the population
density of the city in which the individual lives. You performed a regression analysis in
EXCEL and obtained the following information:
Referring to Table 17-5, the 99% confidence interval for the change in mean insurance
premiums of a person who has become 1 year older (i.e., the slope coefficient for AGE)
is -0.82 ± ________.
TABLE 17-5
You worked as an intern at We Always Win Car Insurance Company last summer. You
notice that individual car insurance premiums depend very much on the age of the
individual, the number of traffic tickets received by the individual, and the population
density of the city in which the individual lives. You performed a regression analysis in
EXCEL and obtained the following information:
Referring to Table 17-5, to test the significance of the multiple regression model, what
are the degrees of freedom?
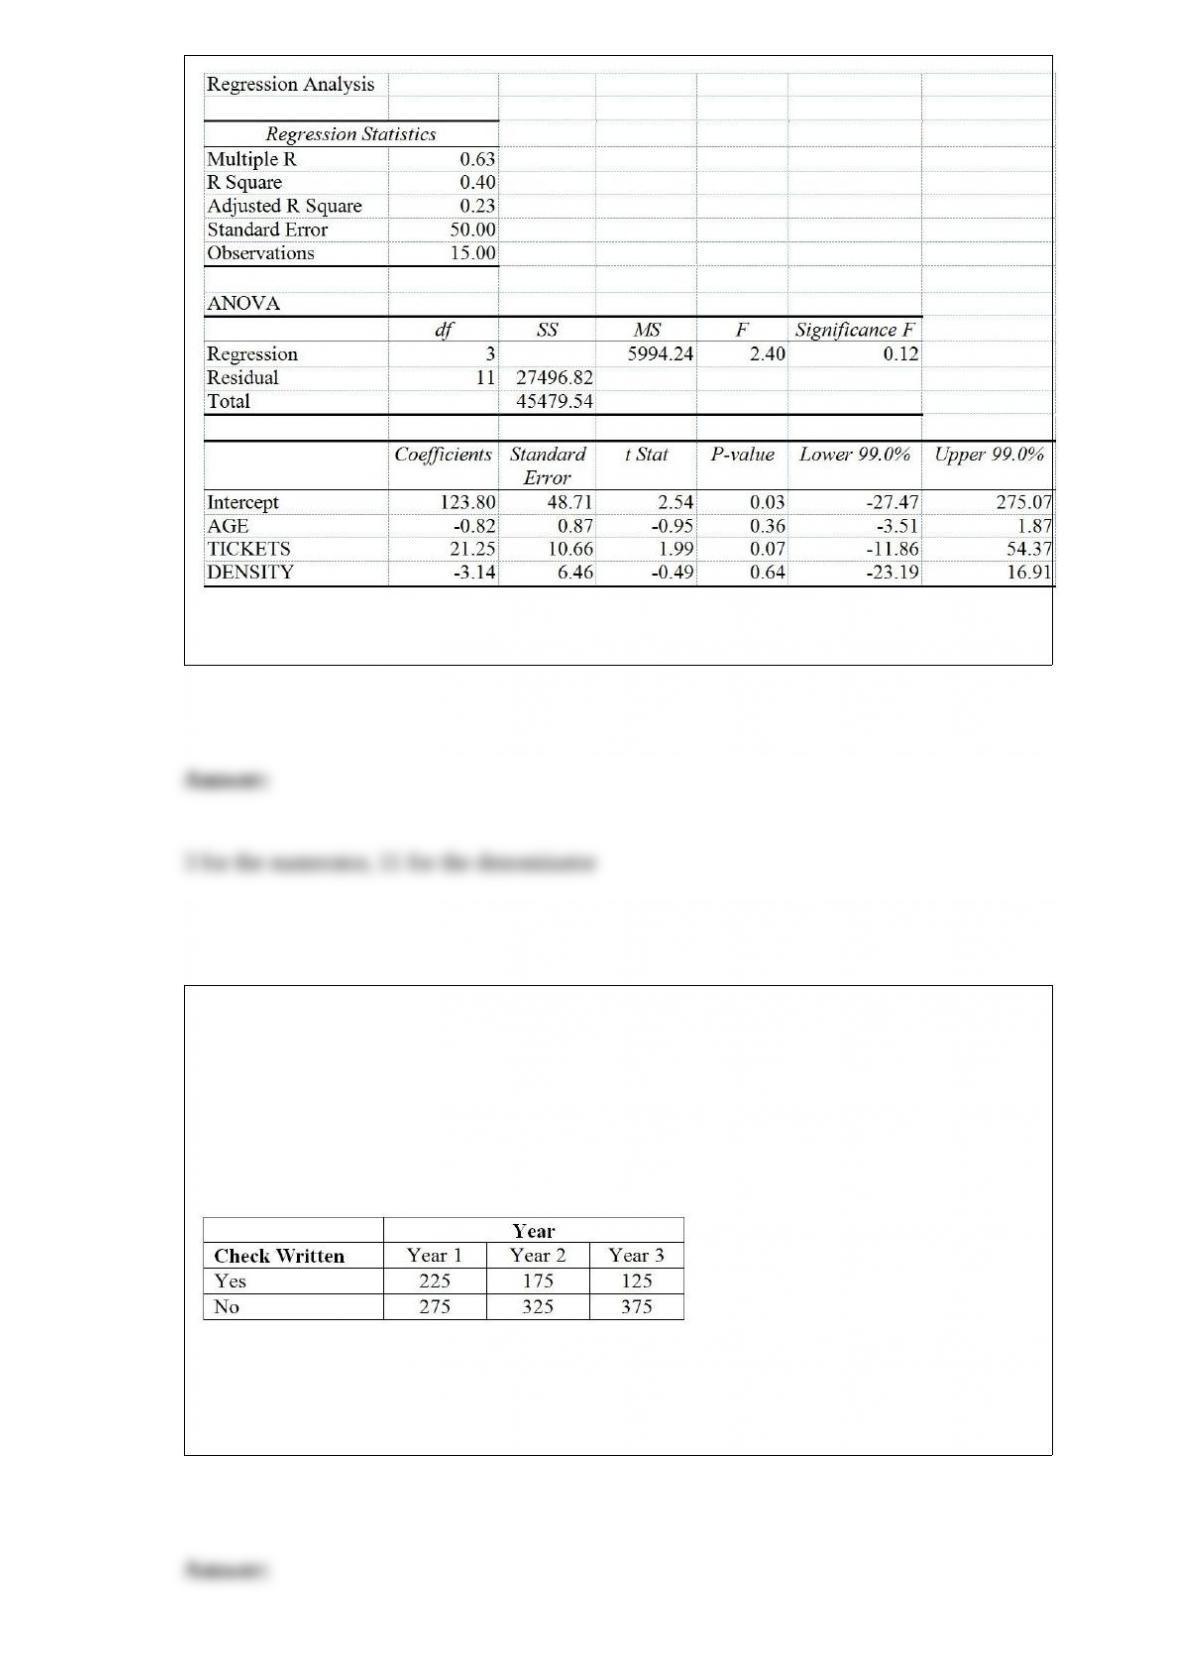
TABLE 12-6
According to an article in Marketing News, fewer checks are being written at the
grocery store checkout than in the past. To determine whether there is a difference in
the proportion of shoppers who pay by check among three consecutive years at a 0.05
level of significance, the results of a survey of 500 shoppers in three consecutive years
are obtained and presented below.
Referring to Table 12-6, what is the expected number of shoppers who do not pay by
check in year 3 if there is no difference in the proportion of shoppers who pay by check
among the three years?
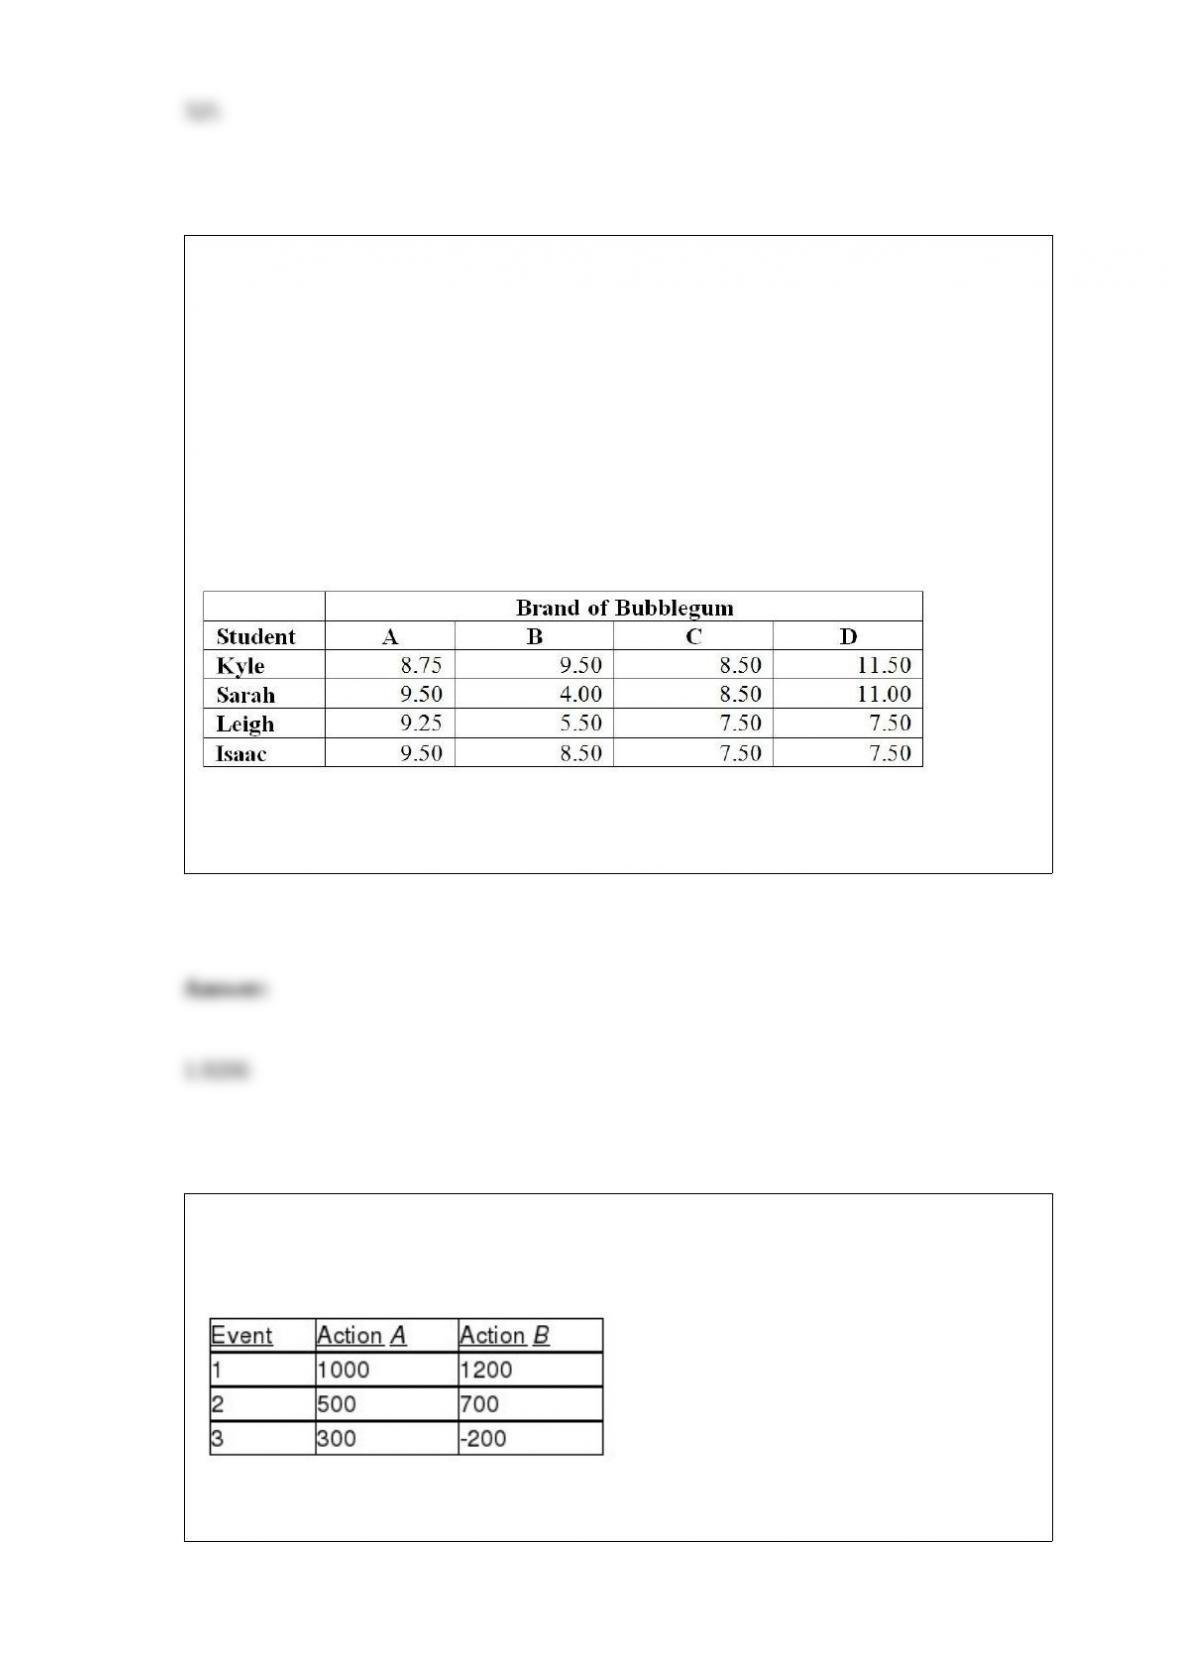
TABLE 11-11
A student team in a business statistics course designed an experiment to investigate
whether the brand of bubblegum used affected the size of bubbles they could blow. To
reduce the person-to-person variability, the students decided to use a randomized block
design using themselves as blocks.
Four brands of bubblegum were tested. A student chewed two pieces of a brand of gum
and then blew a bubble, attempting to make it as big as possible. Another student
measured the diameter of the bubble at its biggest point. The following table gives the
diameters of the bubbles (in inches) for the 16 observations.
Referring to Table 11-11, what is the value of the test statistic for the randomized block
F test for the difference in the means?
TABLE 19-5
The following payoff table shows profits associated with a set of 2 alternatives under 3
possible events.
Suppose that the probability of Event 1 is 0.2, Event 2 is 0.5, and Event 3 is 0.3.
Referring to Table 19-5, what is the coefficient of variation for Action A?