
True or False: If the amount of gasoline purchased per car at a large service station has
a population mean of 15 gallons and a population standard deviation of 4 gallons, and it
is assumed that the amount of gasoline purchased per car is symmetric, there is
approximately a 68.26% chance that a random sample of 16 cars will have a sample
mean between 14 and 16 gallons.
True or False: Using the number of registered voters who turned out to vote for the
primary in Iowa to predict the number of registered voters who will turn out to vote in
Vermont’s primary is an example of descriptive statistics.
True or False: TABLE 17-8
The superintendent of a school district wanted to predict the percentage of students
passing a sixth-grade proficiency test. She obtained the data on percentage of students
passing the proficiency test (% Passing), daily mean of the percentage of students
attending class (% Attendance), mean teacher salary in dollars (Salaries), and
instructional spending per pupil in dollars (Spending) of 47 schools in the state.
Following is the multiple regression output with Y = % Passing as the dependent
variable, X1 = % Attendance, X2 = Salaries and X3 = Spending:
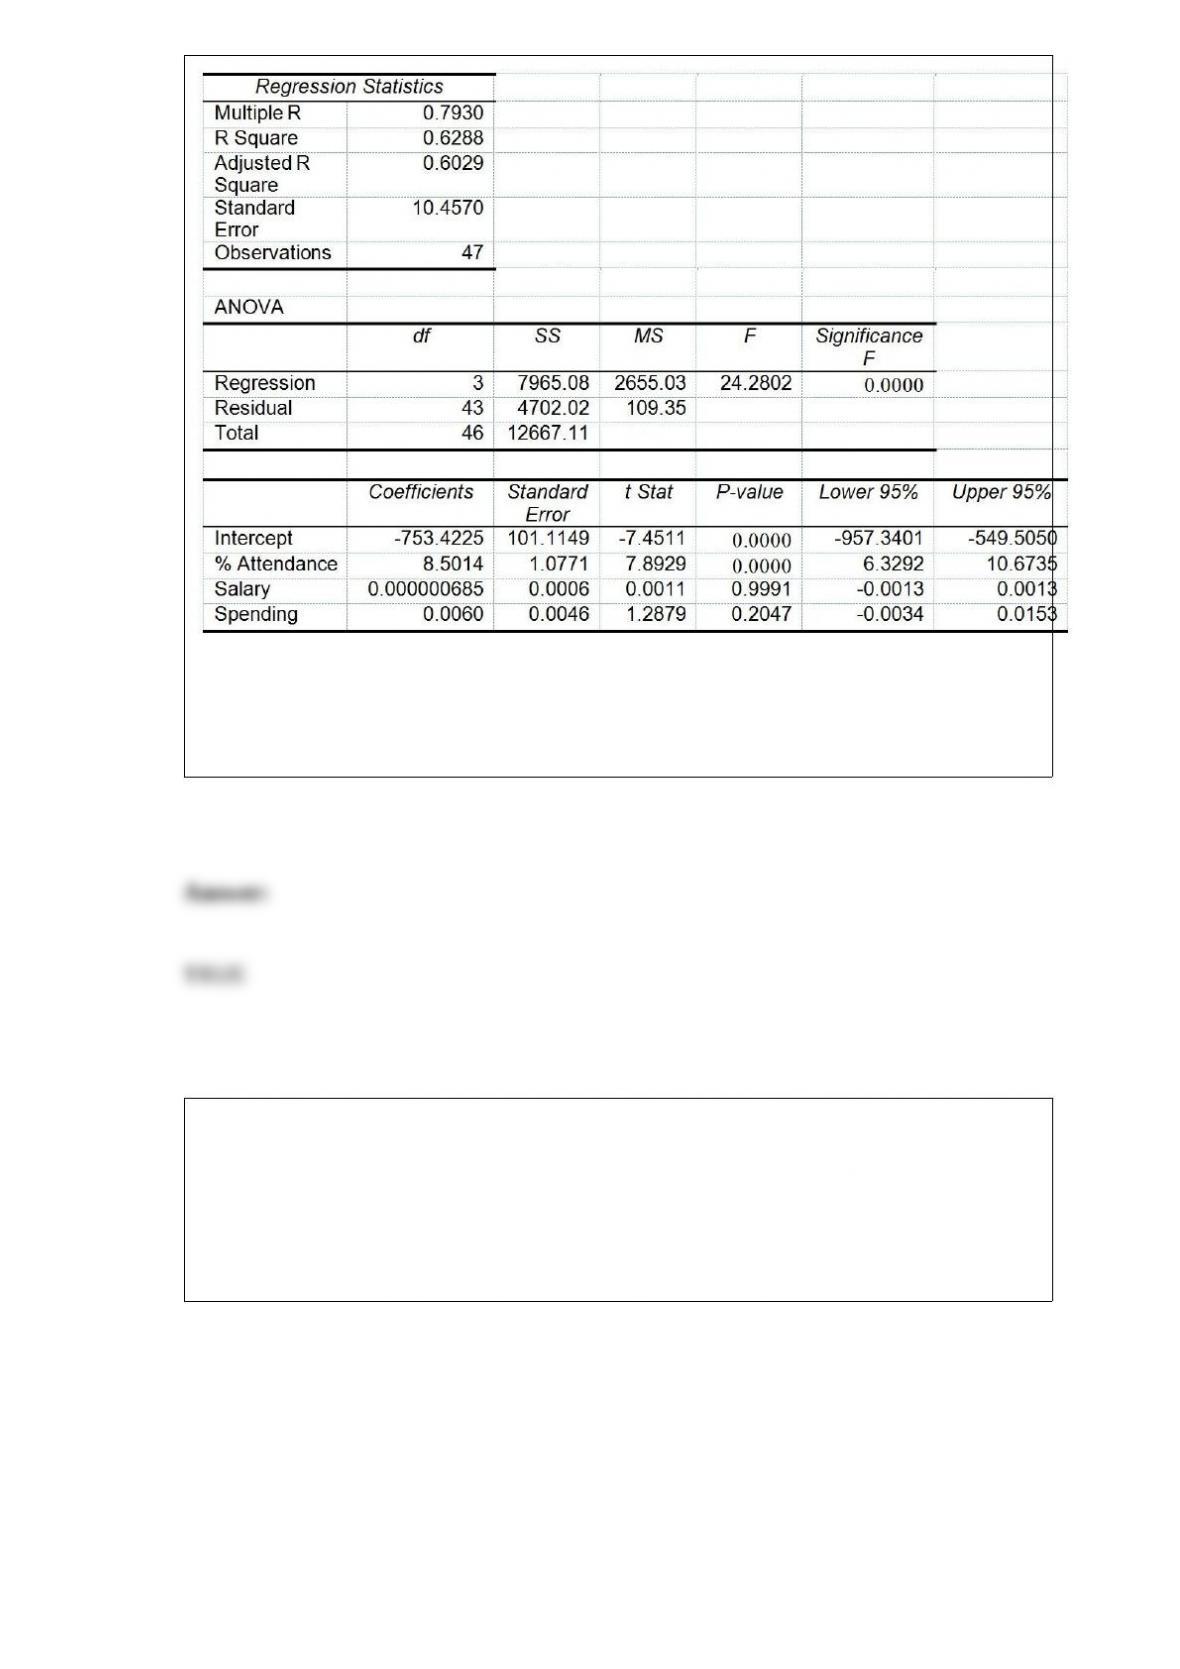
Referring to Table 17-8, you can conclude that instructional spending per pupil
individually has no impact on the mean percentage of students passing the proficiency
test, taking into account the effect of all the other independent variables, at a 1% level
of significance based solely on the 95% confidence interval estimate for β3.
True or False: TABLE 17-5
You worked as an intern at We Always Win Car Insurance Company last summer. You
notice that individual car insurance premiums depend very much on the age of the
individual, the number of traffic tickets received by the individual, and the population
density of the city in which the individual lives. You performed a regression analysis in
EXCEL and obtained the following information:
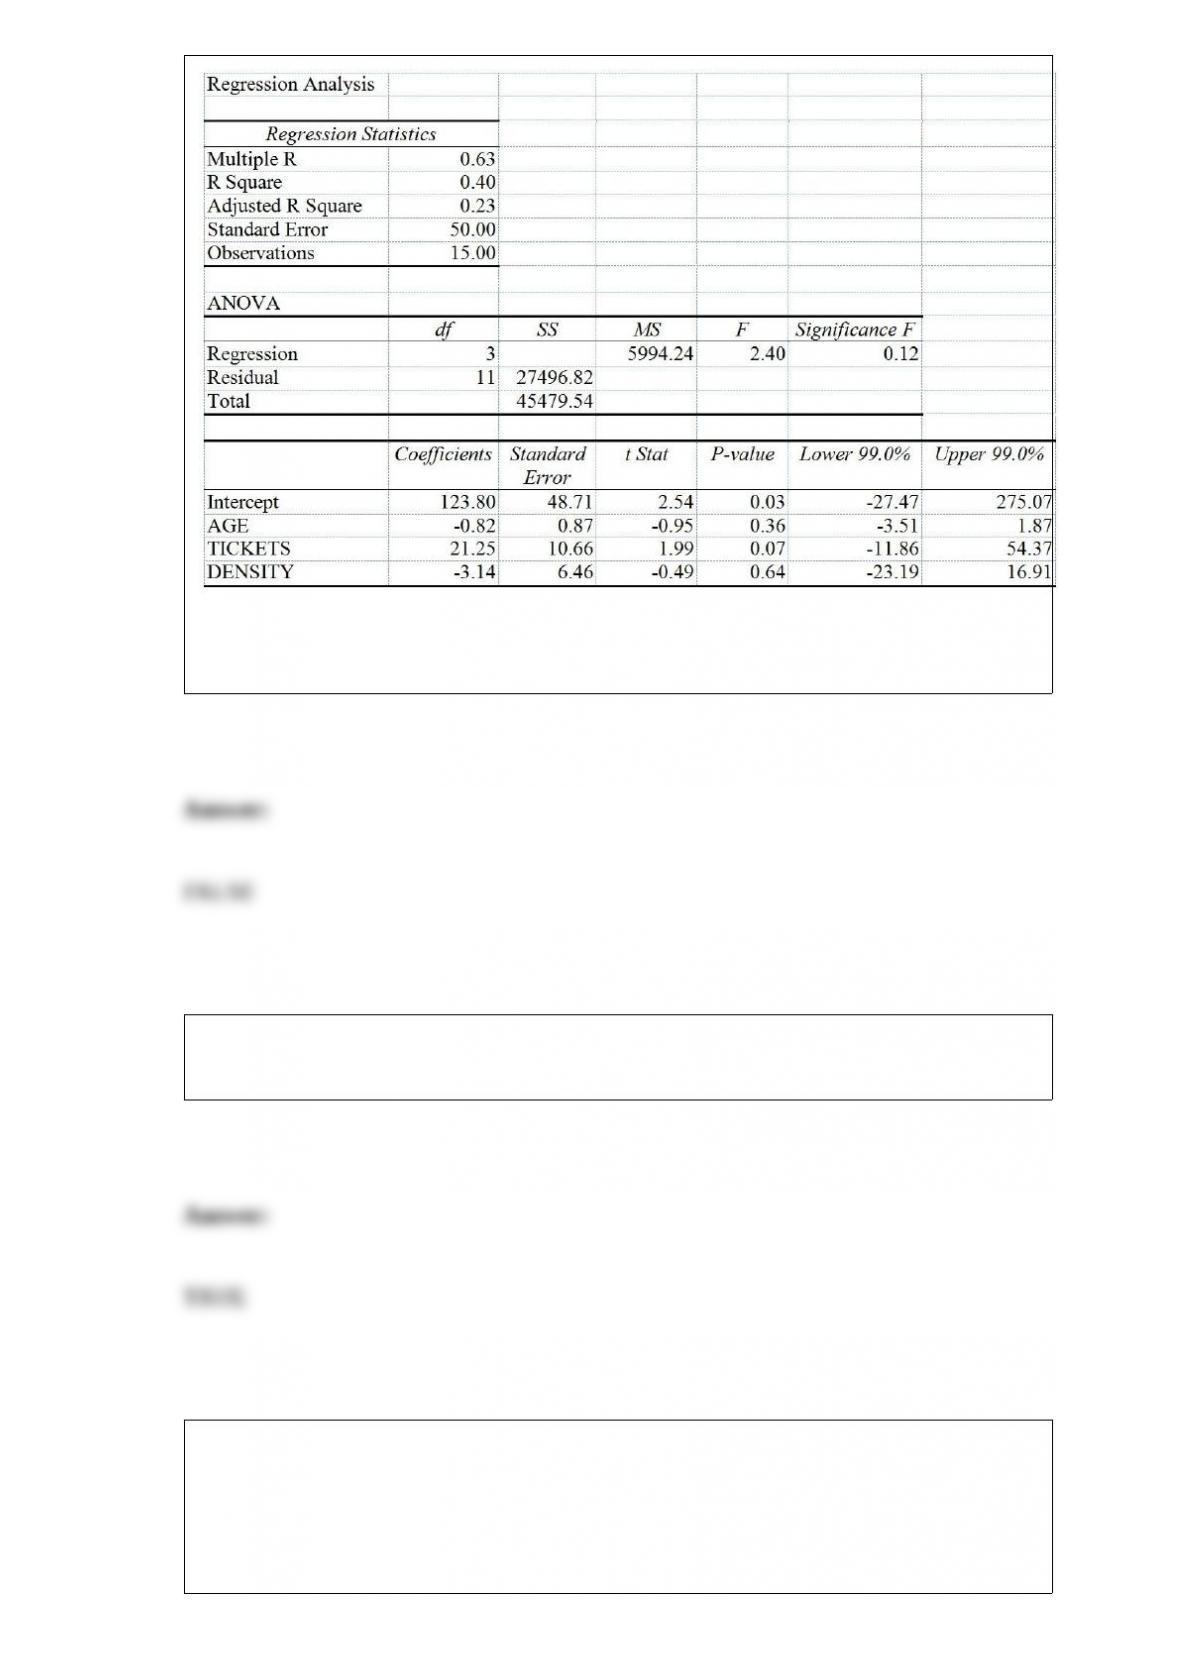
Referring to Table 17-5, to test the significance of the multiple regression model, the
null hypothesis should be rejected while allowing for 1% probability of committing a
type I error.
True or False: The MAD is a measure of the mean of the absolute discrepancies between
the actual and the fitted values in a given time series.
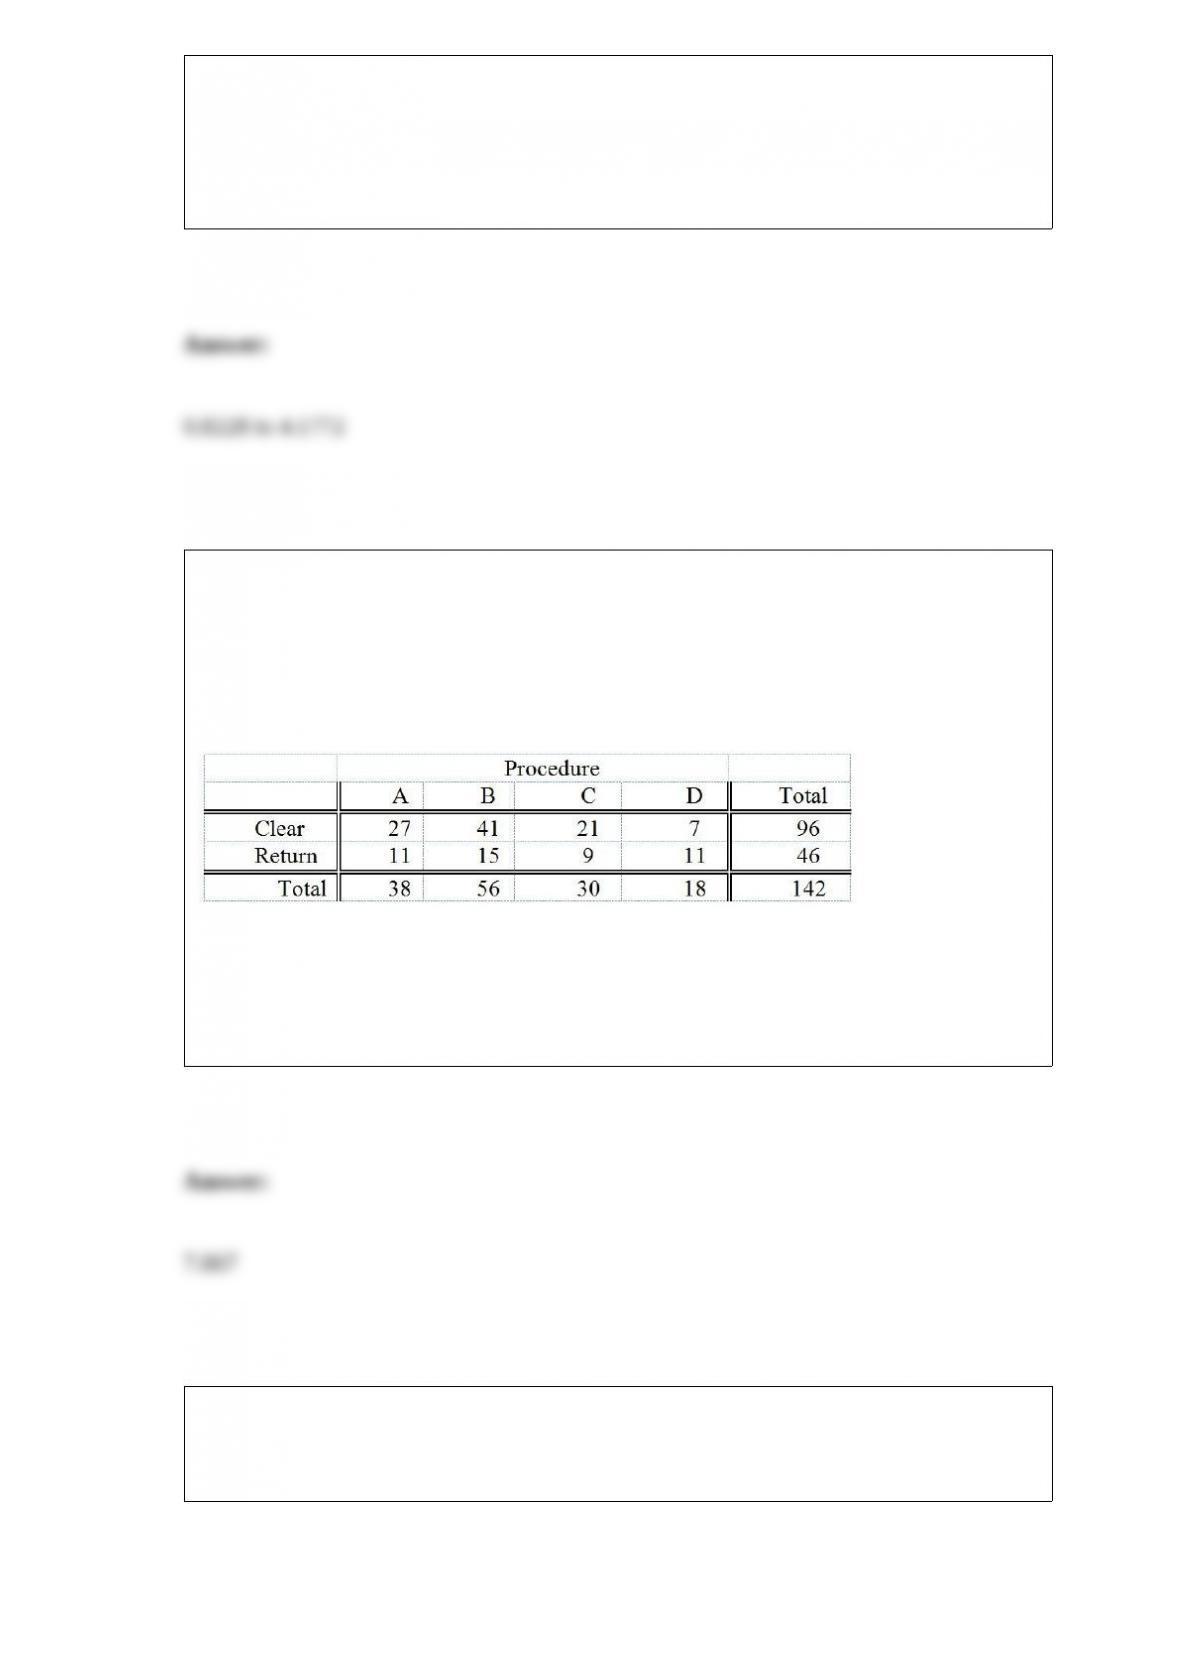
TABLE 12-5
Four surgical procedures currently are used to install pacemakers. If the patient does not
need to return for follow-up surgery, the operation is called a “clear” operation. A heart
center wants to compare the proportion of clear operations for the 4 procedures, and
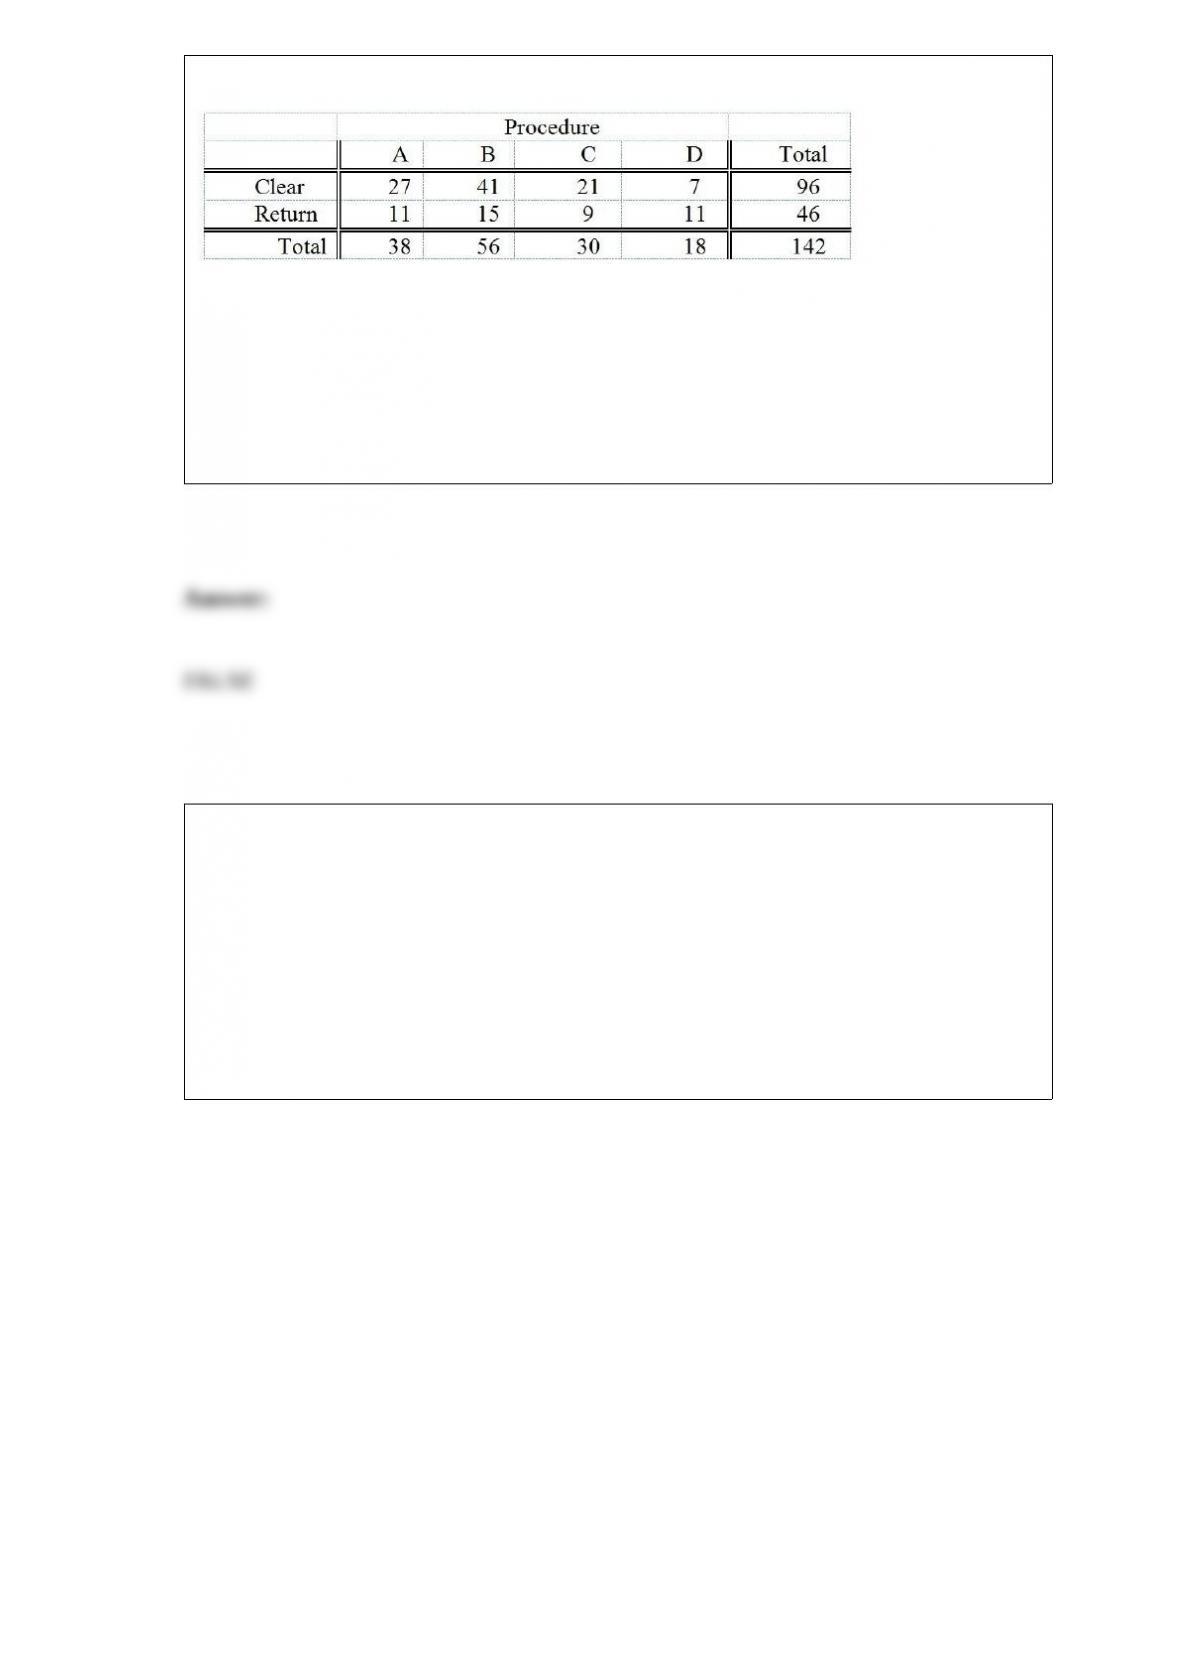
collects the following numbers of patients from their own records:
They will use this information to test for a difference among the proportion of clear
operations using a chi-square test with a level of significance of 0.05.
True or False: Referring to Table 12-5, there is sufficient evidence to conclude that the
proportions between procedure B and procedure C are different at a 0.05 level of
significance.
TABLE 14-17
Given below are results from the regression analysis where the
dependent variable is the number of weeks a worker is unemployed
due to a layo! (Unemploy) and the independent variables are the age
of the worker (Age) and a dummy variable for management position
(Manager: 1 = yes, 0 = no).
The results of the regression analysis are given below:

True or False: Referring to Table 14-17, the null hypothesis H0 : β1 =
β2 = 0 implies that the number of weeks a worker is unemployed due
to a layo! is not related to one of the explanatory variables.
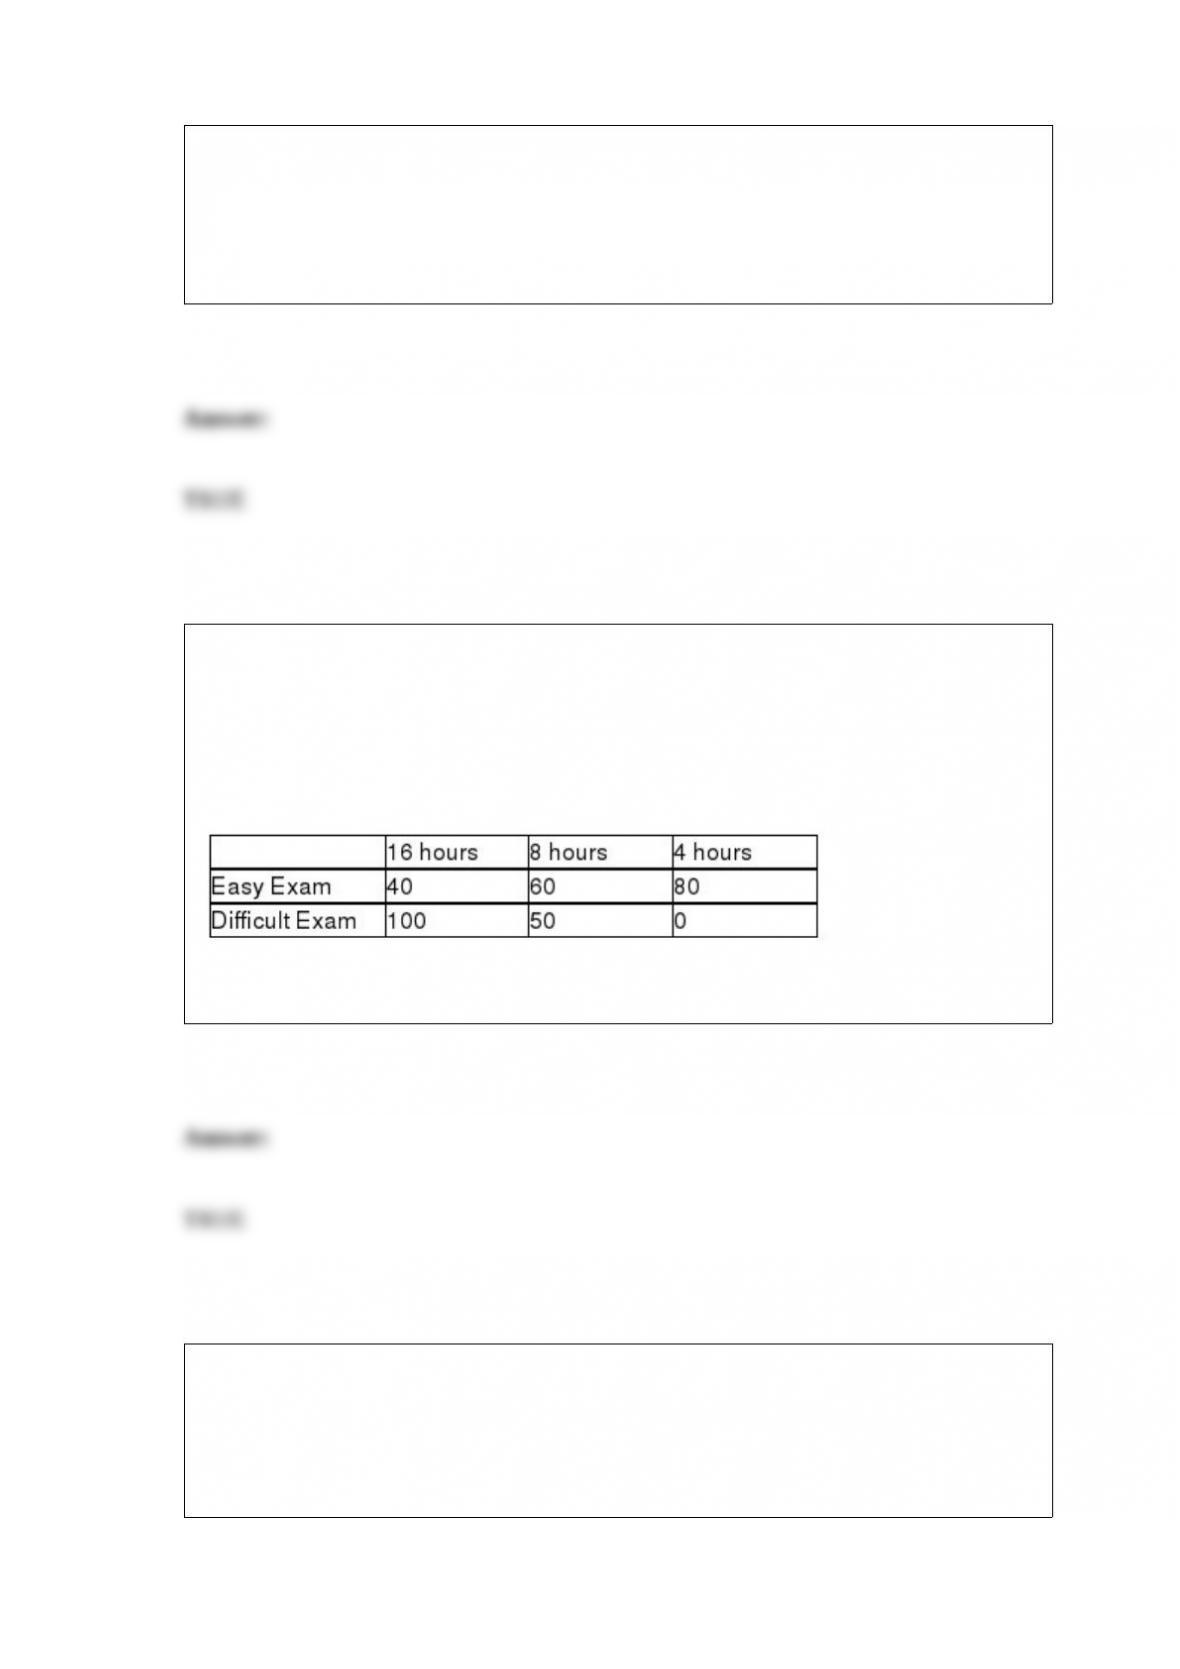
True or False: TABLE 19-6
A student wanted to find out the optimal strategy to study for a Business Statistics
exam. He constructed the following payoff table based on the mean amount of time he
needed to study every week for the course and the degree of difficulty of the exam.
From the information that he gathered from students who had taken the course, he
concluded that there was a 40% probability that the exam would be easy.
Referring to Table 19-6, the optimal strategy using the expected monetary value
criterion is to study 16 hours per week on average for the exam.
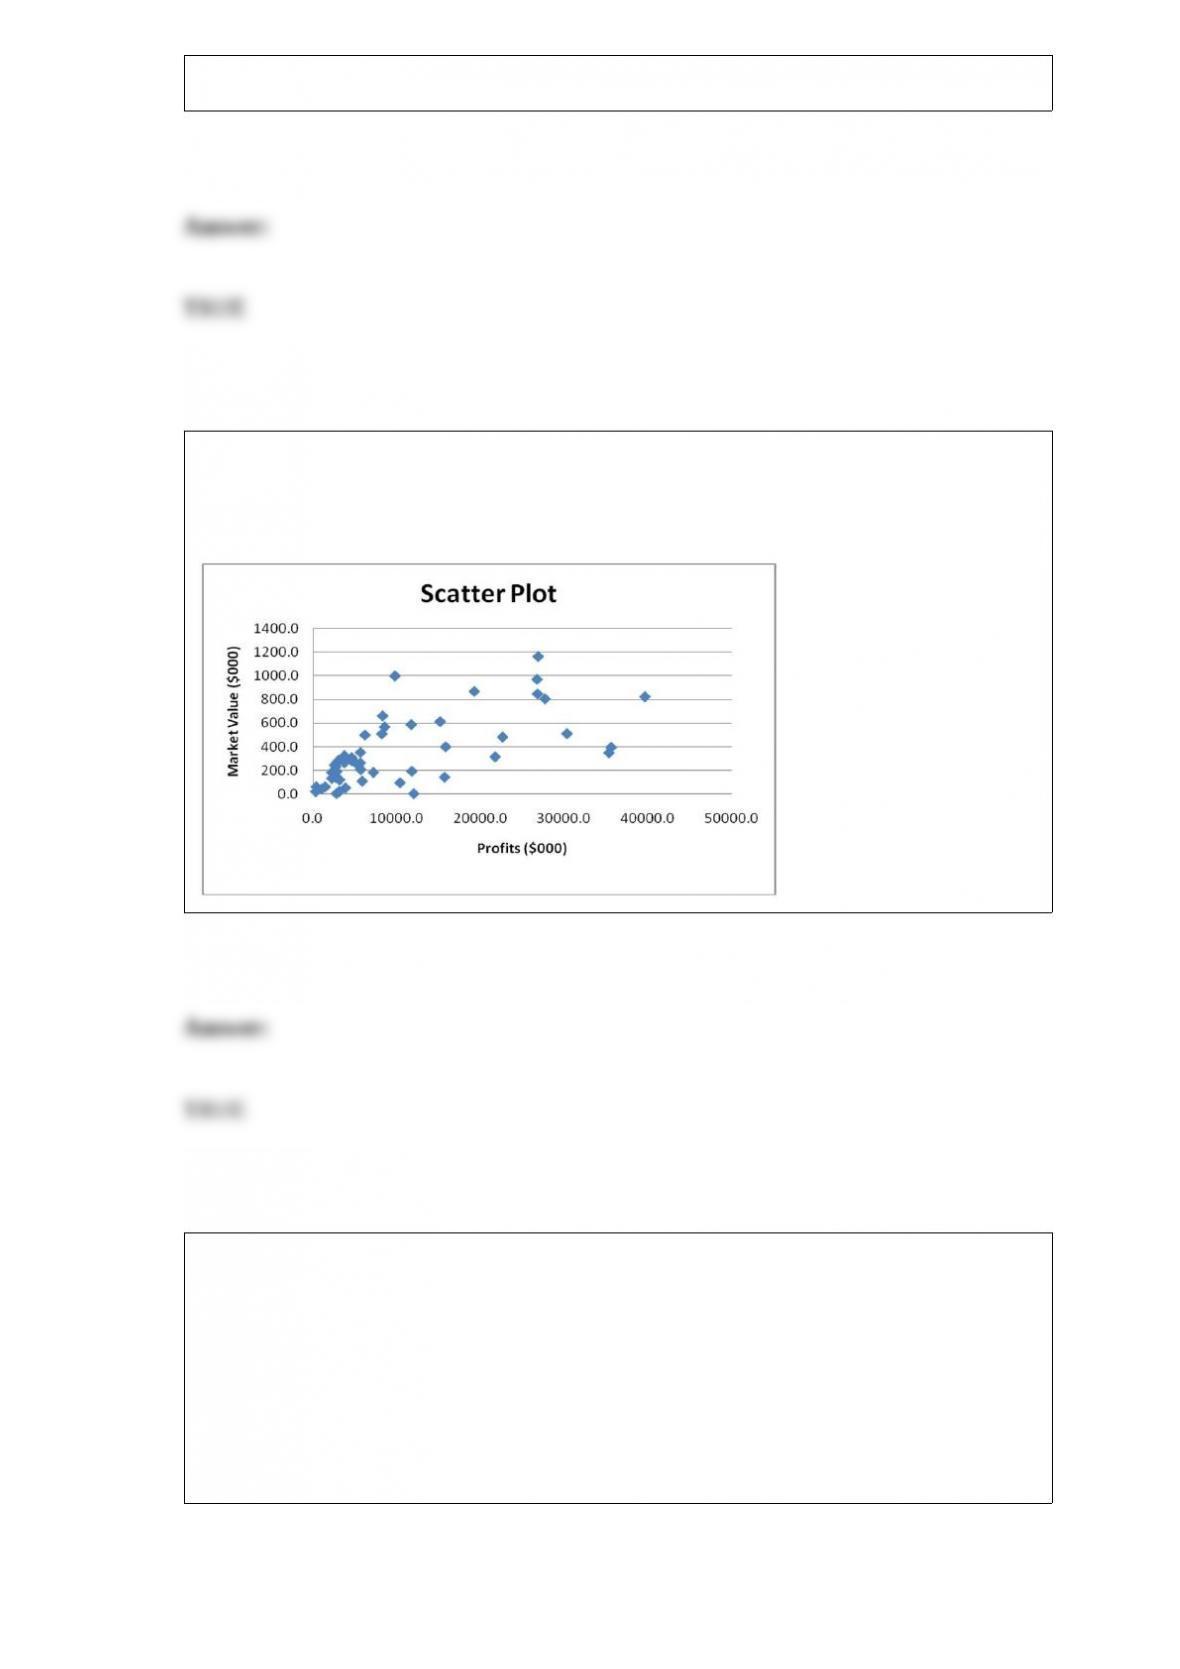
True or False: Given below is the scatter plot of the market value (thousands$) and
profit (thousands$) of 50 U.S. companies. Higher market values appear to be associated
with higher profits.
True or False: TABLE 17-8
The superintendent of a school district wanted to predict the percentage of students
passing a sixth-grade proficiency test. She obtained the data on percentage of students
passing the proficiency test (% Passing), daily mean of the percentage of students
attending class (% Attendance), mean teacher salary in dollars (Salaries), and
instructional spending per pupil in dollars (Spending) of 47 schools in the state.
Following is the multiple regression output with Y = % Passing as the dependent
variable, X1 = % Attendance, X2 = Salaries and X3 = Spending:
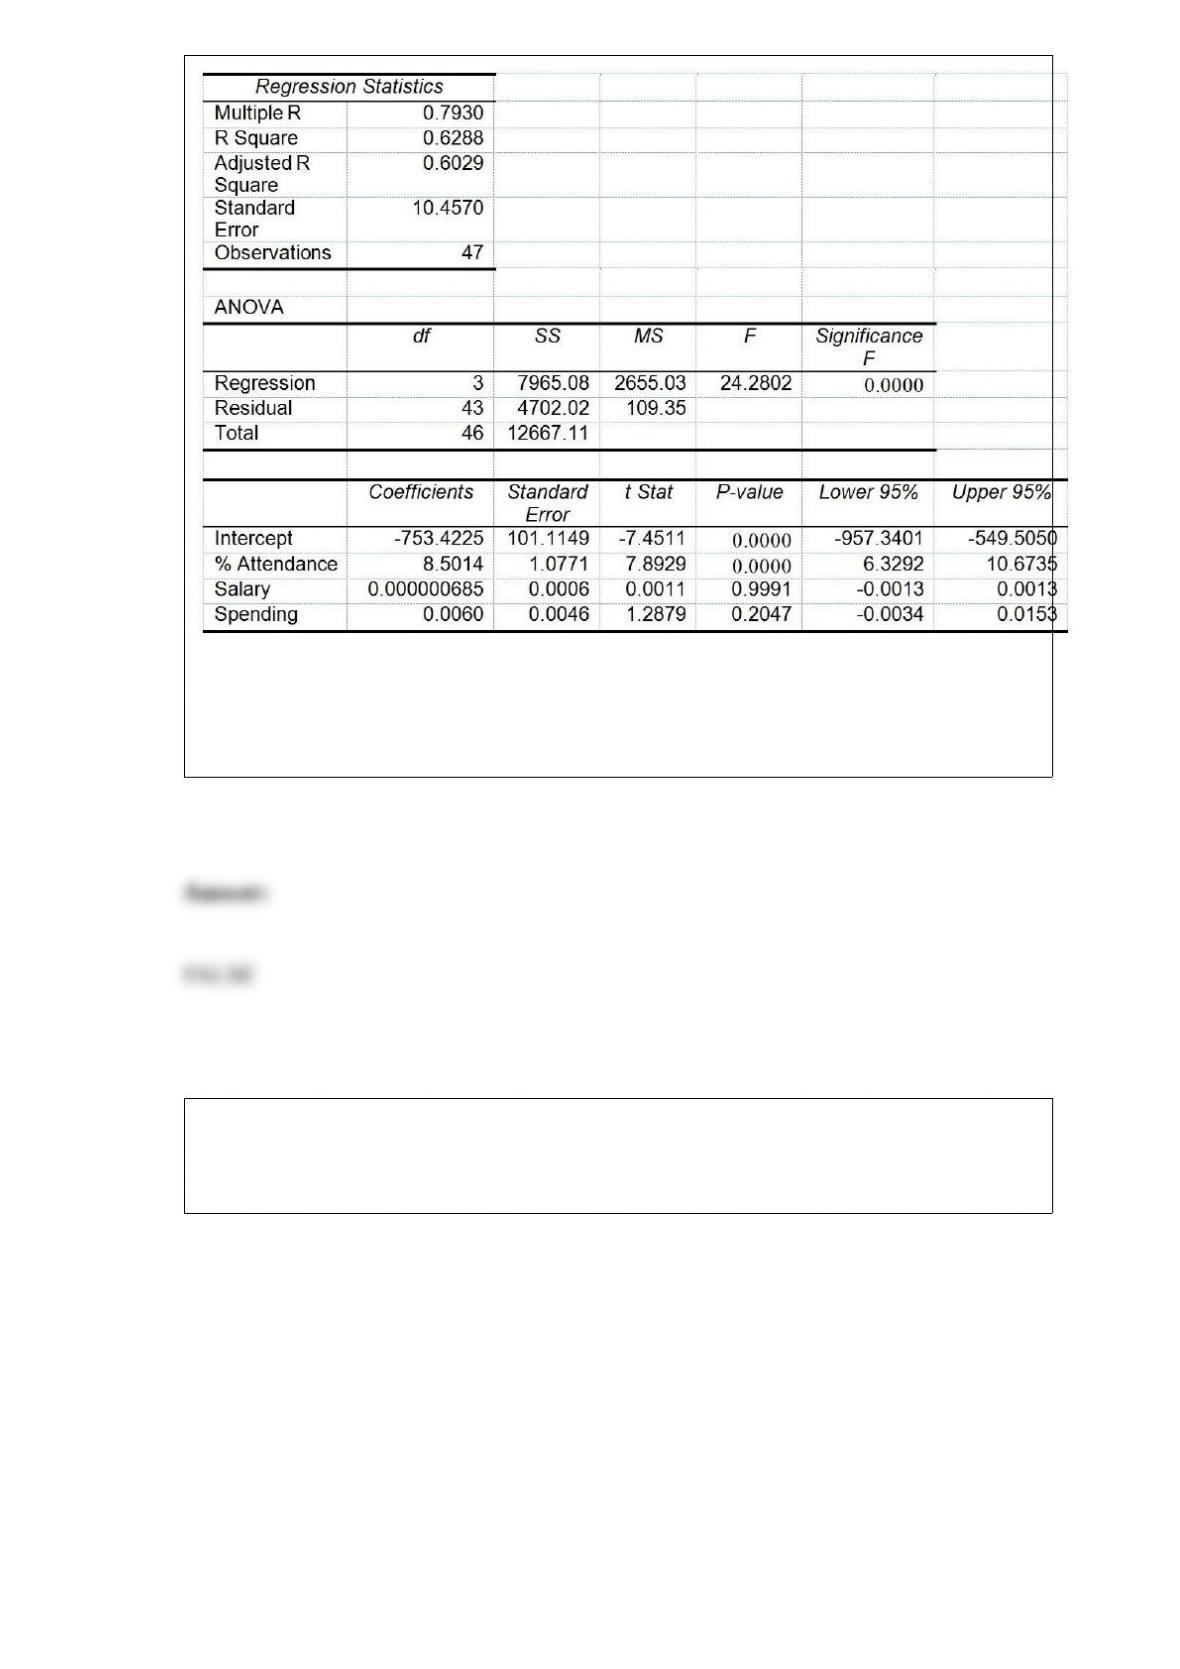
Referring to Table 17-8, you can conclude that the average teacher salary individually
has no impact on the mean percentage of students passing the proficiency test, taking
into account the effect of all the other independent variables, at a 10% level of
significance based solely on the 95% confidence interval estimate for β2.
TABLE 16-13
Given below is the monthly time-series data for U.S. retail sales of building materials
over a specific year.
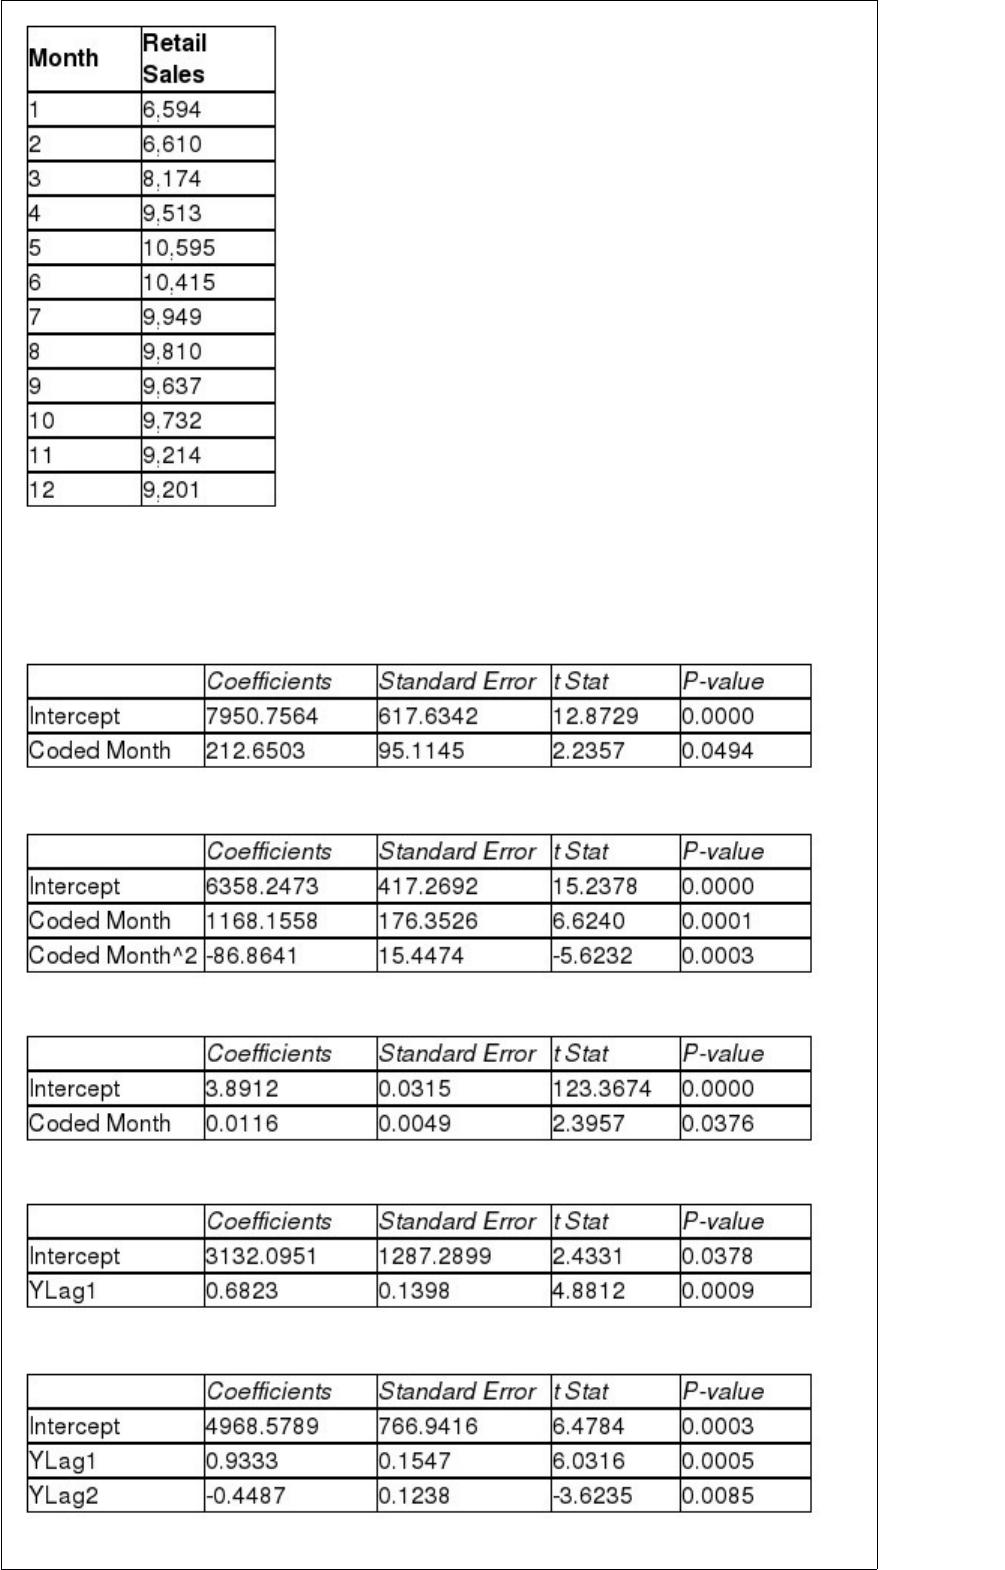
The results of the linear trend, quadratic trend, exponential trend, first-order
autoregressive, second-order autoregressive and third-order autoregressive model are
presented below in which the coded month for the 1st month is 0:
Linear trend model:
Quadratic trend model:
Exponential trend model:
First-order autoregressive:
Second-order autoregressive:
Third-order autoregressive:
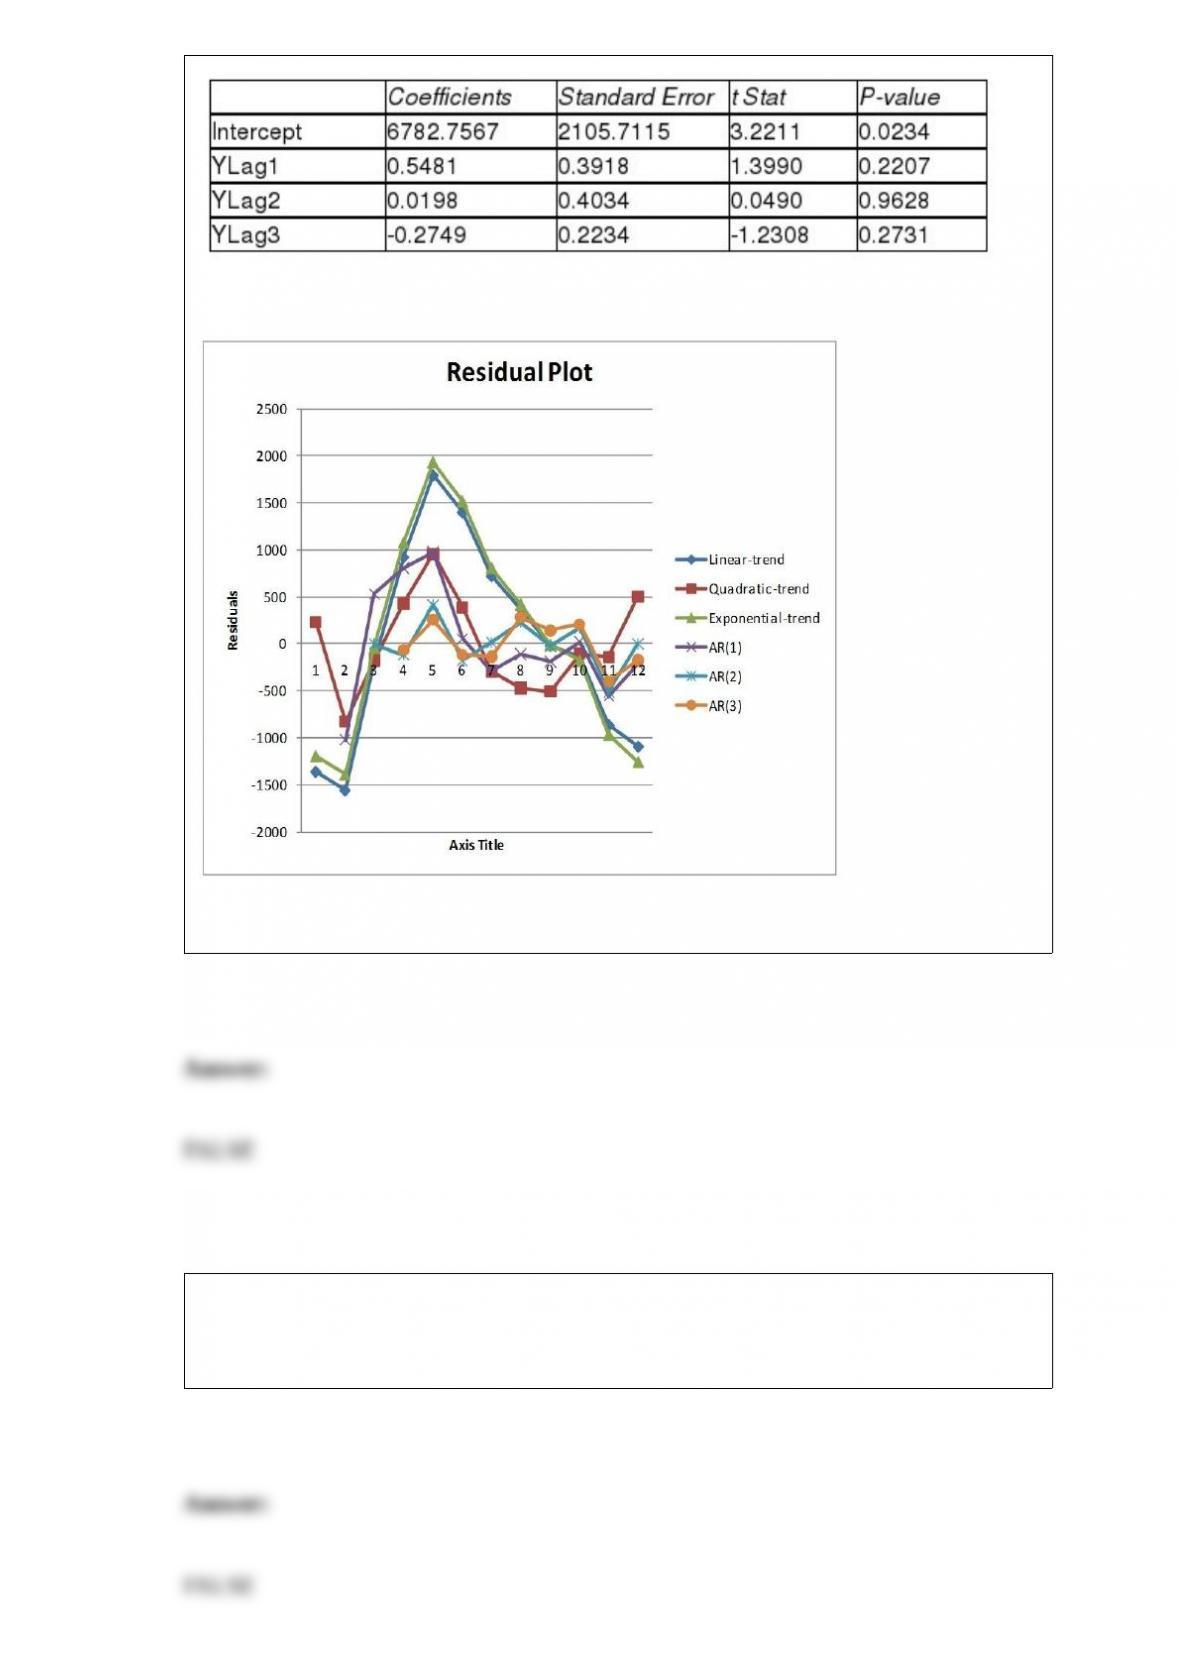
Below is the residual plot of the various models:
True or False: Referring to Table 16-13, the best model based on the residual plots is the
quadratic-trend regression model.
True or False: “What conclusions and interpretations can you reach from the results of
the hypothesis test?” is not an important question to ask when performing a hypothesis
test.
True or False: Two simple regression models were used to predict a single dependent
variable. Both models were highly significant, but when the two independent variables
were placed in the same multiple regression model for the dependent variable, R2 did
not increase substantially and the parameter estimates for the model were not
significantly different from 0. This is probably an example of collinearity.
True or False: TABLE 19-6
A student wanted to find out the optimal strategy to study for a Business Statistics
exam. He constructed the following payoff table based on the mean amount of time he
needed to study every week for the course and the degree of difficulty of the exam.
From the information that he gathered from students who had taken the course, he
concluded that there was a 40% probability that the exam would be easy.
Referring to Table 19-6, the optimal strategy using the return-to-risk ratio criterion is to
study 8 hours per week on average for the exam.
Which of the following statements about moving averages is not true?
A) It can be used to smooth a series.
B) It gives equal weight to all values in the computation.
C) It is simpler than the method of exponential smoothing.
D) It gives greater weight to more recent data.

If two equally likely events A and B are collectively exhaustive, what is the probability
that event A occurs?
A) 0
B) 0.50
C) 1.00
D) Cannot be determined from the information given.
A local real estate appraiser analyzed the sales prices of homes in 2 neighborhoods to
the corresponding appraised values of the homes. The goal of the analysis was to
compare the distribution of sale-to-appraised ratios from homes in the 2 neighborhoods.
Random and independent samples were selected from the 2 neighborhoods from last
year’s homes sales, 8 from each of the 2 neighborhoods. Identify the nonparametric
method that would be used to analyze the data.
A) X2 test for the differences among more than two proportions
B) McNemar test for the difference between two proportions
C) the Wilcoxon Rank Sum Test, using the test statistic T1
D) X2 test for the variance
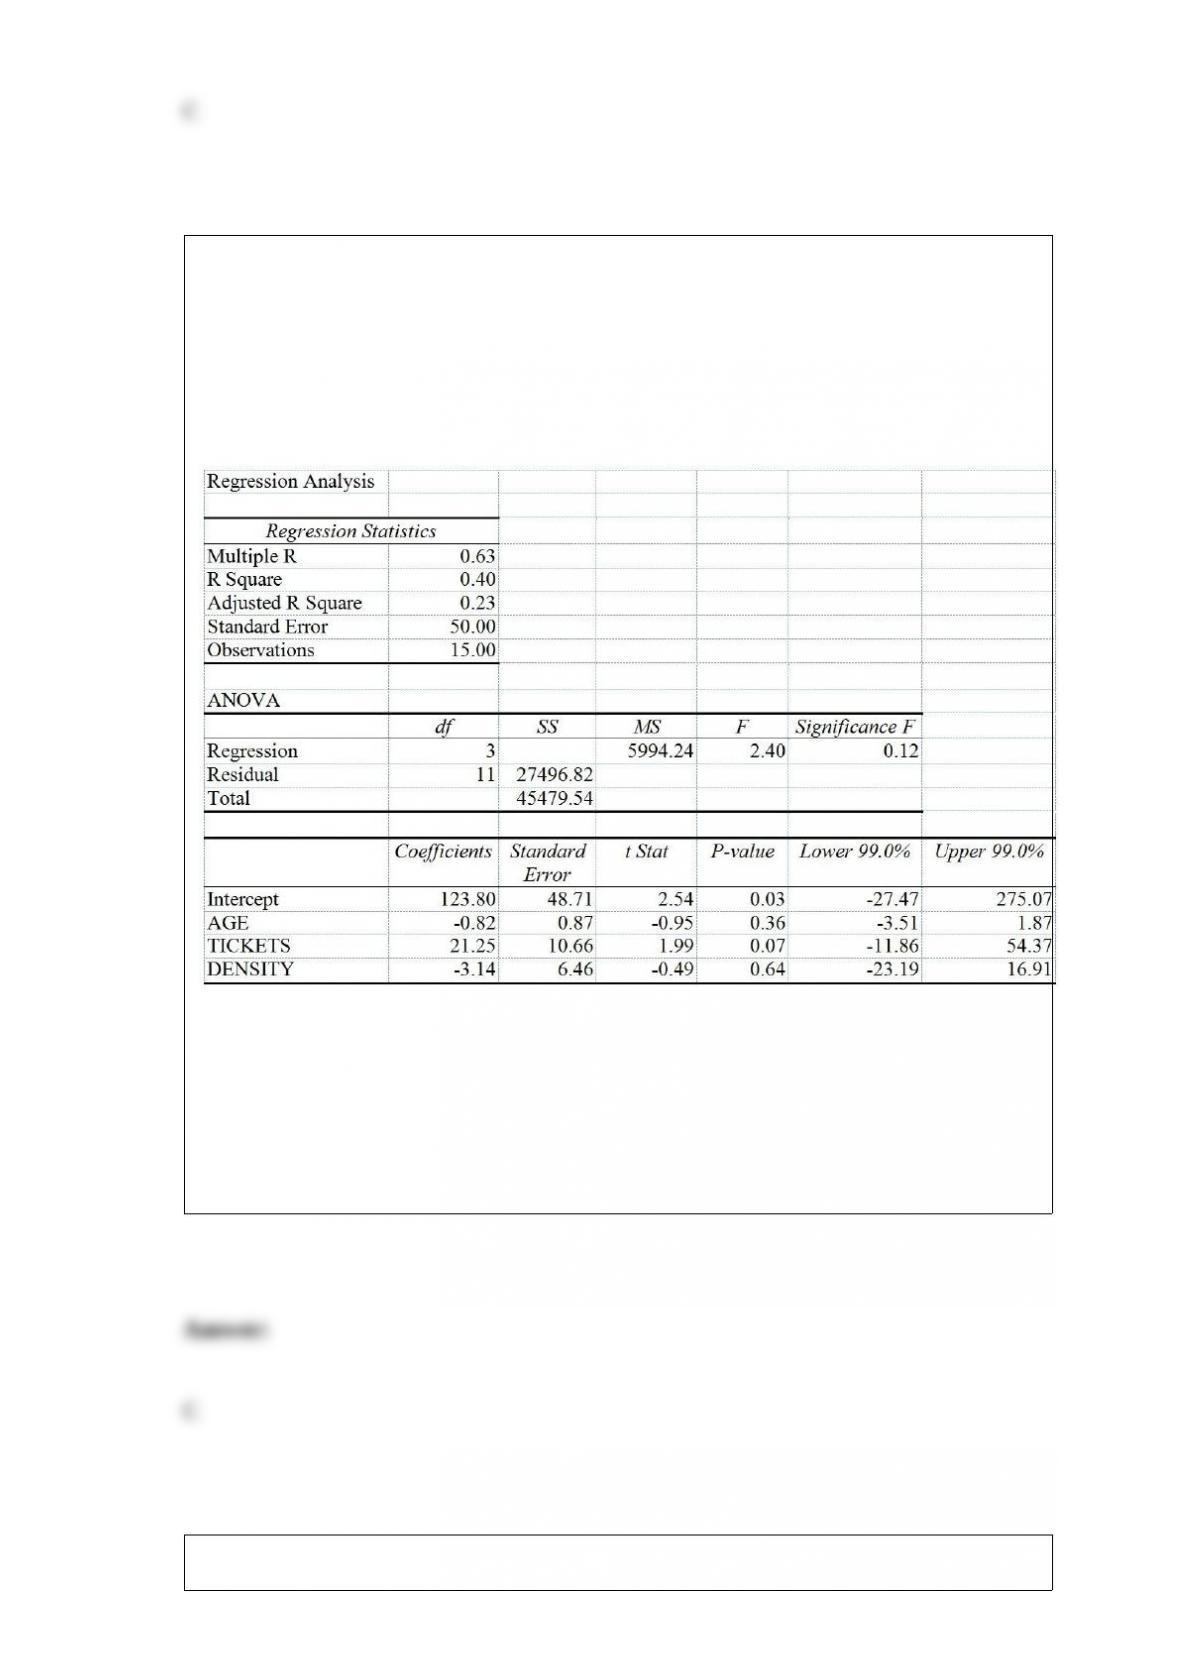
TABLE 17-5
You worked as an intern at We Always Win Car Insurance Company last summer. You
notice that individual car insurance premiums depend very much on the age of the
individual, the number of traffic tickets received by the individual, and the population
density of the city in which the individual lives. You performed a regression analysis in
EXCEL and obtained the following information:
Referring to Table 17-5, to test the significance of the multiple regression model, what
is the form of the null hypothesis?
A) H0 : β0
B) H0 : β1
C) H0 : β1 = β2 = β3
D) H0 : β0 = β1 = β2 = β3
TABLE 19-1
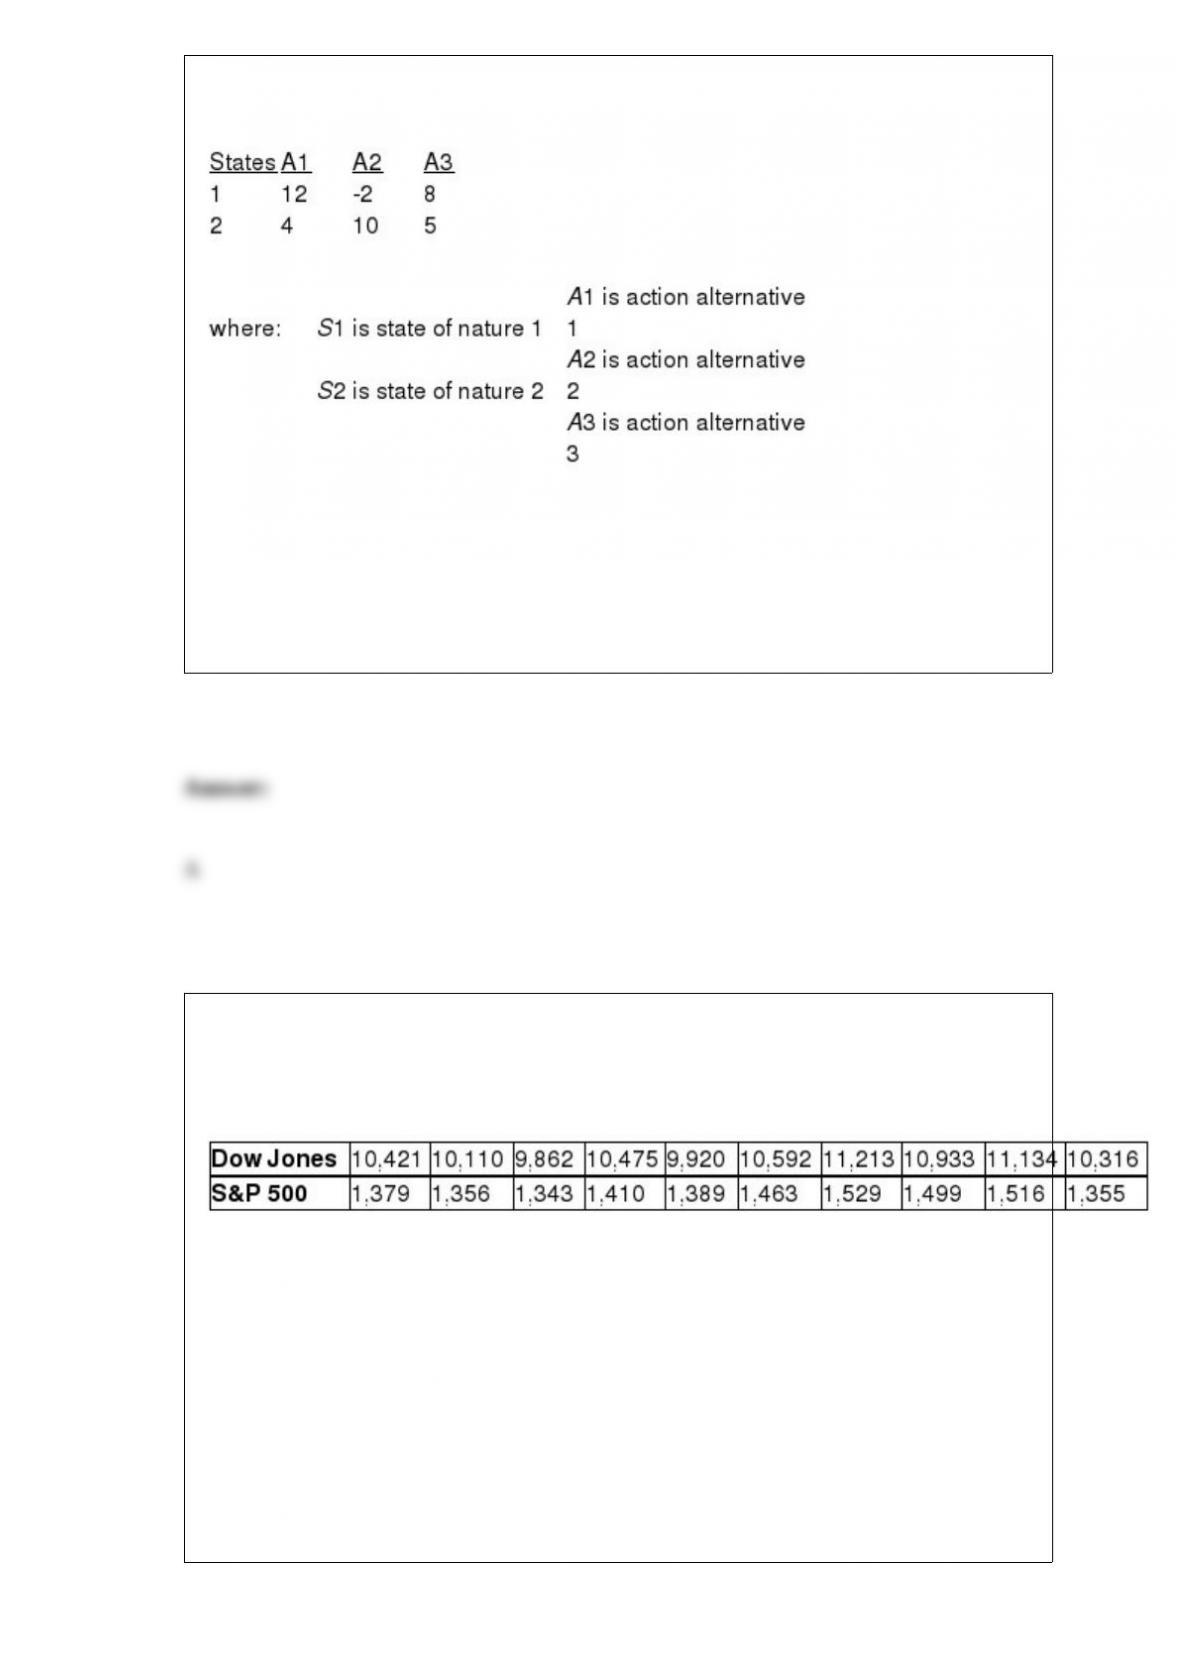
The following payoff table shows profits associated with a set of 3 alternatives under 2
possible states of nature
Referring to Table 19-1, if the probability of S1 is 0.5, what is the optimal alternative
using EMV?
A) A1
B) A2
C) A3
D) It cannot be determined.
TABLE 3-11
Given below are the closing prices for the Dow Jones Industrial Average (DJIA) and the
Standard & Poor’s (S&P) 500 Index over 10 weeks.
Referring to Table 3-11, how will you classify the linear relationship between the DJIA
and the S&P 500 index?
A) weak
B) moderate
C) strong
D) no relationship
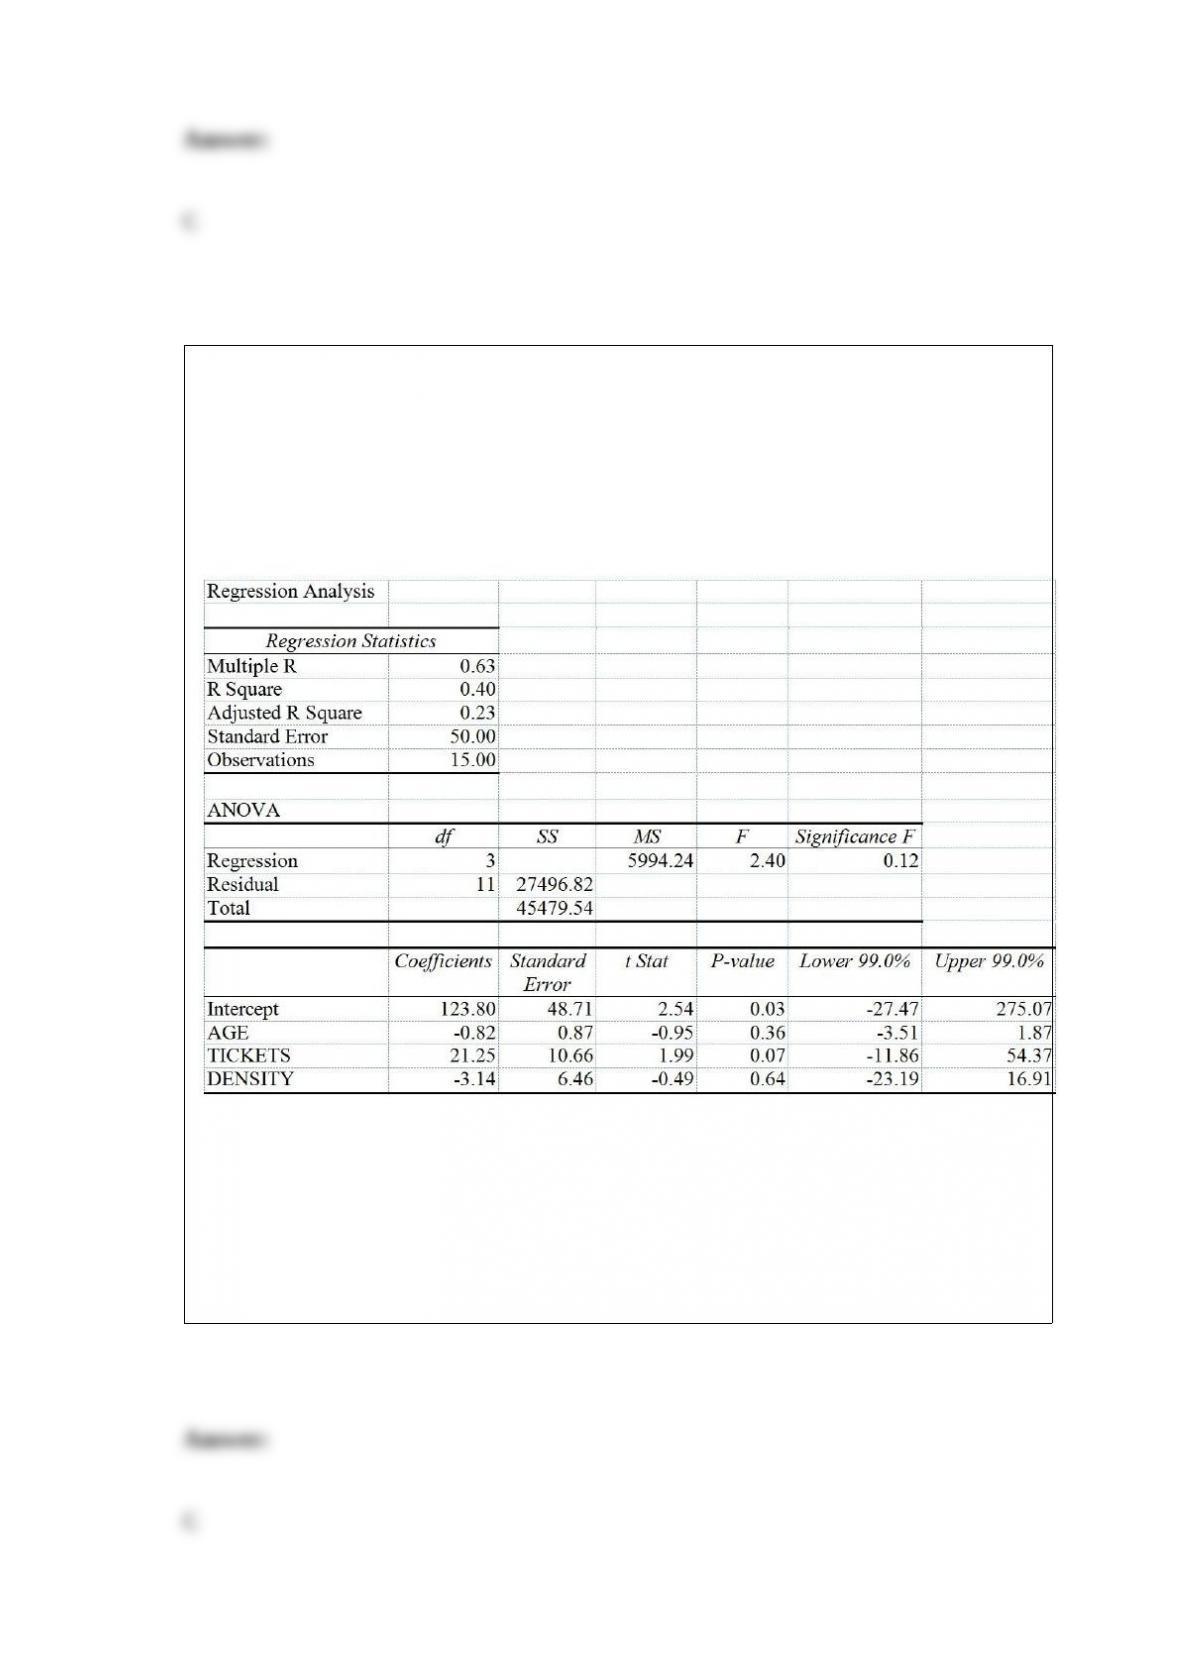
TABLE 17-5
You worked as an intern at We Always Win Car Insurance Company last summer. You
notice that individual car insurance premiums depend very much on the age of the
individual, the number of traffic tickets received by the individual, and the population
density of the city in which the individual lives. You performed a regression analysis in
EXCEL and obtained the following information:
Referring to Table 17-5, to test the significance of the multiple regression model, what
is the form of the null hypothesis?
A) H0 : β0
B) H0 : β1
C) H0 : β1 = β2 = β3
D) H0 : β0 = β1 = β2 = β3
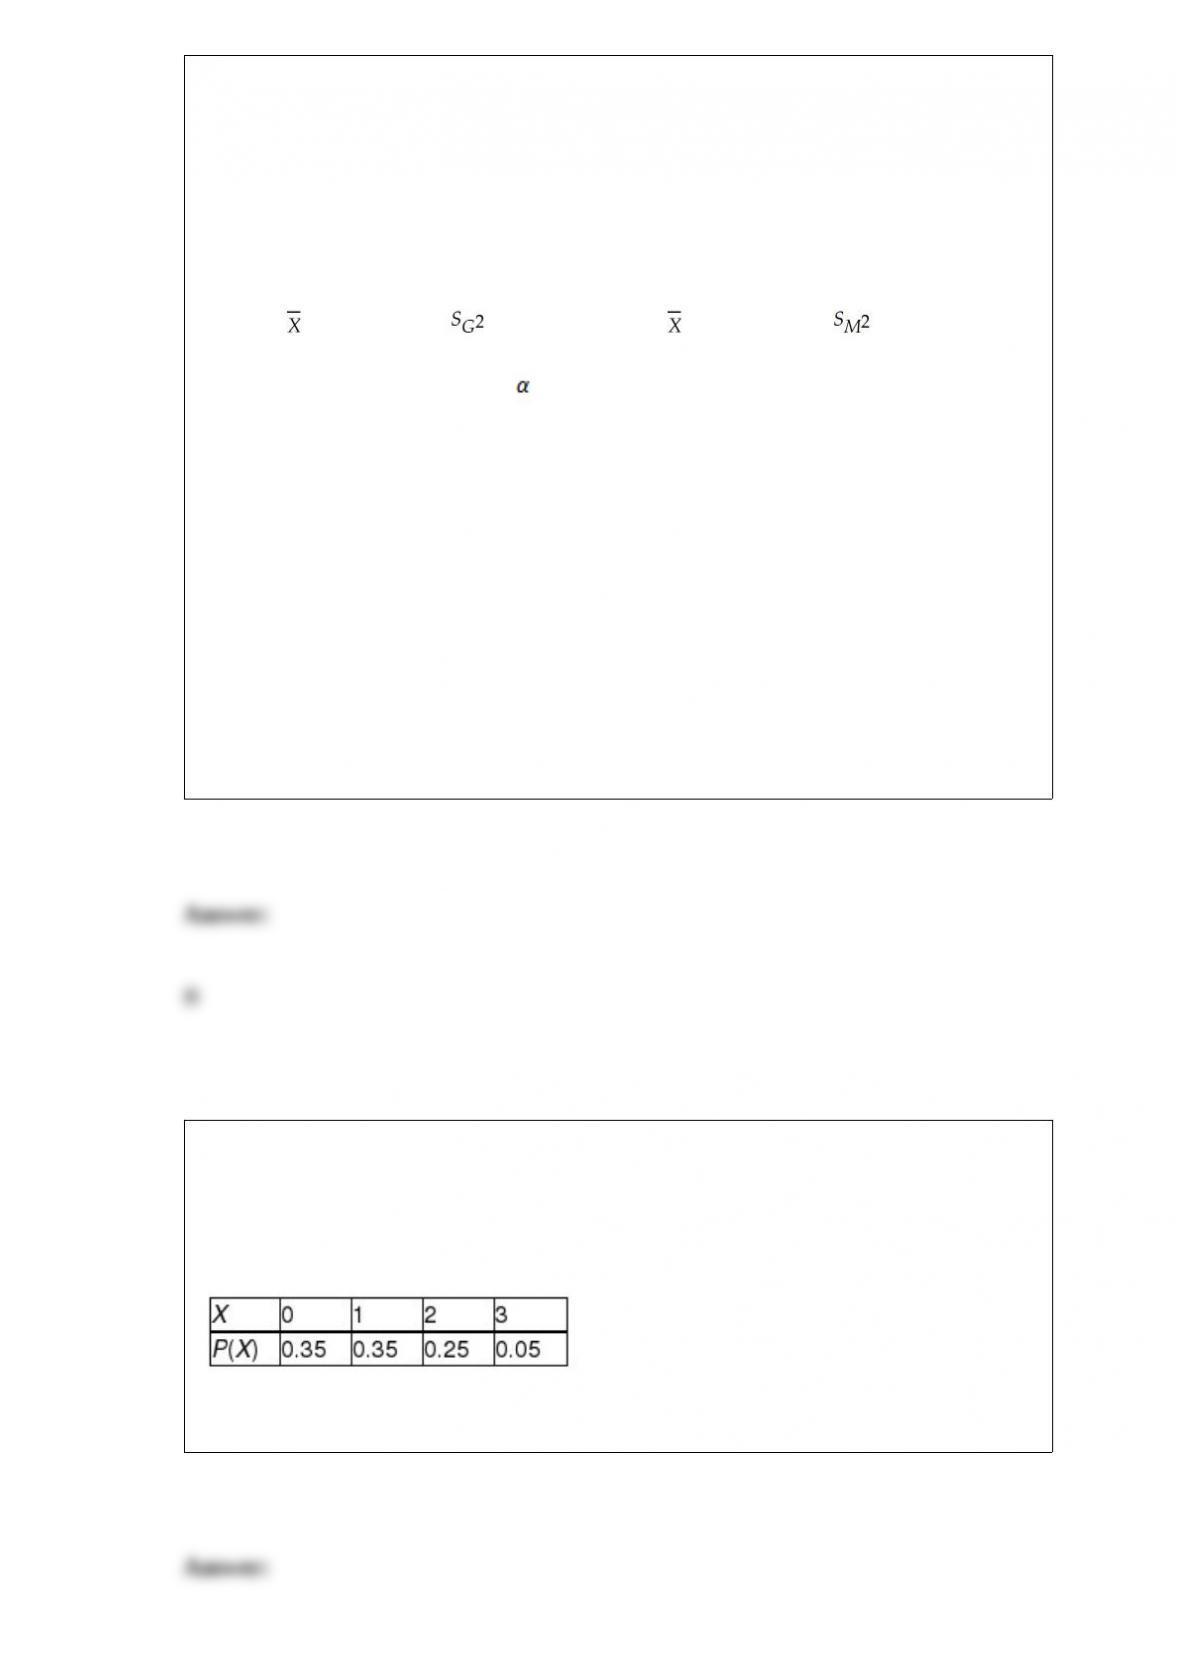
TABLE 10-3
A real estate company is interested in testing whether the mean time that families in
Gotham have been living in their current homes is less than families in Metropolis.
Assume that the two population variances are equal. A random sample of 100 families
from Gotham and a random sample of 150 families in Metropolis yield the following
data on length of residence in current homes.
Gotham: G = 35 months, = 900 Metropolis: M = 50 months, = 1050
Referring to Table 10-3, suppose = 0.05. Which of the following represents the correct
conclusion?
A) There is not enough evidence that the mean amount of time families in Gotham have
been living in their current homes is less than families in Metropolis.
B) There is enough evidence that the mean amount of time families in Gotham have
been living in their current homes is less than families in Metropolis.
C) There is not enough evidence that the mean amount of time families in Gotham have
been living in their current homes is not less than families in Metropolis.
D) There is enough evidence that the mean amount of time families in Gotham have
been living in their current homes is not less than families in Metropolis.
TABLE 5-3
The following table contains the probability distribution for X = the number of
retransmissions necessary to successfully transmit a 1024K data package through a
double satellite media.
Referring to Table 5-3, the probability of no retransmissions is ________.
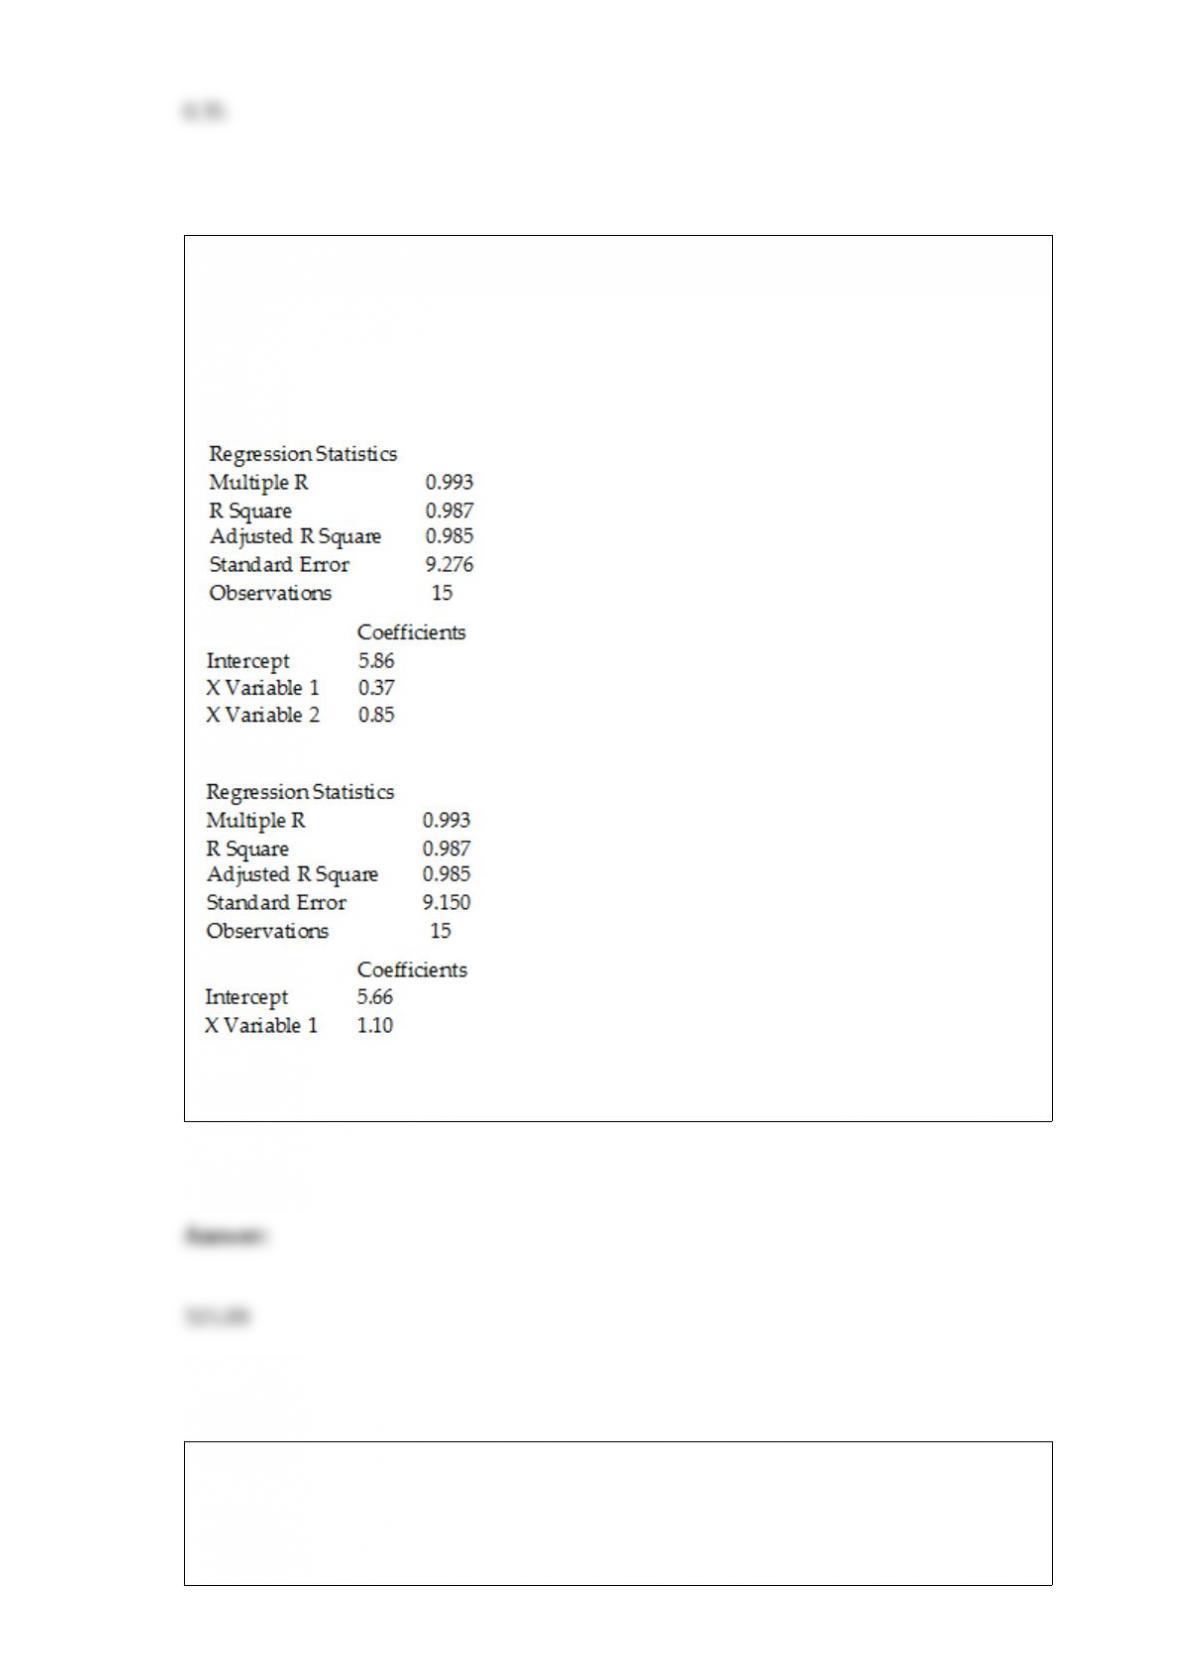
TABLE 16-11
The manager of a health club has recorded mean attendance in newly introduced step
classes over the last 15 months: 32.1, 39.5, 40.3, 46.0, 65.2, 73.1, 83.7, 106.8, 118.0,
133.1, 163.3, 182.8, 205.6, 249.1, and 263.5. She then used Microsoft Excel to obtain
the following partial output for both a first- and second-order autoregressive model.
SUMMARY OUTPUT – 2nd Order Model
SUMMARY OUTPUT – 1st Order Model
Referring to Table 16-11, using the second-order model, the forecast of mean
attendance for month 16 is ________.
TABLE 10-4
Two samples each of size 25 are taken from independent populations assumed to be
normally distributed with equal variances. The first sample has a mean of 35.5 and
standard deviation of 3.0 while the second sample has a mean of 33.0 and standard
deviation of 4.0.
Referring to Table 10-4, what is the 90% confidence interval estimate for the difference
in the two means?
TABLE 12-5
Four surgical procedures currently are used to install pacemakers. If the patient does not
need to return for follow-up surgery, the operation is called a “clear” operation. A heart
center wants to compare the proportion of clear operations for the 4 procedures, and
collects the following numbers of patients from their own records:
They will use this information to test for a difference among the proportion of clear
operations using a chi-square test with a level of significance of 0.05.
Referring to Table 12-5, the value of the test statistic is ________.
The interval between patients arriving at an outpatient clinic follows an exponential
distribution at a rate of 15 patients per hour. What is the probability that a randomly
chosen arrival interval will be between 5 minutes and 15 minutes?
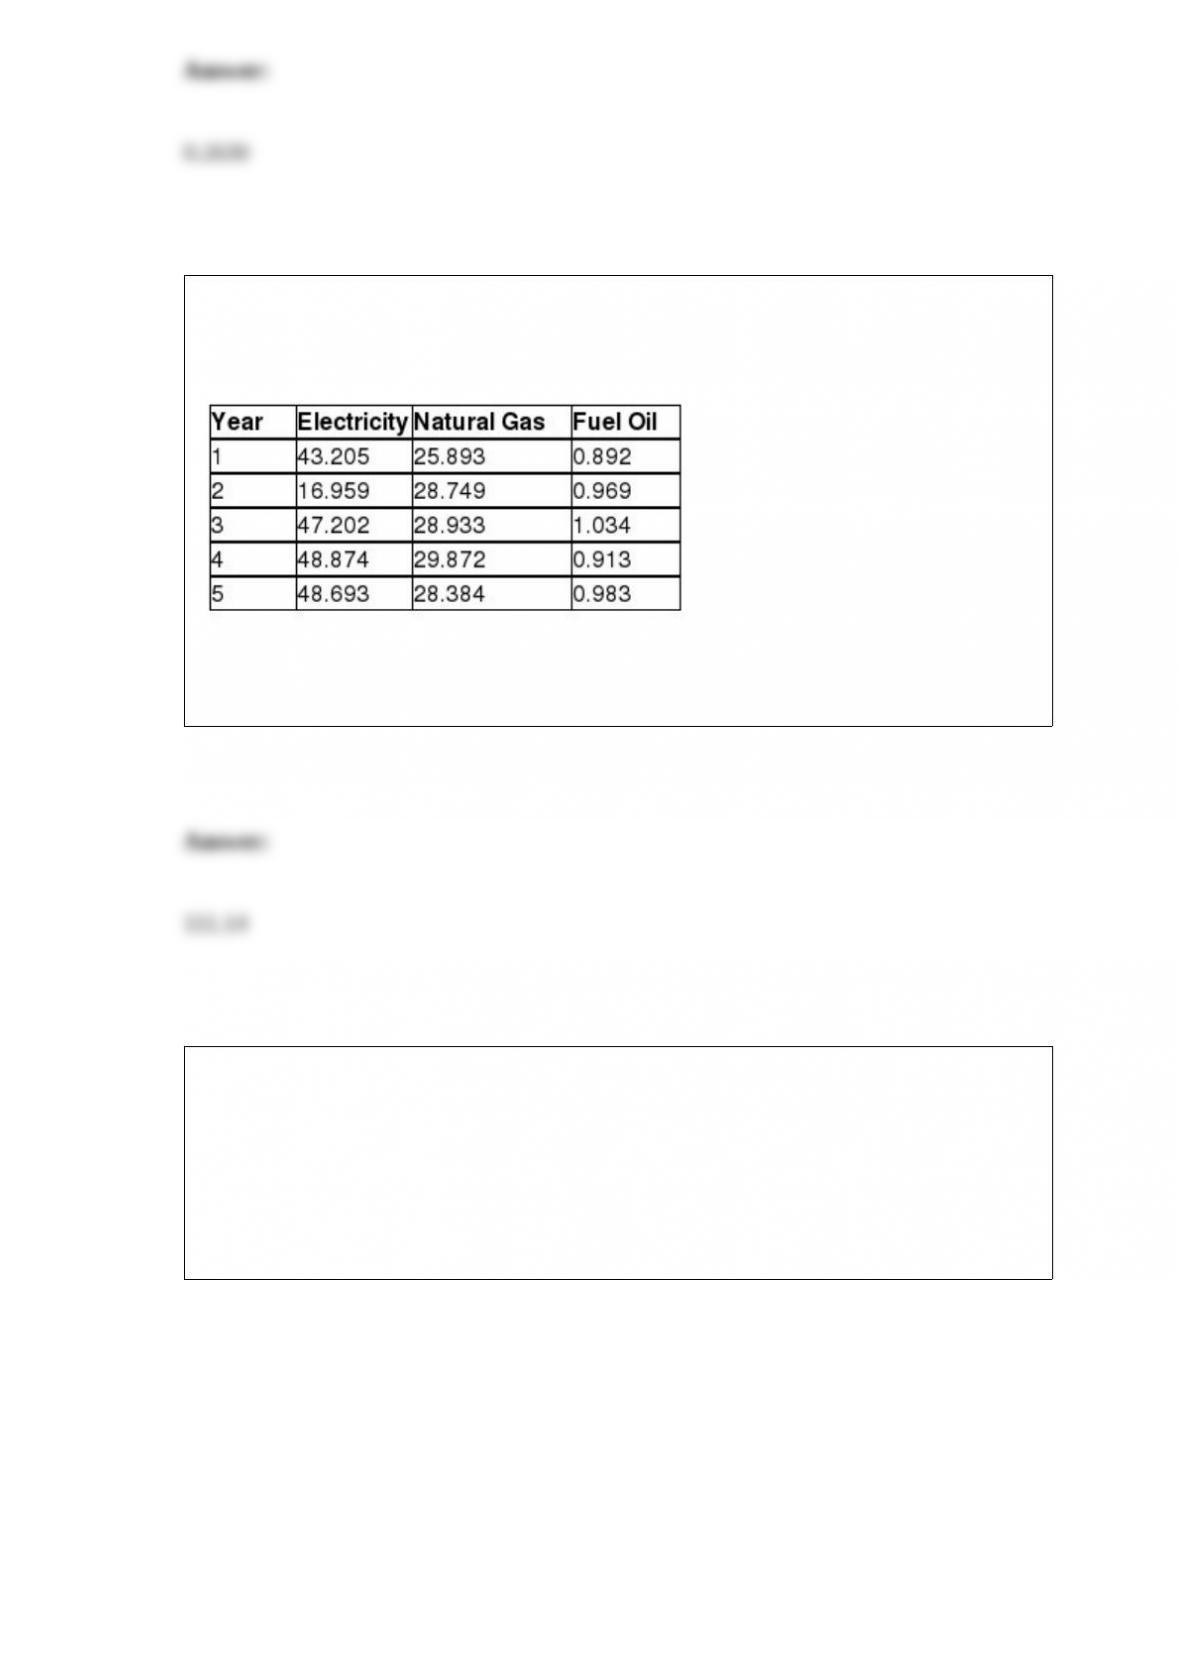
TABLE 16-15
Given below are the average prices for three types of energy products for five
consecutive years.
Referring to Table 16-15, what is the Laspeyres price index for the group of three
energy items in year 3 for a family that consumed 15 units of electricity, 24 units of
natural gas and 200 units of fuel oil in year 1 using year 1 as the base year?
TABLE 17-11
A logistic regression model was estimated in order to predict the probability that a
randomly chosen university or college would be a private university using information
on mean total Scholastic Aptitude Test score (SAT) at the university or college, the
room and board expense measured in thousands of dollars (Room/Brd), and whether the
TOEFL criterion is at least 550 (Toefl550 = 1 if yes, 0 otherwise.) The dependent
variable, Y, is school type (Type = 1 if private and 0 otherwise).
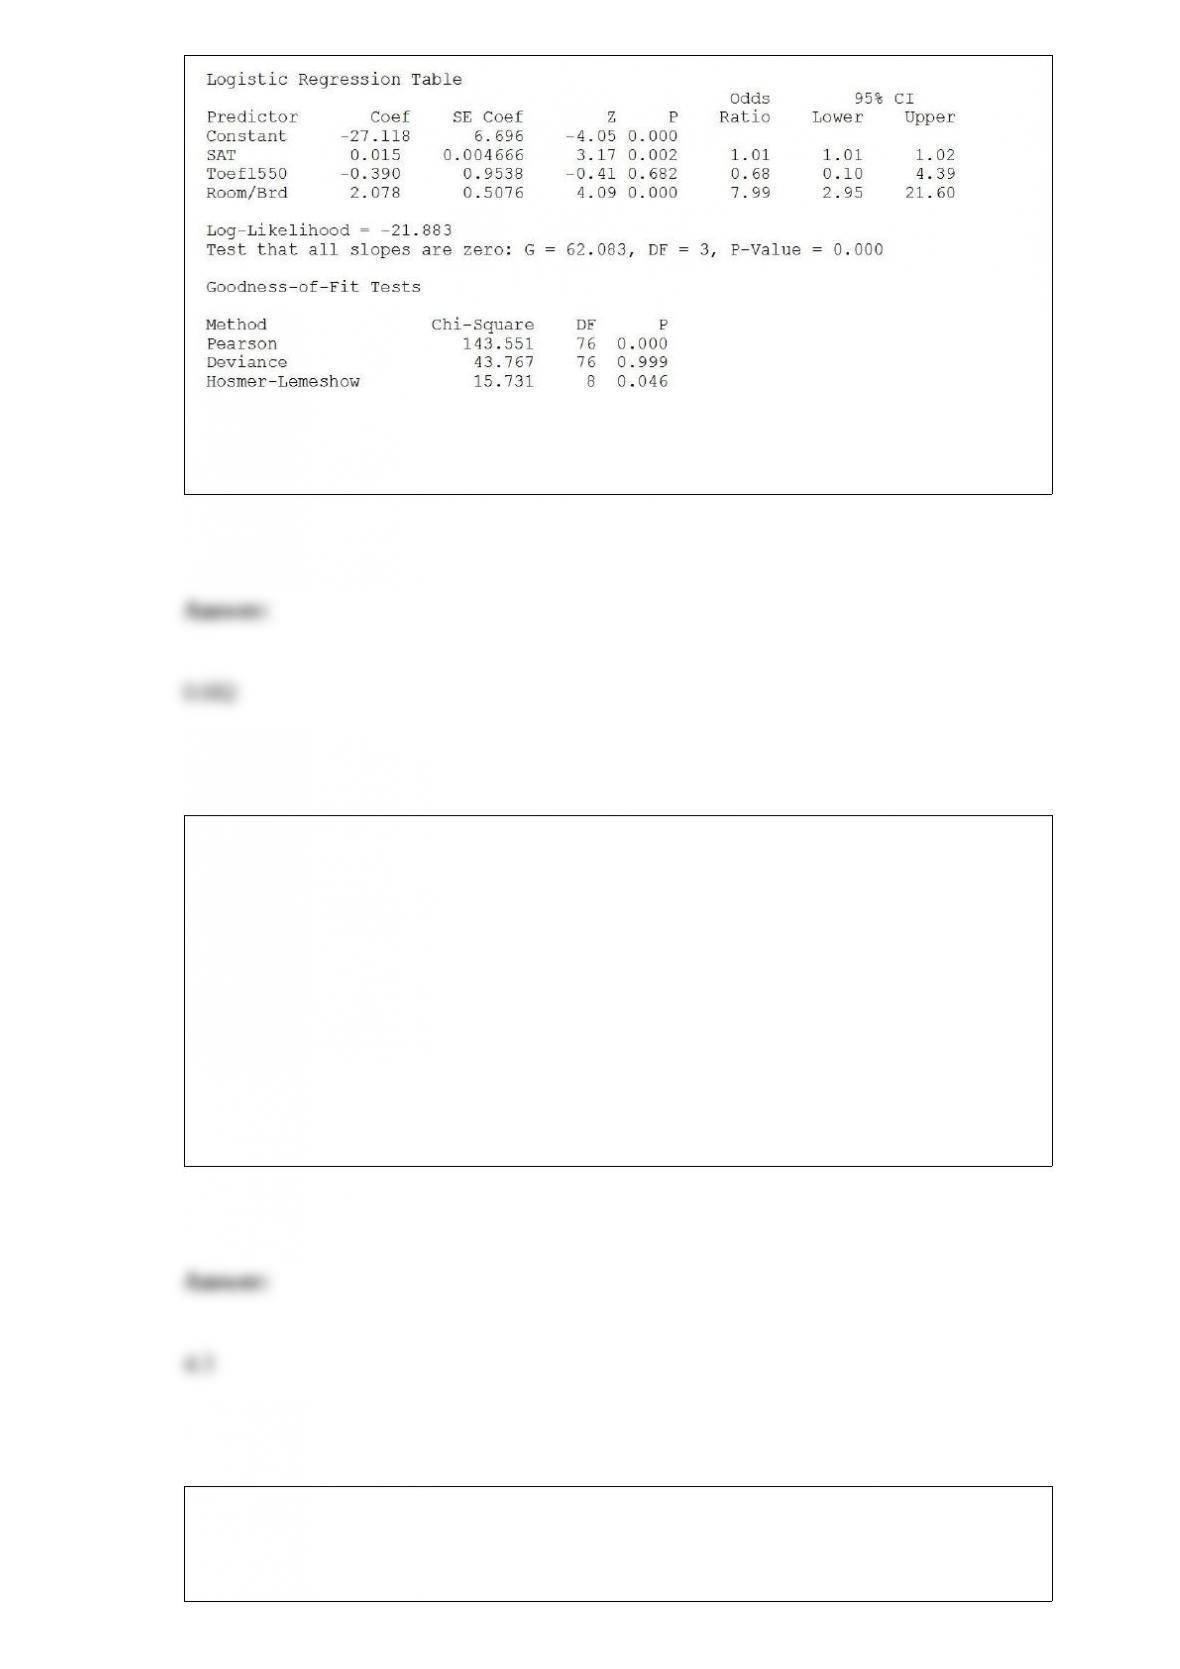
Referring to Table 17-11, what is the p-value of the test statistic when testing whether
Toefl500 makes a significant contribution to the model in the presence of the other
independent variables?
TABLE 3-4
The ordered array below represents the number of cargo manifests approved by customs
inspectors of the Port of New York in a sample of 35 days:
16, 17, 18, 18, 19, 20, 20, 21, 21, 21, 22, 22, 22, 22, 23, 23, 23, 23, 24, 24, 24, 25, 25,
26, 26, 26, 27, 28, 28, 29, 29, 31, 31, 32, 32
Note: For this sample, the sum of the values is 838, and the sum of the squared
differences between each value and the mean is 619.89.
Referring to Table 3-4, the standard deviation of the customs data is ________.
TABLE 12-7
Data on the percentage of 200 hotels in each of the three large cities across the world on
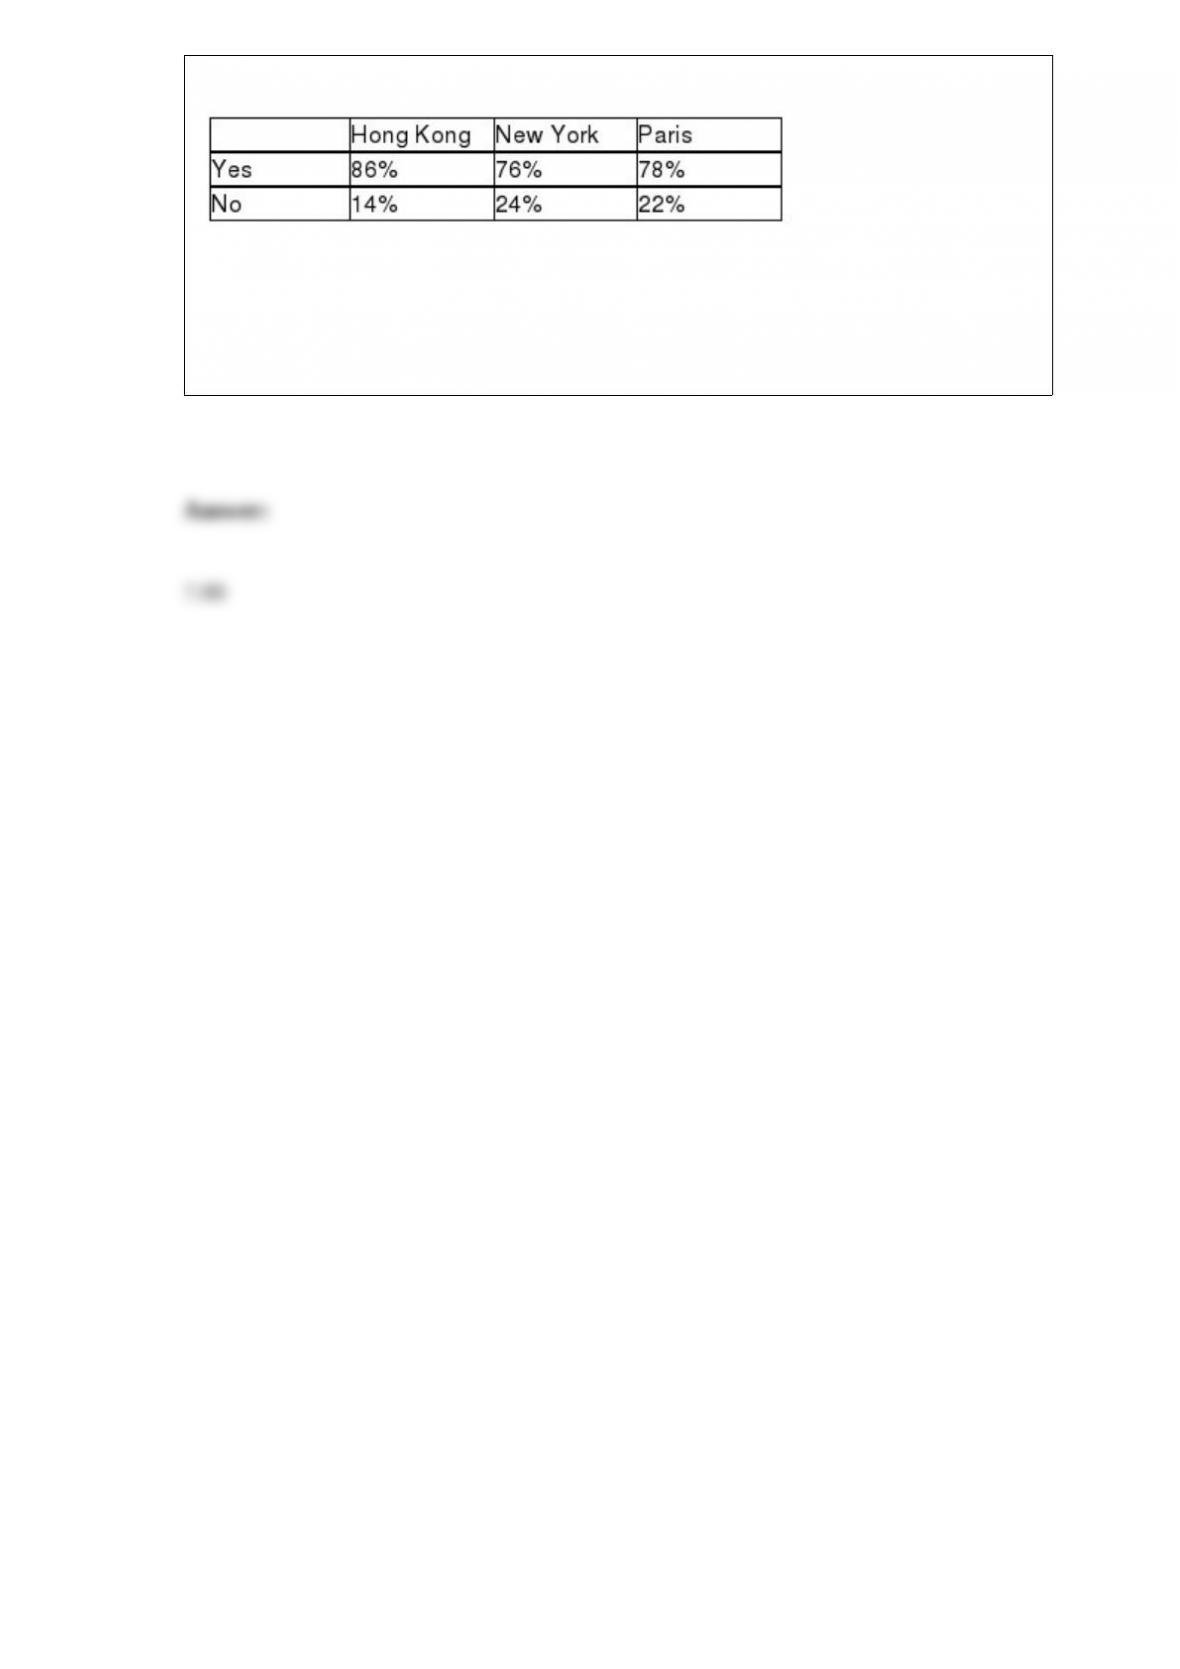
whether minibar charges are correctly posted at checkout are given below.
At the 0.05 level of significance, you want to know if there is evidence of a difference
in the proportion of hotels that correctly post minibar charges among the three cities.
Referring to Table 12-7, the value of the test statistic is ________.