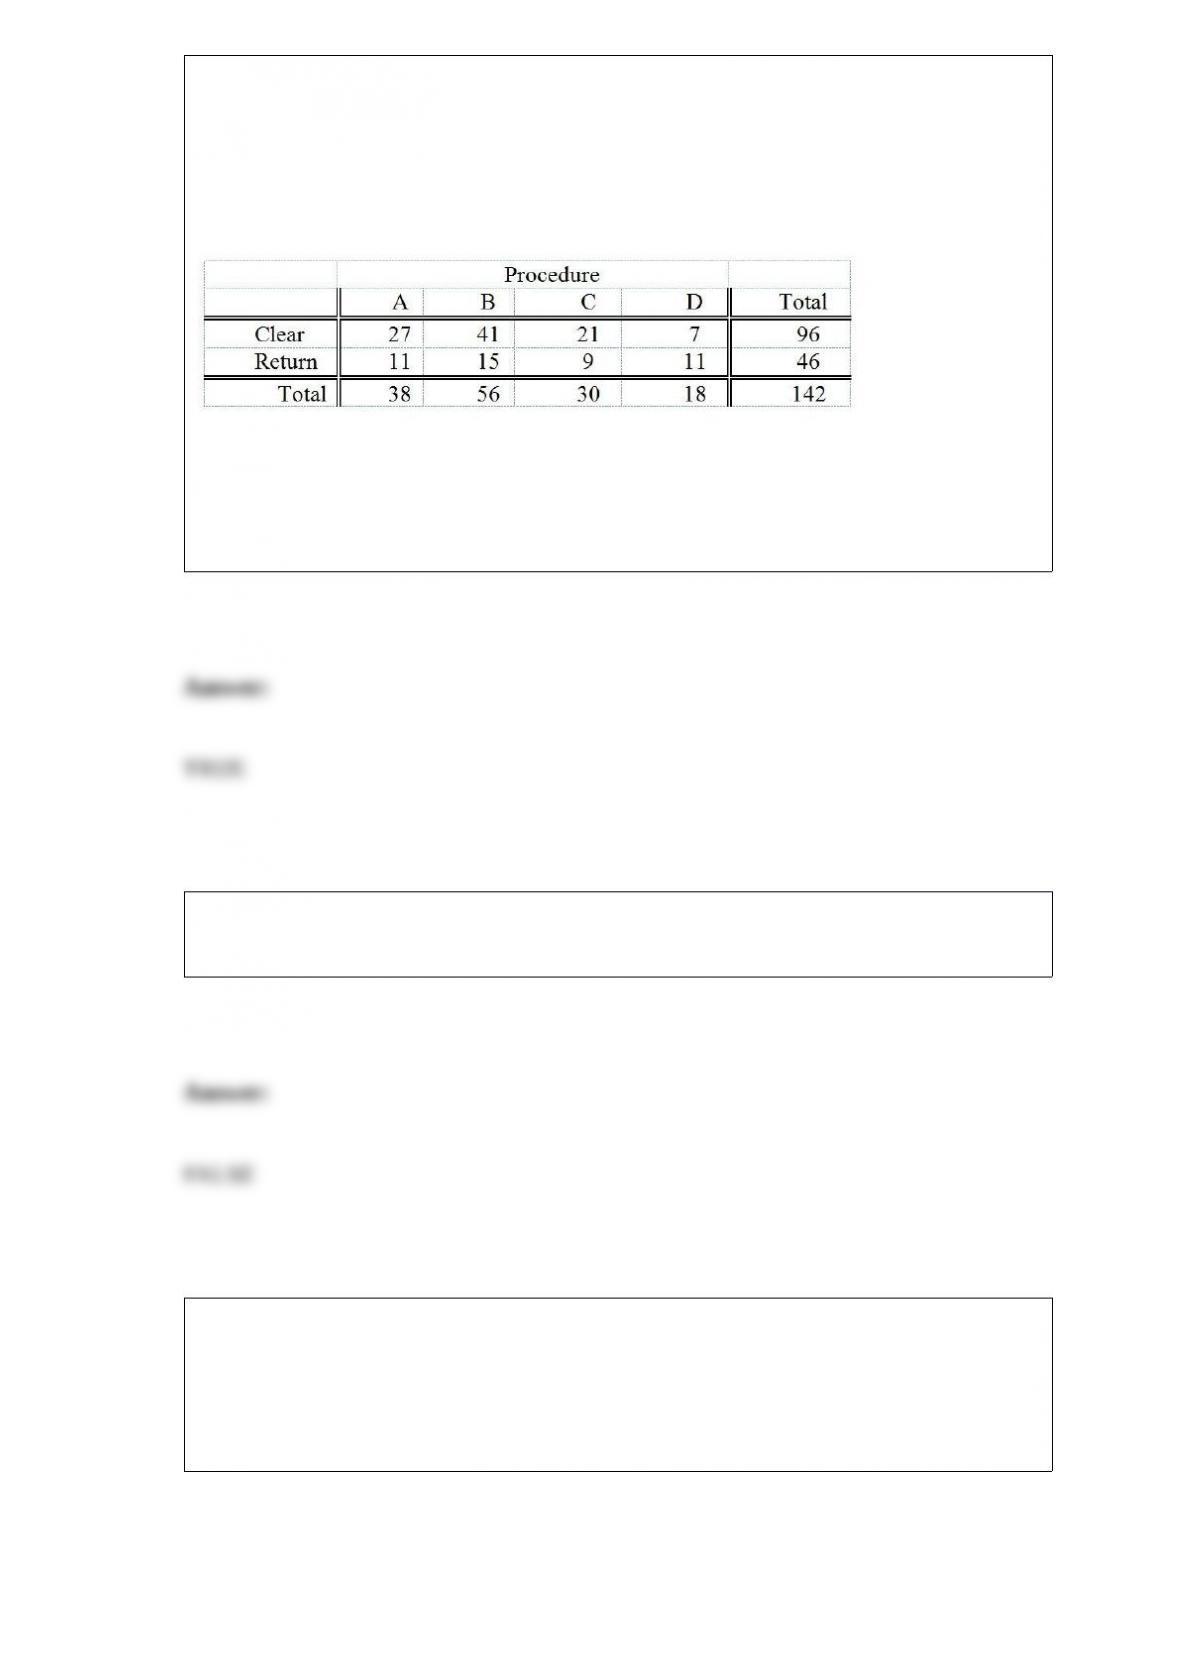
TABLE 12-5
Four surgical procedures currently are used to install pacemakers. If the patient does not
need to return for follow-up surgery, the operation is called a “clear” operation. A heart
center wants to compare the proportion of clear operations for the 4 procedures, and
collects the following numbers of patients from their own records:
They will use this information to test for a difference among the proportion of clear
operations using a chi-square test with a level of significance of 0.05.
True or False: Referring to Table 12-5, the null hypothesis will be rejected.
True or False: Sampling error can be completely eliminated by taking larger sample
sizes.
TABLE 2-18
The stem-and-leaf display below shows the result of a survey of 50 students on their
satisfaction with their school, with the higher scores representing a higher level of
satisfaction.
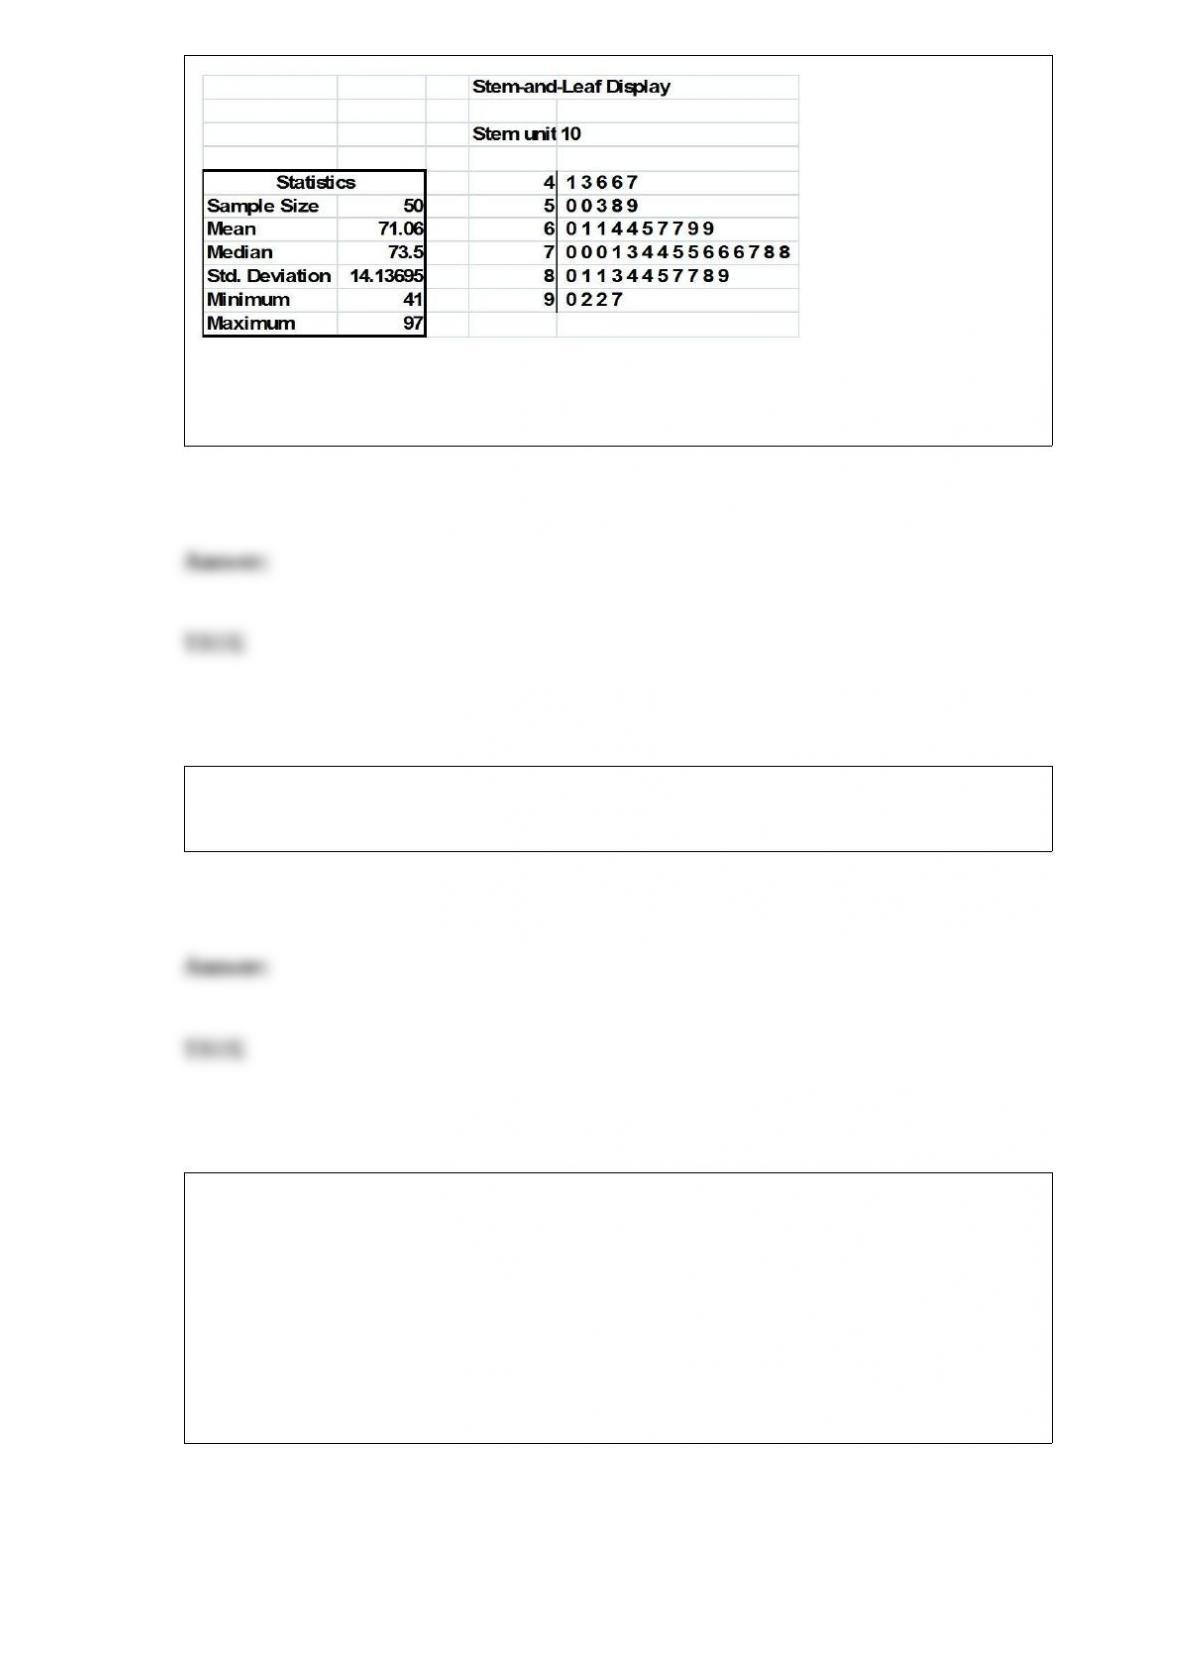
True or False: Referring to Table 2-18, if a student is randomly selected, his/her most
likely level of satisfaction will be in the 70s among the 40s, 50s, 60s, 70s, 80s and 90s.
True or False: A point estimate consists of a single sample statistic that is used to
estimate the true population parameter.
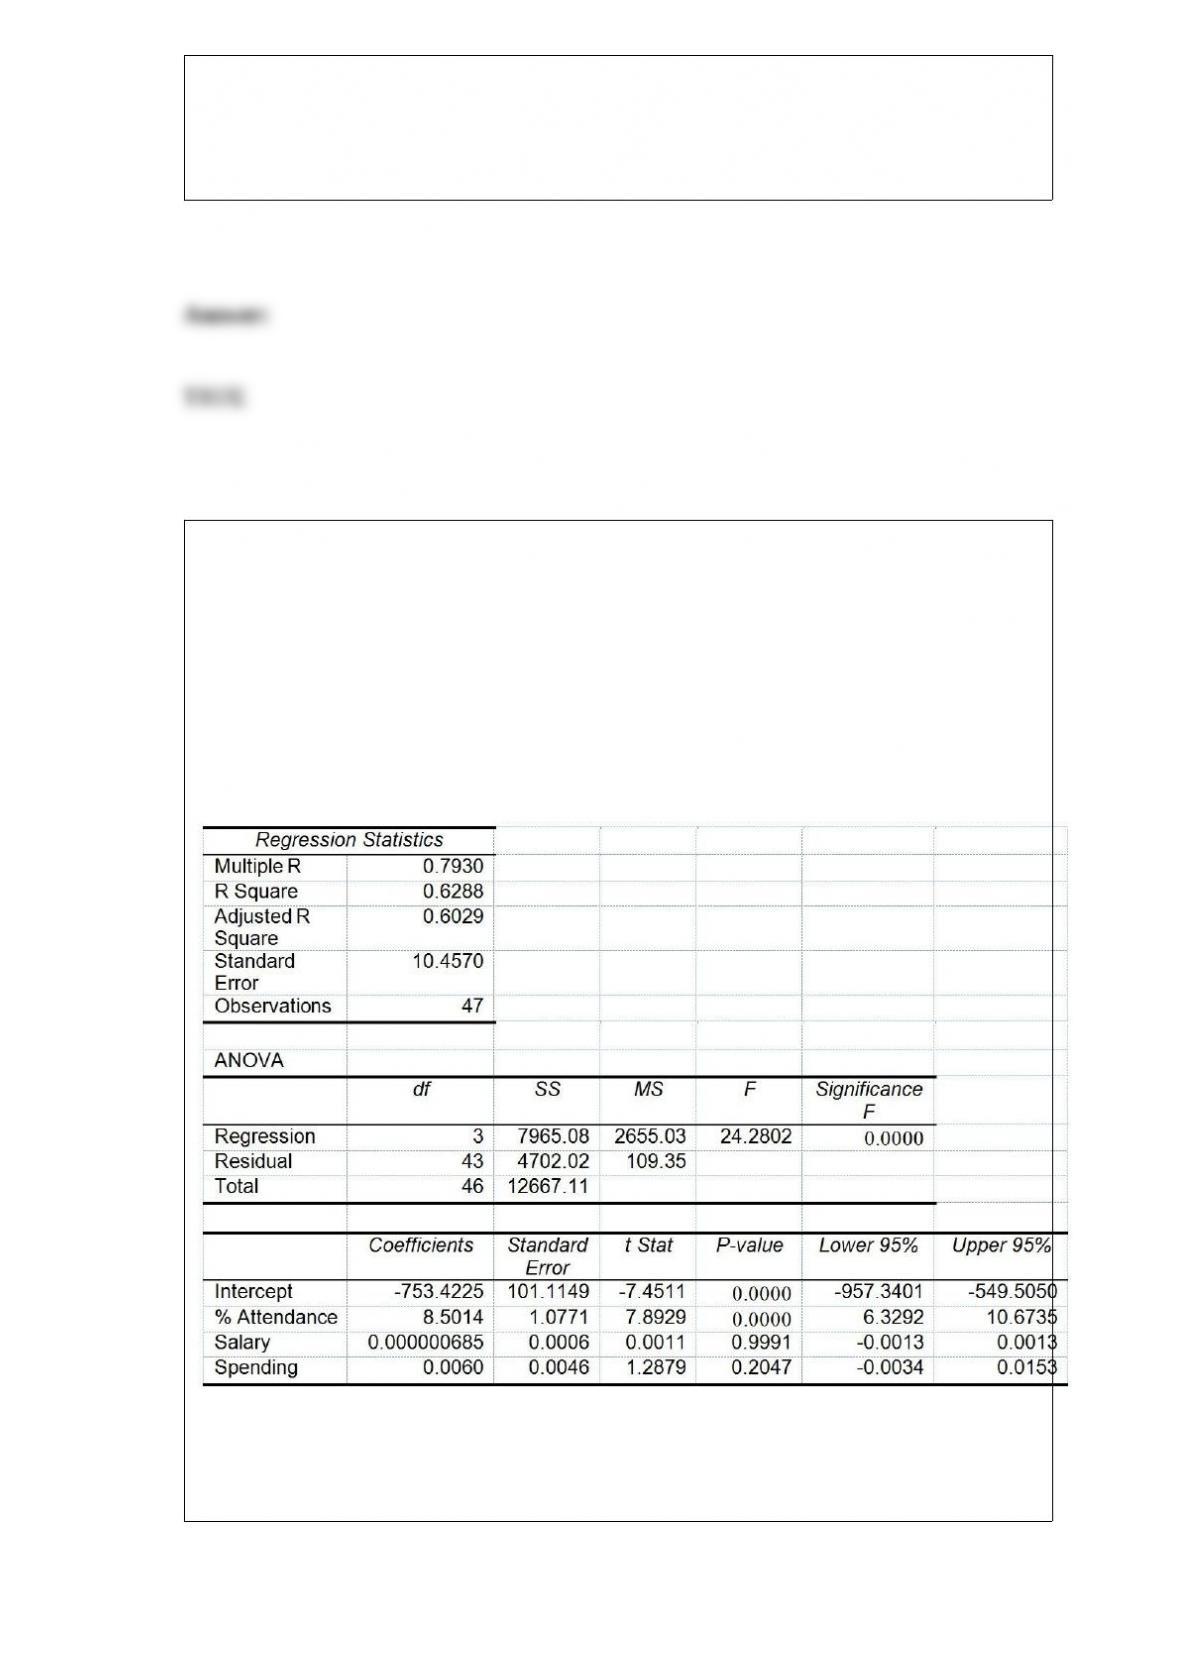
True or False: TABLE 17-8
The superintendent of a school district wanted to predict the percentage of students
passing a sixth-grade proficiency test. She obtained the data on percentage of students
passing the proficiency test (% Passing), daily mean of the percentage of students
attending class (% Attendance), mean teacher salary in dollars (Salaries), and
instructional spending per pupil in dollars (Spending) of 47 schools in the state.
Following is the multiple regression output with Y = % Passing as the dependent
variable, X1 = % Attendance, X2 = Salaries and X3 = Spending:
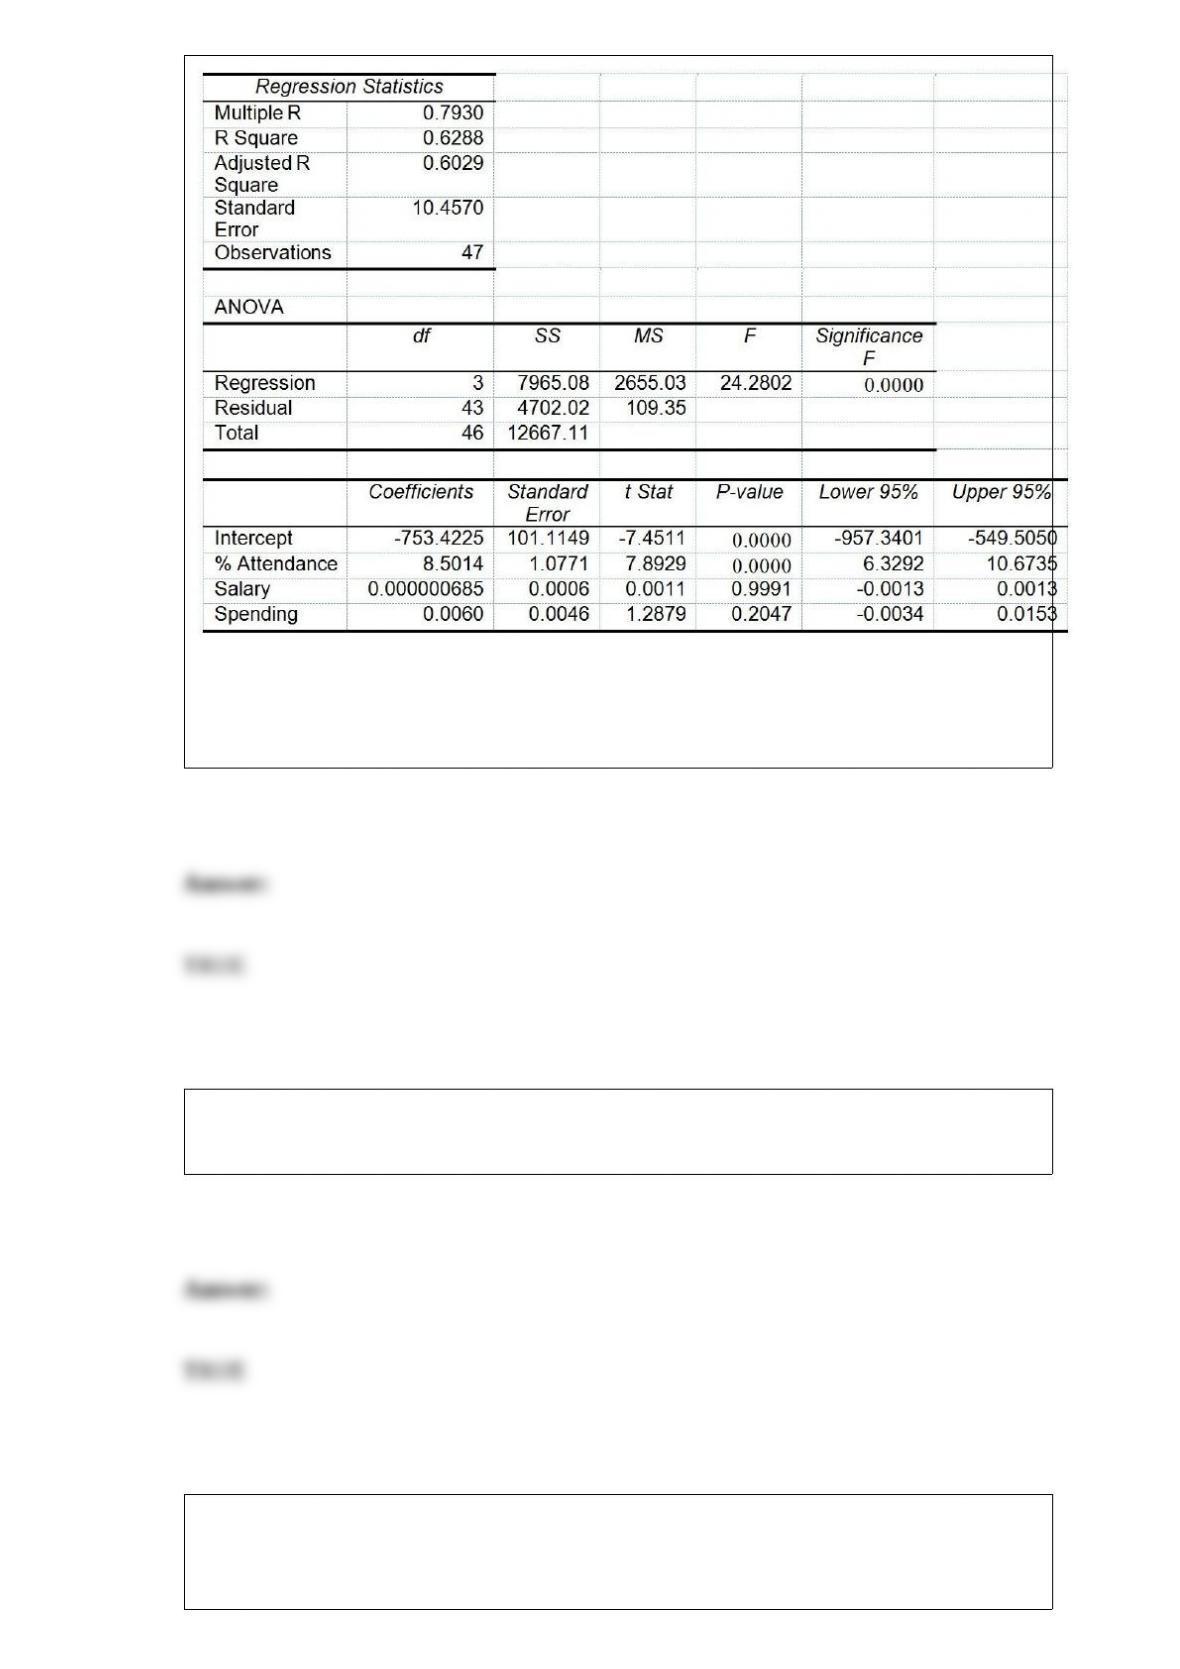
Referring to Table 17-8, the null hypothesis should be rejected at a 5% level of
significance when testing whether there is a significant relationship between the
percentage of students passing the proficiency test and the entire set of explanatory
variables.
True or False: As a general rule, a value is considered an extreme value if its Z score is
greater than 3.
True or False: Every spring semester, the School of Business coordinates a luncheon for
graduating seniors, their families, and friends with local business leaders . Corporate
sponsorship pays for the lunches of each of the seniors, but students have to purchase
tickets to cover the cost of lunches served to guests they bring with them. Data on the
number of guests each graduating senior invited to the luncheon and the number of
graduating seniors in each category were collected. A histogram can be used to present
this information.
True or False: TABLE 17-8
The superintendent of a school district wanted to predict the percentage of students
passing a sixth-grade proficiency test. She obtained the data on percentage of students
passing the proficiency test (% Passing), daily mean of the percentage of students
attending class (% Attendance), mean teacher salary in dollars (Salaries), and
instructional spending per pupil in dollars (Spending) of 47 schools in the state.
Following is the multiple regression output with Y = % Passing as the dependent
variable, X1 = % Attendance, X2 = Salaries and X3 = Spending:
Referring to Table 17-8, the null hypothesis should be rejected at a 5% level of
significance when testing whether instructional spending per pupil has any effect on the
percentage of students passing the proficiency test, taking into account the effect of all
the other independent variables.
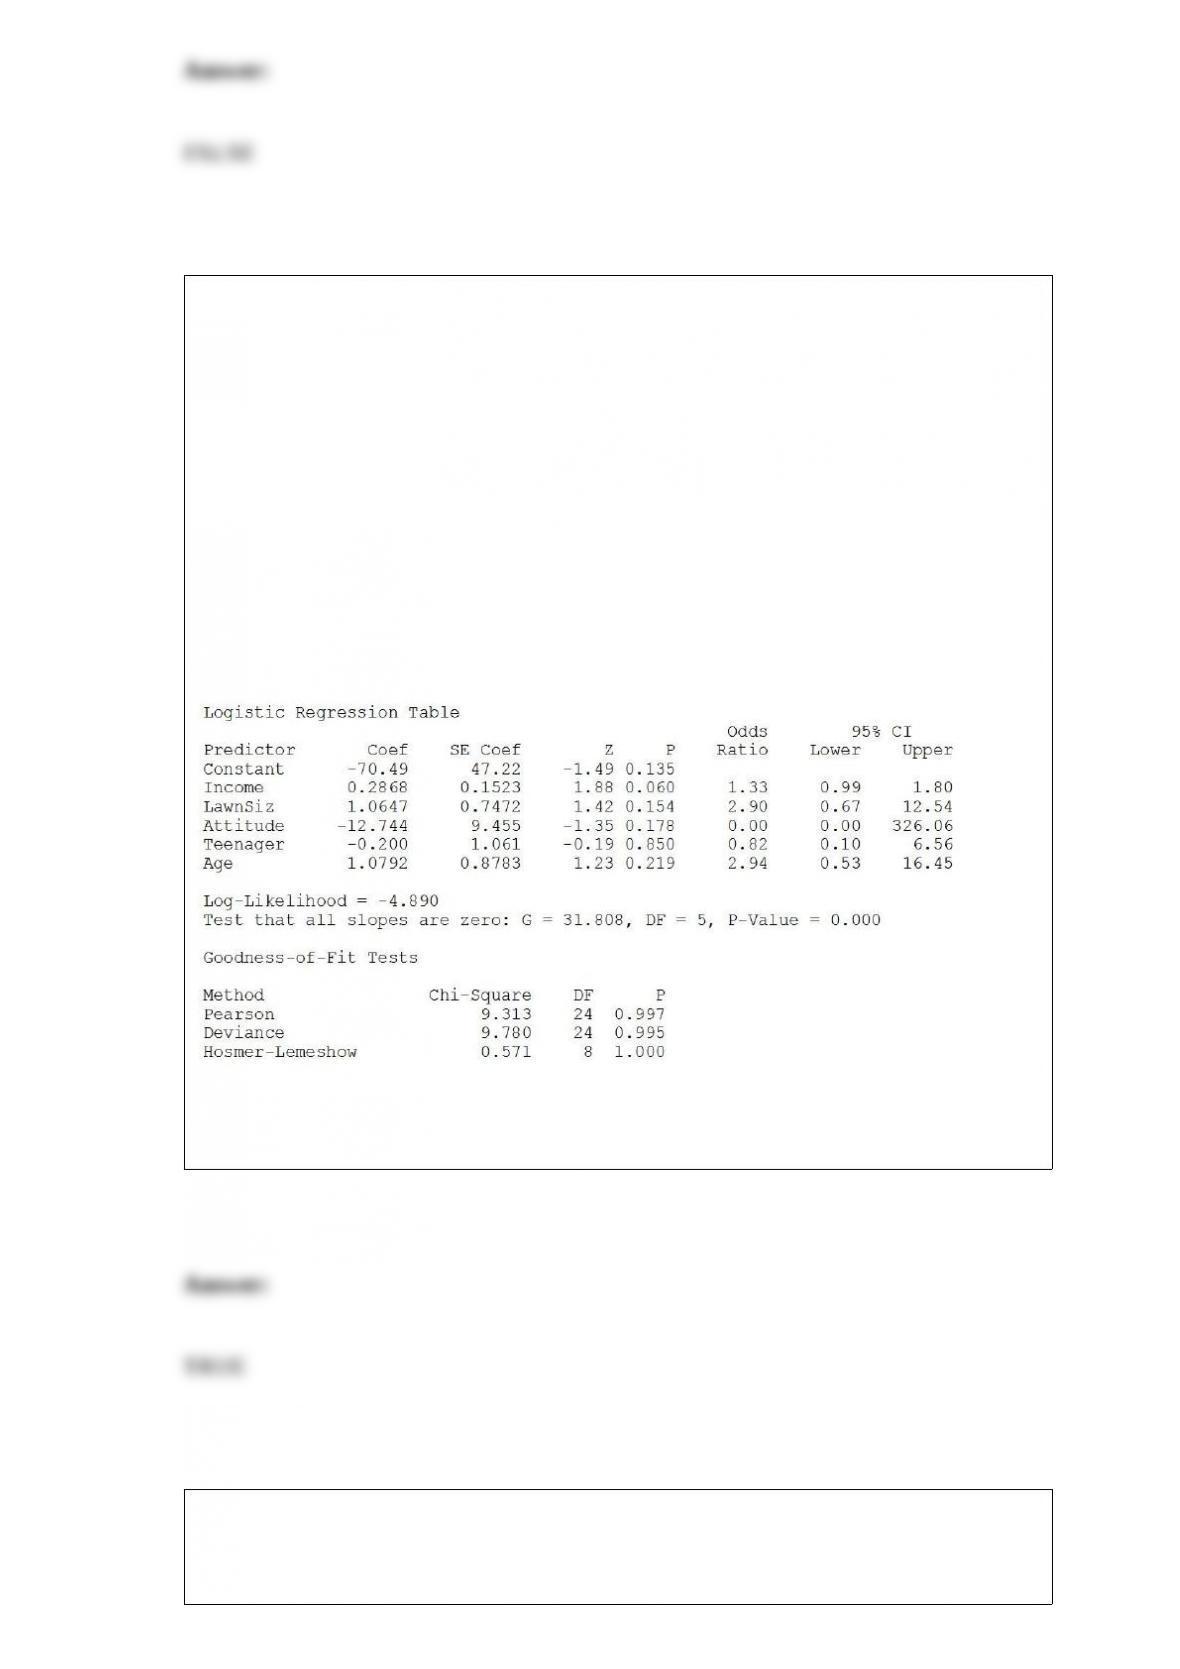
True or False: TABLE 17-12
The marketing manager for a nationally franchised lawn service company would like to
study the characteristics that differentiate home owners who do and do not have a lawn
service. A random sample of 30 home owners located in a suburban area near a large
city was selected; 15 did not have a lawn service (code 0) and 15 had a lawn service
(code 1). Additional information available concerning these 30 home owners includes
family income (Income, in thousands of dollars), lawn size (Lawn Size, in thousands of
square feet), attitude toward outdoor recreational activities (Attitude 0 = unfavorable, 1
= favorable), number of teenagers in the household (Teenager), and age of the head of
the household (Age).
The Minitab output is given below:
Referring to Table 17-12, the null hypothesis that the model is a good-fitting model
cannot be rejected when allowing for a 5% probability of making a type I error.
TABLE 11-11
A student team in a business statistics course designed an experiment to investigate
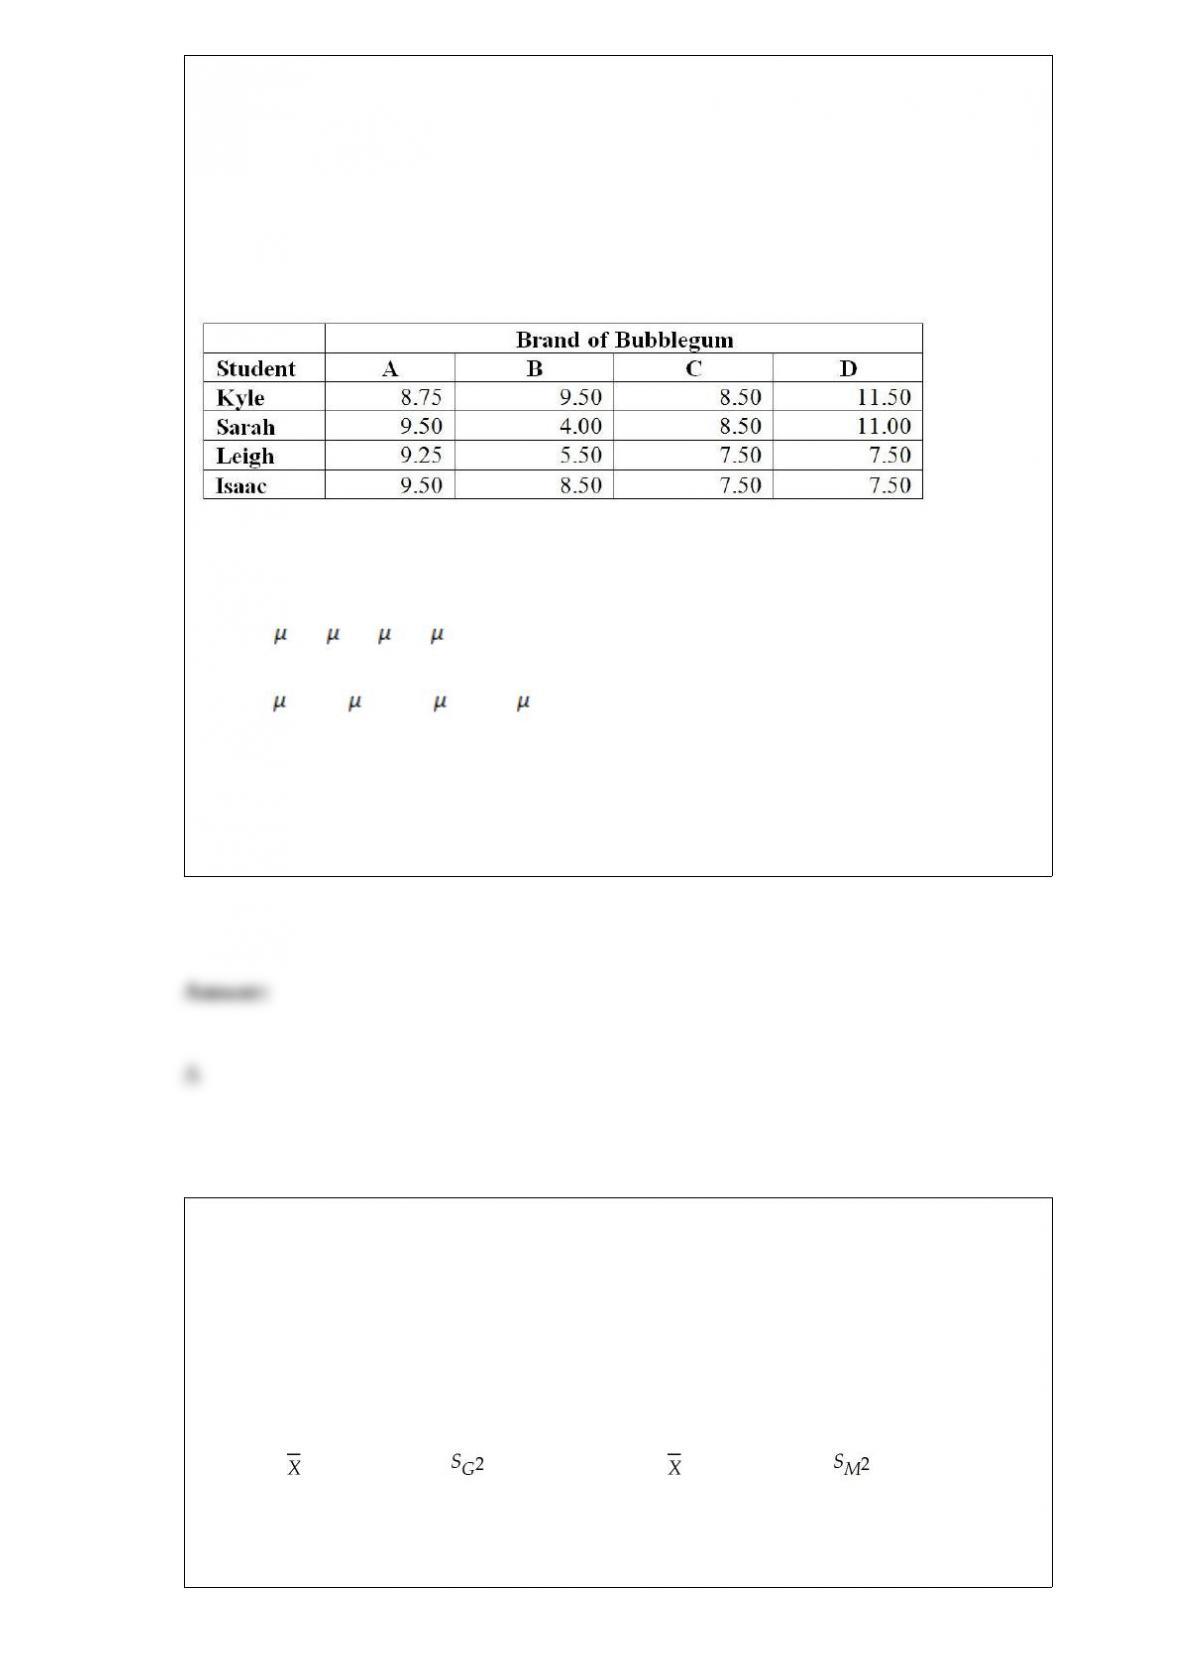
whether the brand of bubblegum used affected the size of bubbles they could blow. To
reduce the person-to-person variability, the students decided to use a randomized block
design using themselves as blocks.
Four brands of bubblegum were tested. A student chewed two pieces of a brand of gum
and then blew a bubble, attempting to make it as big as possible. Another student
measured the diameter of the bubble at its biggest point. The following table gives the
diameters of the bubbles (in inches) for the 16 observations.
Referring to Table 11-11, the null hypothesis for the randomized block F test for the
difference in the means is
A) H0 : A = B = C = D
B) H0 : Kyle = Sarah = Leigh = Isaac
C) H0 : MA = MB = MC = MD
D) H0 : MKyle= MSarah = MLeigh = MIsaac
TABLE 10-3
A real estate company is interested in testing whether the mean time that families in
Gotham have been living in their current homes is less than families in Metropolis.
Assume that the two population variances are equal. A random sample of 100 families
from Gotham and a random sample of 150 families in Metropolis yield the following
data on length of residence in current homes.
Gotham: G = 35 months, = 900 Metropolis: M = 50 months, = 1050
Referring to Table 10-3, which of the following represents the relevant hypotheses
tested by the real estate company?
A) H0 : G – M 0 versus H1 : G – M < 0
B) H0 : G – M 0 versus H1 : G – M > 0
C) H0 : G – M = 0 versus H1 : G – M ≠0
D) H0 : G – M 0 versus H1 : G – M < 0
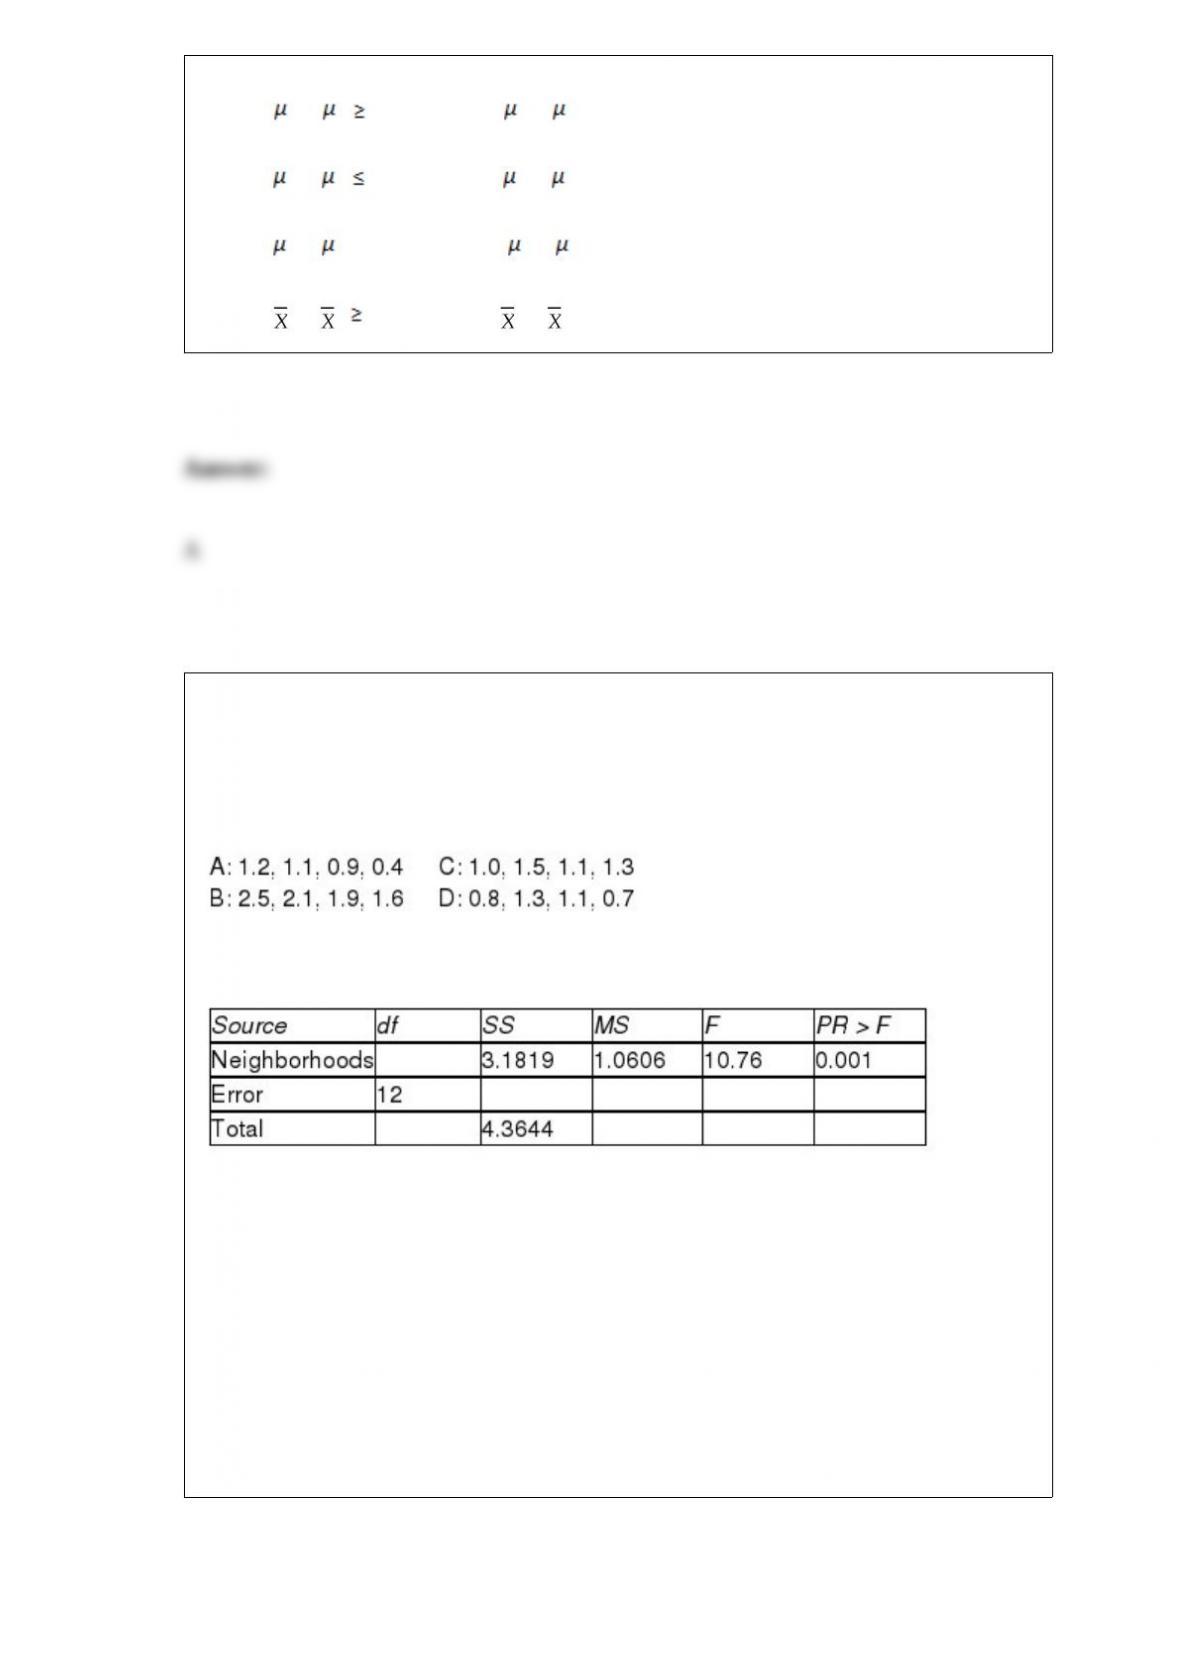
TABLE 11-2
A realtor wants to compare the mean sales-to-appraisal ratios of residential properties
sold in four neighborhoods (A, B, C, and D). Four properties are randomly selected
from each neighborhood and the ratios recorded for each, as shown below.
Interpret the results of the analysis summarized in the following table:
Referring to Table 11-2, the p-value of the test statistic for Levene’s test for
homogeneity of variances is
A) 0.25.
B) 0.64.
C) 0.86.
D) 3.49.

The standard error of the mean for a sample of 100 is 30. In order to cut the standard
error of the mean to 15, we would
A) increase the sample size to 200.
B) increase the sample size to 400.
C) decrease the sample size to 50.
D) decrease the sample size to 25.
An agronomist wants to compare the crop yield of 3 varieties of chickpea seeds. She
plants all 3 varieties of the seeds on each of 5 different patches of fields. She then
measures the crop yield in bushels per acre. Which of the following tests will be the
most appropriate to find out whether using different patches is advantageous in
reducing the random error?
A) One-way ANOVA F test for differences among more than two means
B) Randomized block F test for differences among more than two means
C) Randomized block F test for block effect
D) Two-way ANOVA F test for the variety effect

Suppose that past history shows that 60% of college students prefer Brand C cola. A
sample of 5 students is to be selected. The average number that you would expect to
prefer brand C is ________.
The t test for the mean difference between 2 related populations assumes that the
A) population sizes are equal.
B) sample variances are equal.
C) population of differences is approximately normal or sample sizes are large enough.
D) All of the above.
If two events are mutually exclusive and collectively exhaustive, what is the probability
that one or the other occurs?
A) 0
B) 0.50
C) 1.00
D) Cannot be determined from the information given.
All the events in the sample space that are not part of the specified event are called
A) simple events.
B) joint events.
C) the sample space.
D) the complement of the event.
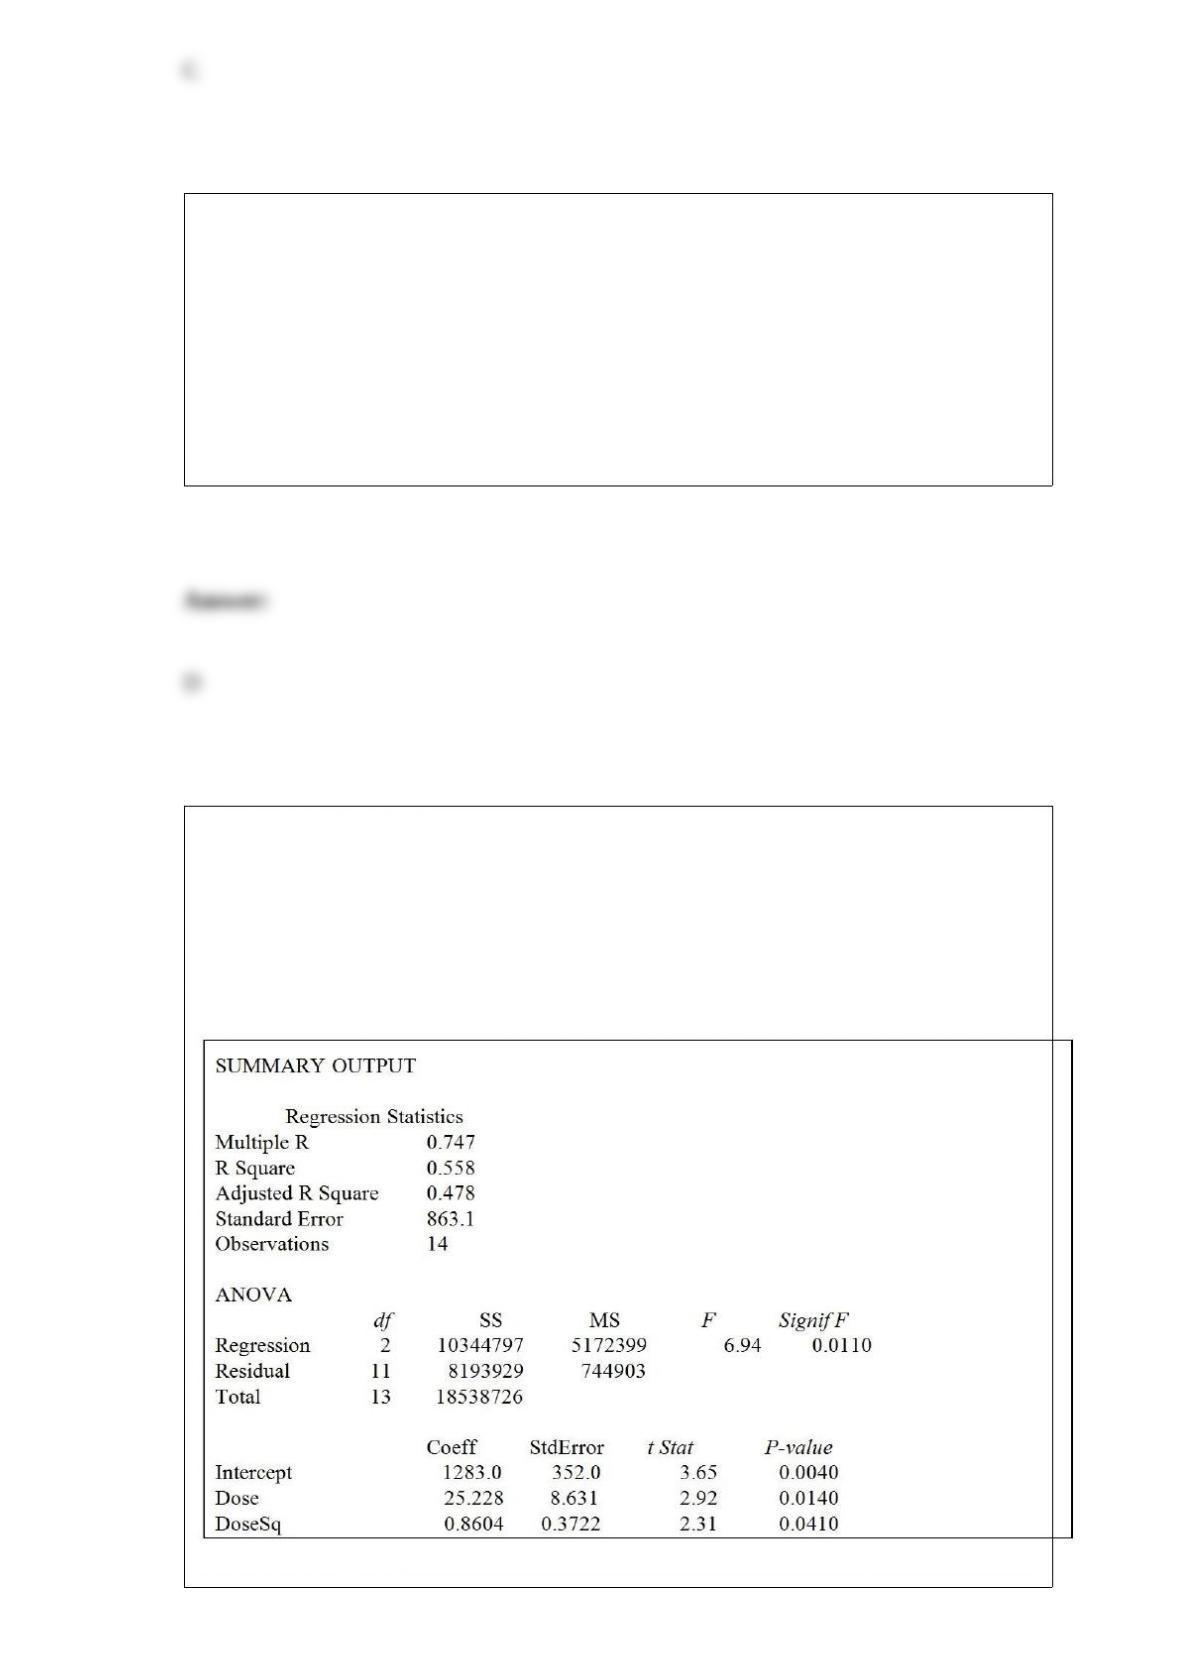
TABLE 15-3
A chemist employed by a pharmaceutical firm has developed a muscle relaxant. She
took a sample of 14 people suffering from extreme muscle constriction. She gave each a
vial containing a dose (X) of the drug and recorded the time to relief (Y) measured in
seconds for each. She fit a curvilinear model to this data. The results obtained by
Microsoft Excel follow
True or False: Referring to Table 15-3, suppose the chemist decides to use a t test to

determine if the linear term is significant. Using a level of significance of 0.05, she
would decide that the linear term is significant.
What type of probability distribution will most likely be used to analyze the number of
blue chocolate chips per bag in the following problem?
The quality control manager of a candy plant is inspecting a batch of chocolate chip
bags. When the production process is in control, the average number of blue chocolate
chips per bag is 6.0. The manager is interested in analyzing the probability that any
particular bag being inspected has fewer than 5.0 blue chocolate chips.
A) Binomial distribution
B) Poisson distribution
C) Hypergeometric distribution
D) None of the above
For a given sample size n, if the level of significance ( ) is decreased, the power of the
test
A) will increase.
B) will decrease.
C) will remain the same.
D) cannot be determined.

TABLE 5-8
Two different designs on a new line of winter jackets for the coming winter are
available for your manufacturing plants. Your profit (in thousands of dollars) will
depend on the taste of the consumers when winter arrives. The probability of the three
possible different tastes of the consumers and the corresponding profits are presented in
the following table.
Referring to Table 5-8, if you decide to choose Design A for 90% of the production
lines and Design B for the remaining production lines, what is the risk of your
investment?
TABLE 17-3
A financial analyst wanted to examine the relationship between salary (in $1,000) and 4
variables: age (X1 = Age), experience in the field (X2 = Exper), number of degrees (X3 =
Degrees), and number of previous jobs in the field (X4 = Prevjobs). He took a sample of
20 employees and obtained the following Microsoft Excel output:
SUMMARY OUTPUT
Regression Statistics
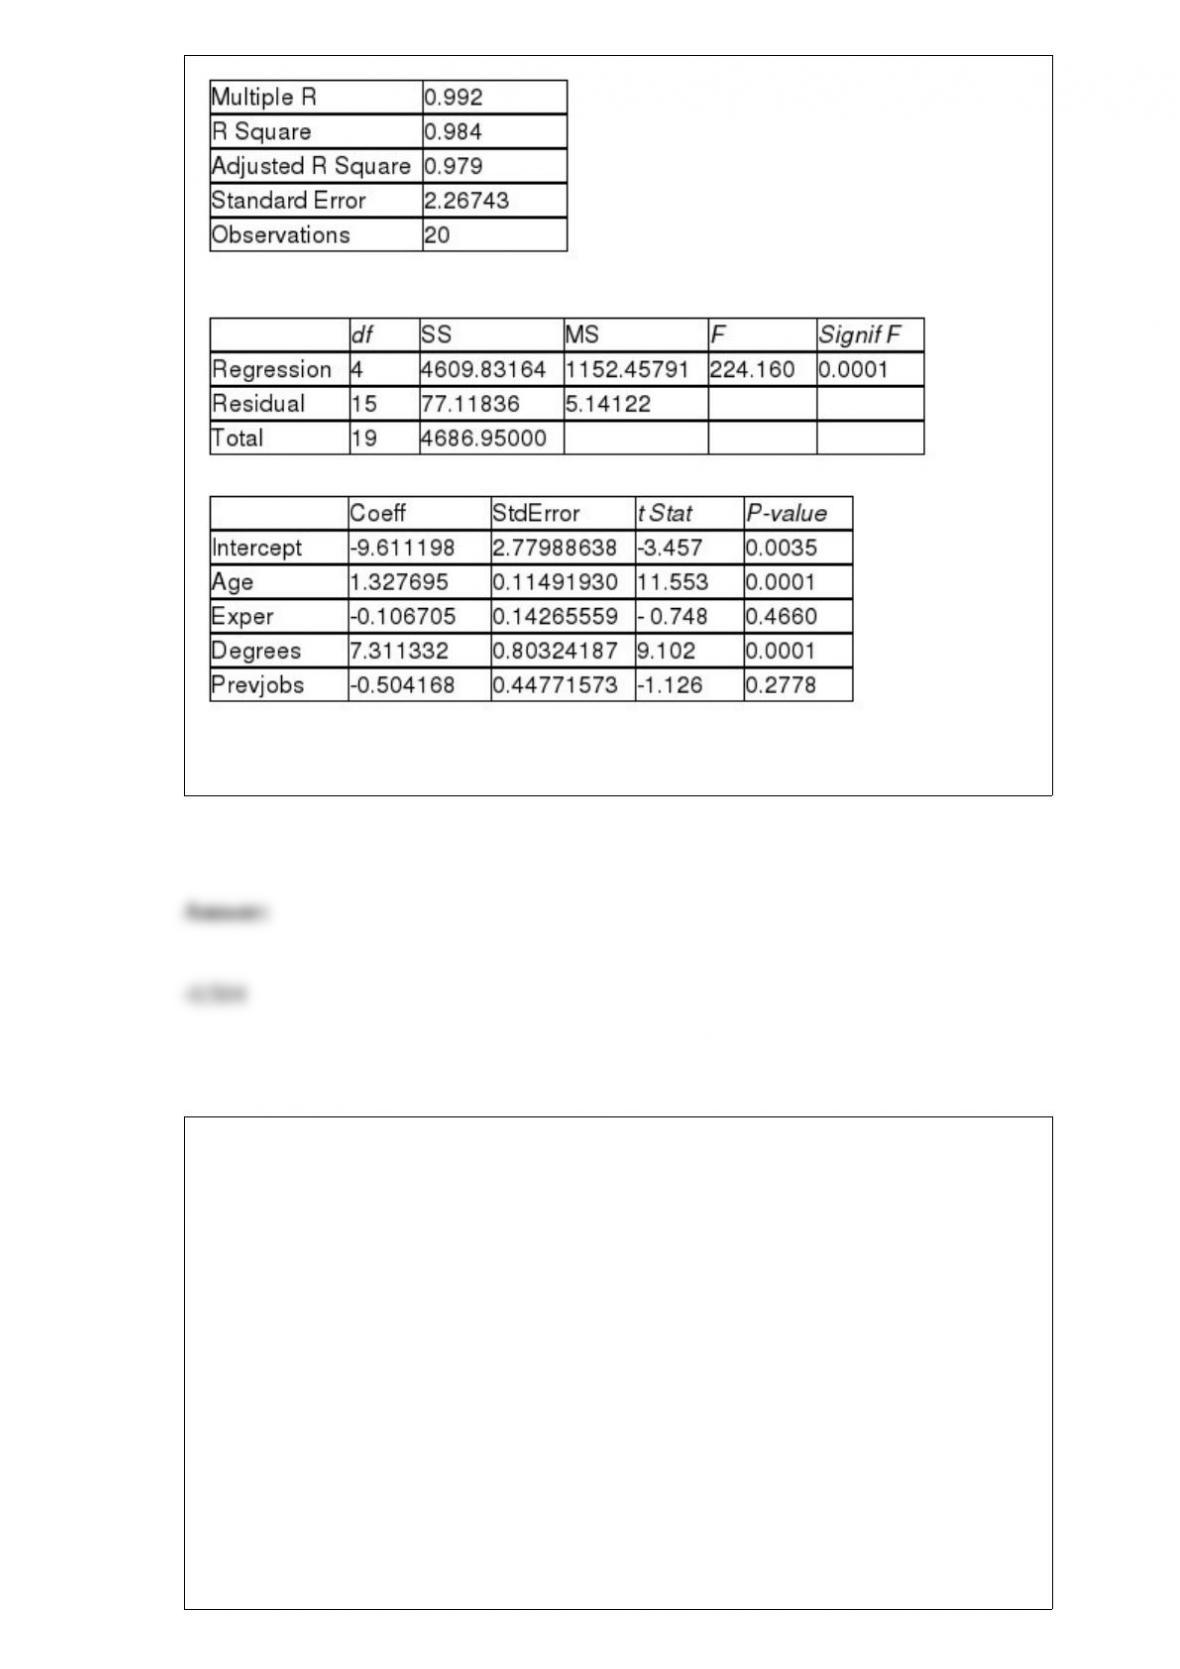
ANOVA
Referring to Table 17-3, the estimate of the unit change in the mean of Y per unit
change in X4, taking into account the effects of the other 3 variables, is ________.
Referring to Table 14-16, what is the p-value of the test statistic to
determine whether being a sedan or not makes a signiticant
contribution to the regression model in the presence of the other
independent variable at a 5% level of signiticance?
TABLE 14-16
What are the factors that determine the acceleration time (in sec.)
from 0 to 60 miles per hour of a car? Data on the following variables
for 30 different vehicle models were collected:
Y (Accel Time): Acceleration time in sec.
X1 (Engine Size): c.c.
X2 (Sedan): 1 if the vehicle model is a sedan and 0 otherwise
The regression results using acceleration time as the dependent

variable and the remaining variables as the independent variables are
presented below.
The various residual plots are as shown below.

The coefficient of partial determinations and are 0.3301,
and 0.0594, respectively.
The coefficient of determination for the regression model using each
of the 2 independent variables as the dependent variable and the
other independent variable as independent variables ( ) are,
respectively 0.0077, and 0.0077.

Referring to Table 14-18, what is the p-value of the test statistic when
testing whether SAT makes a signiticant contribution to the model in
the presence of Toe90?
TABLE 14-18
A logistic regression model was estimated in order to predict the
probability that a randomly chosen university or college would be a
private university using information on mean total Scholastic Aptitude
Test score (SAT) at the university or college and whether the TOEFL
criterion is at least 90 (Toe90 = 1 if yes, 0 otherwise). The
dependent variable, Y, is school type (Type = 1 if private and 0
otherwise).
The PHStat output is given below:
TABLE 2-14
The table below contains the number of people who own a portable Blu-ray player in a
sample of 600 broken down by gender.
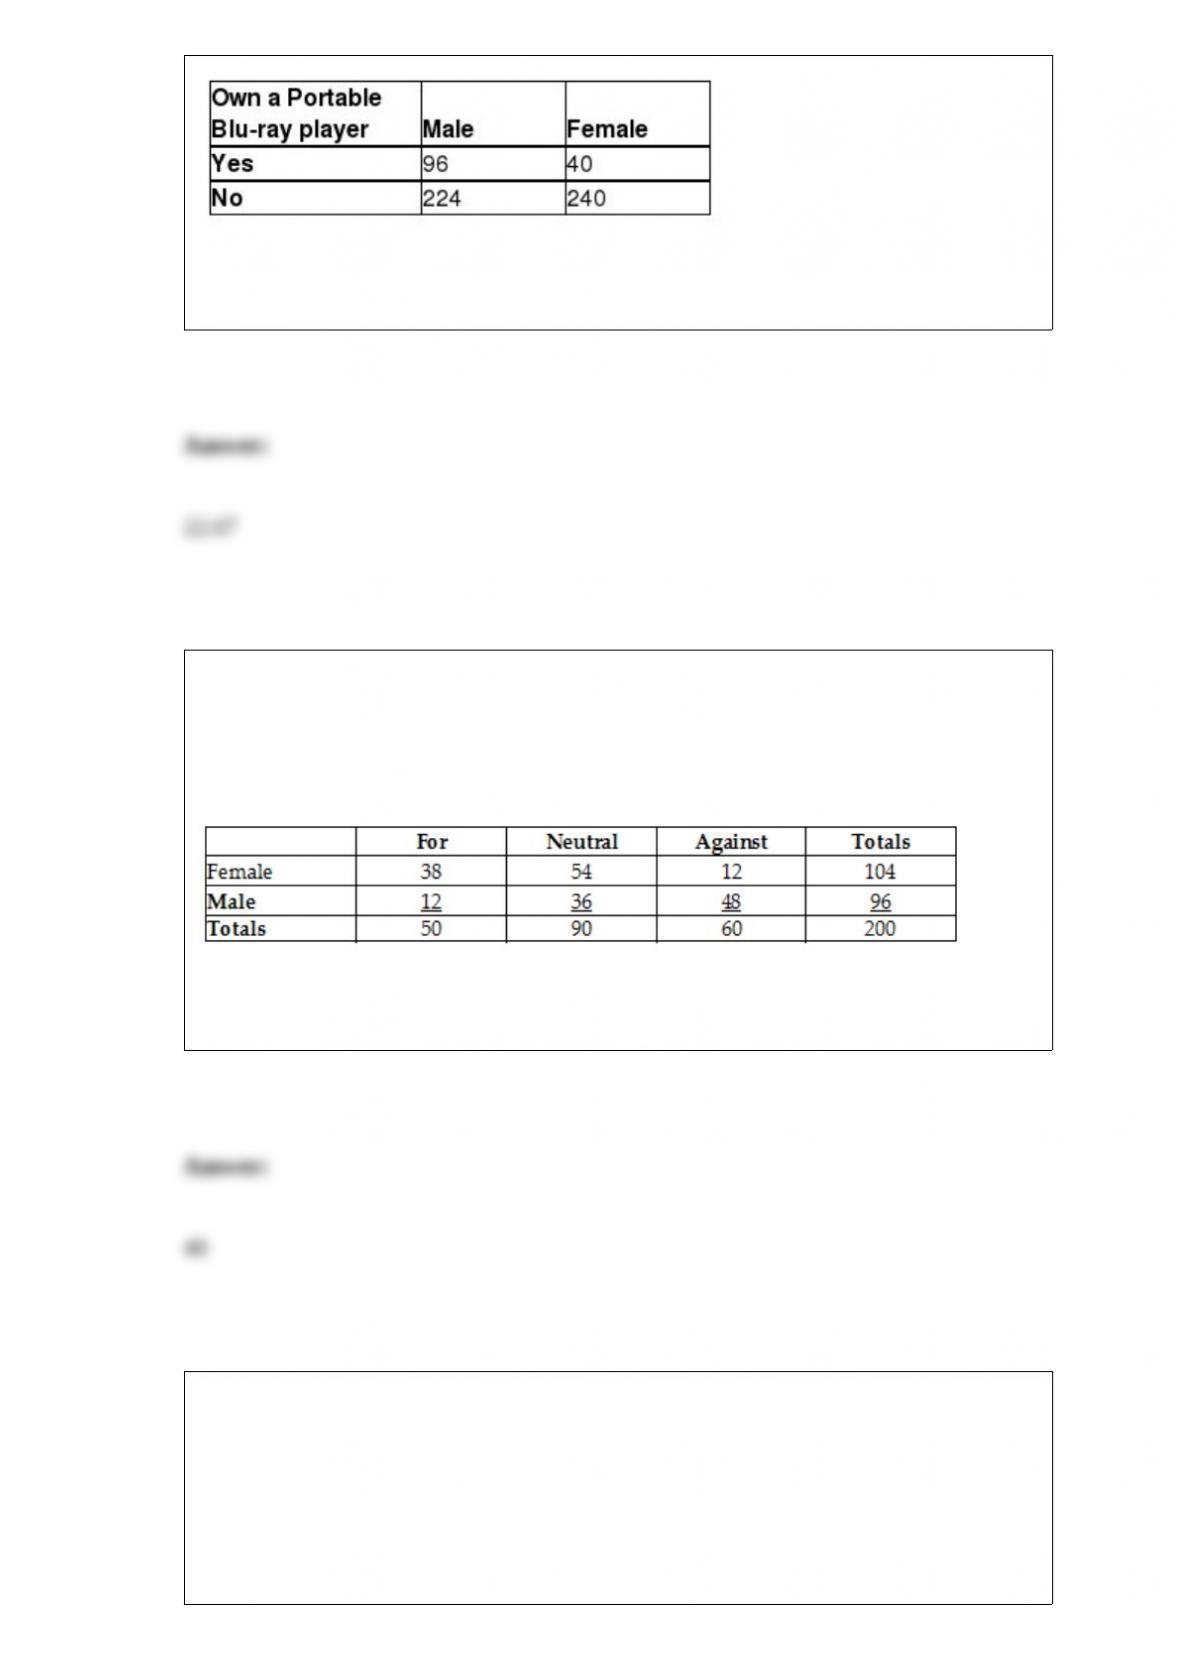
Referring to Table 2-14, if the sample is a good representation of the population, we can
expect ________ percent of the population will own a portable Blu-ray player.
TABLE 2-12
The table below contains the opinions of a sample of 200 people broken down by
gender about the latest congressional plan to eliminate anti-trust exemptions for
professional baseball.
Referring to Table 2-12, if the sample is a good representation of the population, we can
expect ________ percent of the population will be males.
TABLE 10-7
A buyer for a manufacturing plant suspects that his primary supplier of raw materials is
overcharging. In order to determine if his suspicion is correct, he contacts a second
supplier and asks for the prices on various identical materials. He wants to compare
these prices with those of his primary supplier. The data collected is presented in the
table below, with some summary statistics presented (all of these might not be
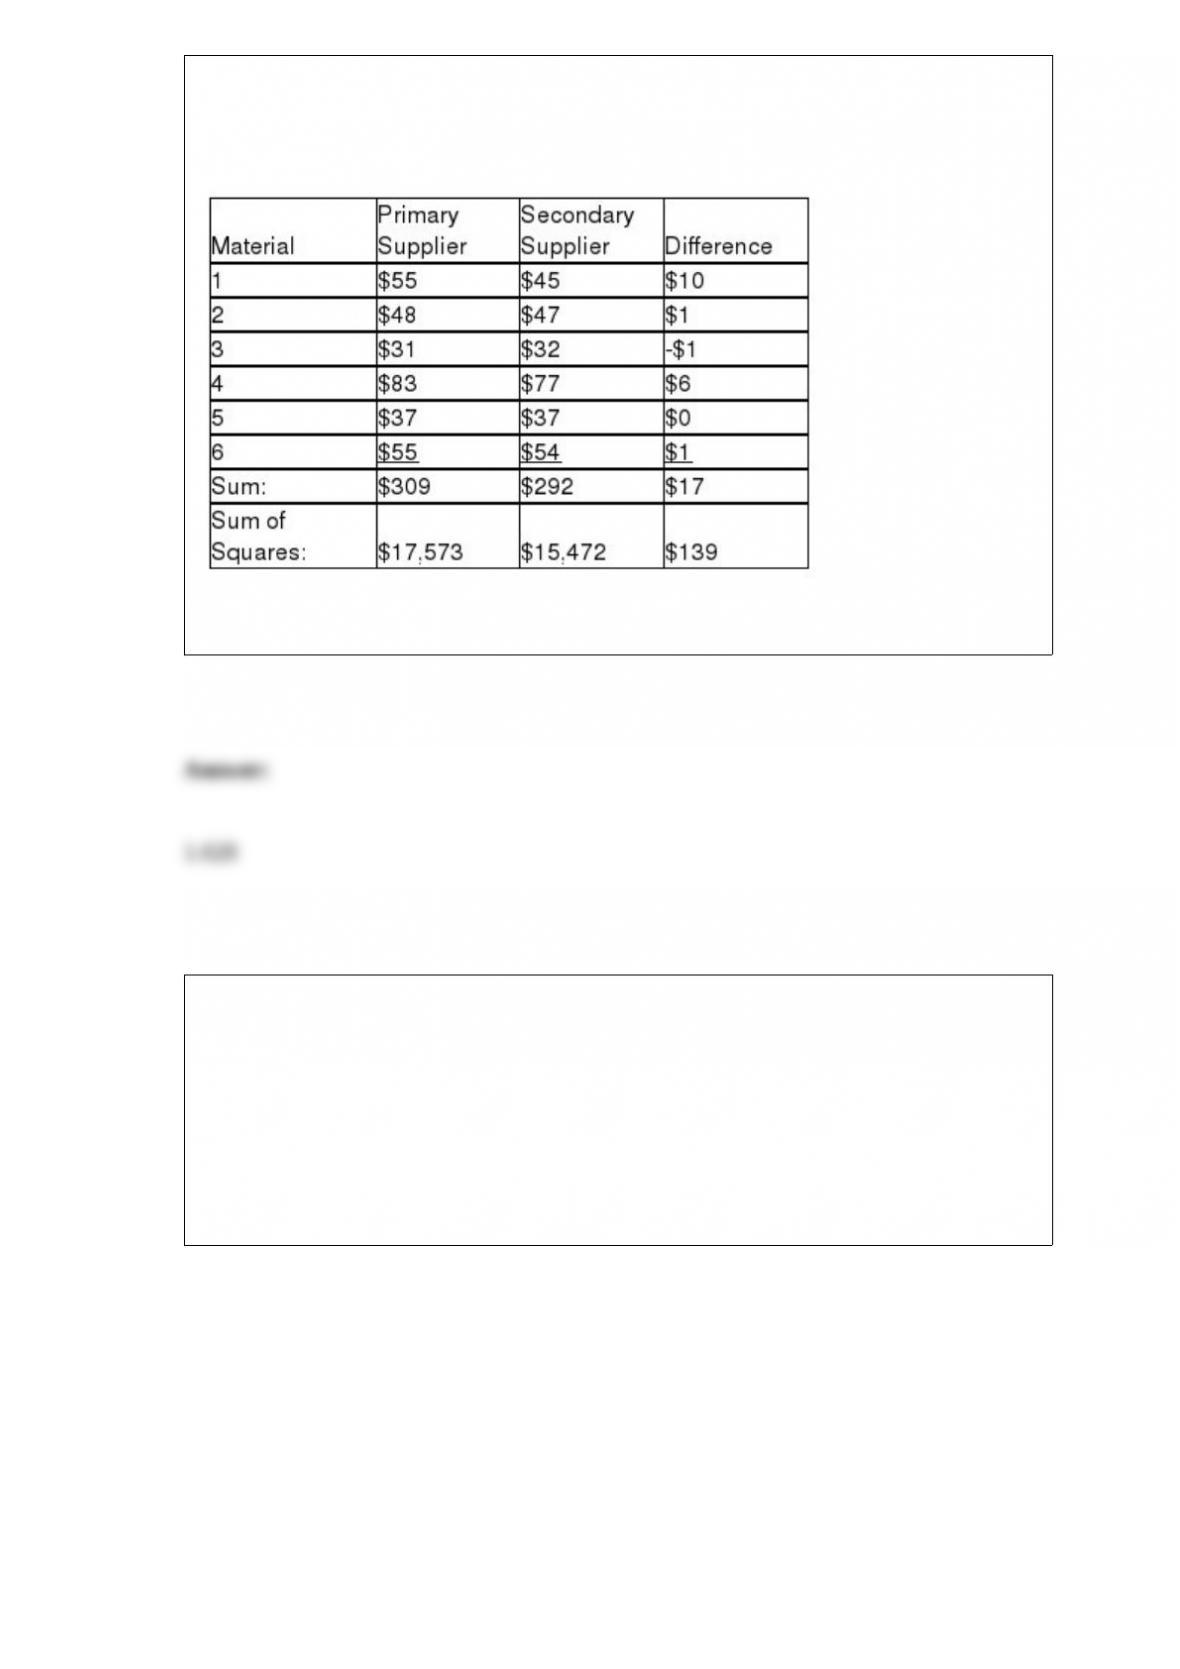
necessary to answer the questions which follow). The buyer believes that the
differences are normally distributed and will use this sample to perform an appropriate
test at a level of significance of 0.01.
Referring to Table 10-7, the calculated value of the test statistic is ________.
TABLE 17-8
The superintendent of a school district wanted to predict the percentage of students
passing a sixth-grade proficiency test. She obtained the data on percentage of students
passing the proficiency test (% Passing), daily mean of the percentage of students
attending class (% Attendance), mean teacher salary in dollars (Salaries), and
instructional spending per pupil in dollars (Spending) of 47 schools in the state.
Following is the multiple regression output with Y = % Passing as the dependent
variable, X1 = % Attendance, X2 = Salaries and X3 = Spending:
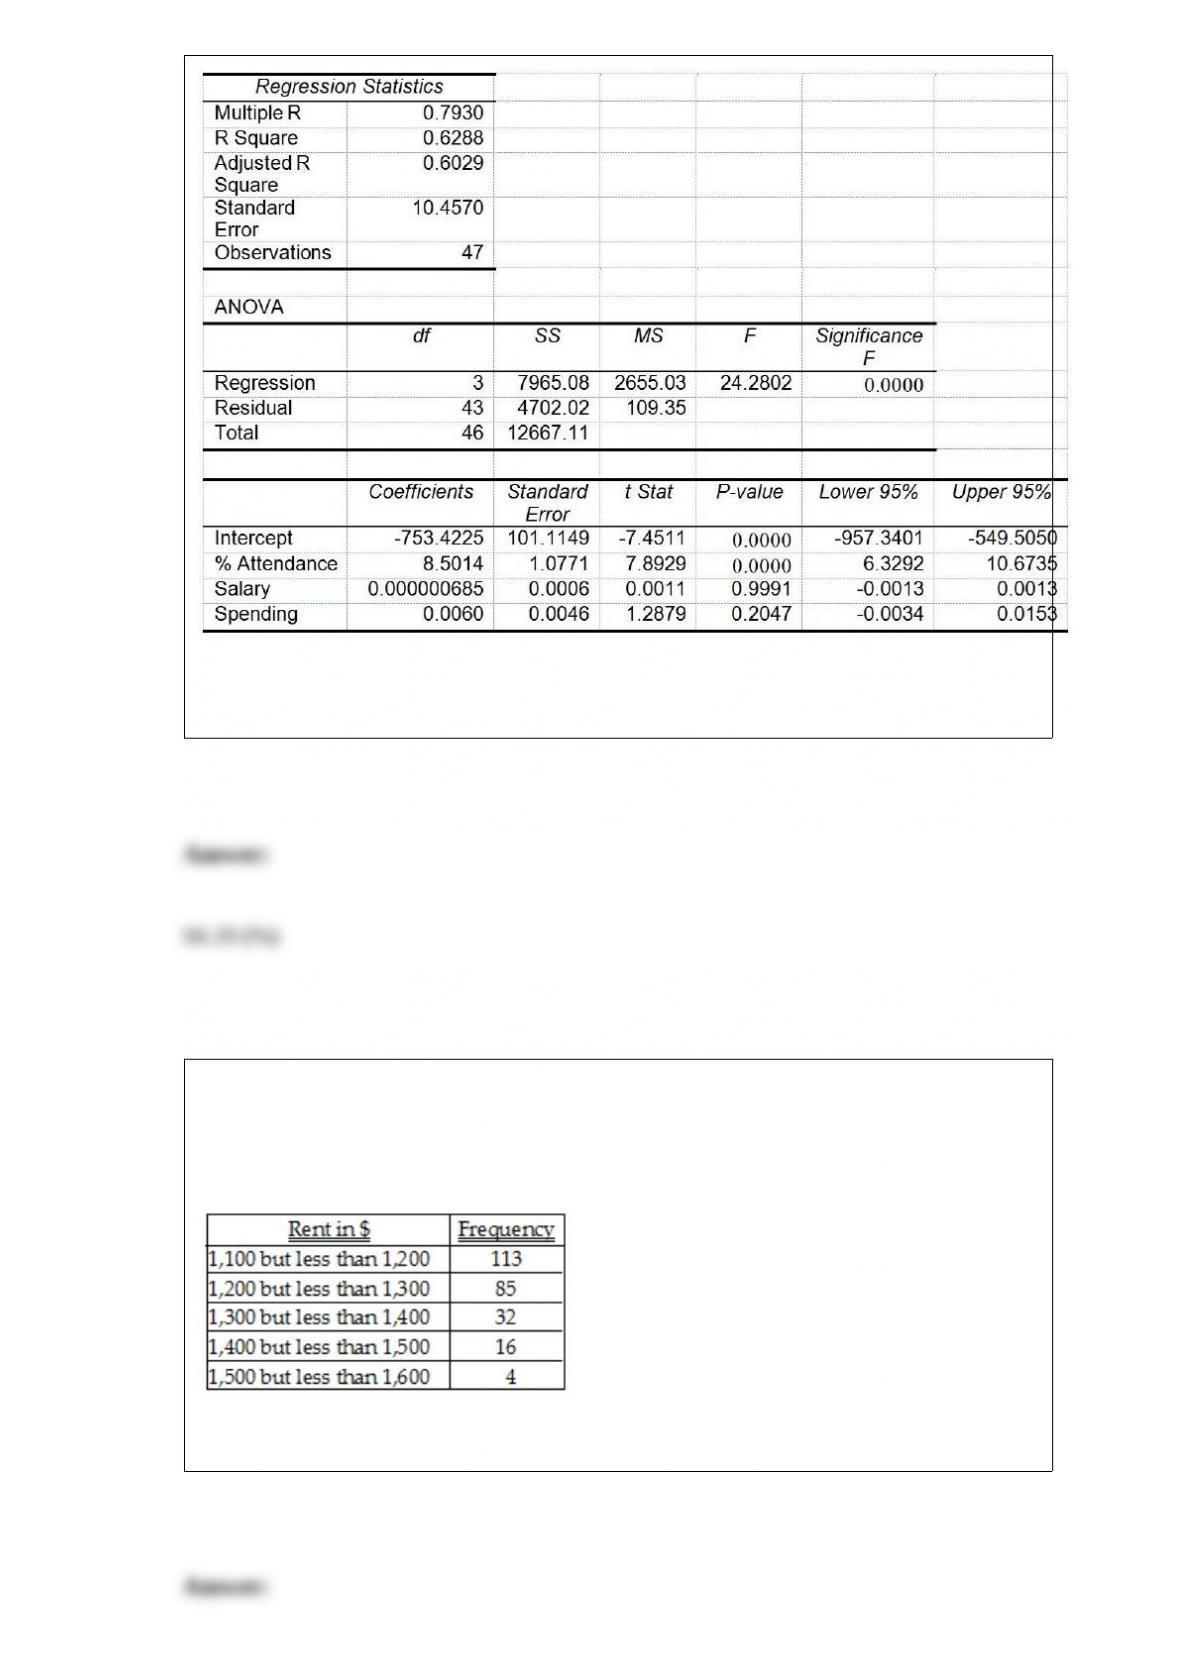
Referring to Table 17-8, predict the percentage of students passing the proficiency test
for a school which has a daily mean of 95% of students attending class, a mean teacher
salary of 40,000 dollars, and an instructional spending per pupil of 2,000 dollars.
TABLE 2-9
The frequency distribution below represents the rents of 250 randomly selected
federally subsidized apartments in a small town.
Referring to Table 2-9, ________ of the apartments rented for $1,400 or more.