True or False: The original data values cannot be determined once they are grouped into
a frequency distribution table.
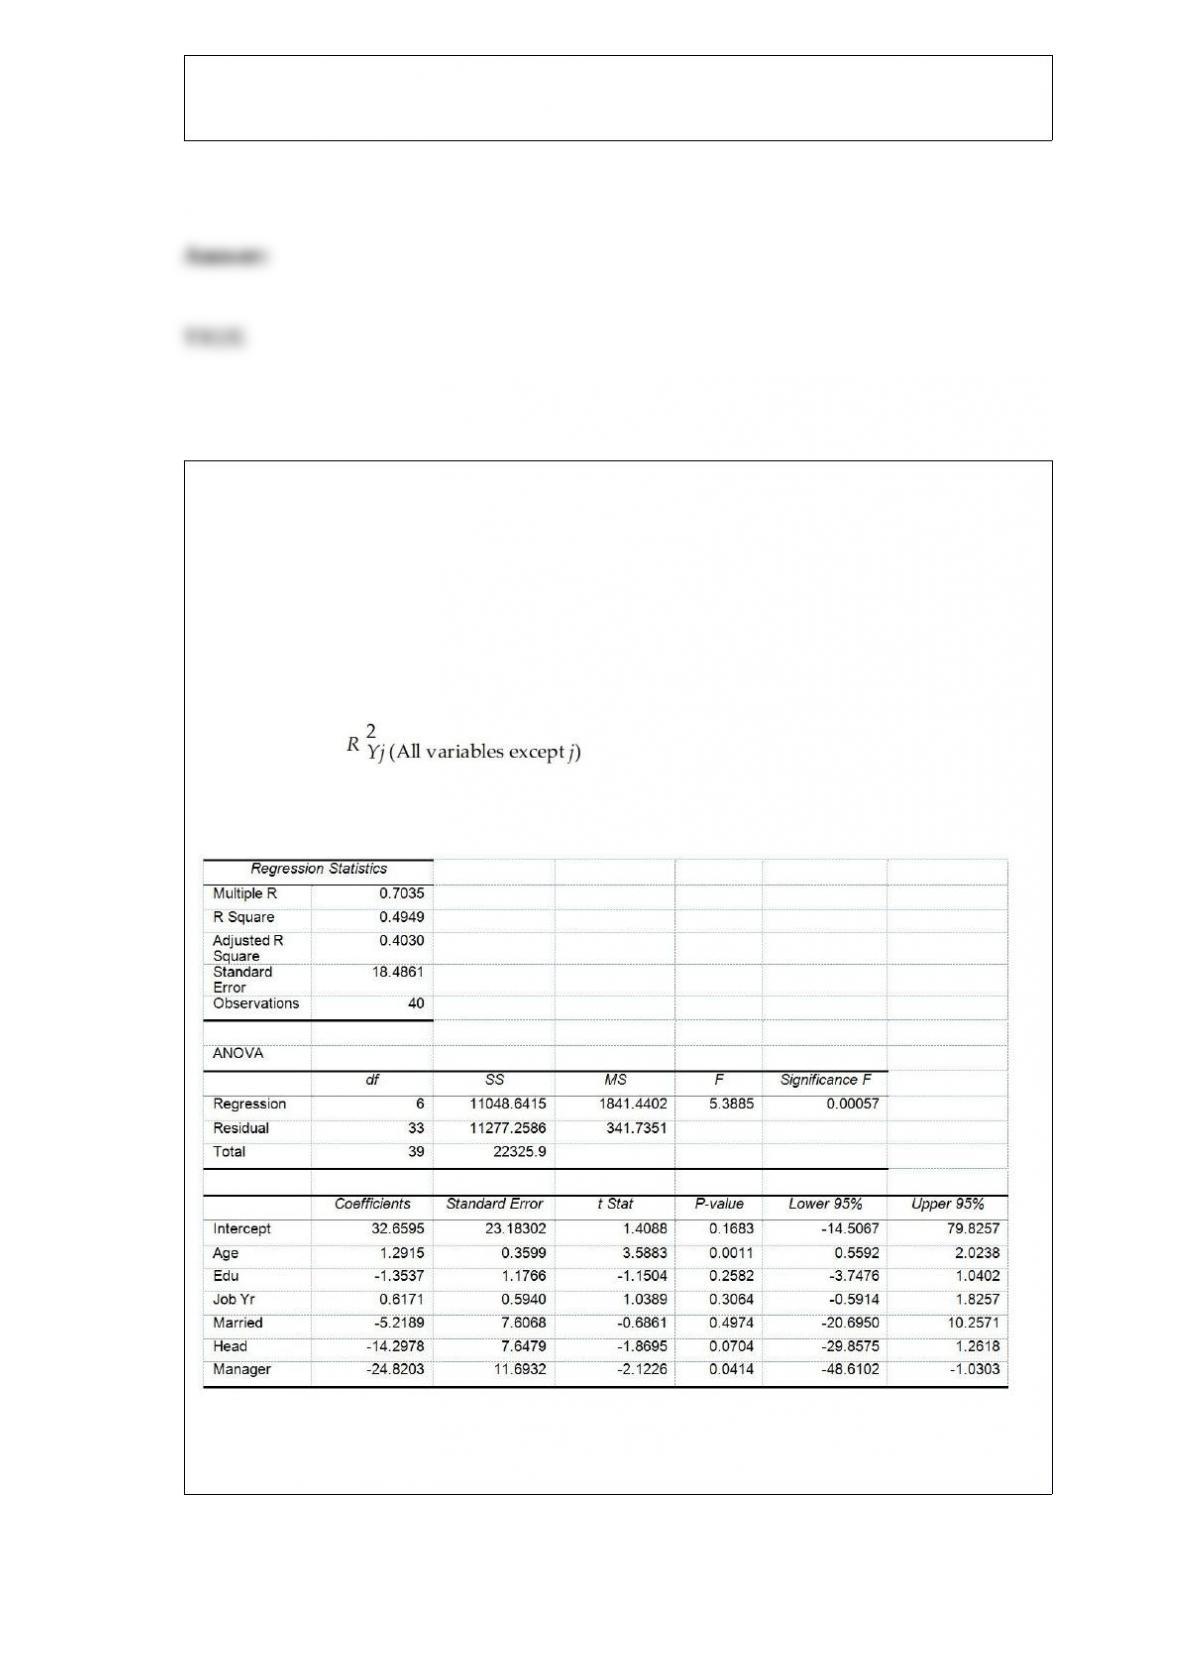
True or False: TABLE 17-10
Given below are results from the regression analysis where the dependent variable is
the number of weeks a worker is unemployed due to a layoff (Unemploy) and the
independent variables are the age of the worker (Age), the number of years of education
received (Edu), the number of years at the previous job (Job Yr), a dummy variable for
marital status (Married: 1 = married, 0 = otherwise), a dummy variable for head of
household (Head: 1 = yes, 0 = no) and a dummy variable for management position
(Manager: 1 = yes, 0 = no). We shall call this Model 1. The coefficient of partial
determination ( ) of each of the 6 predictors are, respectively,
0.2807, 0.0386, 0.0317, 0.0141, 0.0958, and 0.1201.
Model 2 is the regression analysis where the dependent variable is Unemploy and the
independent variables are Age and Manager. The results of the regression analysis are
given below:
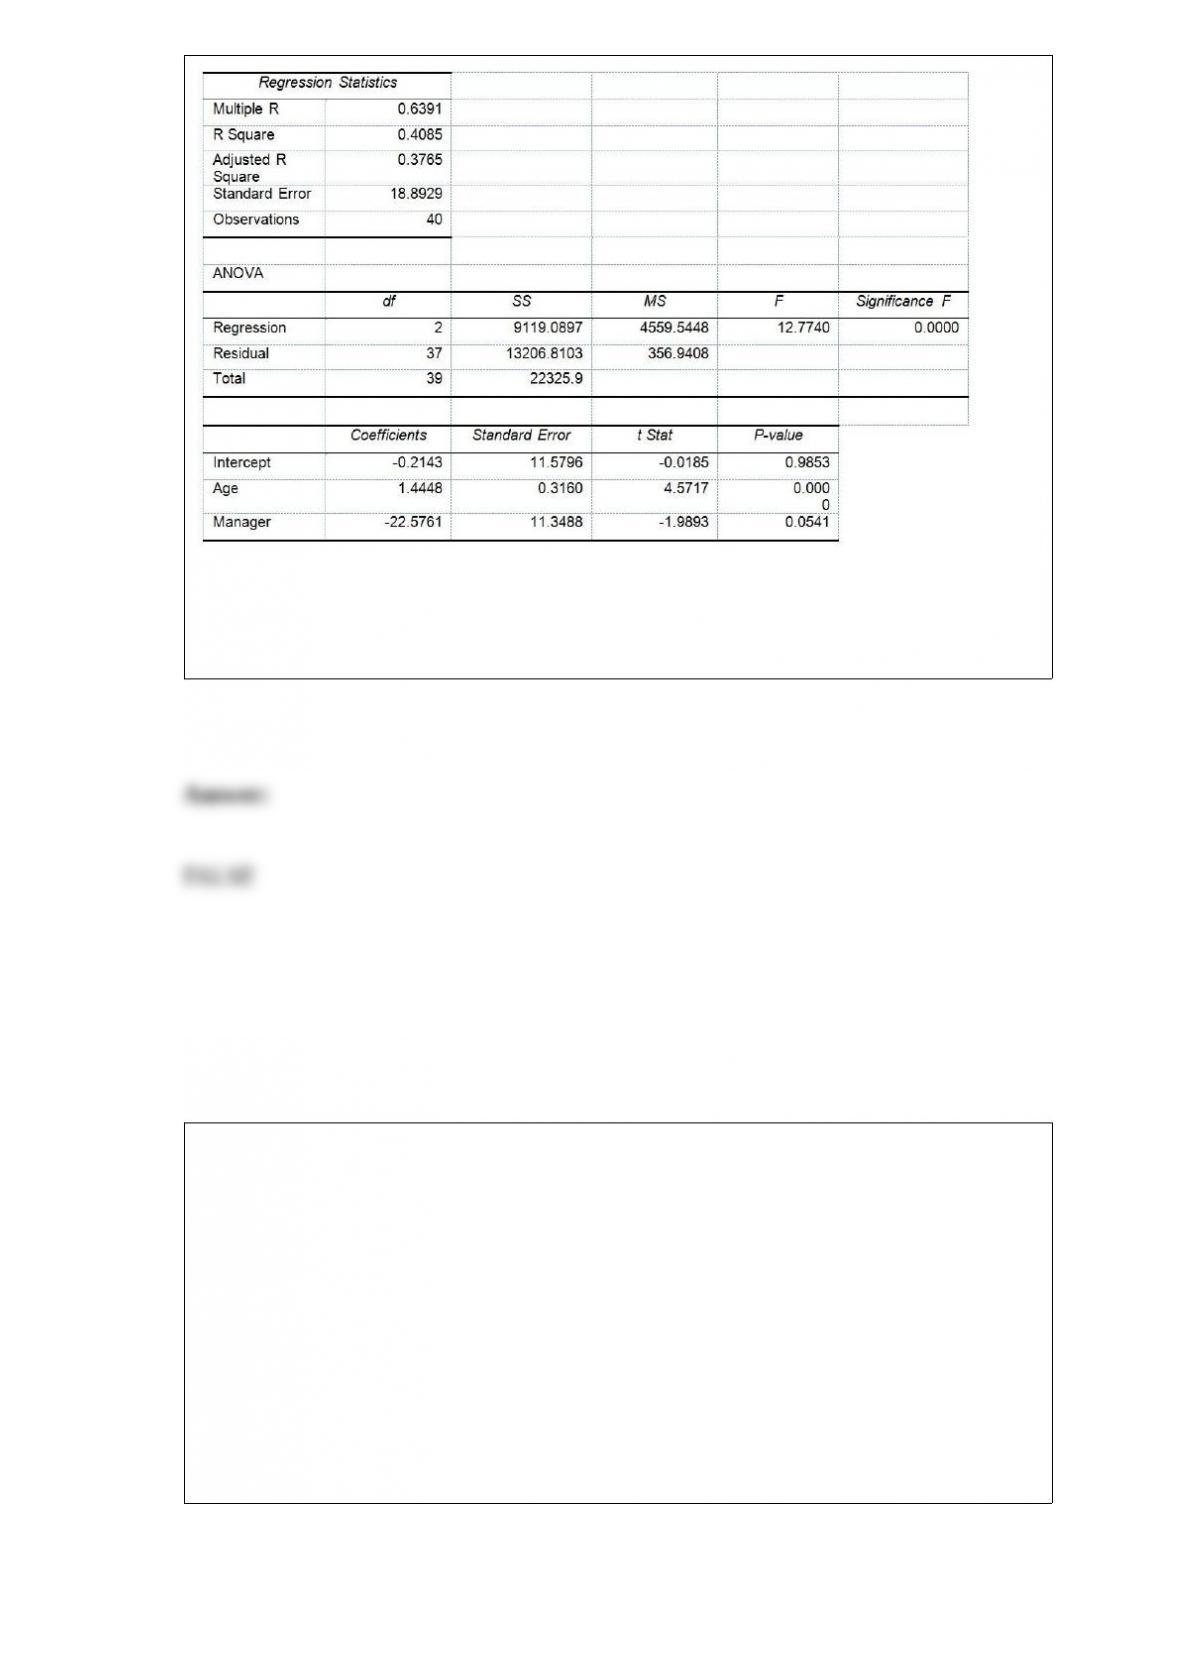
Referring to Table 17-10 and using both Model 1 and Model 2, there is sufficient
evidence to conclude that the independent variables that are not significant individually
are also not significant as a group in explaining the variation in the dependent variable
at a 5% level of significance.
TABLE 8-10
A sales and marketing management magazine conducted a survey on salespeople
cheating on their expense reports and other unethical conduct. In the survey on 200
managers, 58% of the managers have caught salespeople cheating on an expense report,
50% have caught salespeople working a second job on company time, 22% have caught
salespeople listing a ‘strip bar” as a restaurant on an expense report, and 19% have
caught salespeople giving a kickback to a customer.
True or False: Referring to Table 8-10, it is possible that the 95% confidence interval
calculated from the data will not contain the sample proportion of managers who have
caught salespeople cheating on an expense report.
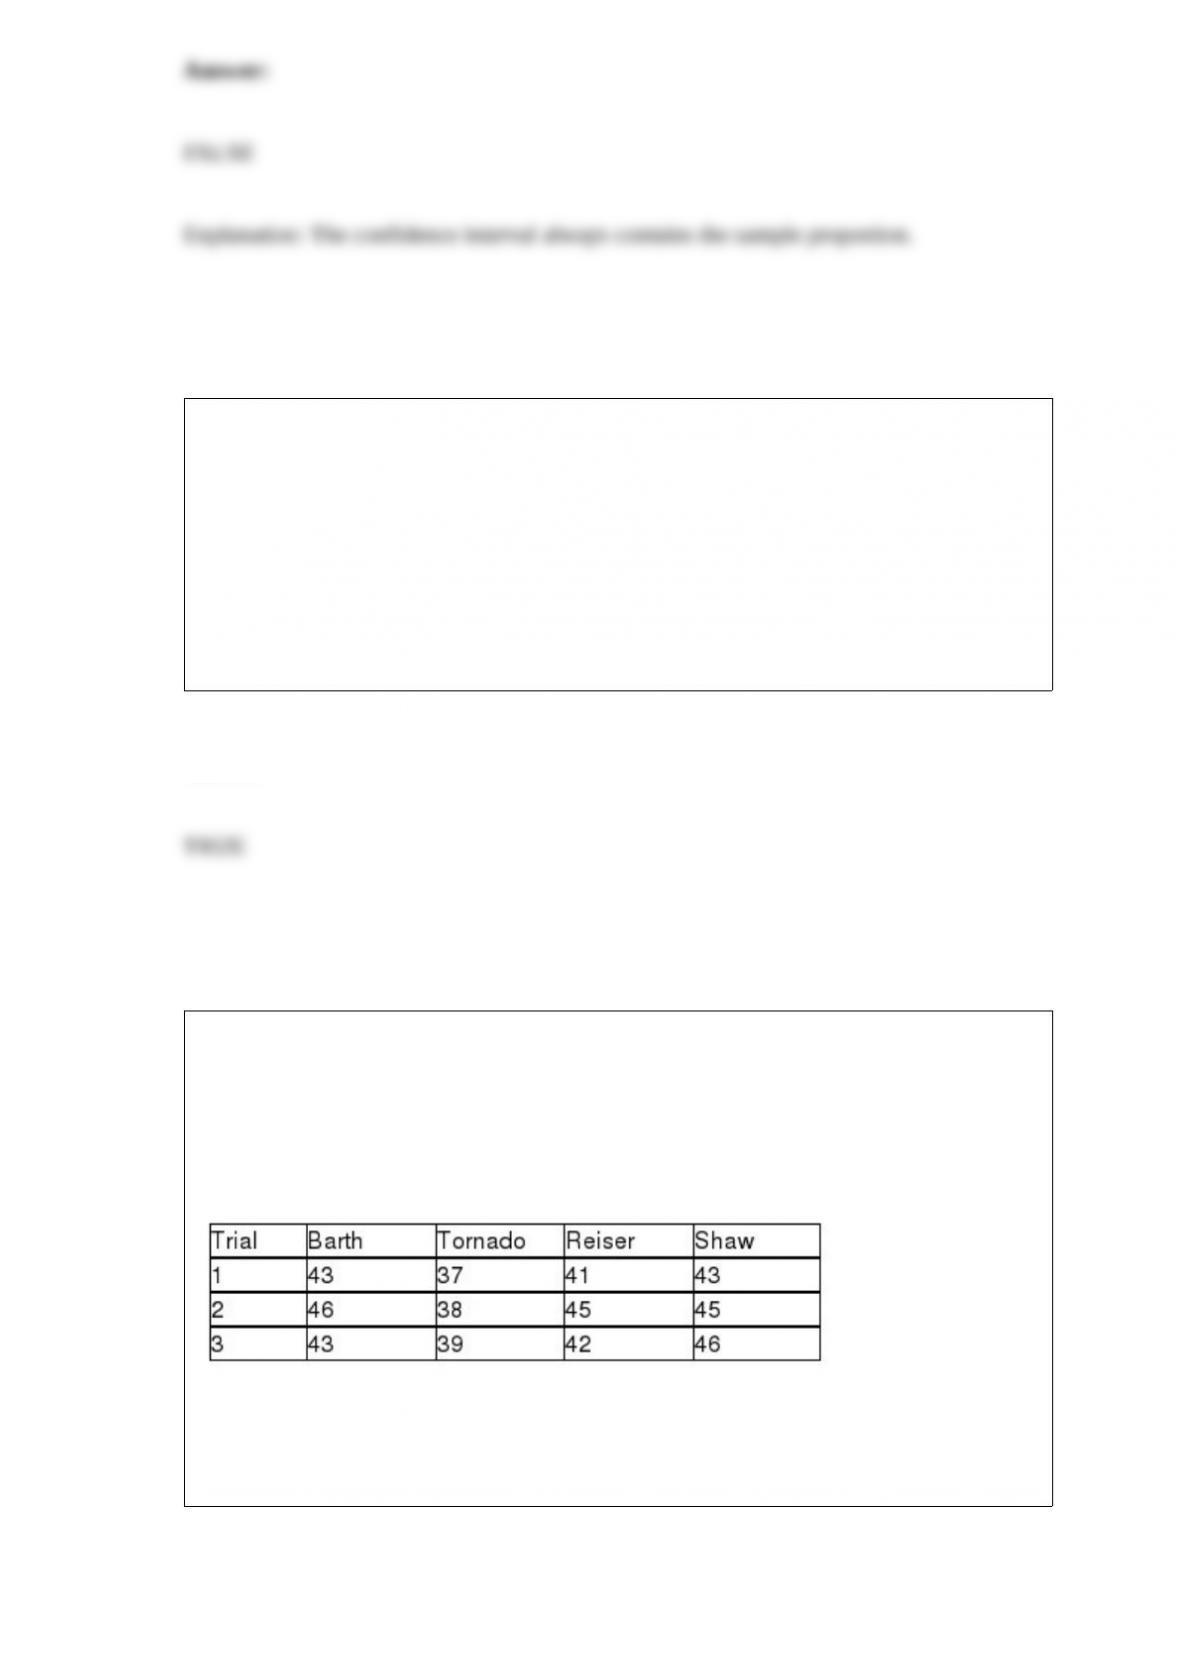
TABLE 8-6
After an extensive advertising campaign, the manager of a company wants to estimate
the proportion of potential customers that recognize a new product. She samples 120
potential consumers and finds that 54 recognize this product. She uses this sample
information to obtain a 95% confidence interval that goes from 0.36 to 0.54.
True or False: Referring to Table 8-6, it is possible that the true proportion of people
that recognize the product is not between 0.36 and 0.54.
TABLE 11-3
As part of an evaluation program, a sporting goods retailer wanted to compare the
downhill coasting speeds of 4 brands of bicycles. She took 3 of each brand and
determined their maximum downhill speeds. The results are presented in miles per hour
in the table below.
True or False: Referring to Table 11-3, based on the Tukey-Kramer procedure with an
overall level of significance of 0.05, the retailer would decide that the 3 means other
than the mean for Tornado are not significantly different from each other.

True or False: A convenience sample is a type of probability sample.
TABLE 8-12
A random sample of 100 stores from a large chain of 500 garden supply stores was
selected to determine the mean number of lawnmowers sold at an end-of-season
clearance sale. The sample results indicated a mean of 6 and a standard deviation of 2
lawnmowers sold. A 95% confidence interval (5.623 to 6.377) was established based on
these results.
True or False: Referring to Table 8-12, if the population had consisted of 1,000 stores,
the confidence interval estimate of the mean with finite population correction would
have been wider in range.
True or False: A sample is used to obtain a 95% confidence interval for the mean of a
population. The confidence interval goes from 15 to 19. If the same sample had been
used to test the null hypothesis that the mean of the population is equal to 20 versus the
alternative hypothesis that the mean of the population differs from 20, the null
hypothesis could be rejected at a level of significance of 0.05.
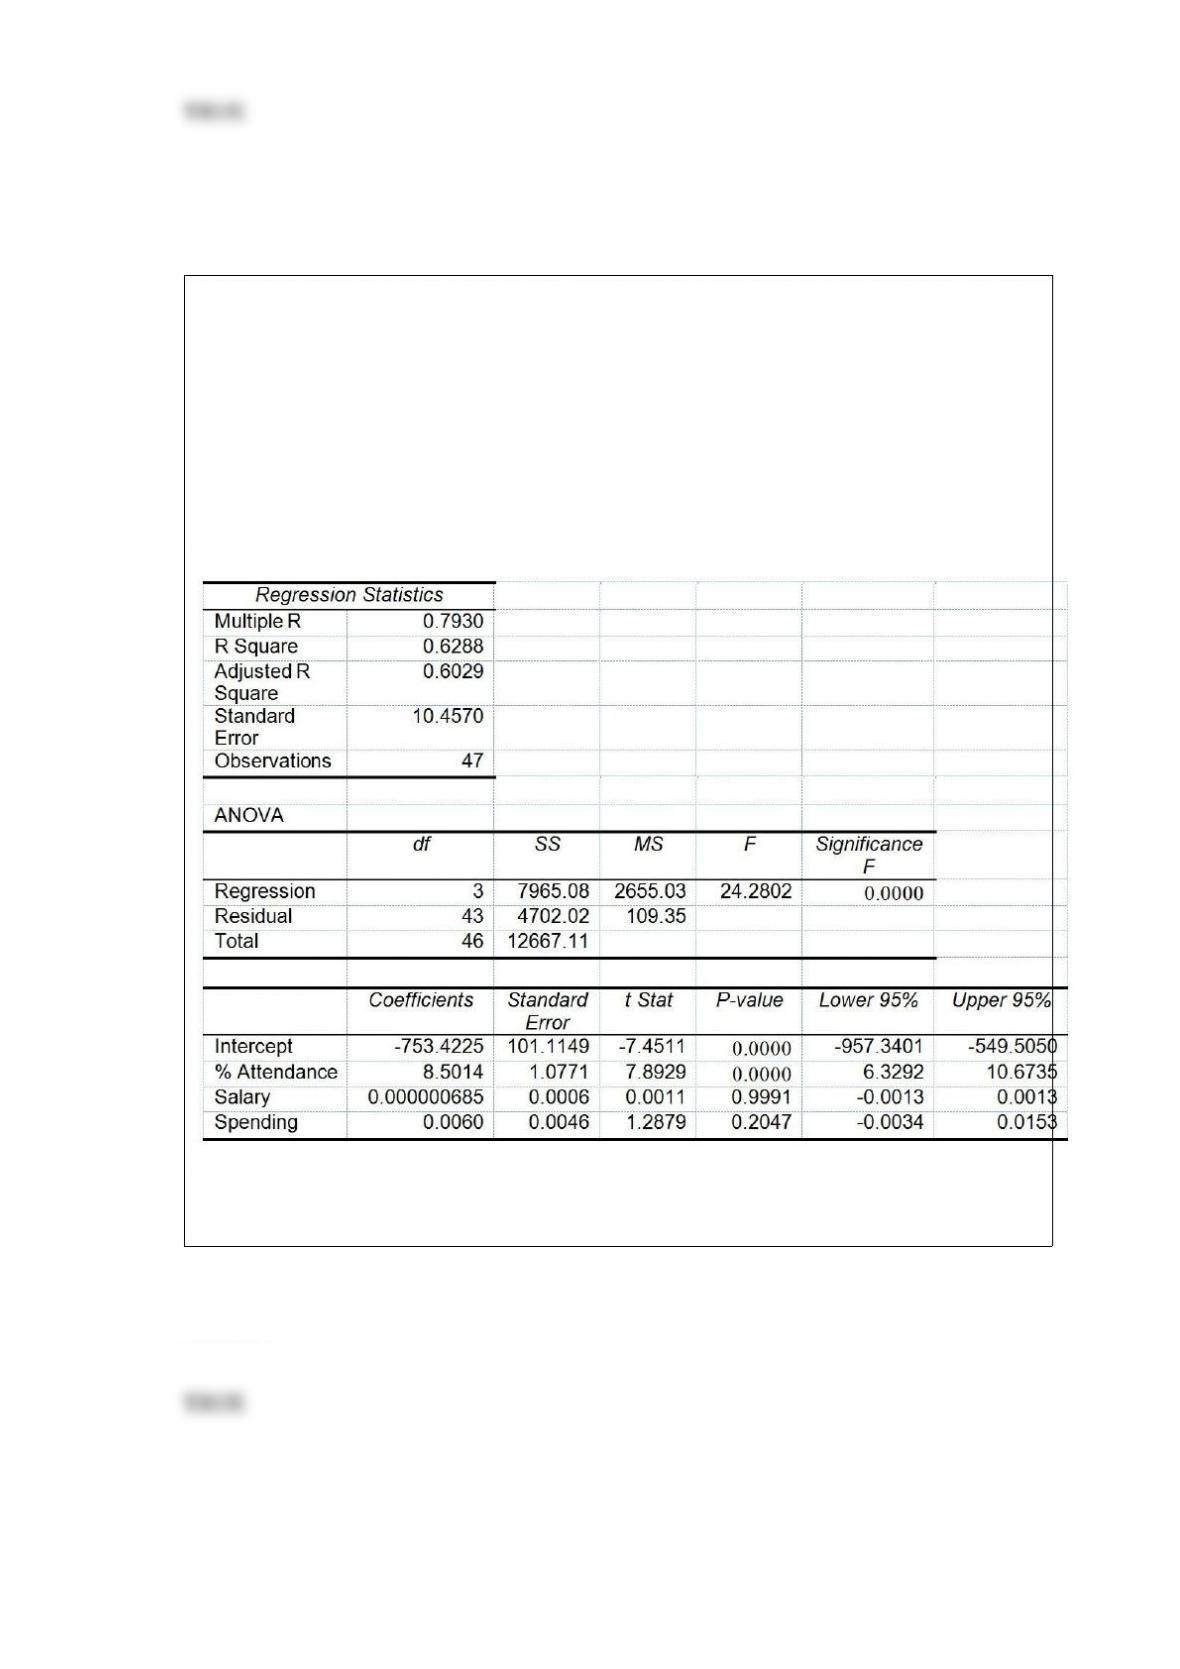
True or False: TABLE 17-8
The superintendent of a school district wanted to predict the percentage of students
passing a sixth-grade proficiency test. She obtained the data on percentage of students
passing the proficiency test (% Passing), daily mean of the percentage of students
attending class (% Attendance), mean teacher salary in dollars (Salaries), and
instructional spending per pupil in dollars (Spending) of 47 schools in the state.
Following is the multiple regression output with Y = % Passing as the dependent
variable, X1 = % Attendance, X2 = Salaries and X3 = Spending:
Referring to Table 17-8, there is sufficient evidence that at least one of the explanatory
variables is related to the percentage of students passing the proficiency test at a 5%
level of significance.

TABLE 8-9
A university wanted to find out the percentage of students who felt comfortable
reporting cheating by their fellow students. A survey of 2,800 students was conducted
and the students were asked if they felt comfortable reporting cheating by their fellow
students. The results were 1,344 answered “Yes” and 1,456 answered “No.”
True or False: Referring to Table 8-9, we are 99% confident that between 45.57% and
50.43% of the student population feel comfortable reporting cheating by their fellow
students.
True or False: If the data set is approximately bell-shaped, the empirical rule will more
accurately reflect the greater concentration of data close to the mean as compared to the
Chebyshev rule.
True or False: An investment consultant is recommending a certain class of mutual
funds to the clienteles based on its exceptionally high probability of gain. It is an
unethical practice not to also recommend a class of mutual funds with an exceptionally
high probability of loss.
True or False: The professor of a business statistics class wanted to find out the mean
amount of time per week her students spent studying for the class. She divided the
students into the left, right and center groups according to the location they sat in the
class that day. One of these 3 groups was randomly selected and everyone in the group
was asked the mean amount of time per week he/she spent studying for the class. This
is an example of a cluster sample.
True or False: Every spring semester, the School of Business coordinates a luncheon for
graduating seniors, their families, and friends with local business leaders . Corporate
sponsorship pays for the lunches of each of the seniors, but students have to purchase
tickets to cover the cost of lunches served to guests they bring with them. Data on the
number of guests each graduating senior invited to the luncheon and the number of
graduating seniors in each category were collected. A histogram can be used to present
this information.
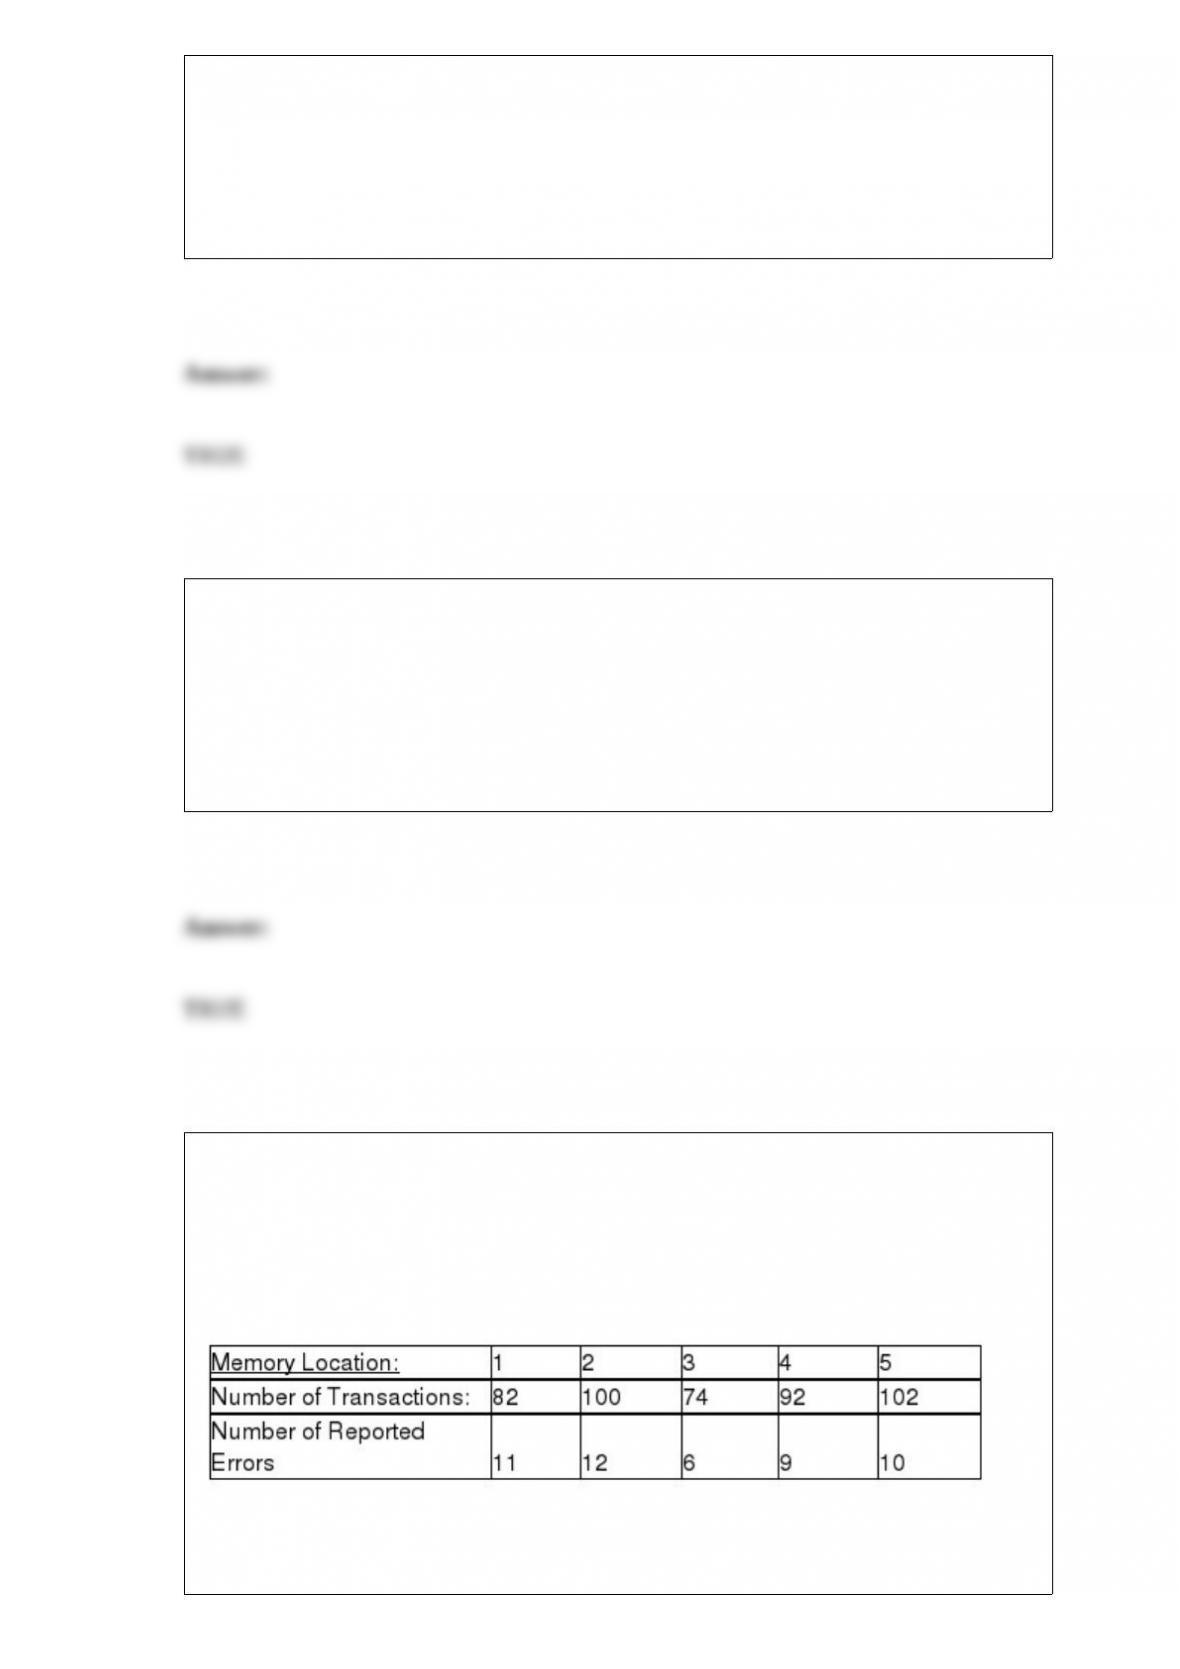
TABLE 12-4
A computer used by a 24-hour banking service is supposed to randomly assign each
transaction to one of 5 memory locations. A check at the end of a day’s transactions
gave the counts shown in the table to each of the 5 memory locations, along with the
number of reported errors.
The bank manager wanted to test whether the proportion of errors in transactions
assigned to each of the 5 memory locations differ.

Referring to Table 12-4, which test would be used to properly analyze the data in this
experiment?
A) X2 test of independence
B) X2 test for difference among more than two proportions
C) McNemar test for the difference between two proportions
D) McNemar test for the difference among more than two proportions
TABLE 2-2
At a meeting of information systems officers for regional offices of a national company,
a survey was taken to determine the number of employees the officers supervise in the
operation of their departments, where X is the number of employees overseen by each
information systems officer.
Referring to Table 2-2, how many regional offices are represented in the survey results?
A) 5
B) 11
C) 15
D) 40

A major Blu-ray rental chain is considering opening a new store in an area that
currently does not have any such stores. The chain will open if there is evidence that
more than 5,000 of the 20,000 households in the area are equipped with Blu-ray
players. It conducts a telephone poll of 300 randomly selected households in the area
and finds that 96 have Blu-ray players. Which of the following tests will be the most
appropriate?
A) t test for the mean
B) Z test for the proportion
C) Pooled-variance t test
D) Separate-variance t test
The minimum expected opportunity loss is also equal to
A) expected profit under certainty.
B) expected value of perfect information.
C) coefficient of variation.
D) expected value under certainty minus the expected monetary value of the worst
alternative.
TABLE 9-2
A student claims that he can correctly identify whether a person is a business major or
an agriculture major by the way the person dresses. Suppose in actuality that if someone
is a business major, he can correctly identify that person as a business major 87% of the
time. When a person is an agriculture major, the student will incorrectly identify that
person as a business major 16% of the time. Presented with one person and asked to

identify the major of this person (who is either a business or an agriculture major), he
considers this to be a hypothesis test with the null hypothesis being that the person is a
business major and the alternative that the person is an agriculture major.
Referring to Table 9-2, what would be a Type II error?
A) Saying that the person is a business major when in fact the person is a business
major.
B) Saying that the person is a business major when in fact the person is an agriculture
major.
C) Saying that the person is an agriculture major when in fact the person is a business
major.
D) Saying that the person is an agriculture major when in fact the person is an
agriculture major.
In multiple regression, the ________ procedure permits variables to enter and leave the
model at different stages of its development.
A) forward selection
B) residual analysis
C) backward elimination
D) stepwise regression
TABLE 11-1
An airline wants to select a computer software package for its reservation system. Four
software packages (1, 2, 3, and 4) are commercially available. The airline will choose
the package that bumps as few passengers as possible during a month. An experiment is
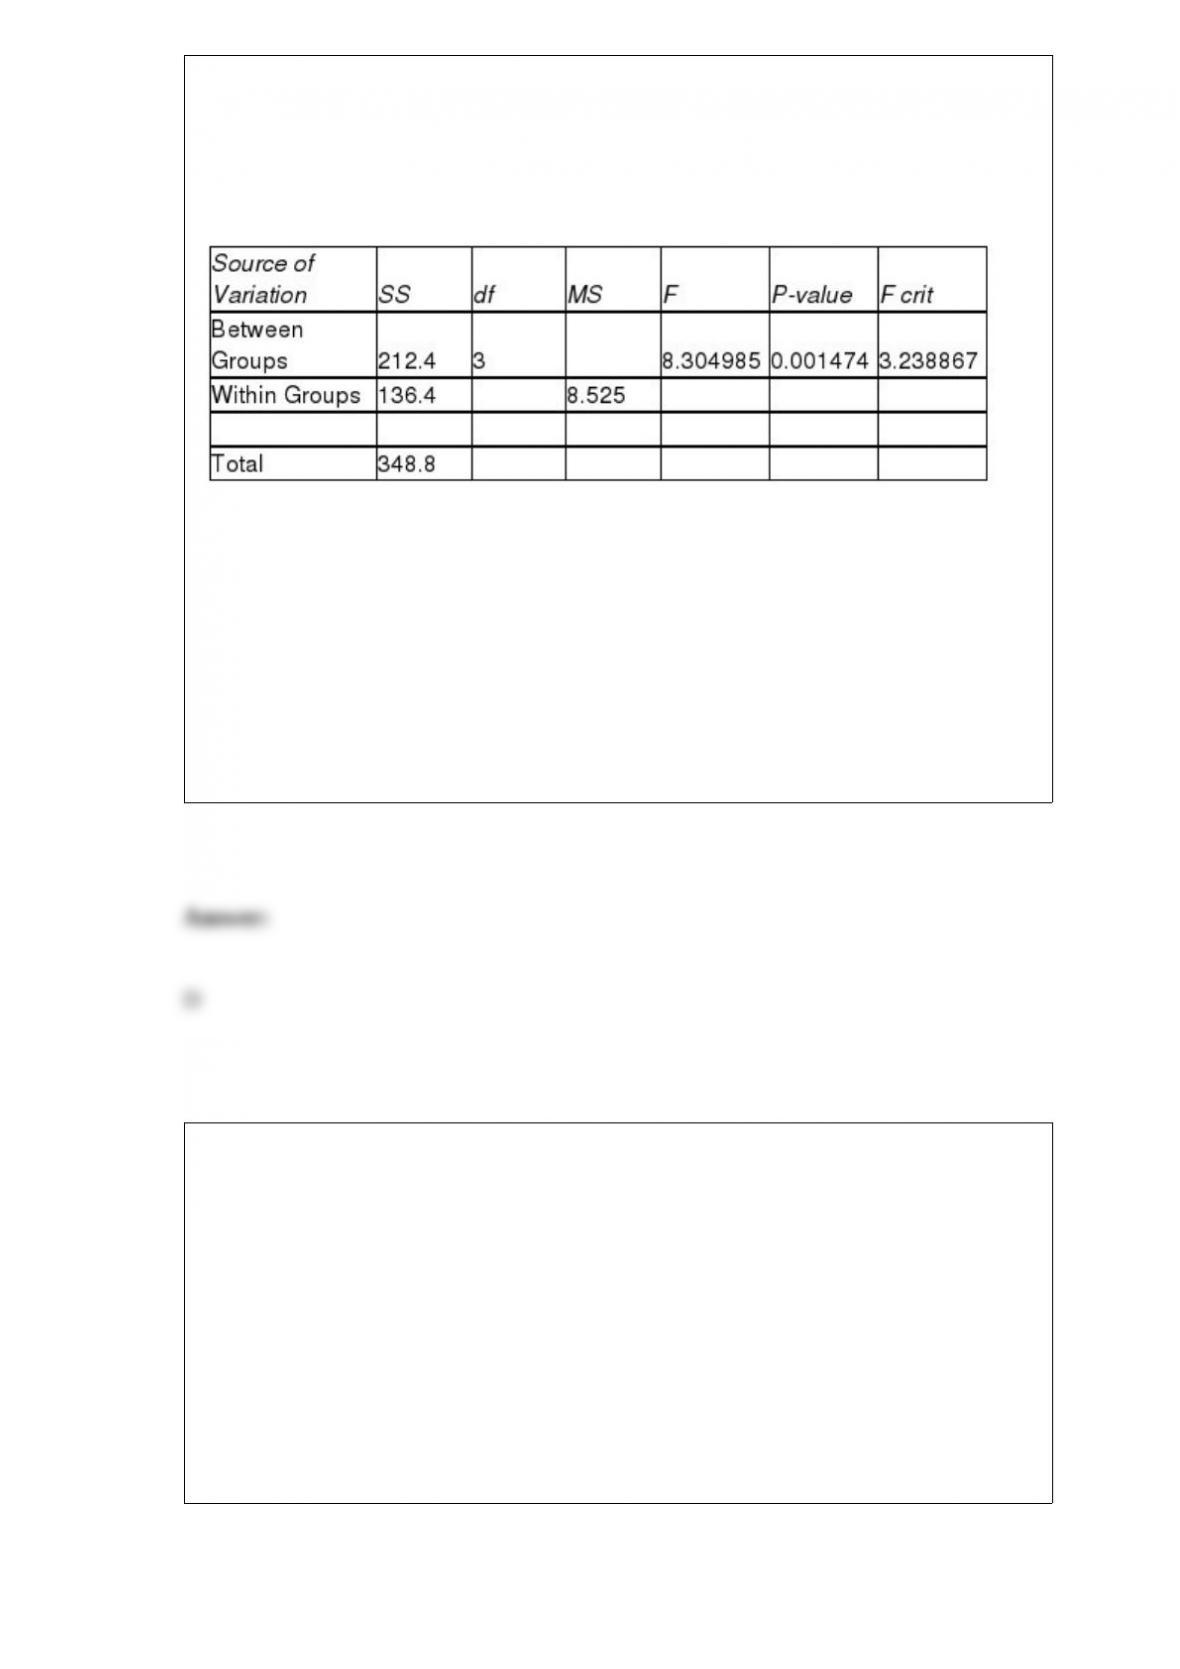
set up in which each package is used to make reservations for 5 randomly selected
weeks. (A total of 20 weeks was included in the experiment.) The number of passengers
bumped each week is obtained, which gives rise to the following Excel output:
ANOVA
Referring to Table 11-1, the total degrees of freedom is
A) 3.
B) 4.
C) 16.
D) 19.
The owner of a fish market has an assistant who has determined that the weights of
catfish are normally distributed, with a mean of 3.2 pounds and a standard deviation of
0.8 pound. If a sample of 25 fish yields a mean of 3.6 pounds, what is the Z-score for
this observation?
A) 18.750
B) 2.500
C) 1.875
D) 0.750

TABLE 4-4
Suppose that patrons of a restaurant were asked whether they preferred water or
whether they preferred soda. 70% said that they preferred water. 60% of the patrons
were male. 80% of the males preferred water.
Referring to Table 4-4, the probability that a randomly selected patron is a female who
prefers water is ________.
Suppose a 95% confidence interval for has been constructed. If it is decided to take a
larger sample and to decrease the confidence level of the interval, then the resulting
interval width would ________. (Assume that the sample statistics gathered would not
change very much for the new sample.)
A) be larger than the current interval width
B) be narrower than the current interval width
C) be the same as the current interval width
D) be unknown until actual sample sizes and reliability levels were determined
The curve for the ________ will show a rapid increase in utility for initial amounts of
money followed by a gradual leveling off for increasing dollar amounts.
A) risk taker
B) risk averter
C) risk neutral
D) profit seeker
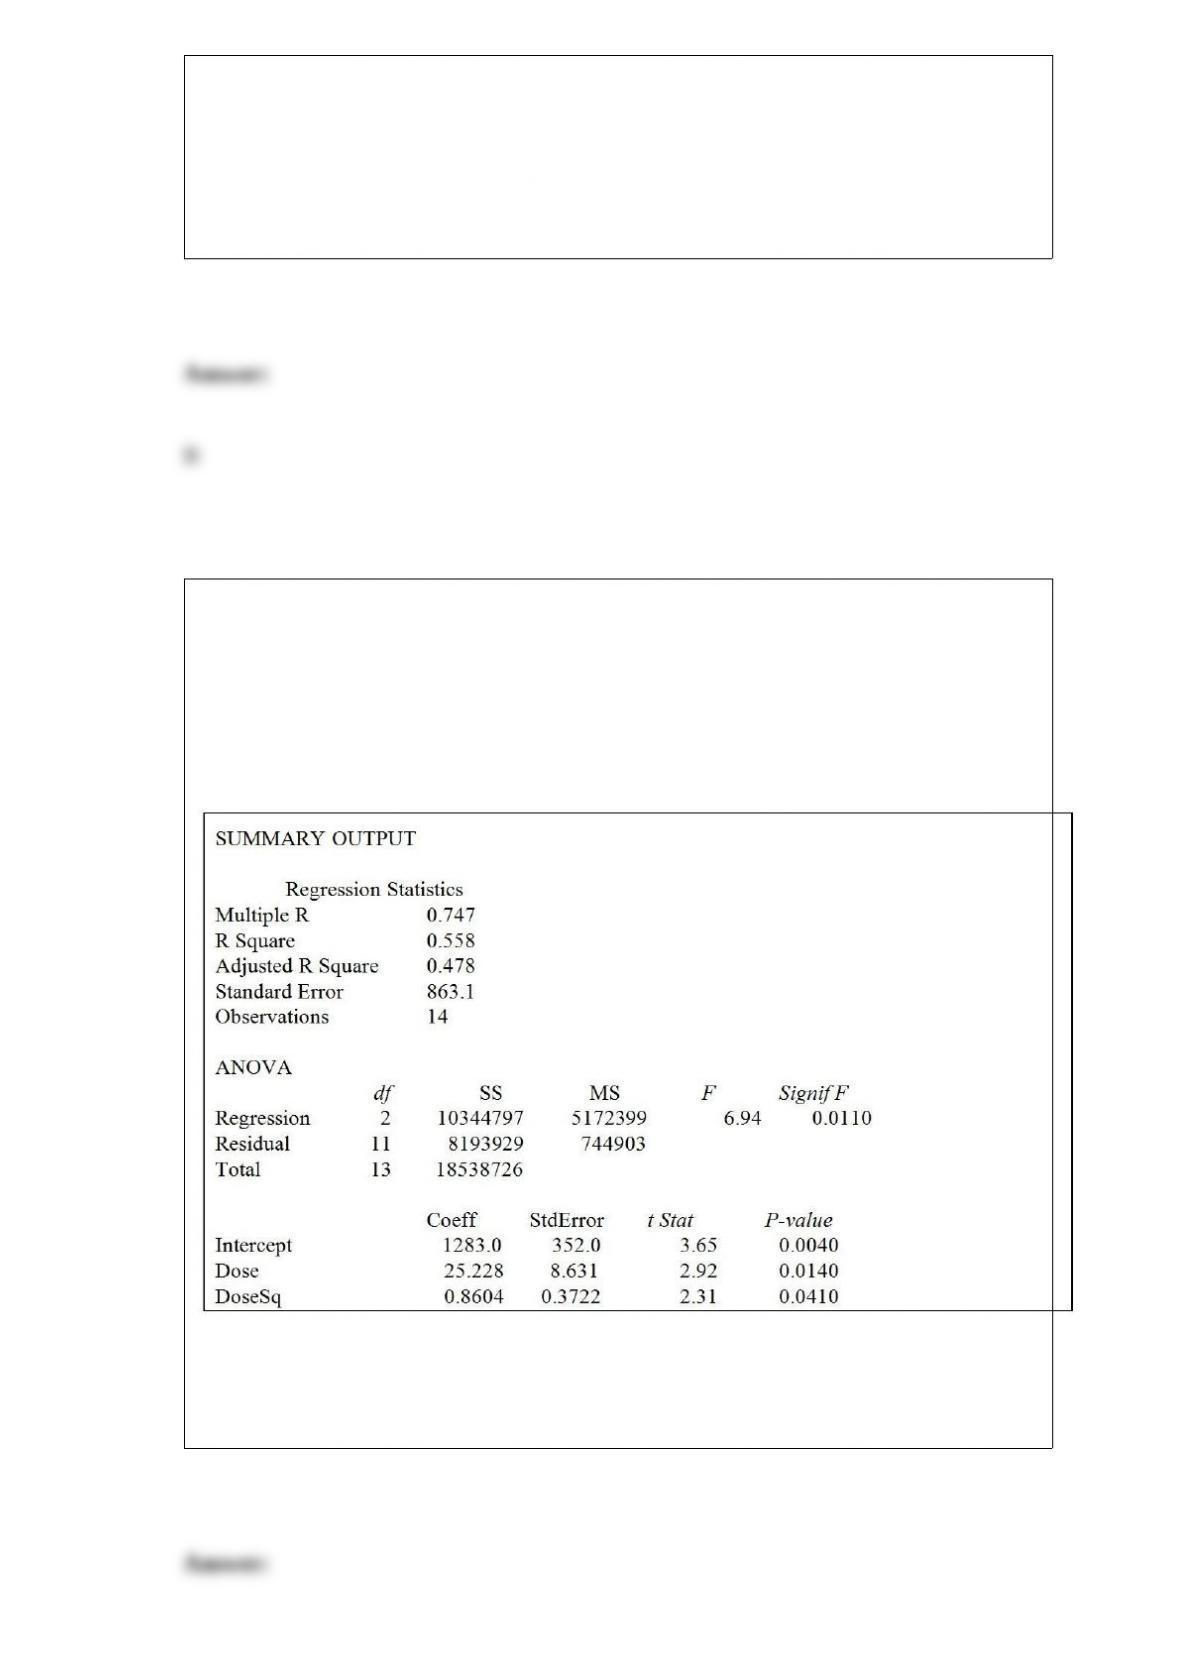
TABLE 15-3
A chemist employed by a pharmaceutical firm has developed a muscle relaxant. She
took a sample of 14 people suffering from extreme muscle constriction. She gave each a
vial containing a dose (X) of the drug and recorded the time to relief (Y) measured in
seconds for each. She fit a curvilinear model to this data. The results obtained by
Microsoft Excel follow
True or False: Referring to Table 15-3, suppose the chemist decides to use a t test to
determine if there is a significant difference between a linear model and a curvilinear
model that includes a linear term. If she used a level of significance of 0.01, she would
decide that the linear model is sufficient.
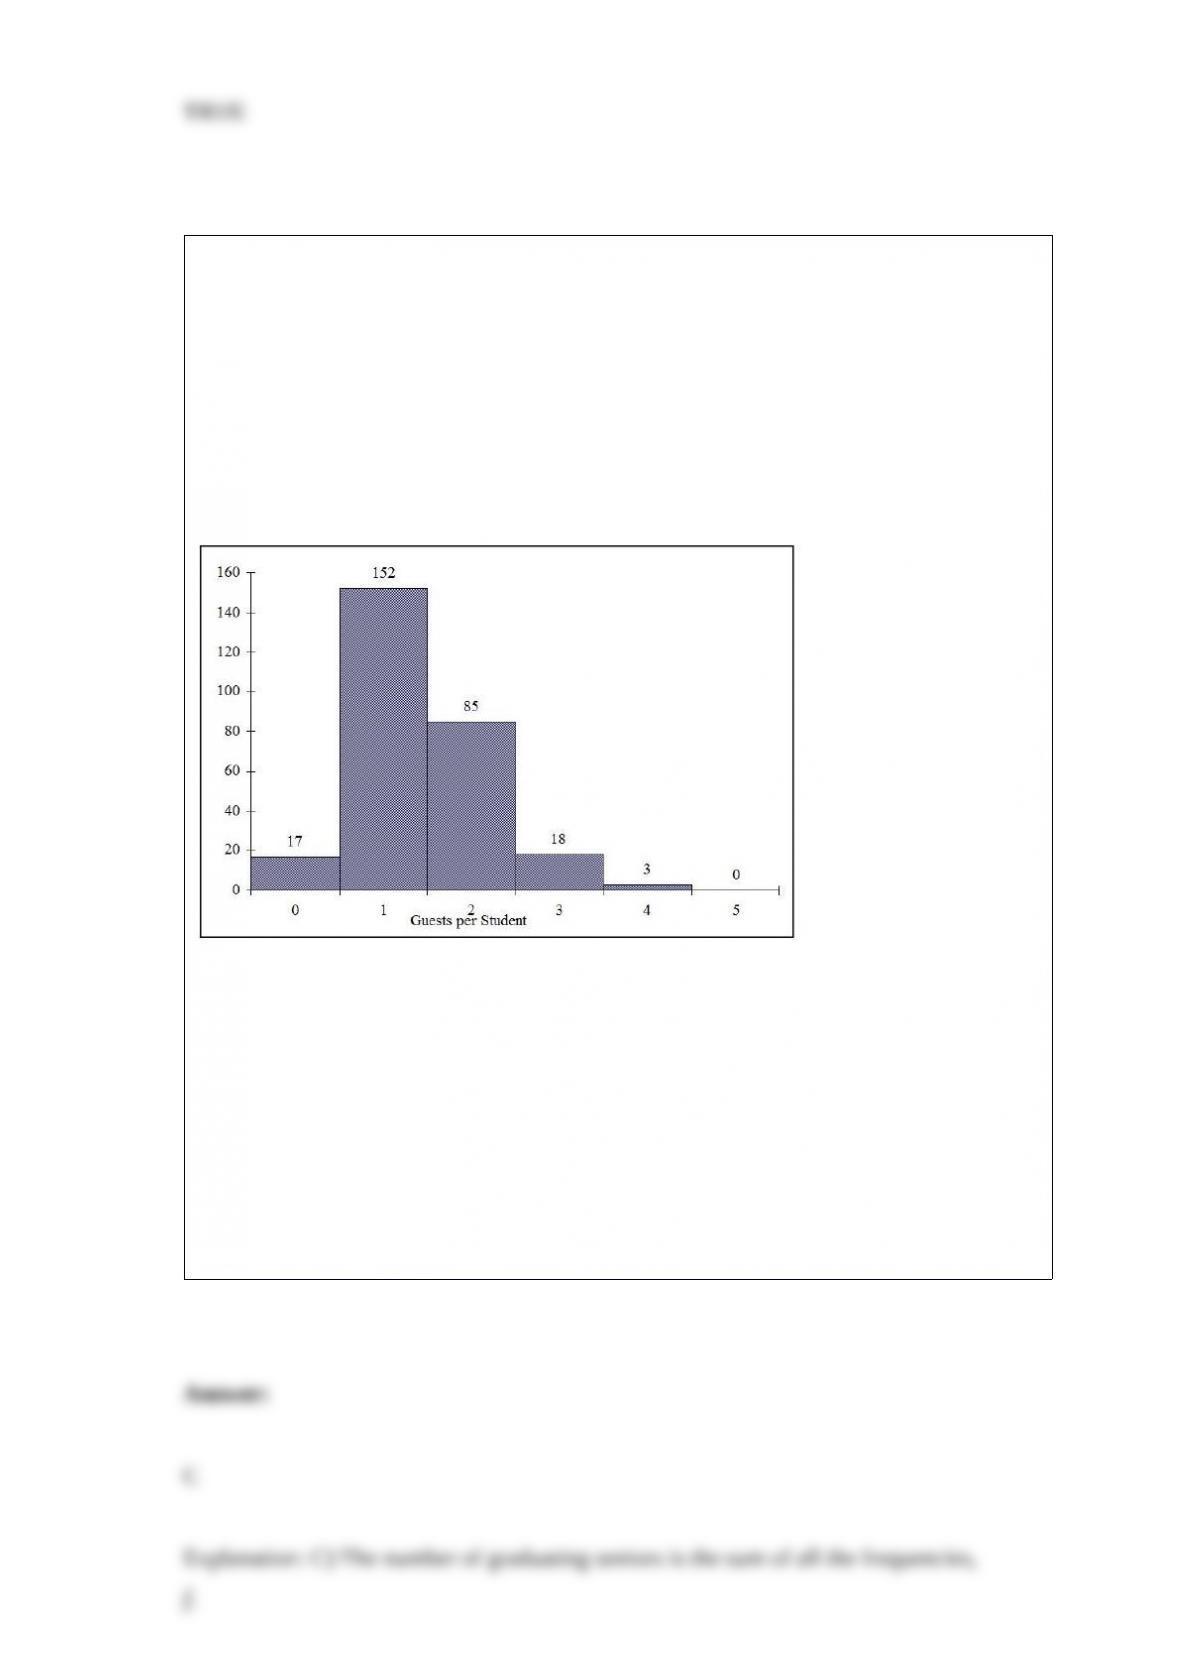
TABLE 2-3
Every spring semester, the School of Business coordinates a luncheon with local
business leaders for graduating seniors, their families, and friends. Corporate
sponsorship pays for the lunches of each of the seniors, but students have to purchase
tickets to cover the cost of lunches served to guests they bring with them. The following
histogram represents the attendance at the senior luncheon, where X is the number of
guests each graduating senior invited to the luncheon and f is the number of graduating
seniors in each category.
Referring to the histogram from Table 2-3, how many graduating seniors attended the
luncheon?
A) 4
B) 152
C) 275
D) 388
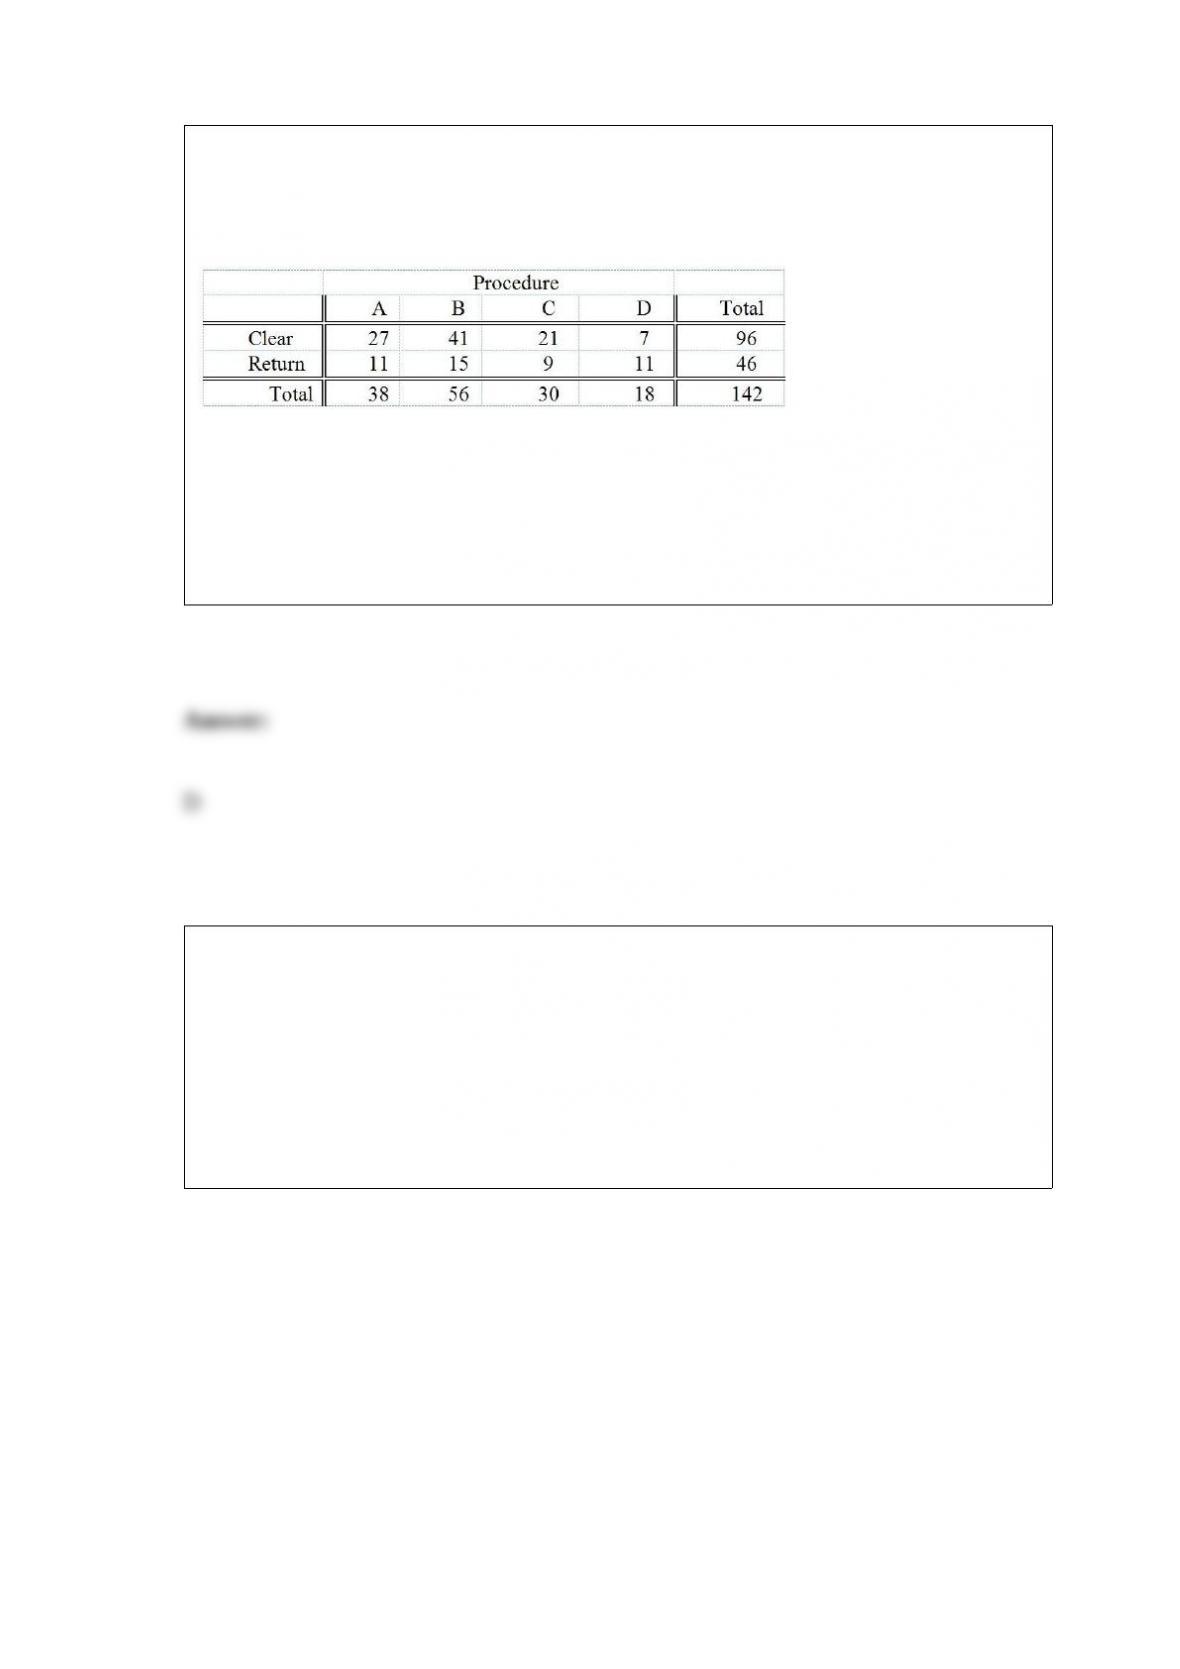
Four surgical procedures currently are used to install pacemakers. If the patient does not
need to return for follow-up surgery, the operation is called a “clear” operation. A heart
center wants to compare the 4 procedures, and collects the following numbers of
patients from their own records:
Which of the following tests will be the most appropriate to find out which of the 4
procedures is the most effective?
A) χ2 test for difference in proportions
B) Z test for difference in proportions
C) One-way ANOVA F test for differences among more than two means
D) The Marascuilo procedure
TABLE 13-13
In this era of tough economic conditions, voters increasingly ask the question: “Is the
educational achievement level of students dependent on the amount of money the state
in which they reside spends on education?” The partial computer output below is the
result of using spending per student ($) as the independent variable and composite score
which is the sum of the math, science and reading scores as the dependent variable on
35 states that participated in a study. The table includes only partial results.
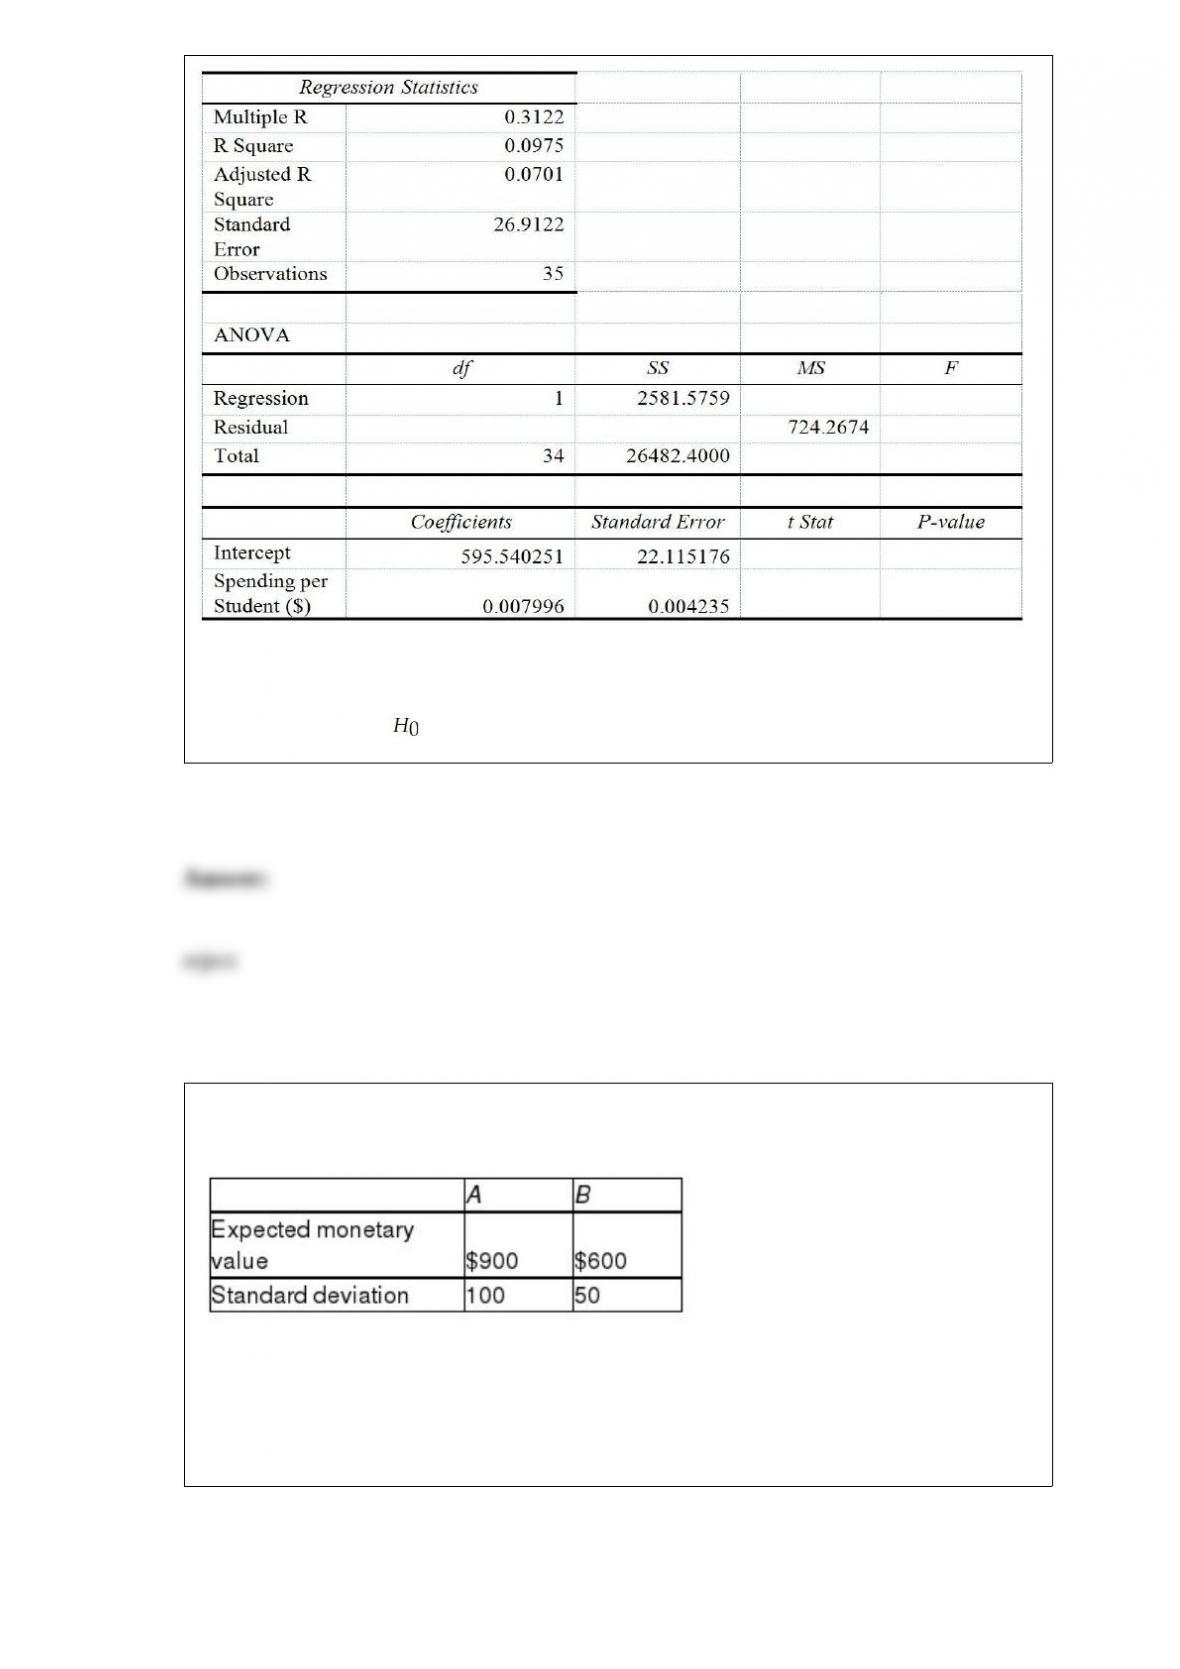
Referring to Table 13-13, the decision on the test of whether composite score depends
linearly on spending per student using a 10% level of significance is to ________
(reject or not reject) .
TABLE 19-3
The following information is from 2 investment opportunities.
Referring to Table 19-3, what is the coefficient of variation for investment A?
A) 90.0%
B) 11.1%
C) 8.3%
D) 5.0%
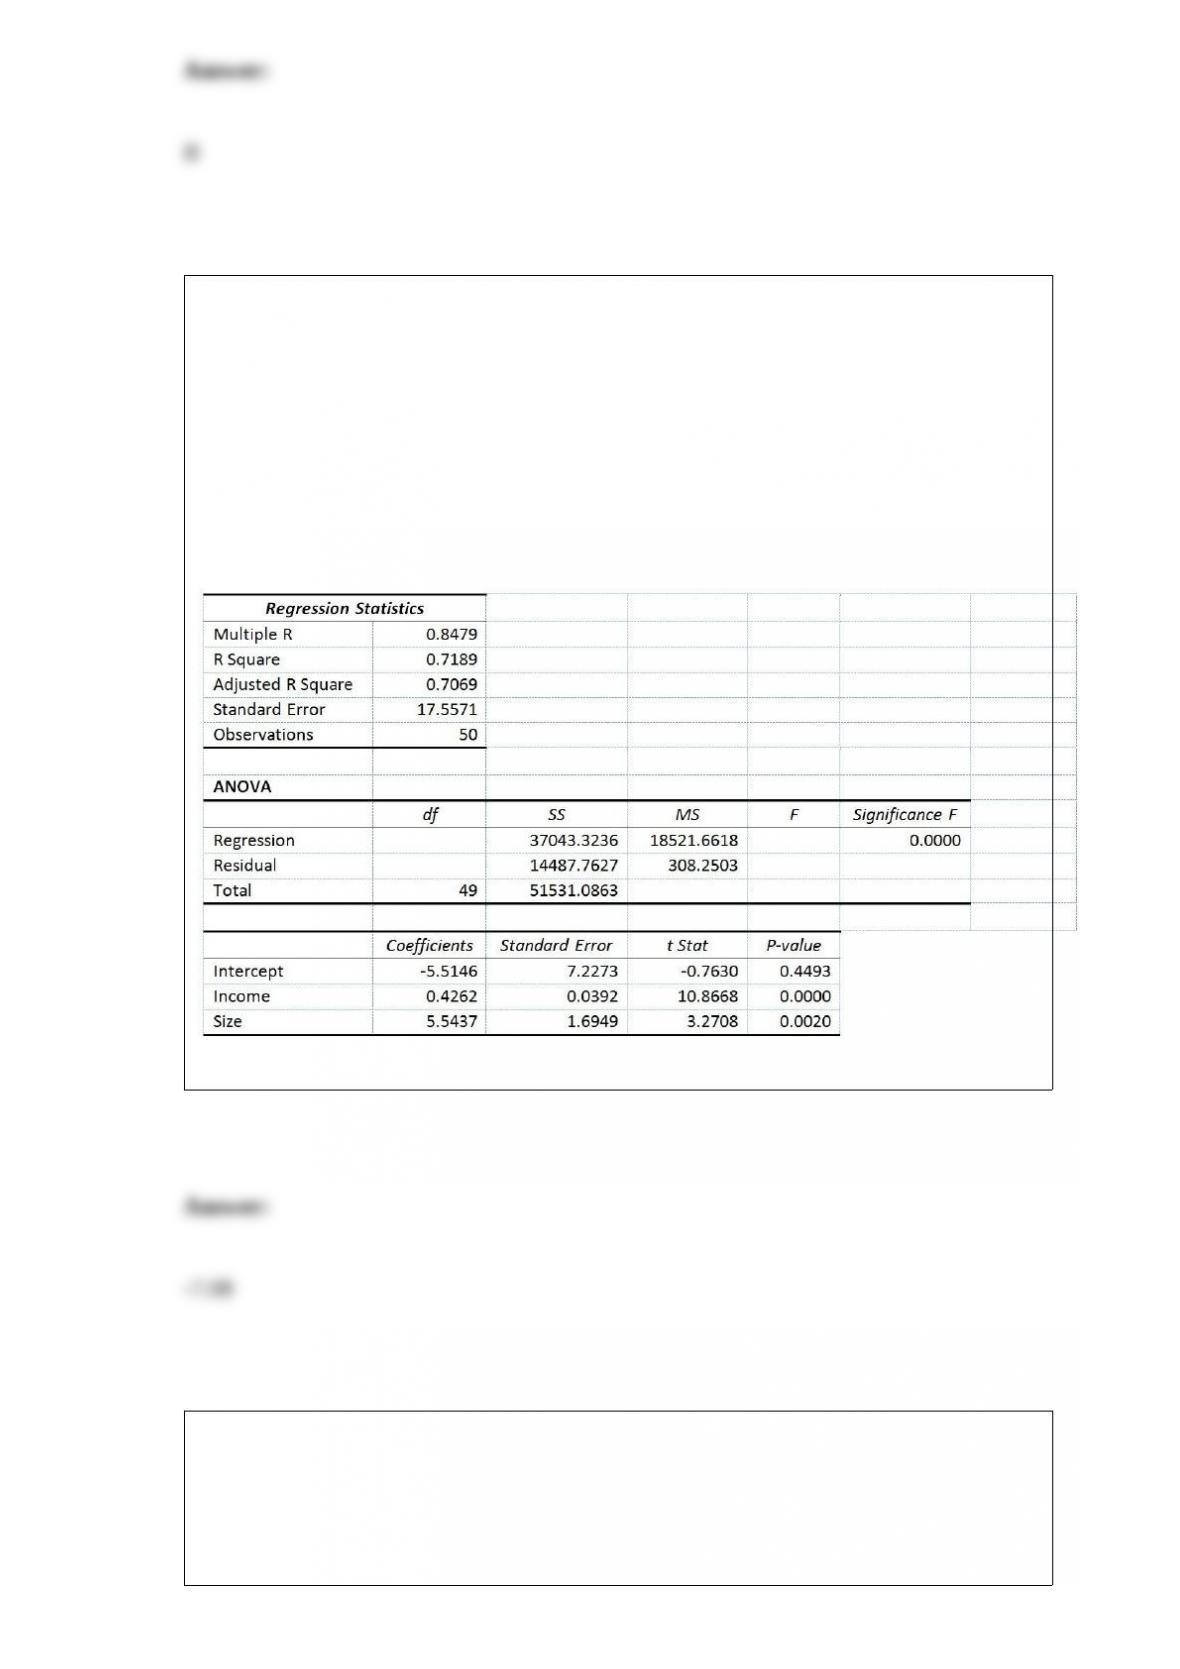
Referring to Table 14-4, one individual in the sample had an annual income of $40,000
and a family size of 1. This individual owned a home with an area of 1,000 square feet
(House = 10.00). What is the residual (in hundreds of square feet) for this data point?
TABLE 14-4
A real estate builder wishes to determine how house size (House) is influenced by
family income (Income) and family size (Size). House size is measured in hundreds of
square feet and income is measured in thousands of dollars. The builder randomly
selected 50 families and ran the multiple regression. Partial Microsoft Excel output is
provided below:
Also SSR (X1∣ X2) = 36400.6326 and SSR (X2∣ X1) = 3297.7917
You were told that the amount of time lapsed between consecutive trades on the New
York Stock Exchange followed a normal distribution with a mean of 15 seconds. You
were also told that the probability that the time lapsed between two consecutive trades
to fall between 16 to 17 seconds was 13%. The probability that the time lapsed between
two consecutive trades would fall below 13 seconds was 7%. What is the probability
that the time lapsed between two consecutive trades will be between 13 and 16
seconds?
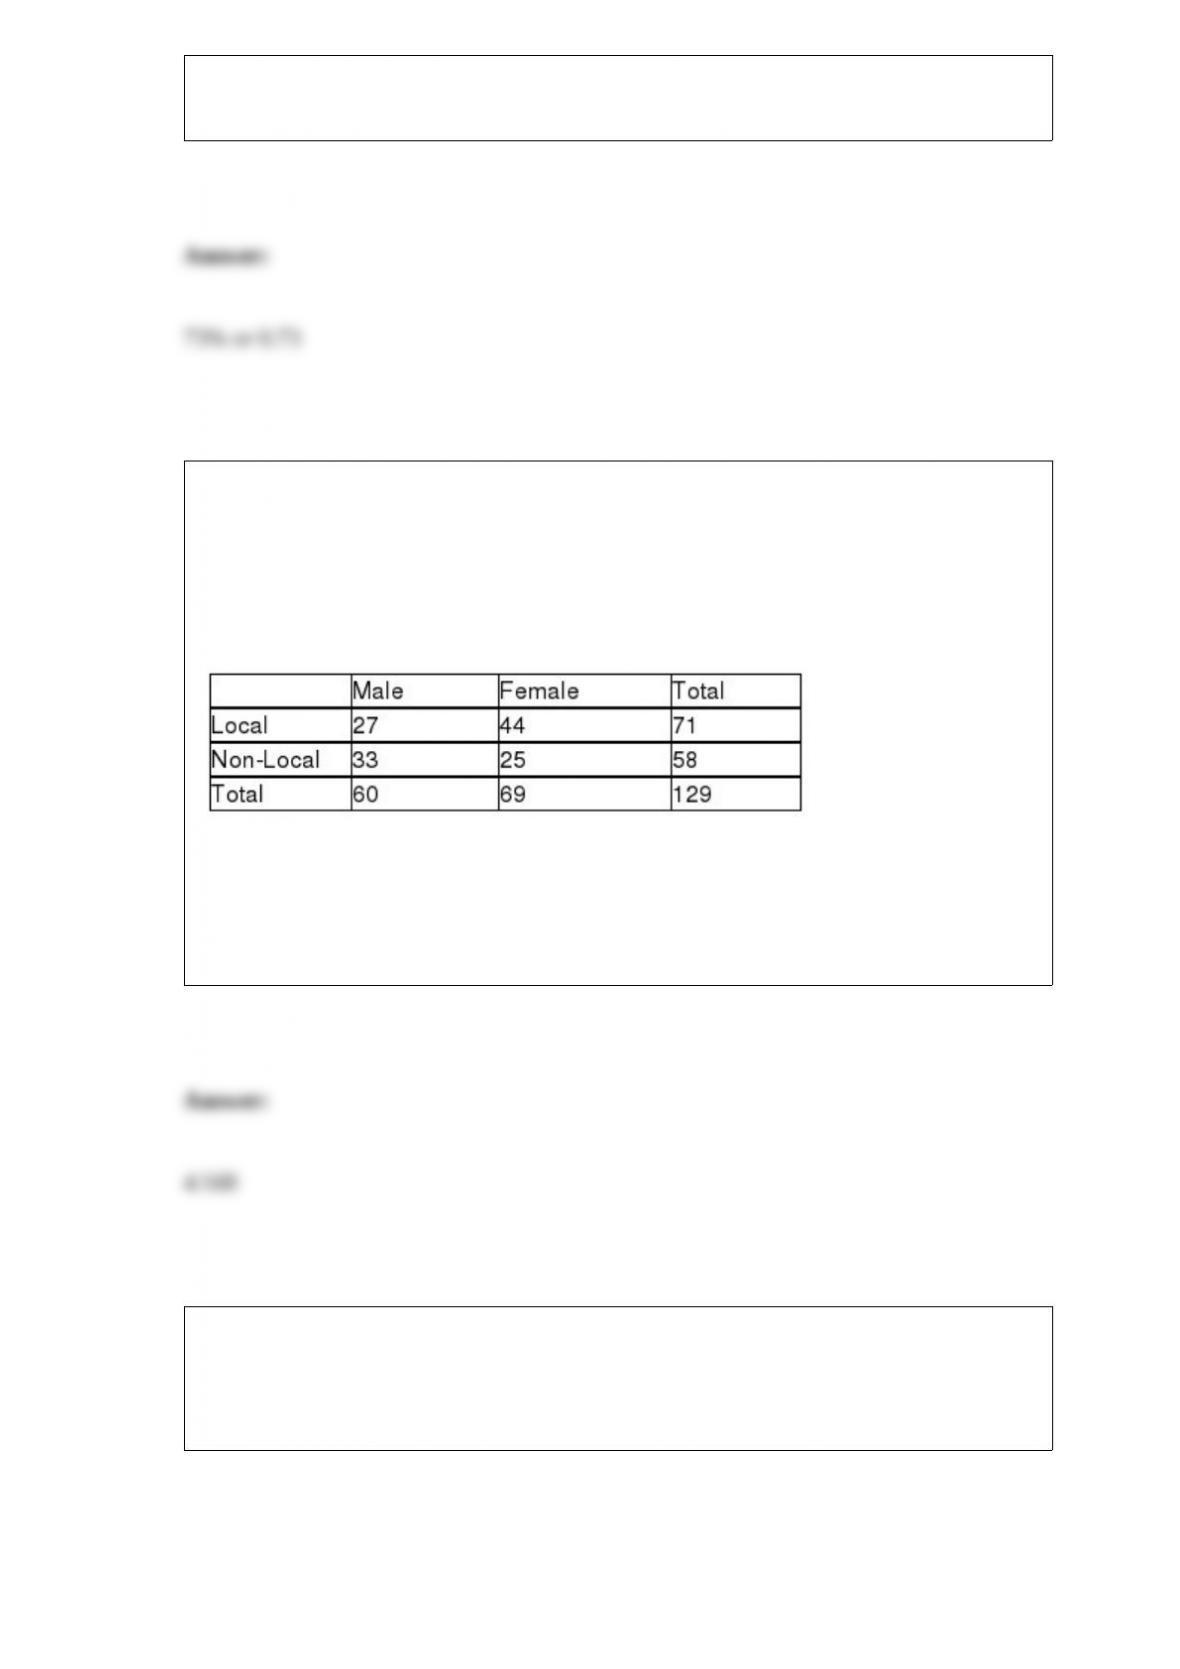
TABLE 12-3
The director of transportation of a large company is interested in the usage of her van
pool. She considers her routes to be divided into local and non-local. She is particularly
interested in learning if there is a difference in the proportion of males and females who
use the local routes. She takes a sample of a day’s riders and finds the following:
She will use this information to perform a chi-square hypothesis test using a level of
significance of 0.05.
Referring to Table 12-3, the value of the test statistic is ________.
TABLE 2-10
The histogram below represents scores achieved by 200 job applicants on a personality
profile.
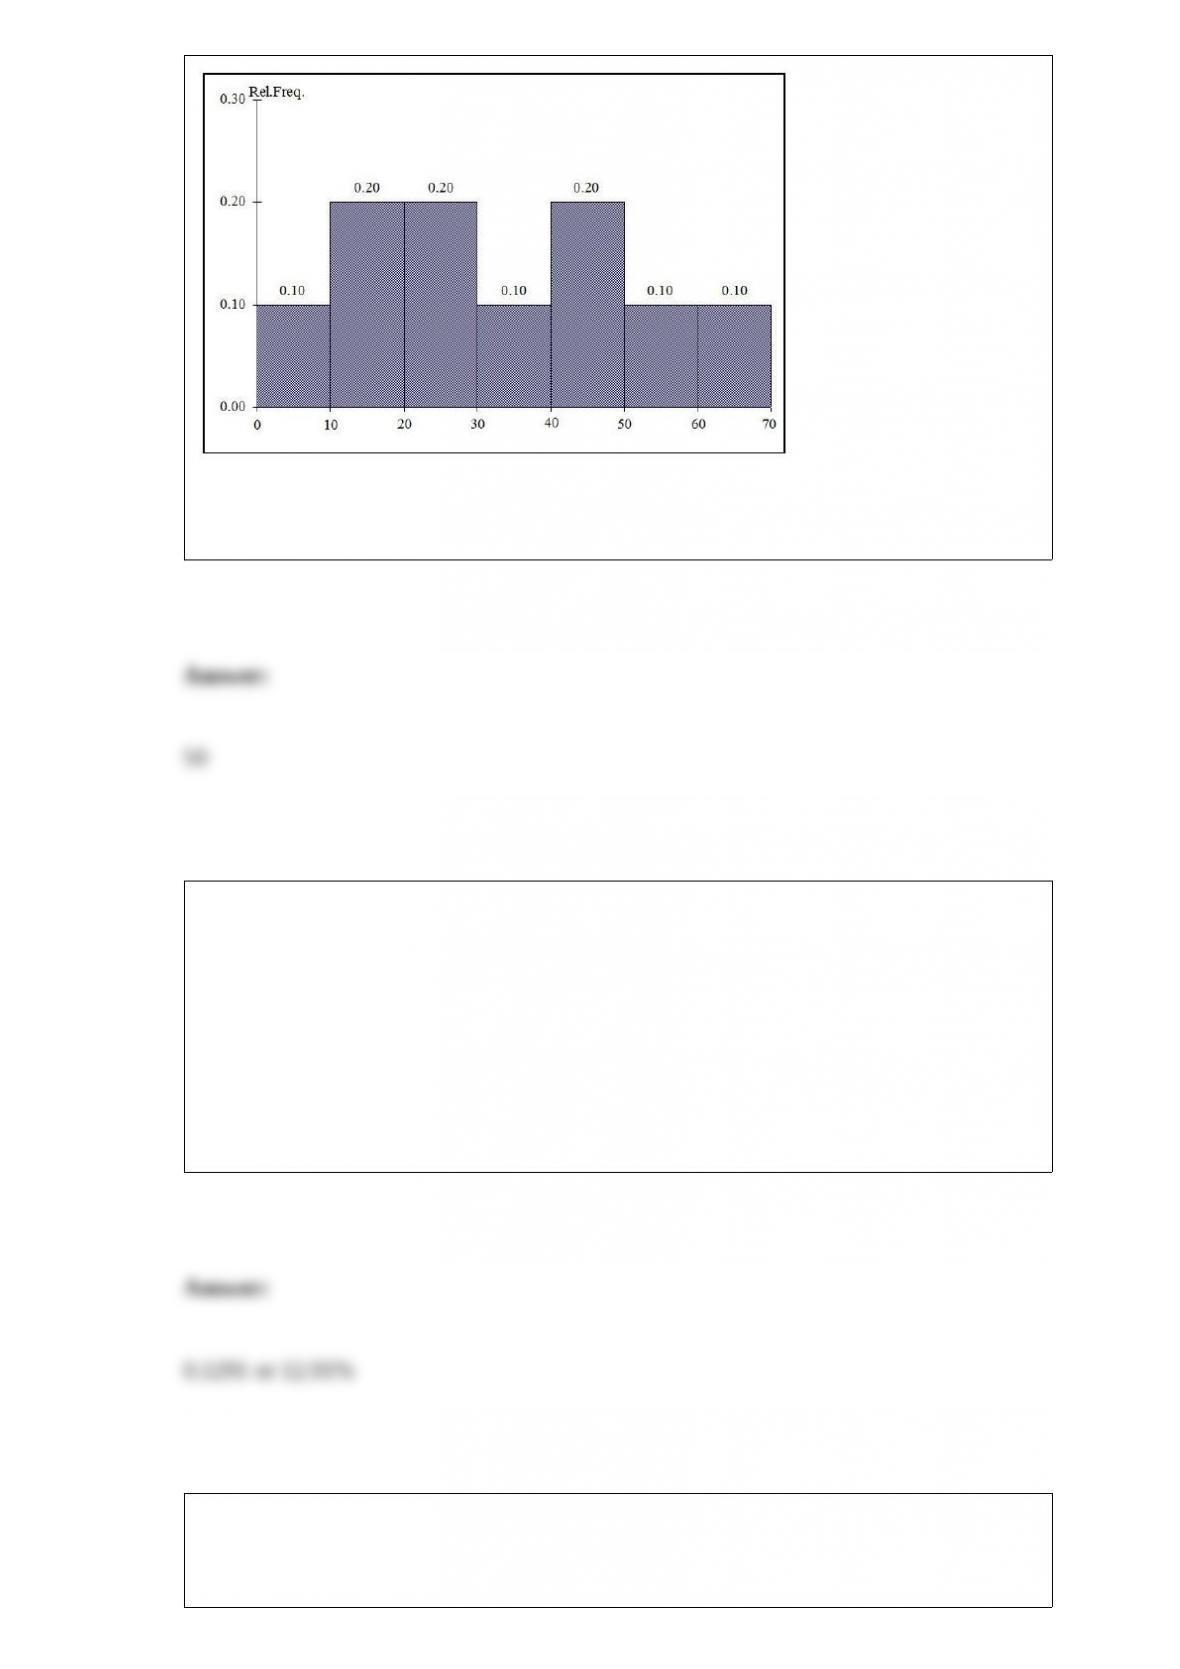
Referring to the histogram from Table 2-10, ________ percent of the applicants scored
between 20 and below 50.
TABLE 5-10
An accounting firm in a college town usually recruits employees from two of the
universities in town. This year, there are fifteen graduates from University A and five
from University B and the firm decides to hire six new employees from the two
universities.
Referring to Table 5-10, what is the probability that none of the new employees will be
from University B?
TABLE 16-5
The number of passengers arriving at San Francisco on the Amtrak cross-country
express on 6 successive Mondays were: 60, 72, 96, 84, 36, and 48.

Referring to Table 16-5, the number of arrivals will be smoothed with a 3-term moving
average. The first smoothed value will be ________.
In a game called Taxation and Evasion, a player rolls a pair of dice. If on any turn the
sum is 7, 11, or 12, the player gets audited. Otherwise, she avoids taxes. Suppose a
player takes 5 turns at rolling the dice. The probability that she gets audited no more
than 2 times is ________.
TABLE 9-11
An appliance manufacturer claims to have developed a compact microwave oven that
consumes a population mean of no more than 250 W. From previous studies, it is
believed that power consumption for microwave ovens is normally distributed with a
population standard deviation of 15 W. If there is evidence that the population mean
consumption is greater than 250 W, the manufacturer will be unable to make the claim.
Referring to Table 9-11, if you select a sample of 20 compact microwave ovens and are
willing to have a level of significance of 0.01, the probability of making a Type II error
is ________ if the mean power consumption of all such microwave ovens is in fact
257.3 W.