
Referring to Table 14-15, predict the percentage of students passing
the proficiency test for a school which has a mean teacher salary of
40,000 dollars, and an instructional spending per pupil of 2,000
dollars.
TABLE 14-15
The superintendent of a school district wanted to predict the
percentage of students passing a sixth-grade proficiency test. She
obtained the data on percentage of students passing the proficiency
test (% Passing), mean teacher salary in thousands of dollars
(Salaries), and instructional spending per pupil in thousands of dollars
(Spending) of 47 schools in the state.
Following is the multiple regression output with Y = % Passing as the
dependent variable, X1 = Salaries and X2 = Spending:
The interval between patients arriving at an outpatient clinic follows an exponential
distribution with a mean of 15 minutes. What is the probability that a randomly chosen
arrival interval will be more than 18 minutes?
Referring to Table 14-10, the residual mean squares (MSE) that are
missing in the ANOVA table should be ________.
TABLE 14-10
You worked as an intern at We Always Win Car Insurance Company
last summer. You notice that individual car insurance premiums
depend very much on the age of the individual and the number of
traffic tickets received by the individual. You performed a regression
analysis in EXCEL and obtained the following partial information:
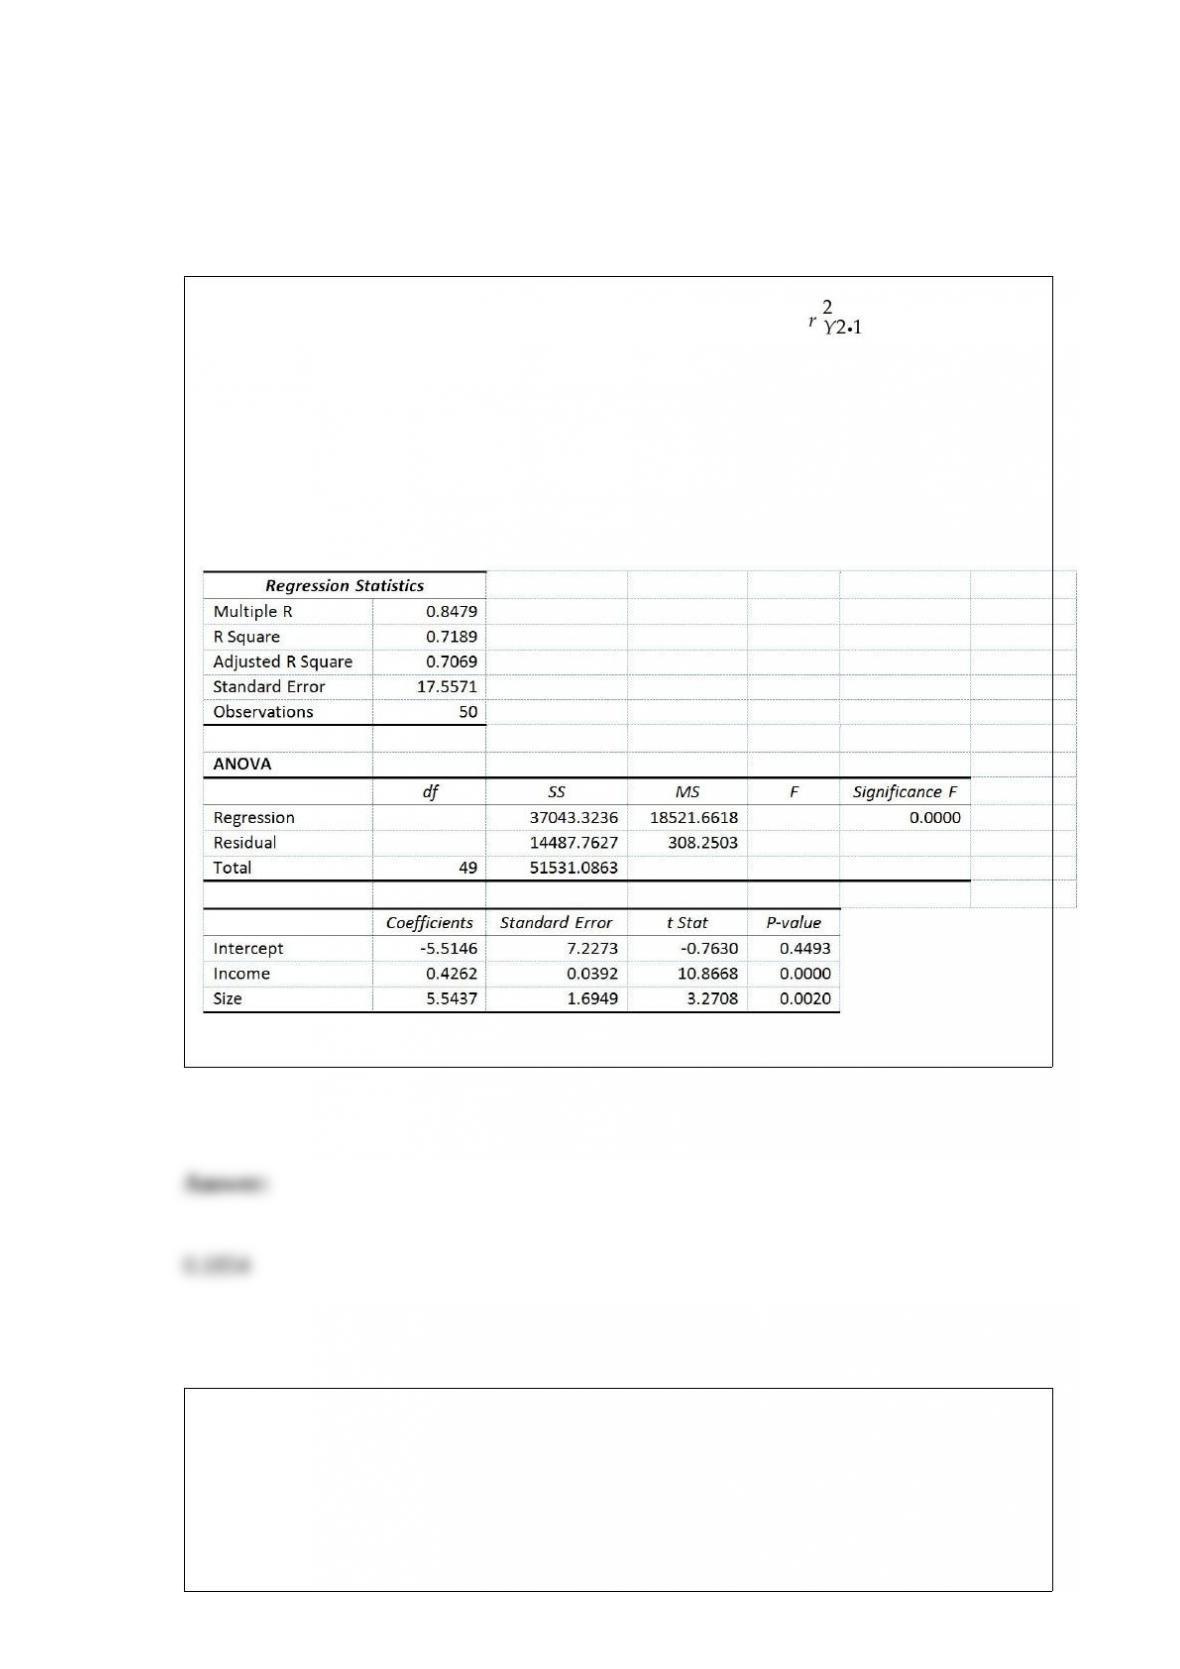
Referring to Table 14-4, the coefficient of partial determination is ________.
TABLE 14-4
A real estate builder wishes to determine how house size (House) is influenced by
family income (Income) and family size (Size). House size is measured in hundreds of
square feet and income is measured in thousands of dollars. The builder randomly
selected 50 families and ran the multiple regression. Partial Microsoft Excel output is
provided below:
Also SSR (X1∣ X2) = 36400.6326 and SSR (X2∣ X1) = 3297.7917
TABLE 3-3
The ordered array below represents the number of vitamin supplements sold by a health
food store in a sample of 16 days.
19, 19, 20, 20, 22, 23, 25, 26, 27, 30, 33, 34, 35, 36, 38, 41
Note: For this sample, the sum of the values is 448, and the sum of the squared
differences between each value and the mean is 812.
Referring to Table 3-3, the interquartile range of the number of vitamin supplements
sold in this sample is ________.
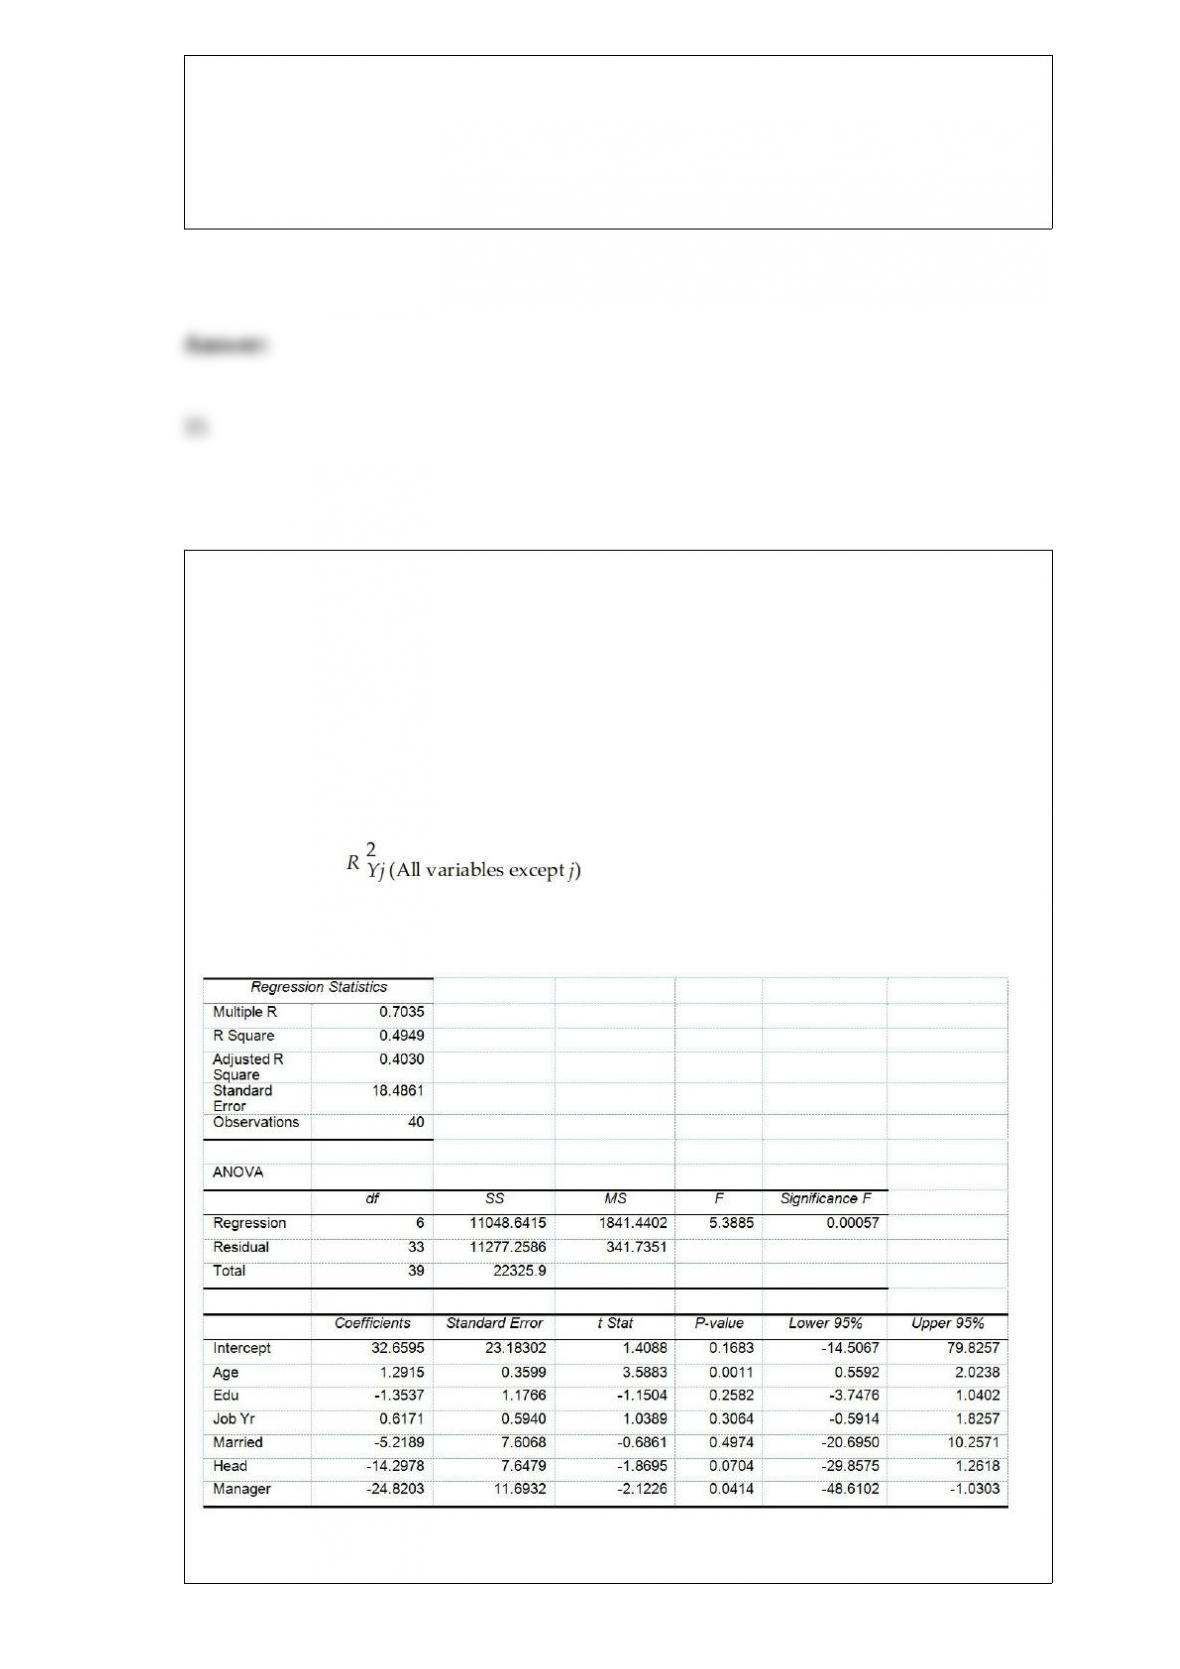
TABLE 17-10
Given below are results from the regression analysis where the dependent variable is
the number of weeks a worker is unemployed due to a layoff (Unemploy) and the
independent variables are the age of the worker (Age), the number of years of education
received (Edu), the number of years at the previous job (Job Yr), a dummy variable for
marital status (Married: 1 = married, 0 = otherwise), a dummy variable for head of
household (Head: 1 = yes, 0 = no) and a dummy variable for management position
(Manager: 1 = yes, 0 = no). We shall call this Model 1. The coefficient of partial
determination ( ) of each of the 6 predictors are, respectively,
0.2807, 0.0386, 0.0317, 0.0141, 0.0958, and 0.1201.
Model 2 is the regression analysis where the dependent variable is Unemploy and the
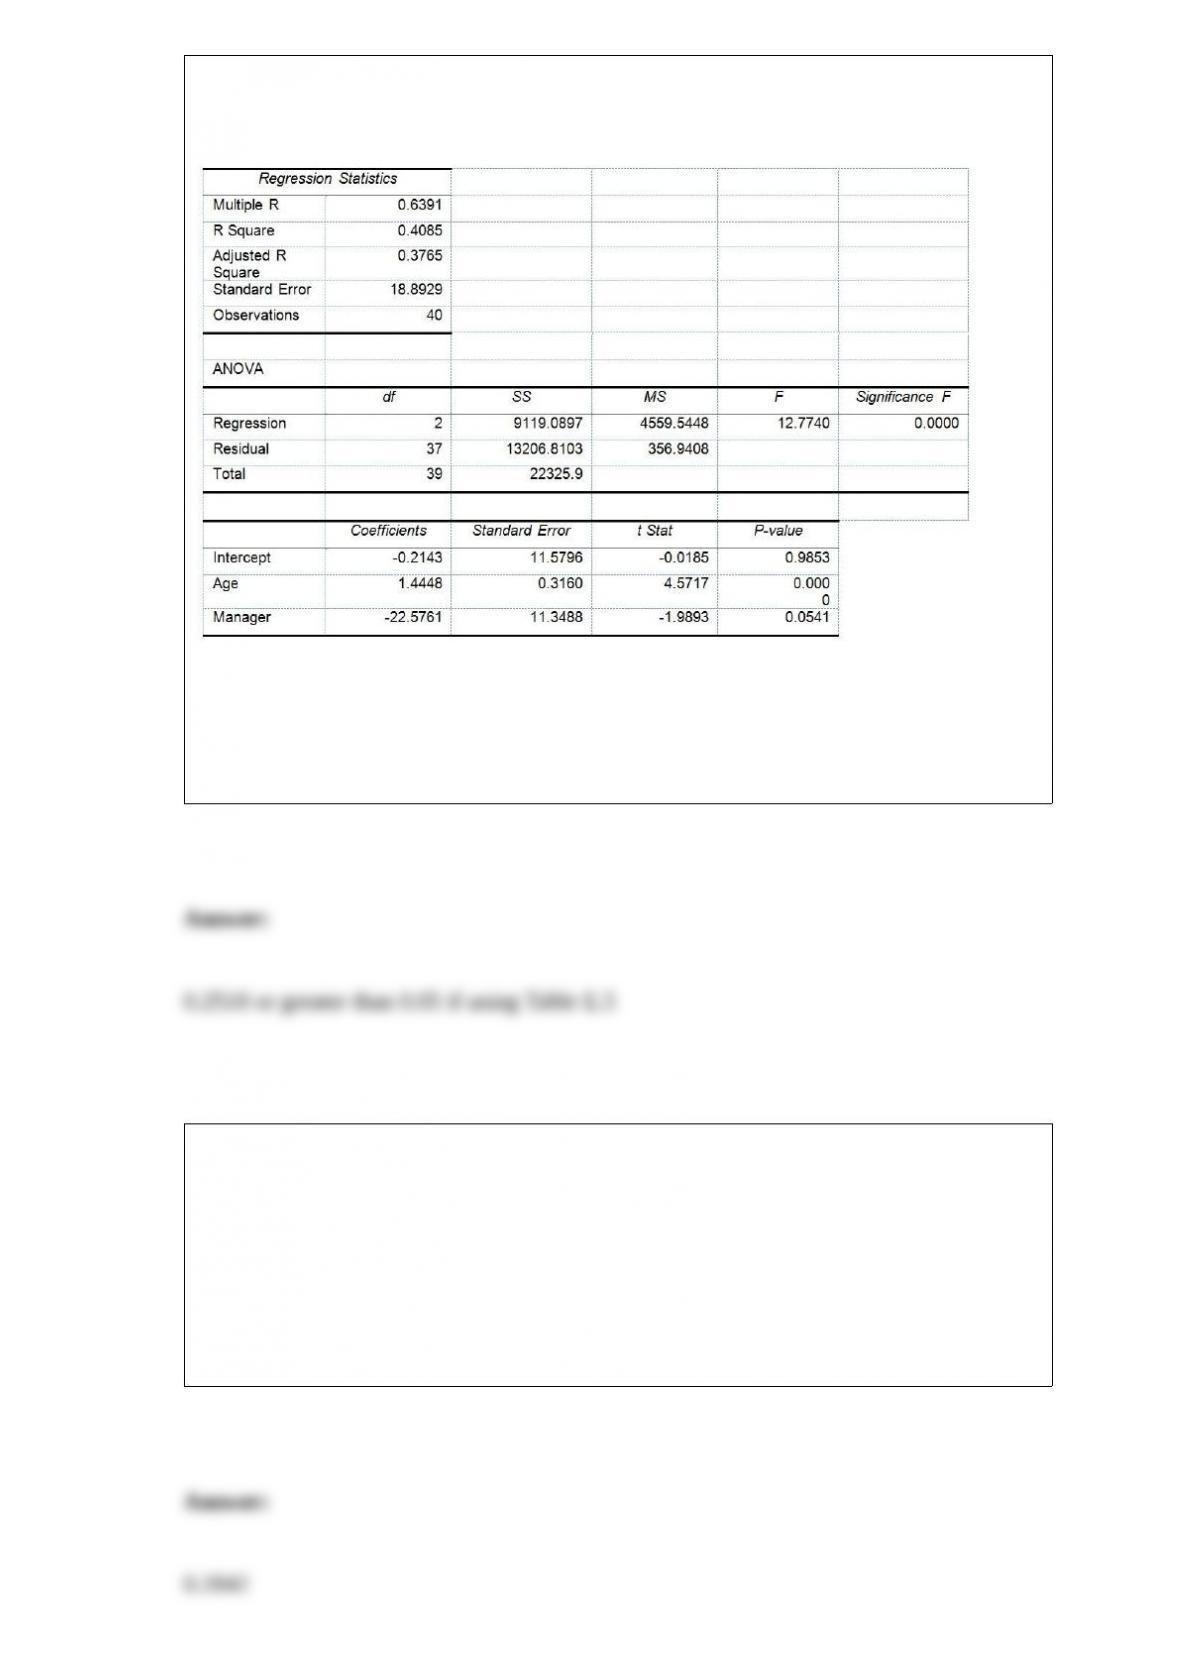
independent variables are Age and Manager. The results of the regression analysis are
given below:
Referring to Table 17-10 and using both Model 1 and Model 2, what is the p-value of
the test statistic for testing whether the independent variables that are not significant
individually are also not significant as a group in explaining the variation in the
dependent variable at a 5% level of significance?
TABLE 5-9
A major hotel chain keeps a record of the number of mishandled bags per 1,000
customers. In a recent year, the hotel chain had 4.06 mishandled bags per 1,000
customers. Assume that the number of mishandled bags has a Poisson distribution.
Referring to Table 5-9, what is the probability that in the next 1,000 customers, the
hotel chain will have no more than two or at least eight mishandled bags?
TABLE 8-9
A university wanted to find out the percentage of students who felt comfortable
reporting cheating by their fellow students. A survey of 2,800 students was conducted
and the students were asked if they felt comfortable reporting cheating by their fellow
students. The results were 1,344 answered “Yes” and 1,456 answered “No.”
Referring to Table 8-9, the critical value for a 99% confidence interval for this sample is
________.